Article

Transcriptomic Analysis Provides Novel Insights into the Heat Stress-Induced Response in Codonopsis tangshen

1
Key Laboratory of Biology and Cultivation of Herb Medicine, Ministry of Agriculture and Rural Affairs, Institute of Chinese Herbal Medicines, Hubei Academy of Agricultural Sciences, Enshi 445000, China
2
CAS Key Laboratory of Plant Germplasm Enhancement and Specialty Agriculture, Wuhan Botanical Garden, The Innovative Academy of Seed Design, Chinese Academy of Sciences, Wuhan 430074, China
*
Author to whom correspondence should be addressed.
These authors contributed equally to this work.
Life 2023, 13(1), 168; https://doi.org/10.3390/life13010168
Submission received: 14 November 2022 / Revised: 28 December 2022 / Accepted: 2 January 2023 / Published: 6 January 2023
(This article belongs to the Section Diversity and Ecology)

Abstract

:
Codonopsis tangshen Oliv (C. tangshen) is a valuable traditional Chinese medicinal herb with tremendous health benefits. However, the growth and development of C. tangshen are seriously affected by high temperatures. Therefore, understanding the molecular responses of C. tangshen to high-temperature stress is imperative to improve its thermotolerance. Here, RNA-Seq analysis was performed to investigate the genome-wide transcriptional changes in C. tangshen in response to short-term heat stress. Heat stress significantly damages membrane stability and chlorophyll biosynthesis in C. tangshen, as evidenced by pronounced malonaldehyde (MDA), electrolyte leakage (EL), and reduced chlorophyll content. Transcriptome analysis showed that 2691 differentially expressed genes (DEGs) were identified, including 1809 upregulated and 882 downregulated. Functional annotations revealed that the DEGs were mainly related to heat shock proteins (HSPs), ROS-scavenging enzymes, calcium-dependent protein kinases (CDPK), HSP-HSP network, hormone signaling transduction pathway, and transcription factors such as bHLHs, bZIPs, MYBs, WRKYs, and NACs. These heat-responsive candidate genes and TFs could significantly regulate heat stress tolerance in C. tangshen. Overall, this study could provide new insights for understanding the underlying molecular mechanisms of thermotolerance in C. tangshen.

1. Introduction

Codonopsis tangshen Oliv is a perennial herbaceous plant belonging to the family Campanulaceae. C. tangshen is widely used in traditional Chinese medicine due to its tremendous health benefits. Traditional medicine prepared from the dried roots of C. tangshen is commonly used to strengthen the spleen and lungs, nourish the blood, and maintain body fluids [1]. The main medicinal constituents of C. tangshen include polysaccharides, saponins, alkaloids, sesquiterpenes, glycosides, polyphenolic polyacetylenes, etc. [2,3].
Modern pharmacology and clinical studies also demonstrated that the main bioactive components of C. tangshen have antioxidant, antibiosis, anti-inflammatory, antitumor, and immune enhancement effects [4,5,6,7,8,9]. C. tangshen is mainly cultivated in Chongqing, Hubei, Sichuan, Hunan, Guizhou, and Shanxi provinces [10]. C. tangshen grows best in high-altitude areas with mild and cool climates [11]. However, a temperature above 30 °C could inhibit the growth and development of C. tangshen, thus reducing yield and quality [12], indicating that extremely high temperature is a severe problem for the cultivation of C. tangshen.
It is well documented that short-term or long-term heat stress exposure could significantly decline growth, development, and yield in many plant species. For instance, a 1 °C rise could reduce crop yields by 17% during the growing season [13]. Continuous heat stress could delay panicle emergence and reduce plant height, seed setting rate, seed size, and harvest index in sorghum [14]. In wheat, heat stress reduces grain yield by affecting various physiological, molecular, and biological processes [15].
Additionally, Ma et al. (2020) [16] demonstrated that exposure of Pinellia ternata to heat stress reduced cell membrane stability, antioxidant capacity, and chlorophyll content, thereby declining plant productivity. Heat stress inhibited the photosynthetic apparatus of Solanum lycopersicum L. and decreased photosynthetic efficiency [17]. A recent study also indicated that high temperature decreased trace elements, protein, soluble sugar, and anti-oxidation ability in cauliflower (Brassica oleracea var. botrytis L.) [18].
The effect of heat stress is mainly related to the over-accumulation of heat stress-induced reactive oxygen species (ROS), which further leads to oxidative stress. Accumulating evidence reveals that oxidative stress could damage membrane stability and integrity, thus, leading to electrolyte leakage and membrane lipid peroxidation. Meanwhile, plants also activate enzymatic antioxidant defense machinery, including glutathione S-transferase (GST), pheophorbide a oxygenase (PAO), superoxide dismutase (SOD), catalase (CAT), and peroxidase (POD) to scavenge the over-accumulated ROSs [19,20]. Plant hormone signaling transduction could also play a remarkable role in heat stress response. Several ABA metabolism and auxin-associated genes have been identified in A. thaliana and rice exposed to heat stress, respectively [21,22].
In recent decades, outstanding progress has been made in understanding plants’ response to heat stress. To this end, the regulatory mechanisms involved in acquiring thermotolerance and long-term adaptation to heat stress have been elucidated [23,24]. At the molecular level, the heat stress response is mainly associated with the activation of HSF (heat shock transcription factor) and HSP (heat shock protein) networks that further regulate heat shock proteins (HSPs), including HSP20s, HSP70s, HSP90s, and HSP100s [25]. These heat-induced proteins provide various functions, including protecting proteins from heat stress-induced degradation and assisting in maintaining their native structures [26]. Additionally, hormone-metabolism mechanisms are crucial in response to heat stress [27,28].
Despite several studies on understanding the mechanisms of heat tolerance in a wide range of plant species, how heat stress affects and reprograms the physiological processes of C. tangshen, especially at the transcriptome level, remains largely unknown. RNA-seq is a high-throughput sequencing technology that can also be used to study plants without a reference genome [29,30]. In this study, RNA-seq was performed to investigate how C. tangshen responded to short-term heat stress at the transcriptome level. In uncovering the mechanisms of heat stress response in C. tangshen, key DEGs and metabolic pathways significantly regulated by heat stress were identified. This study lays a foundation for elucidating the underlying molecular mechanisms of heat stress response and provides a basis for improving the thermotolerance of C. tangshen.

2. Materials and Methods

2.1. Plant Materials and Sample Collection

The fresh roots of C. tangshen were planted in plastic pots (50 cm length, 21 cm width, and 15 cm depth) filled with appropriate nutrient soil. The pots were kept in an incubator with light/dark of 14/10 h, a temperature of 22/18 °C, photosynthetic photon flux density of 360 mmol m−2 s−1, and watered every two days with half-strength Hoagland solution. After 40 days of growth, the pots were divided into two groups (3 pots for each group) and placed into different growth incubators with the same condition except for temperature. The control group was kept at 22/18 °C (day/night) (CK), while the heat stress group (HT) was exposed to high-temperature treatment at 42 °C. After 0.5 h of treatment, young leaf samples were collected with three replicates for each group and are used for transcriptome sequencing. Short-term (0.5 h) heat stress had no significant effect on the morphological and physiological traits of C. tangshen. Thus, heat stress was extended to 7 d, where the plants were exposed to high-temperature treatment at 38/35 ℃ (day/night). Plants were photographed for phenotypic analysis and leaf samples were collected from control and heat-treated plants for physiological and biochemical analysis. All the treatments were repeated in three biological replications.

2.2. RNA Extraction and cDNA Library Preparation

Total RNA was extracted from the leaf samples using TRIzol reagent (Invitrogen, Carlsbad, CA, USA). The quality and quantity of RNA samples were monitored using the Nano Photometer spectrophotometer (IMPLEN, Westlake Village, CA, USA) to ensure high-quality samples for transcriptome sequencing. About 1 μg RNA per sample was used to construct the paired-end libraries using NEBNext® Ultra™ RNA Library Prep Kit for Illumina® (NEB, Ipswich, MA, USA) according to the manufacturer’s instructions. First-strand cDNA was generated using random hexamer primer and M-MuLV Reverse Transcriptase, followed by synthesizing second-strand cDNA using DNA Polymerase I and RNase H. Then, fragmentation was performed using divalent cations under increased temperature. After adenylation of 3’ ends of DNA fragments, adaptor sequences with hairpin loop structure were ligated to the fragments. Subsequently, the fragments about 240 bp in length were purified using the AMPure XP system (Beckman Coulter, Beverly, USA). Then, PCR was carried out using Phusion High-Fidelity DNA polymerase, Universal PCR primers, and Index Primer. Subsequently, PCR products were purified, and the quality of the libraries was checked with the Agilent Bioanalyzer 2100 system. Six libraries were prepared using the NEBNext®Ultra™ RNA Library Prep Kit for Illumina® (NEB, USA), following the manufacturer’s recommendations. Sequencing was performed using an Illumina Hiseq 2000 platform in Novogene Co., Ltd. (Beijing, China).

2.3. Measurement of Physiological Properties

Physiological properties, including chlorophyll content, electrolyte leakage (EL), and malonaldehyde (MDA) content were measured and analyzed according to a previous study [16]. For chlorophyll content analysis, 0.1 g leaves were collected and immersed in 95% ethanol. The samples were kept in the dark for 48 h and absorbance of the chlorophyll extract was read at 665 and 649 nm using a spectrophotometer (UV2600, UNIC, Shanghai, China). The chlorophyll content was calculated according to the formula described in a previous study [16].
For EL analysis, 0.5 g fresh leaves were collected and washed with distilled water to remove debris. Then, 15 mL distilled water was added to each tube and kept in a shaker incubator at 200 rpm for 6 h at 28 °C. Subsequently, the initial conductivity (EL1) was measured using a conductivity meter (JENCO-3173, Jenco Instruments, Inc., San Diego, CA, USA). Then, samples were autoclaved at 121 °C for 30 min. Immediately, the tubes were cooled to room temperature and the second conductivity (EL2) was measured. The relative EL was calculated by using the formula:
Relative EL (%) = (EL1/EL2) × 100
For MDA content determination, 0.3 g frozen leaves were used to prepare the crude enzyme extract. Leaves were ground into powder in liquid nitrogen using a pre-chilled mortar and pestle (4 °C), homogenized with sodium phosphate buffer (PBS), pH 7.4, and centrifuged at 12,000 rpm for 20 min at 4 °C. The supernatant was used to measure the MDA content. A total of 1 mL extract was mixed with a 2 mL reaction solution containing 20% (v/v) trichloroacetic acid and 0.5% (v/v) thiobarbituric acid. The mixture was boiled in a water bath for 30 min, cooled to room temperature, and centrifuged at 12,000× g for 10 min at 20 °C. The absorbance was read at 532 and 600 nm with a spectrophotometer (UV2600, UNIC, Shanghai, China). The MDA content was determined using the following formula: MDA (nmol g−1 FW) = [(A532 − A600) × V × 1000/ε] × W
Where A600 and A532 are the absorbances at 600 and 532 nm, respectively, ε is the specific extinction coefficient (155 mM cm−1), V is the volume of crushing medium and W is the fresh weight of leaves (g).
The physiological traits analysis was performed with three biological replicates, and one-way ANOVA was used to analyze differences between the control and heat-treated group.

2.4. Bioinformatics Analysis

2.4.1. Processing and Assembling of Illumina Reads

Paired-end reads were generated from the six libraries. Clean reads were obtained by removing low-quality reads and reads containing adapters or poly-N. Subsequently, the Q20, Q30, GC-content, and sequence duplication levels were analyzed. The downstream analyses were carried out using high-quality clean data. Transcriptome assembly was performed using the Trinity version 2.8.5 with all parameters set to default [31].

2.4.2. Gene Functional Annotation

Gene function was annotated by using the following databases: NR (NCBI non-redundant protein sequences) (http://www.ncbi.nlm.nih.gov, accessed on 11 March 2021), Pfam (Protein family) (http://pfam.sanger.ac.uk/, accessed on 11 March 2021), GO (Gene Ontology) (http://geneontology.org/, accessed on 11 March 2021), KOG/COG (Clusters of Orthologous Groups of Proteins) (ftp://ftp.ncbi.nih.gov/pub/COG/, accessed on 11 March 2021), Swiss-Prot (a manually annotated and reviewed protein sequence database) (http://www.ebi.ac.uk/uniprot/, accessed on 11 March 2021), and KEGG (Kyoto Encyclopedia of Genes and Genomes) (http://www.genome.jp/kegg/, accessed on 11 March 2021).

2.4.3. Differential Gene Expression Analysis

For each sample, gene expression levels were evaluated by RSEM [32]. Briefly, clean data were mapped back onto the assembled transcriptome, and then a read count for each gene was obtained based on the mapping results. Then, differential expression analysis of two groups was performed with DESeq2 version 3.11 [33] using a model based on the negative binomial distribution. The p values were adjusted to control the false discovery rate with the Benjamini and Hochberg methods. P-adj < 0.05 and |log2foldchange| > 1 were set as the cutoff value to determine significantly differentially expressed genes (DEGs).

2.4.4. GO and KEGG Pathway Enrichment Analysis

The clusterProfiler 4.0 (https://github.com/GuangchuangYu/clusterProfiler, accessed on 11 March 2021) was used for GO and KEGG pathways enrichment analysis of the differentially expressed genes (DEGs) [34]. Adjusted p value < 0.05 (as predicted by clusterProfiler software) was used as the threshold for the GO and KEGG pathway enrichment analysis.

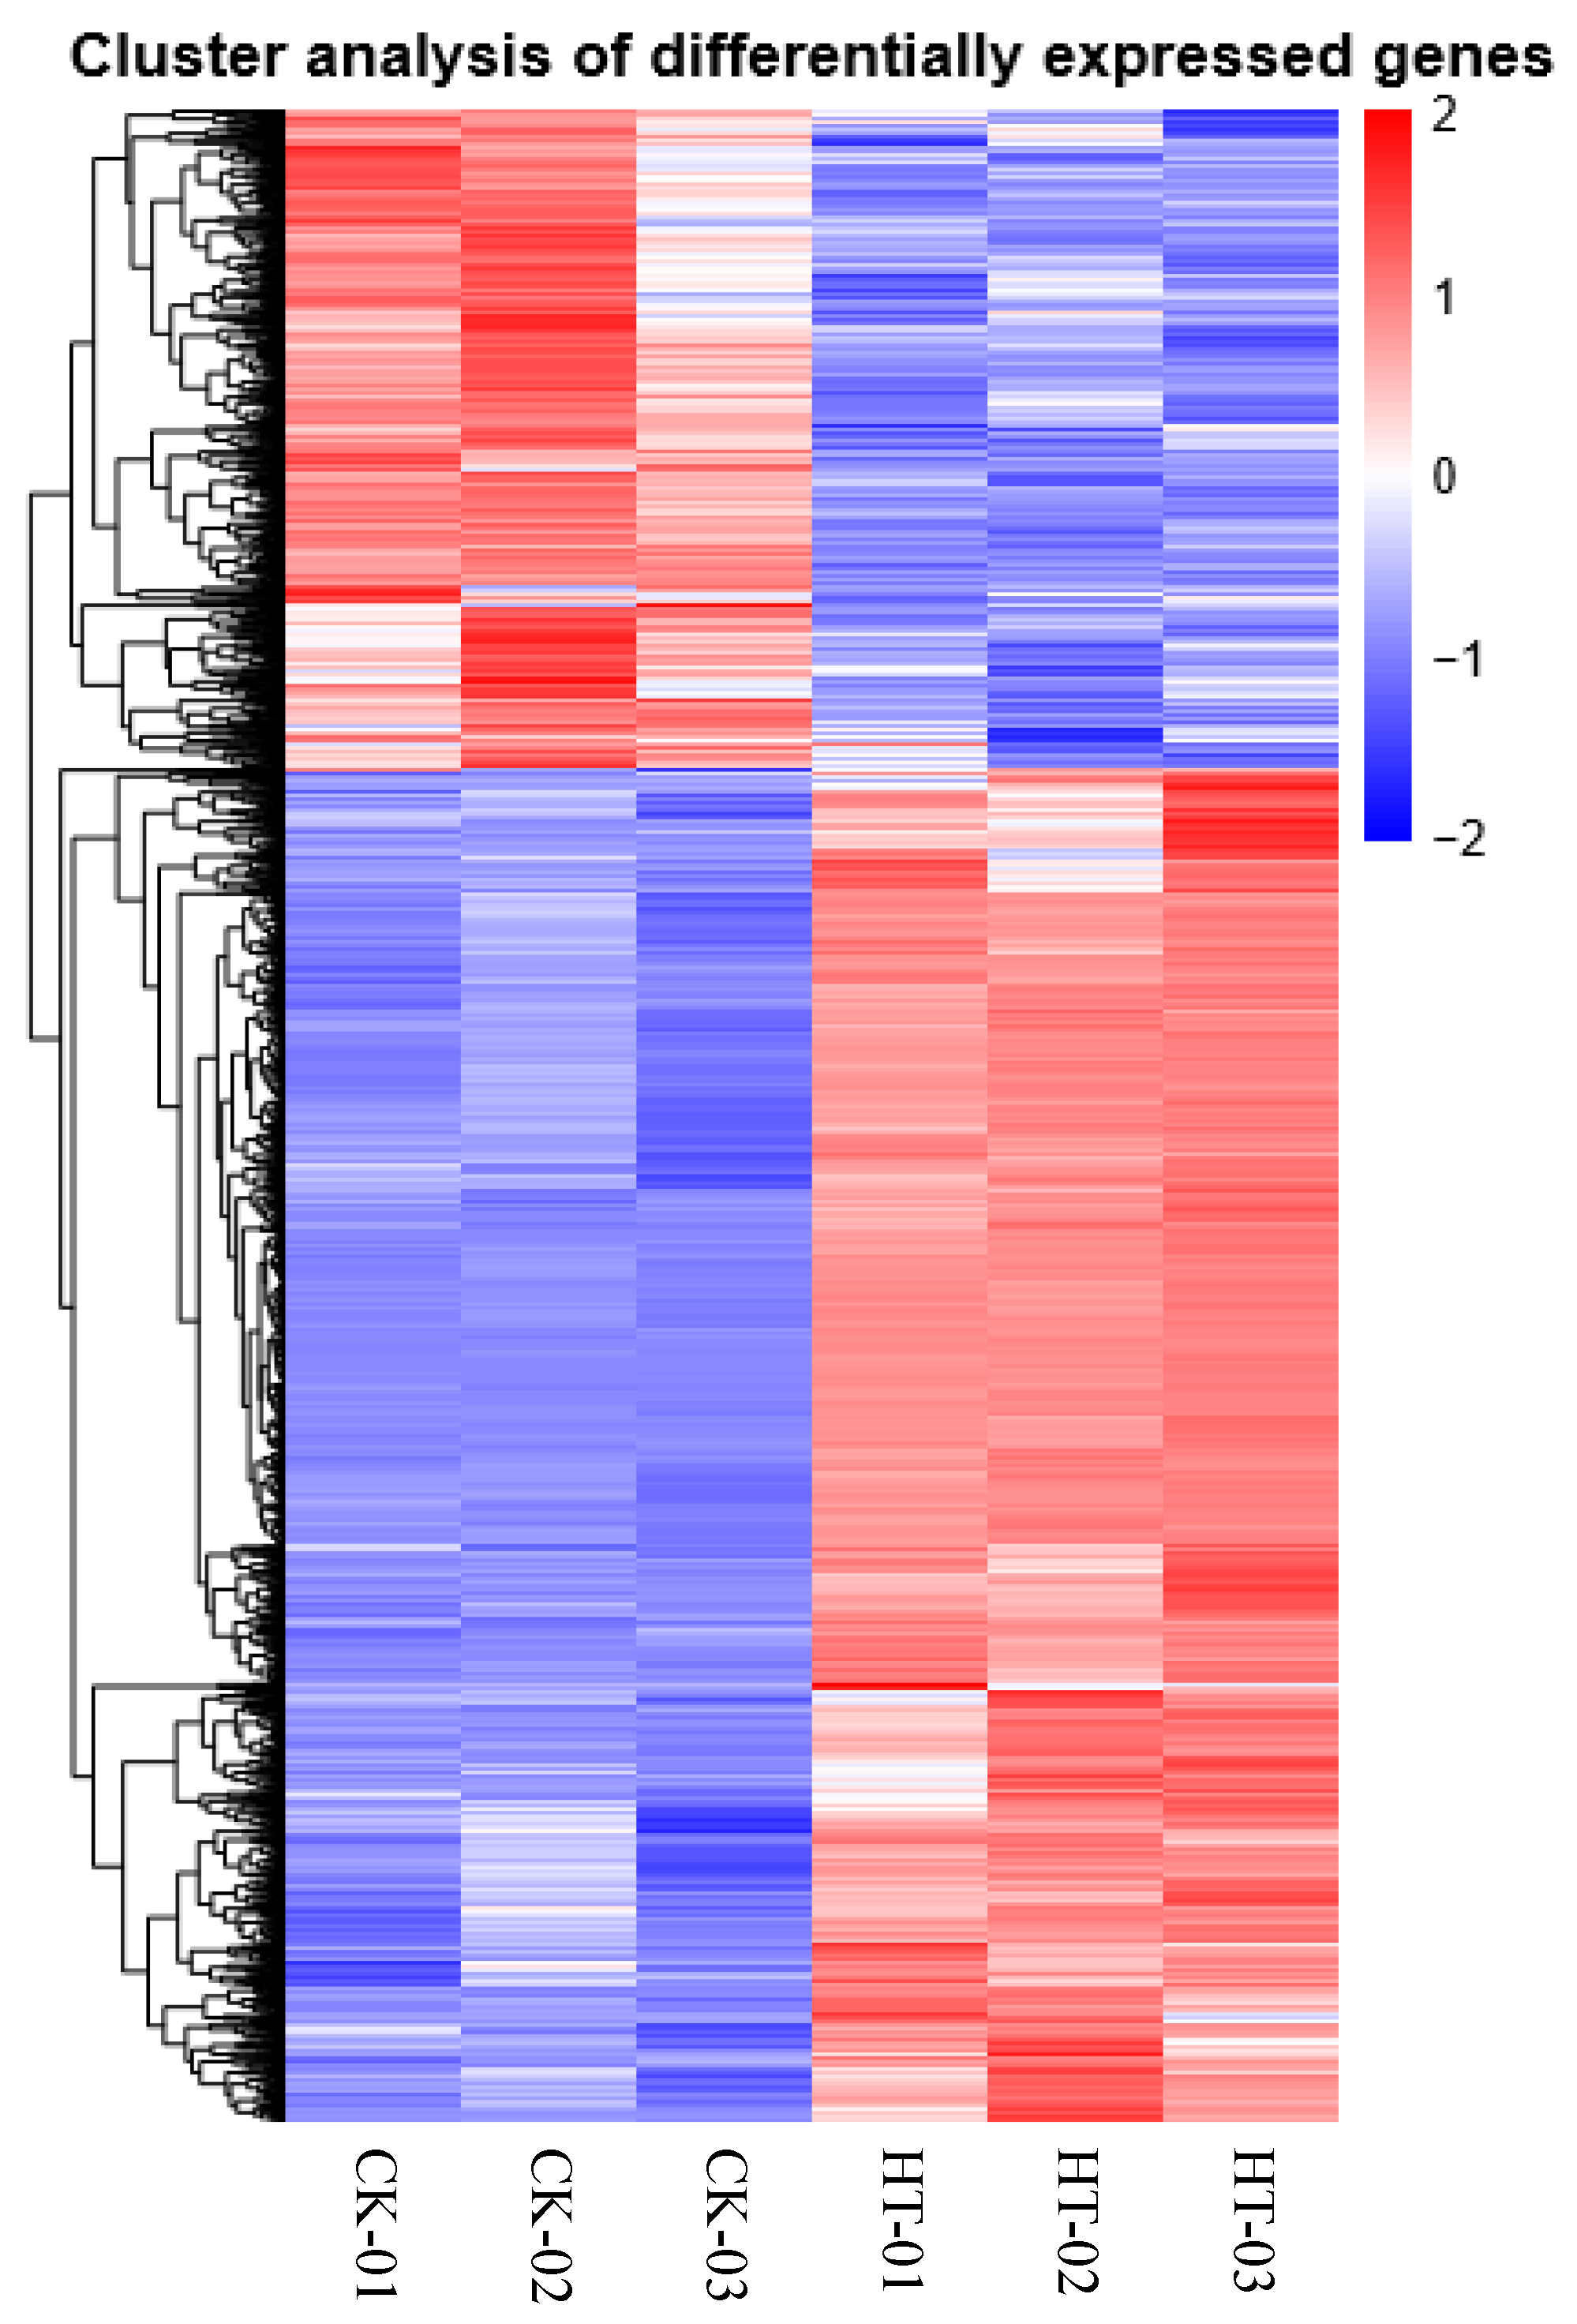
2.4.5. Clustering of the DEGs

Hierarchical clustering was performed to observe the expression patterns of DEGs. The RPKM counts for each unigene were clustered using Cluster 3.0 (http://bonsai.hgc.jp/~mdehoon/software/cluster/, accessed on 11 March 2021) [35], and JAVA Treeview 3.0 was used to visualize the results (https://jtreeview.sourceforge.net/, accessed on 11 March 2021) [36].

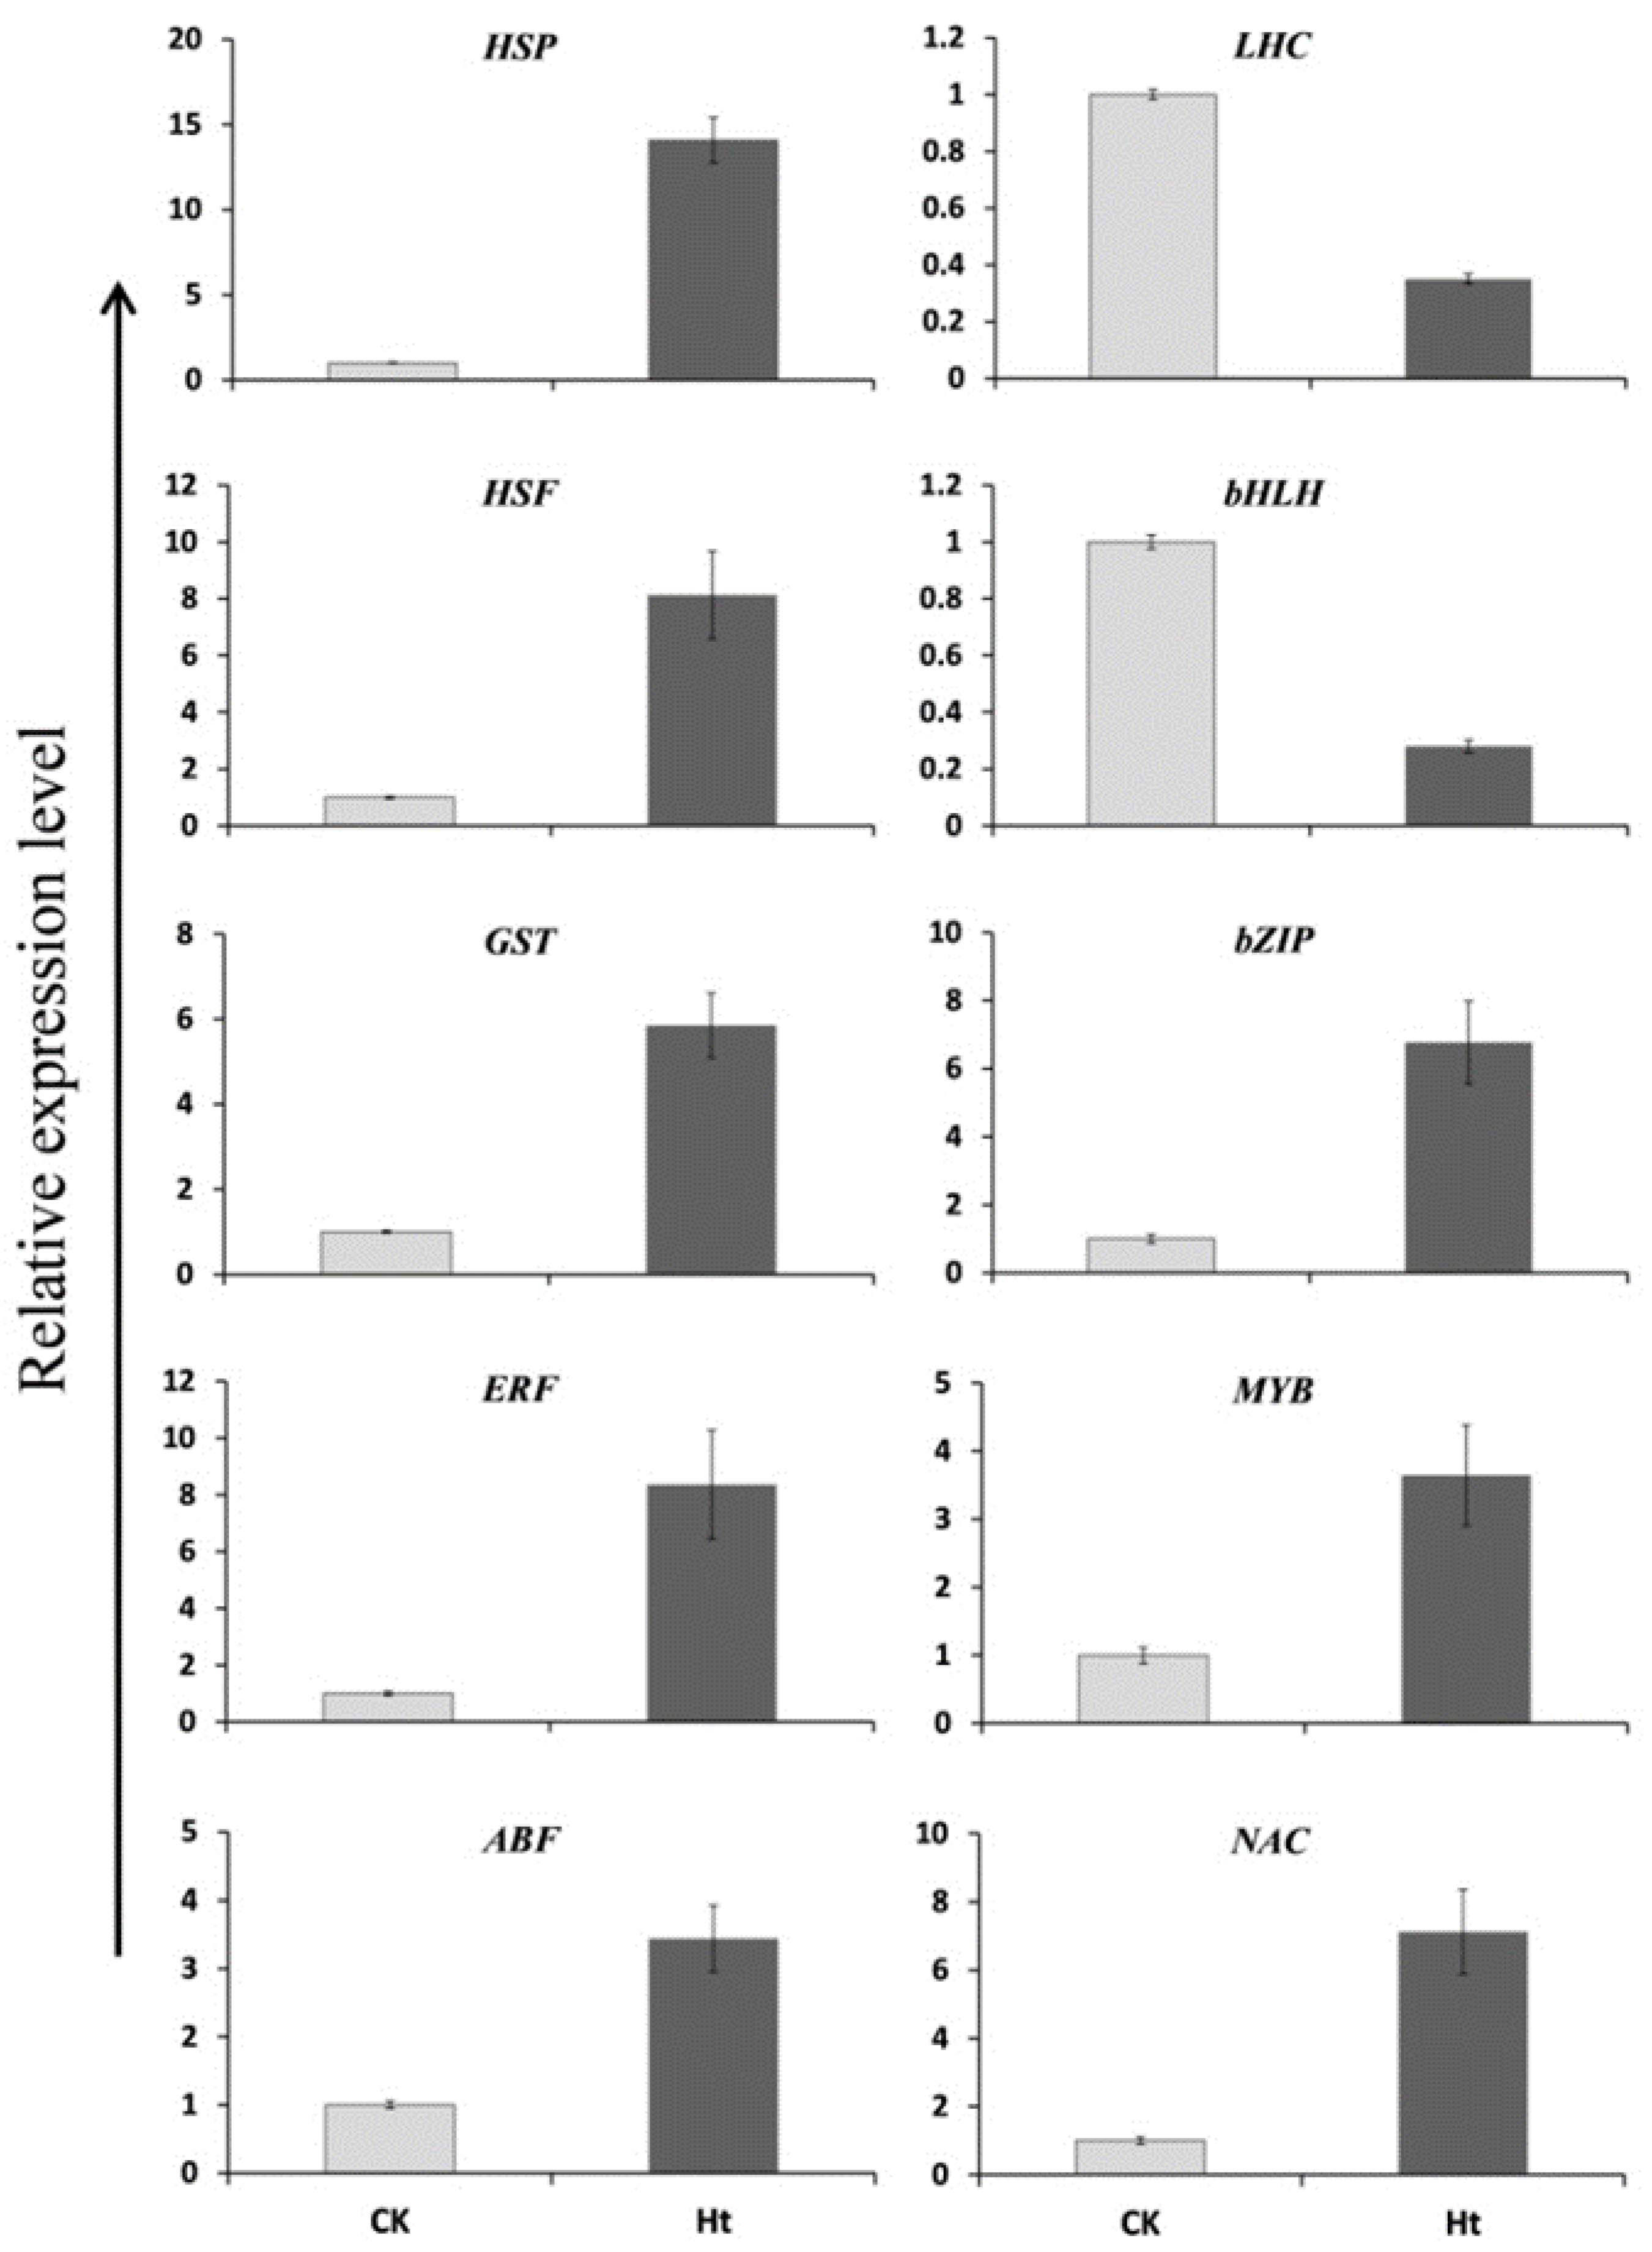
2.5. Validation of RNA-Seq Data by Real-Time Quantitative PCR

To validate the RNA-Seq results, real-time quantitative RT-PCR was performed for selected target genes using the previous method [37]. Briefly, total RNA was extracted from frozen leaves using the Trizol reagent (Invitrogen, Carlsbad, CA, USA) according to the manufacturer’s instructions. The quality of RNA extract was monitored on 1% agarose gels, and also checked using the NanoPhotometer® spectrophotometer (IMPLEN, Westlake Village, CA, USA). A total of 2 µg of RNA extract was used to prepare cDNA for each sample using RevertAid First Strand cDNA Synthesis Kit (Invitrogen, Carlsbad, CA, USA). The PCR reaction was performed using a total of 20 μL consisting of 10 μL of SYBR mix, 0.5 μL of each primer, 2 μL of cDNA, and 7μL dd water. The ABI StepOne Plus Real-Time PCR system (Applied Biosystems, Foster City, CA, USA) was used for PCR reaction. Melting curve analysis was used to check the specificity of the amplified PCR product after each PCR reaction. The glyceraldehyde-3-phosphate dehydrogenase (GAPDH) gene was used as a housekeeping control. The primers used in this study are listed in Table S1. The 2−ΔΔCT method was used to determine the relative expression of genes [38]. One-way ANOVA was applied to analyze the statistical differences between different groups.

3. Results

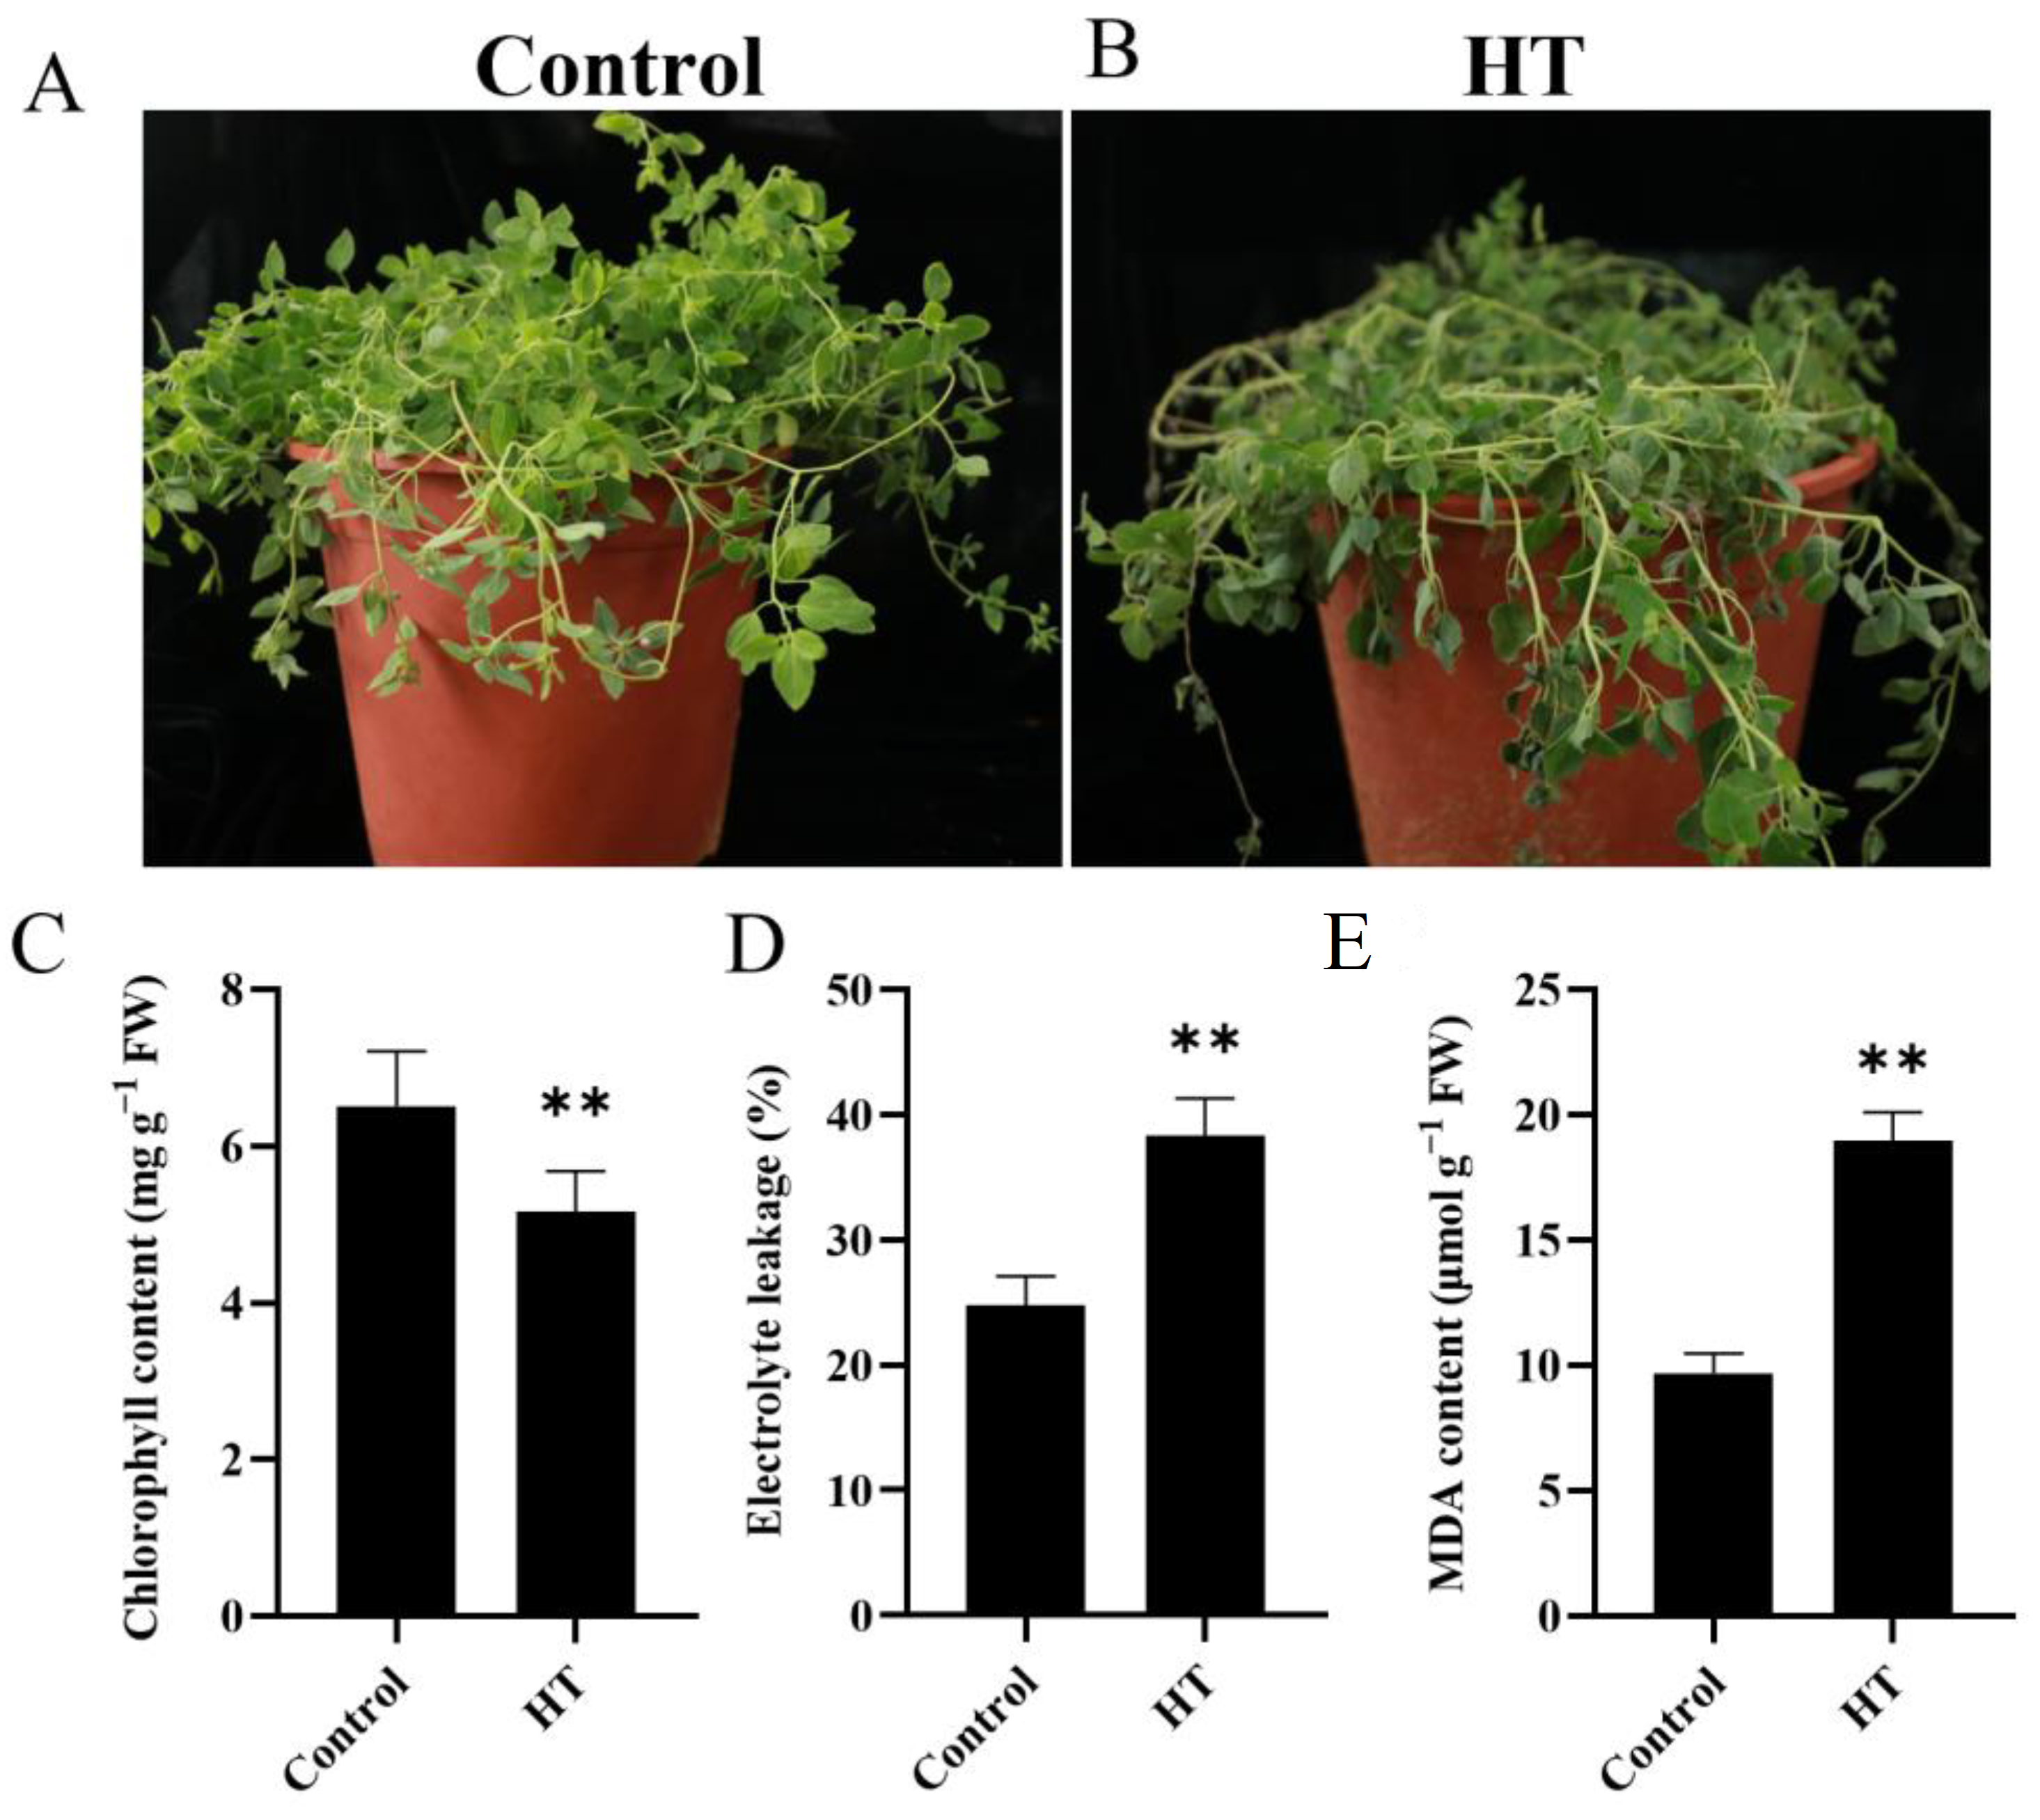
3.1. Effect of Heat Stress on Physiological and Biochemical Traits

Short-term (0.5 h) heat stress treatment did not significantly affect the morphology of C. tangshen. However, long-term heat stress exposure induced morphological and physiological alterations in C. tangshen. After 7 d of heat stress, the leaves of C. tangshen showed wilting and became withered (Figure 1A,B). Heat stress also significantly decreased chlorophyll content by 20.71% relative to the control (Figure 1C). Heat stress dramatically increased EL and MDA content by 54.67% and 95.74%, respectively, relative to the control (Figure 1D,E).

3.2. Illumina Sequencing and De Novo Assembly

Six cDNA libraries were constructed and sequenced from the leaves of C. tangshen. After quality control, a total of 44,915,008, 47,205,020, 52,814,730, 50,974,272, 44,953,364, and 49,951,766 clean reads were obtained from control (CK) and heat treatment (HT) libraries, respectively. The average clean reads of CK and Ht were 48,311,586 and 48,626,467, respectively. In addition, the average GC contents were 44.79% for CKs and 45.30% for Ht. The mean Q20 values were 97.99% and 98.11%, and the Q30 values were 93.79% and 94.12% for CK and Ht, respectively, indicating the high quality of the transcriptome sequencing results (Table 1). The raw sequencing data have been submitted to the Genome Sequence Archive (GSA) database at the BIG Sub (CRA004261). In addition, de novo assembly was carried out and identified 74,144 transcripts and 32,719 unigenes with an average length of 2346 bp and 2472 bp, respectively. All the unigenes are listed in Table S2.

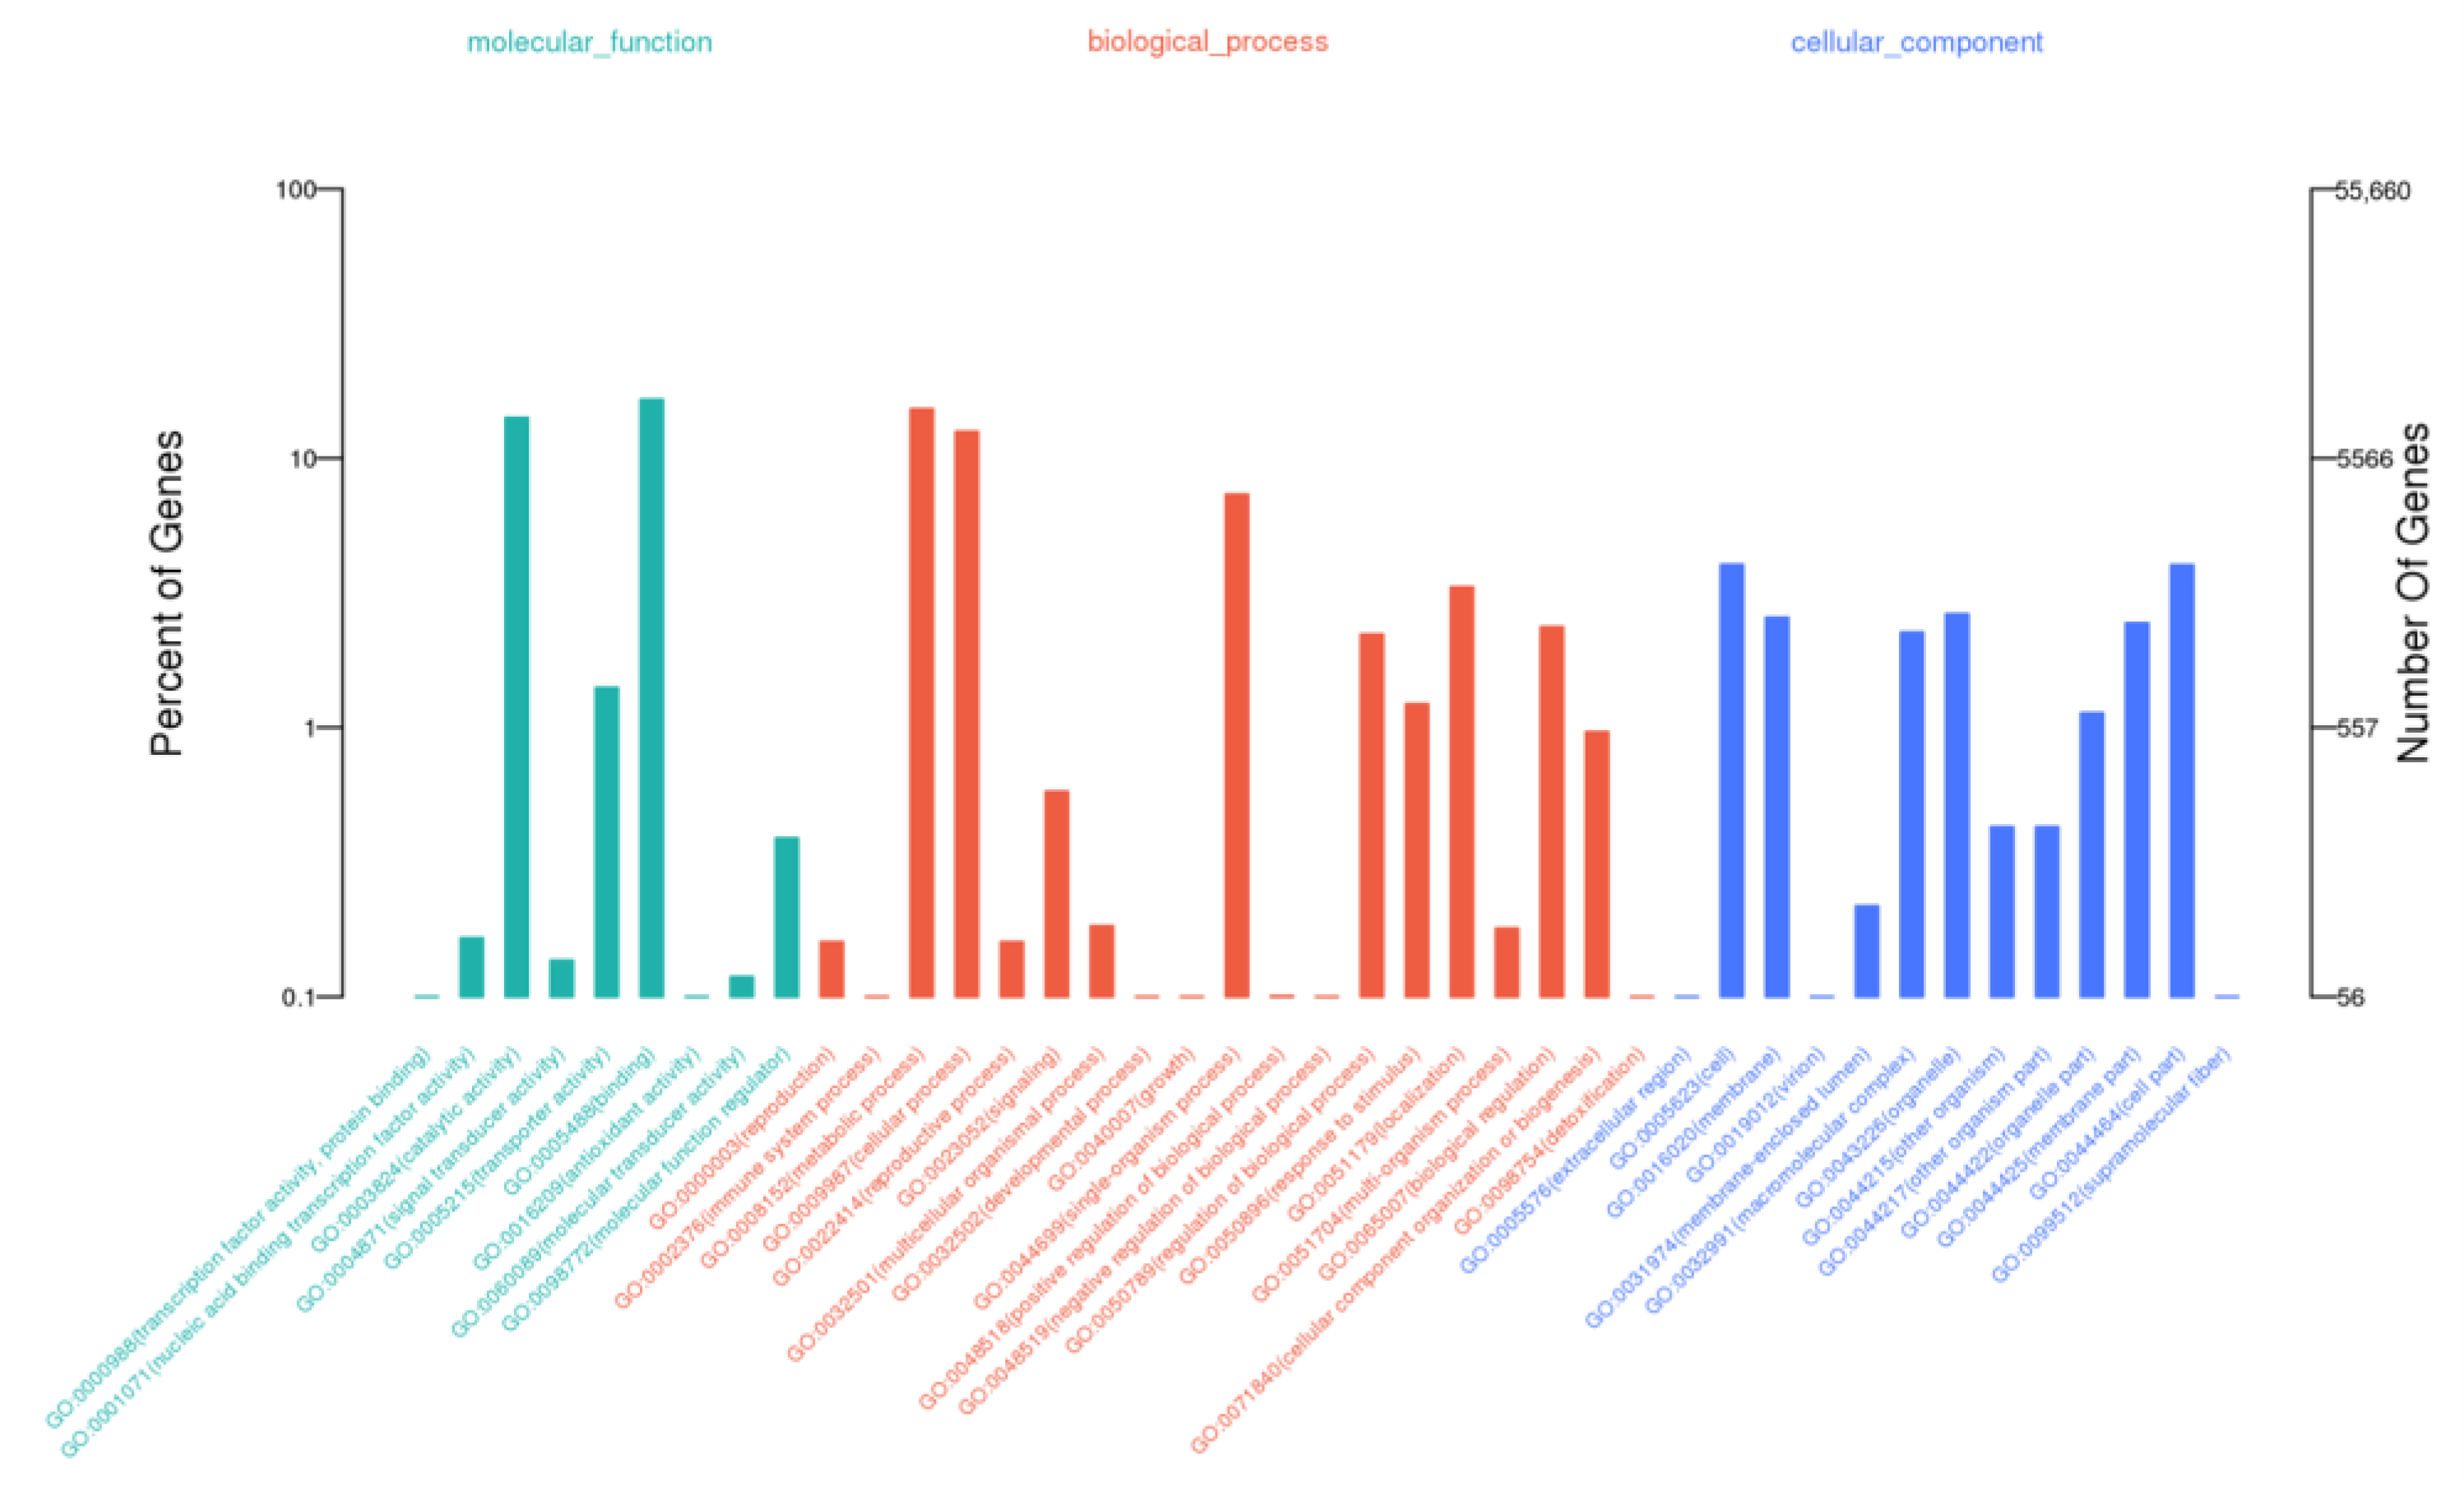
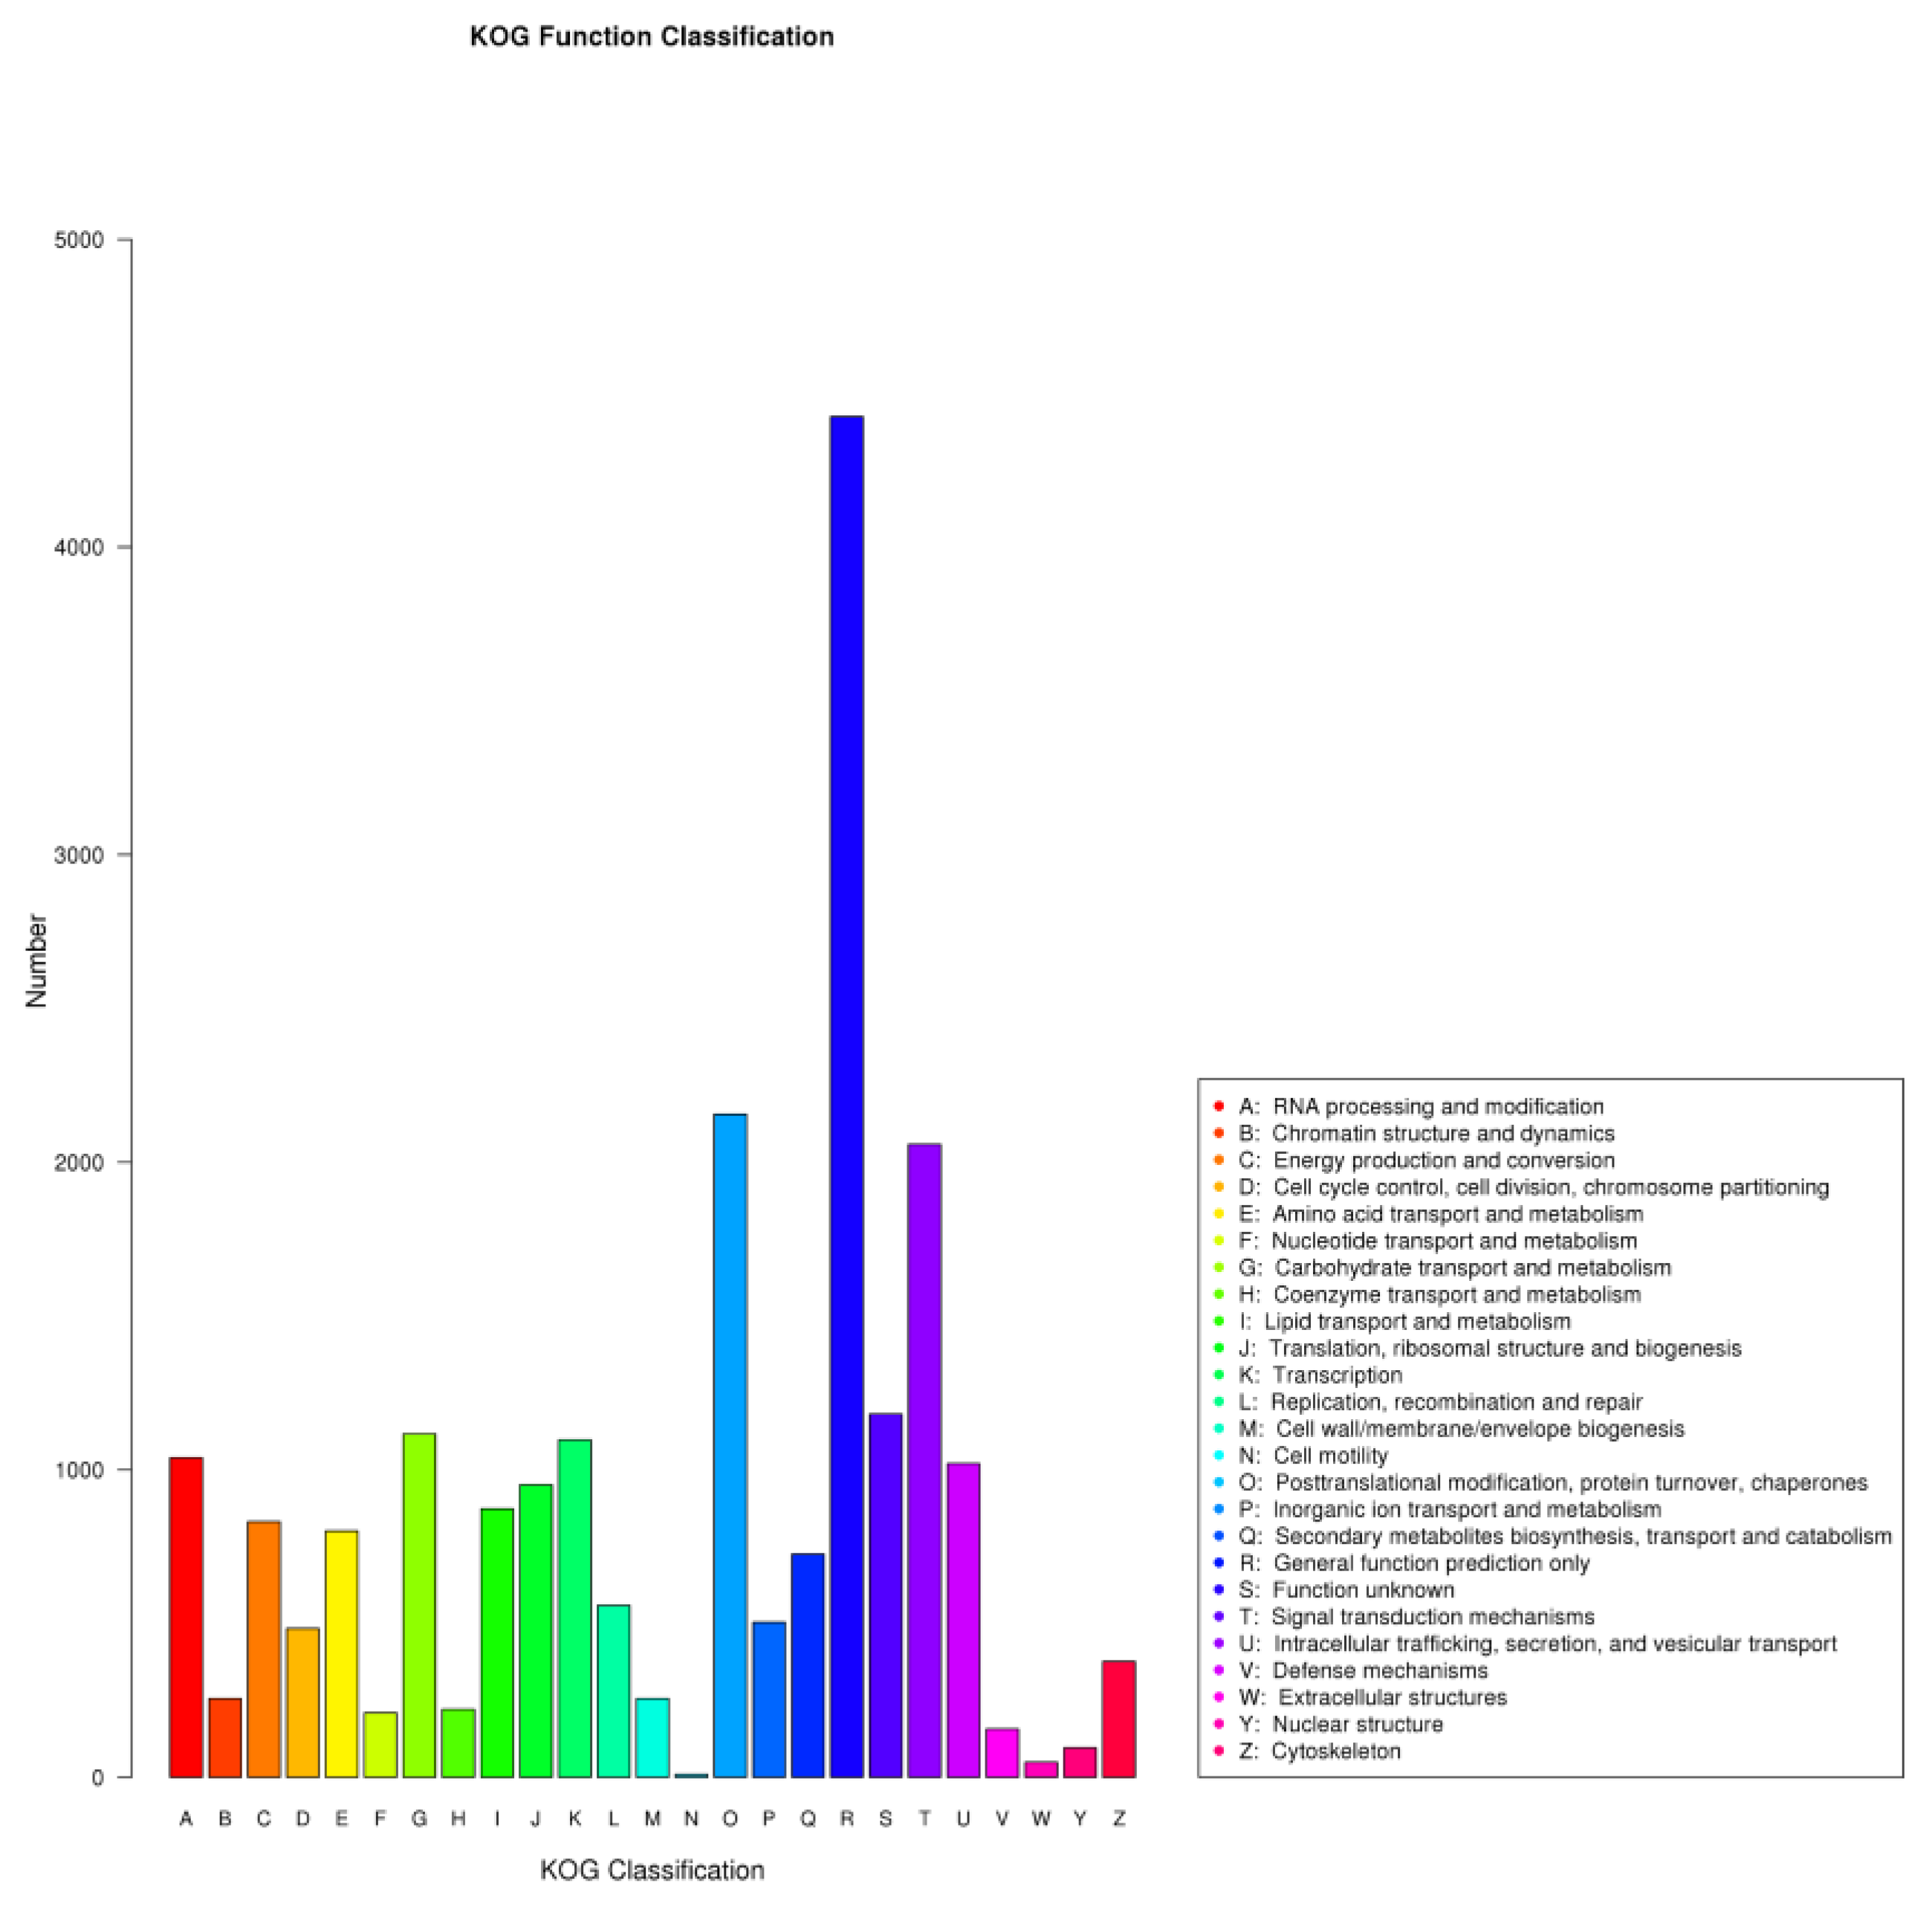
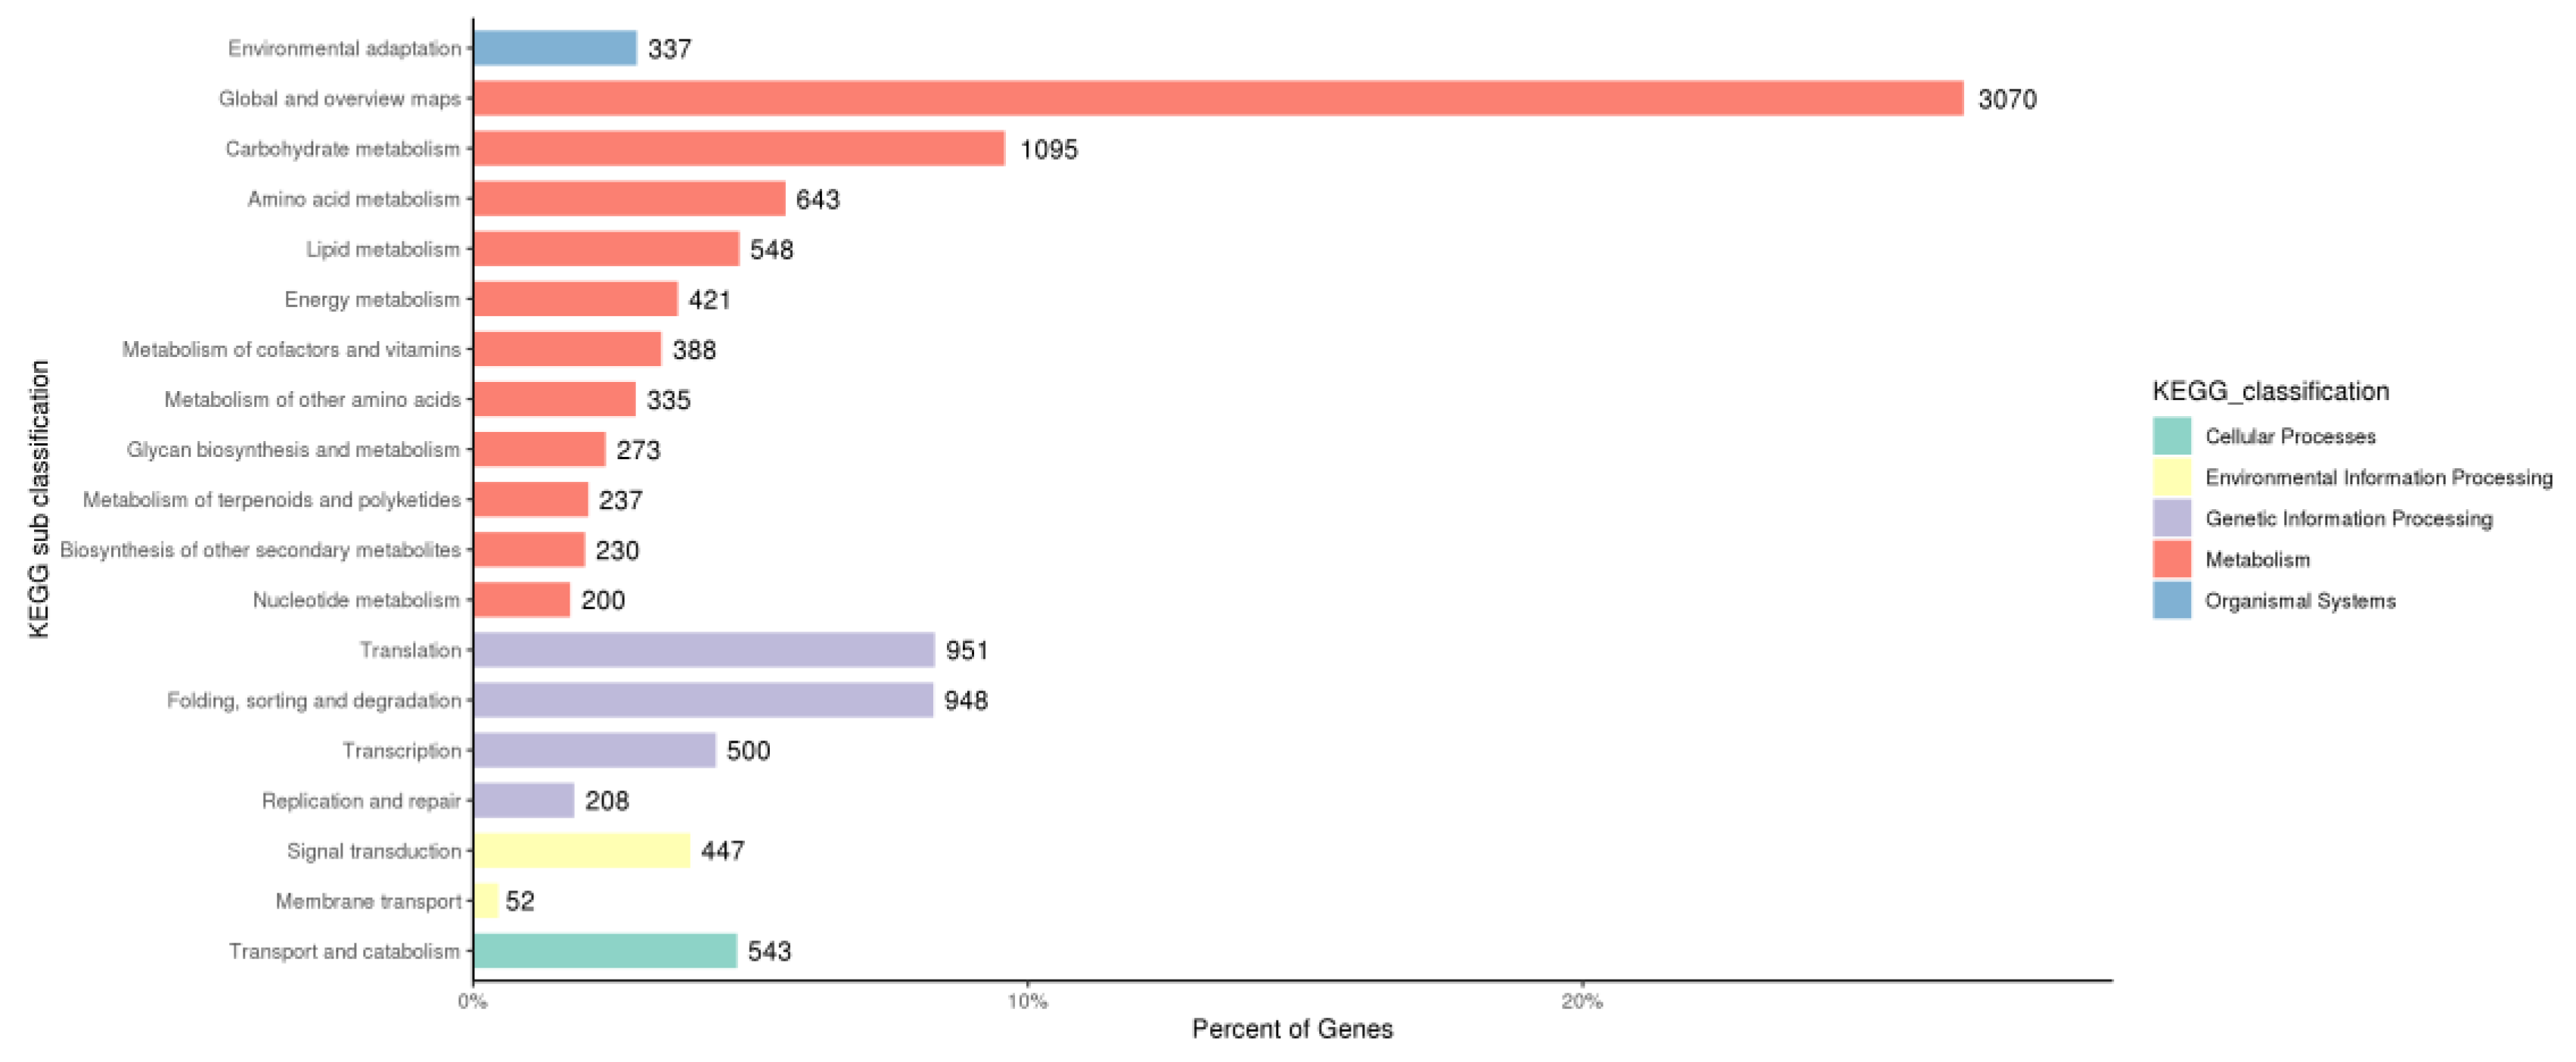
3.3. Functional Annotations of C. tangshen Unigenes

The functional annotations of unigenes were performed by searching against several databases, including KOG (Clusters of Orthologous Groups of Proteins), GO (Gene Ontology), KO (KEGG Ortholog Database), NR (NCBI non-redundant protein sequences), Swiss-Prot (a manually annotated and reviewed protein sequence database) (Table 2). A total of 19,546 (59.7%) unigenes had hits in the GO database and were classified into three GO categories, including “biological process (BP),” “cellular component (CC),” and “molecular function (MF) (Figure 2).
In the “BP” category, the highly enriched terms were “metabolic process,” “cellular process,” and “single-organism process.” The “CC” category mainly comprised unigenes related to “cell,” “cell part,” and “organelle.” Additionally, “the catalytic activity,” “transporter activity,” and “binding” were significantly enriched in the “MF” category (Figure 2, Table S3). Moreover, 19,217 (58.7%) unigenes were annotated using the KOG database and classified into 25 different functional classes (Figure 3). The main categories include “General function prediction only,” “Posttranslational modification, protein turnover, chaperones,” and “Signal transduction mechanisms,” each comprising 4424, 2156, and 2058 unigenes, respectively.
In addition, all the unigenes were searched against the KEGG database (Figure 3). A total of 12,562 unigenes were assigned to five KEGG pathways, including “cellular processes” (A), “environmental information processing” (B), “genetic information processing” (C), “metabolism” (D), and “organismal systems” (E) (Figure 4). Category A comprised only one subcategory, “Transport and catabolism” (543 unigenes). Category B consisted of two subcategories: “Signal transduction” (447 unigenes) and “Membrane transport” (52 unigenes). Two subcategories dominated Category C: “Translation” (951 unigenes) and “Folding, sorting, and degradation” (948 unigenes). Category D was mainly represented by two subcategories: “Global and overview maps” (3070 unigenes) and “Carbohydrate metabolism” (1095 unigenes). The “environmental adaptation” was the only enriched subcategory in category E.

3.4. Analysis of DEGs in Response to Heat Stress in C. tangshen

To obtain insights into the transcriptomic response of C. tangshen to heat stress, we further analyzed the differentially expressed genes (DEGs) list that was identified using the DESeq package using the CK (control samples) and HT (heat-treated samples). A total of 2691 DEGs were identified, including 1809 upregulated and 882 downregulated. The expression and annotation of DEGs are shown in Table S4 and Table S5, respectively.
Moreover, the DEGs from the three control and heat treatment replicates were clustered using the hierarchical clustering method (Figure 5). The DEGs were classified into two groups and showed contrasting expression profiles between CK and heat treatment. Genes with similar expression levels were preferentially clustered together. There were no significant differences in the expression of DEGs between replicates.

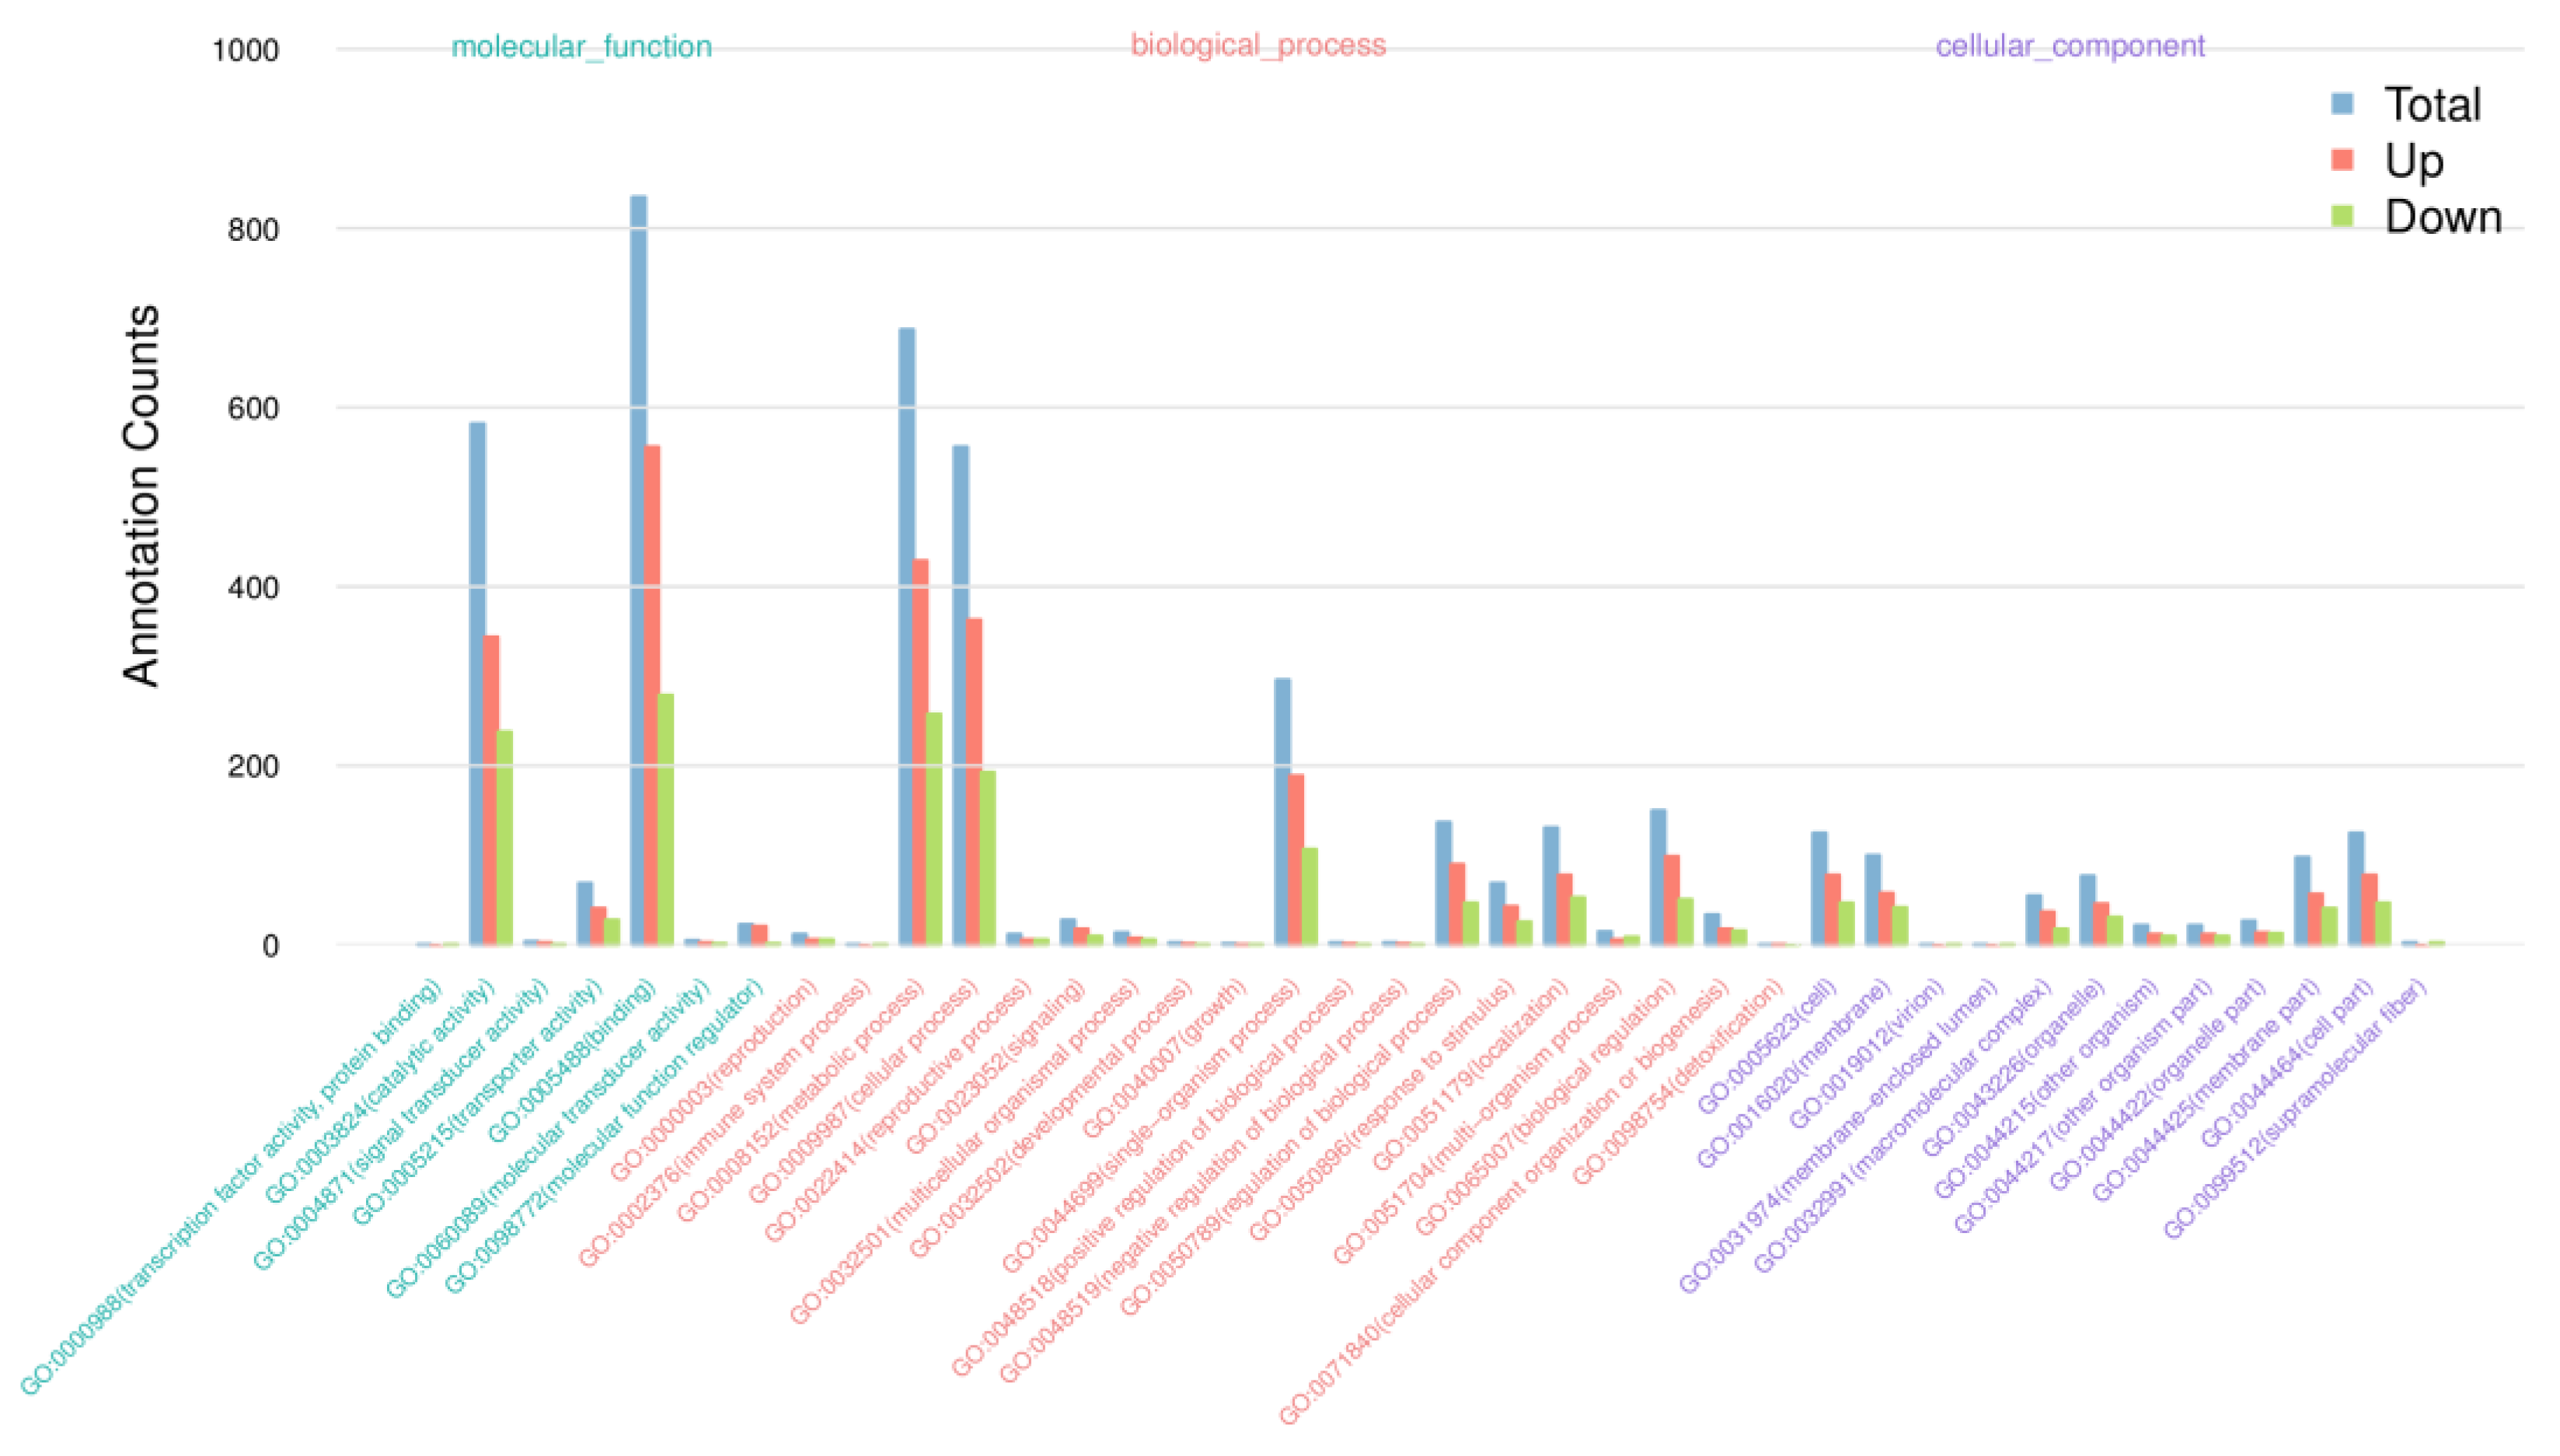
3.5. GO and KEGG Enrichment Analyses of DEGs

GO analysis was performed to investigate the functions of DEGs. As shown in Figure 6, Table S6, DEGs were classified into three GO categories, MF, BP, and CC. The highly enriched MF GO terms were unfolded protein binding, chaperone binding, DNA binding transcription factor activity, ATPase activator activity, channel activity, and heat shock protein binding. In the BP category, protein folding, protein refolding, regulation of pH, sodium ion transport, lipid catabolic process, photosynthetic electron transport chain, and “photosynthesis, light reaction” were significantly enriched. However, we did not find significantly enriched GO terms in the CC category.
Furthermore, to investigate the metabolic pathways regulated in response to heat stress in C. tangshen, DEGs were systematically subjected to the KEGG pathway enrichment analysis (Figure S2, Table S7). We found 30 enriched metabolic pathways. Interestingly, the upregulated DEGs were mainly enriched into plant–pathogen interaction (67 DEGs) and protein processing in the endoplasmic reticulum (123 DEGs) (Figure S3, Table S8). While downregulated DEGs were significantly enriched into starch and sucrose metabolism (15 DEGs), phenylpropanoid biosynthesis (11 DEGs), fatty acid elongation (5 DEGs), and plant–pathogen interaction (16 DEGs) (Figure S4, Table S9).

3.6. DEGs Related to Short-Term Heat Stress in C. tangshen

To identify heat stress-responsive candidate genes, we focused on genes related to HSF-dependent pathways, ROS scavenging enzymes, plant hormone signaling transduction, and transcription factors, including bHLH, bZIP, MYB, WRKY, and NAC. When exposed to heat stress, the increased expression of HSPs usually form a complex with the HSF [39]. We found 130 HSPs and 8 HSFs enriched by heat stress-induced upregulated genes in the HSF-dependent pathway. ROS levels increased significantly in plants exposed to high temperatures [40]. We identified six GSTs and one PAO significantly upregulated genes involved in ROS scavenging. Furthermore, genes related to plant hormone signaling transduction were significantly induced by heat treatment, including eleven ERFs, two ABFs, and one PYL. Calcium-dependent protein kinases (CDPKs) genes are critical components in the heat stress-mediated calcium signal transduction pathway [41]. Here, a total of 15 CPKs and 5 calmodulin-like proteins (CMLs) were significantly upregulated by heat stress in C. tangshen (Table 3).
In addition, heat-responsive transcription factors (TFs), including bHLH, bZIP, WRKY, and NAC, were identified in C. tangshen. Out of the 10 bZIP genes, 8 were significantly upregulated by heat treatment compared to the control (Table 4). Additionally, 14 DEGs encoding the NAC TFs were identified, of which 11 were significantly upregulated, while the other 3 were remarkably downregulated after heat treatment (Table 5). We also identified nine WRKY genes that were significantly upregulated by heat stress (Table 6). Moreover, three bHLH genes were identified and remarkably downregulated upon heat stress (Table 7). The clustering of the representative DEGs related to the different gene categories in heat treatment compared with CK is shown in Figure 7.

3.7. Validation of the DEGs by qRT-PCR

The RNA-Seq results were validated by analyzing the expression of ten unigenes related to TFs or stress responses using qRT-PCR. The transcriptional level of three stress-responsive unigenes (HSP, HSF, and GST) was significantly increased in the Ht group compared to the CK group (Figure 8). Six TFs genes were also checked. Five TFs were markedly upregulated by heat stress (ERF, ABF, bZIP, MYB, and NAC), and only one (bHLH) was downregulated by heat stress. Additionally, the expression of a light-harvesting chlorophyll a/b binding protein (LHC) gene was inhibited by heat stress. In summary, the expression profiles of these unigenes from the qRT-PCR were consistent with that from the RNA-Seq, indicating that the RNA-Seq data were reliable and accurate.

4. Discussion

4.1. Heat Stress Regulates Physiological and Biochemical Traits in C. tangshen

Heat stress is a severe abiotic factor limiting plants’ growth and development. In this study, we demonstrated the heat stress-induced biochemical and transcriptomic responses of C. tangshen. Transcriptomic analysis was carried out after short-term heat stress (0.5 h) treatment. Extended heat stress for 7 d caused a noticeable phenotypic change in C. tangshen, including leaf wilting. Electrolyte leakage and lipid peroxidation have been used to study heat stress-induced membrane damage in plants [42,43]. Physiological and biochemical analysis showed that C. tangshen was severely affected by 7 d heat stress treatment, evidenced by pronounced levels of electrolyte leakage and lipid peroxidation. Additionally, chlorophyll content was significantly reduced by heat stress. Our results agreed with the findings reported in P. ternate [16]. Together, these results indicate that heat stress is a significant limiting factor for the growth and development of C. tangshen. Thus, identifying key heat-responsive genes and understanding the underlying molecular mechanisms could be crucial to improve the thermotolerance of C. tangshen.

4.2. Transcriptomic Response of C. tangshen to Heat Stress

Plants reprogram transcriptomic profiles and develop molecular mechanisms to cope with heat stress [44,45,46]. In this study, we conducted RNA-seq to understand the molecular mechanisms of heat stress response in C. tangshen at the transcriptome level. Here, 2691 DEGs were identified, including 1809 upregulated and 882 downregulated. Further analysis demonstrated that most of the DEGs induced by heat stress were related to the HSF–HSP pathway, ROS scavenging enzymes, plant hormone signaling transduction, and TFs, including bZIP, MYB, NAC, WRKY, and bHLH, which have been reported in previous studies [25,27,47,48]. This study is the first report to investigate the transcriptomic profiles of C. tangshen in response to heat stress. Moreover, we identified candidate heat-responsive genes and transcription factors that could play a crucial role in improving the thermotolerance of C. tangshen. Overall, our results provide essential information for the functional characterization of heat-responsive genes in C. tangshen.

4.3. ROS–Scavenging Activity and HSF–HSP Network Involved in HSR

Heat stress induces excessive production of reactive oxygen species (ROS) in plant cells, leading to oxidative stress, which further causes DNA damage, protein denaturation, and impairment of cell membranes [49]. ROS-scavenging enzymes, such as GSTs and APXs, play a crucial role in heat stress tolerance in plants [50]. In this study, six GST and two APX genes were significantly induced in response to heat stress, indicating that these genes could be involved in scavenging ROS and protecting C. tangshen from heat stress-induced damages.
The HSF–HSP network is activated to protect plant cells against heat stress-induced damages [51]. In Arabidopsis, HSPs, including Hsp 100, Hsp90, Hsp70, and Hsp60, were significantly induced to provide mechanisms against heat stress [52]. In this study, heat stress induced the expression of HSF and HSP genes in C. tangshen. For instance, 8 HSFs and 130 HSPs genes, including HSP20, HSP70, and HSP90 were, significantly upregulated by heat stress. Previous studies showed that HSP proteins could be crucial in improving heat tolerance in plants. Overexpression of HSP70 from Brassica campestris improved heat tolerance in tobacco [53]. Additionally, overexpression of a peony HSP70 enhanced heat tolerance in transgenic Arabidopsis [54]. In addition, GmHsp90A2 from soybean was identified as a positive player of heat tolerance [51]. Thus, HSP70 and HSP90 could be key genes to improve the thermotolerance of C. tangshen. Meanwhile, further study is required to investigate how HSPs and HSFs function in C. tangshen under heat stress.

4.4. DEGs Related to Plant Hormone Signal Transduction

The phytohormones, including ABA, ethylene, and brassinosteroids, play crucial roles in plants’ growth development and heat stress response [53,54,55,56,57,58,59]. Ethylene-responsive transcription factors (ERFs) are a transcriptional subfamily downstream of the ethylene signaling pathway [60,61]. ERFs are involved in floral organ development, fruit ripening, abiotic stresses, hormonal signal transduction, and pathogenesis [61,62]. Most ERFs were significantly upregulated in plants treated with heat stress [63]. In this study, most ERF genes were induced in response to heat stress (Figure 9), suggesting that ERFs might function in protecting C. tangshen from heat stress damage. ABFs constitute a significant transcription factor in the ABA signaling pathway that activates ABA/stress-responsive genes in response to abiotic stress [64]. The binding of ABA to PYL proteins inhibits protein phosphatase type 2Cs (PP2Cs) activity, thereby activating SNF1-related kinases (SnRK2s) to phosphorylate and activate ABFs [65]. A study on the heat-tolerant rice cultivar “Annapurna” showed that PP2Cs and ABFs were upregulated at 37 °C temperature stress [22]. In agreement, all the PP2Cs and most ABFs were upregulated by heat stress in C. tangshen, indicating the critical role of the ABA signaling pathway in C. tangshen thermotolerance. These results suggest that different hormone signaling pathways are involved in the thermotolerance of C. tangshen. Several functional studies indicate that ABF genes could play a remarkable role in improving plants’ stress tolerance. For instance, overexpression of OsABF1 positively regulated drought tolerance in rice [66]. Additionally, overexpression of IbABF4 from sweet potatoes could improve heat tolerance in Arabidopsis [67]. Thus, the ABF genes identified in this study could play a crucial role in improving the heat tolerance of C. tangshen.

4.5. DEGs Related to Transcription Factors

Transcriptional factors, including MYBs, NACs, WRKY, bHLH, and bZIP, play a pivotal role in heat stress response [68,69,70,71,72]. In this study, 17 MYBs, 14 NACs, 9 WRKY, 3 bHLH, and 10 bZIP were significantly regulated in response to heat stress in C. tangshen. Overexpression of crucial stress-responsive TFs could remarkably improve stress tolerance in plants. For instance, MYB305, isolated from Lilium longiflorum, with transactivation ability in yeast and plant cells, was reported to play a positive role in thermotolerance [73]. In Arabidopsis, AtWRKY25, AtWRKY26, and AtWRKY33 were involved in resistance against pathogenic bacteria and abiotic stresses, including heat stress [74]. Likewise, NAC19 and bZIP28 identified from Arabidopsis positively regulated thermotolerance [69,72]. Overexpression of AtMYB68 enhanced drought and heat tolerance in Arabidopsis and Brassica napus [75]. Additionally, overexpression of OsbZIP46 could positively regulate drought tolerance in rice [76]. In a recent study, a maize NAC TF, ZmNAC074, improved heat tolerance in Arabidopsis [77]. Thus, we speculated that the TFs identified in this study could play a significant role in improving the thermotolerance of C. tangshen.
Additionally, a large number of calcium-dependent protein kinases (CDPKs) were upregulated in response to heat stress in C. tangshen. CDPK proteins play crucial roles in plants’ abiotic stress response by regulating downstream target proteins [78]. For instance, overexpression of CDPK6 enhanced salt and drought tolerance in transgenic Arabidopsis [79]. In rice, OsCDPK7 positively regulates cold, drought, and salinity stresses [80]. Additionally, ZmCDPK7 was involved in improving heat tolerance in maize [81]. These results indicate that CDPK proteins are a central player in multiple stress responses. Thus, the upregulation of CDPKs could be one of the mechanisms of thermotolerance in C. tangshen. In addition, candidate CDPKs identified in this study can be used for functional analysis in response to heat stress.

5. Conclusions

This study demonstrated how C. tangshen responded to short-term heat stress at the transcriptome level. Heat stress is a significant factor limiting the growth and development of C. tangshen. Heat stress reprogrammed the transcriptomic profiles of C. tangshen and regulated various genes related to the HSP-HSF network, ROS-scavenging activity, hormone signaling transduction, and TFs. Overall, these findings could provide essential transcriptional information for improving the thermotolerance of C. tangshen. Further functional studies are needed to understand the detailed molecular mechanisms of these candidate genes in response to heat stress in C. tangshen.

Supplementary Materials

The following supporting information can be downloaded at: https://www.mdpi.com/article/10.3390/life13010168/s1, Figure S1: L_vs_L_Ht_all.go.enrichment.stat; Figure S2: L_vs_L_Ht.pathway_DEG; Figure S3: L_vs_L_Ht_up.kegg.enrichment.stat; Figure S4: L_vs_L_Ht_down.kegg.enrichment.stat; Table S1: Real time PCR primers used in this study; Table S2: The list of all unigenes; Table S3: GO classification of the unigenes; Table S4: L_vs_L_Ht.DEG_up.Annotation; Table S5: L_vs_L_Ht.DEG_down; Table S6: KEGG_classification; Table S7: L_vs_L_Ht_all.go.significant.enrichment; Table S8: L_vs_L_Ht_up.kegg.significant.enrichment; Table S9: L_vs_L_Ht_down.kegg.significant.enrichment.

Author Contributions

X.J. and M.W. designed the study and completed the manuscript writing; X.J., M.W., W.Z., H.W., J.Y. and G.M. performed the experiments and processed the experimental data; M.Z. reviewed and finalized the manuscript. All authors have read and agreed to the published version of the manuscript.

Funding

This work was supported by The Special Fund for the Construction of Modern Agricultural Industrial Technology System (CARS-21), Hubei Technology Innovation Center for Agricultural Sciences 2020 key technology research and demonstration project of safe and efficient production of genuine medicinal materials (2020-620-000-002-04) and Enshi Prefecture Science and Technology Plan Project (D20220075).

Institutional Review Board Statement

Not applicable.

Informed Consent Statement

Not applicable.

Data Availability Statement

The raw sequencing data have been submitted to the Genome Sequence Archive (GSA) database at the BIG Sub (https://ngdc.cncb.ac.cn/gsub/, accessed on 1 October 2022). The accession number is CRA004261.

Conflicts of Interest

The authors declare no conflict of interest.

References

  1. Xu, X.Y.; Xu, H.Y.; Shang, Y.; Zhu, R.; Hong, X.X.; Song, Z.H.; Yang, Z.P. Development of the general chapters of the Chinese Pharmacopoeia 2020 edition: A review. J. Pharm. Anal. 2021, 11, 398–404. [Google Scholar] [CrossRef] [PubMed]
  2. Wu, Q.N.; Luo, M.; Yao, X.D.; Yu, L. Purification, structural characterization, and antioxidant activity of the COP-W1 polysaccharide from Codonopsis tangshen Oliv. Carbohyd. Polym. 2020, 236, 116020. [Google Scholar] [CrossRef] [PubMed]
  3. Zhang, Y.L.; Zhou, N.; Tan, J.P. Preliminary analysis of the quality difference of Codonopsis pilosula from different producing areas. Asia-Pac. Tradit. Med. 2017, 13, 37–39. [Google Scholar]
  4. Zou, Y.F.; Zhang, Y.Y.; Paulsen, B.S.; Rise, F.; Chen, Z.L.; Jia, R.Y.; Li, L.X.; Song, X.; Feng, B.; Tang, H.Q.; et al. Structural features of pectic polysaccharides from stems of two species of Radix Codonopsis and their antioxidant activities. Int. J. Biol. Macromol. 2020, 159, 704–713. [Google Scholar] [CrossRef] [PubMed]
  5. Liu, C.; Chen, J.; Li, E.T.; Fan, Q.; Wang, D.Y.; Li, P.; Li, X.P.; Chen, X.Y.; Qiu, S.L.; Gao, Z.Z.; et al. The comparison of antioxidative and hepatoprotective activities of Codonopsis pilosula polysaccharide (CP) and sulfated CP. Int. Immunopharmacol. 2015, 24, 299–305. [Google Scholar] [CrossRef] [PubMed]
  6. Meng, Y.; Xu, Y.J.; Chang, C.; Qiu, Z.P.; Hu, J.J.; Wu, Y.; Zhang, B.H.; Zheng, G.H. Extraction, characterization and anti-inflammatory activities of an inulin-type fructan from Codonopsis pilosula. Int. J. Biol. Macromol. 2020, 163, 1677–1686. [Google Scholar] [CrossRef]
  7. Yang, D.D.; Chen, Y.; Guo, F.X.; Huang, B.T.; Okyere, S.A.; Wang, H. Comparative analysis of chemical composition, antioxidant and antimicrobial activities of leaves, leaf tea and root from Codonopsis pilosula. Ind. Crop. Prod. 2019, 142, 111844. [Google Scholar] [CrossRef]
  8. Liu, Y.Q.; Zou, X.M.; Sun, G.R.; Bao, Y.H. Codonopsis lanceolata polysaccharide CLPS inhibits melanoma metastasis via regulating integrin signaling. Int. J. Biol. Macromol. 2017, 103, 435–440. [Google Scholar] [CrossRef]
  9. Gao, Z.Z.; Zhang, C.; Jing, L.R.; Feng, M.; Li, R.; Yang, Y. The structural characterization and immune modulation activitives comparison of Codonopsis pilosula polysaccharide (CPPS) and selenizing CPPS (sCPPS) on mouse in vitro and vivo. Int. J. Biol. Macromol. 2020, 160, 814–822. [Google Scholar] [CrossRef]
  10. He, Y.S.; Zhang, M.D.; Zhou, W.X.; Ai, L.Q.; You, J.W.; Liu, H.H.; You, J.M.; Wang, H.; Wassie, M.; Wang, M.; et al. Transcriptome analysis reveals novel insights into the continuous cropping induced response in Codonopsis tangshen, a medicinal herb. Plant Physiol. Biochem. 2019, 141, 279–290. [Google Scholar] [CrossRef]
  11. Niu, Y.T.; Zhang, J.; Wang, H.Z.; Jin, L.; Du, T.; Song, P.S.; Zhao, W.L. Study on the suitability of Codonopsis pilosula. China J. Inf. Tradit. Chin. Med. 2021, 28, 13–16. [Google Scholar]
  12. Liao, C.L.; You, J.W. The Cultivation Technology of Medicinal Plants in Enshi, Hubei; Hubei Science and Technology Press: Enshi, China, 2006. [Google Scholar]
  13. Ashraf, M. Thermotolerance in plants: Potential physio-biochemical and molecular markers for crop improvement. Environ. Exp. Bot. 2021, 186, 104454. [Google Scholar] [CrossRef]
  14. Prasad, P.V.V.; Pisipati, S.R.; Mutava, R.N.; Tuinstra, M.R. Sensitivity of Grain Sorghum to High Temperature Stress during Reproductive Development. Crop. Sci. 2008, 48, 1911–1917. [Google Scholar] [CrossRef] [Green Version]
  15. Wang, X.M.; Hou, L.J.; Lu, Y.Z.; Wu, B.J.; Xue, G.; Liu, M.S.; Wang, J.; Sun, Q.X.; Elizabeth, V.; Xu, S.B. Metabolic adaptation of wheat grain contributes to a stable filling rate under heat stress. J. Exp. Bot. 2018, 69, 5531–5545. [Google Scholar] [CrossRef] [Green Version]
  16. Ma, G.J.; Zhang, M.D.; Xu, J.L.; Zhou, W.X.; Cao, L.W. Transcriptomic analysis of short-term heat stress response in Pinellia ternata provided novel insights into the improved thermotolerance by spermidine and melatonin. Ecotoxicol. Environ. Saf. 2020, 202, 110877. [Google Scholar] [CrossRef]
  17. Parrotta, L.; Aloisi, I.; Faleri, C.; Romi, M.; Del Duca, S.; Cai, G. Chronic heat stress affects the photosynthetic apparatus of Solanum lycopersicum L. cv Micro-Tom. Plant Physiol. Biochem. 2020, 154, 463–475. [Google Scholar] [CrossRef]
  18. Collado-González, J.; Piñero, M.C.; Otálora, G.; López-Marín, J.; del Amor, F.M. Exogenous spermidine modifies nutritional and bioactive constituents of cauliflower (Brassica oleracea var. botrytis L.) florets under heat stress. Sci. Hort-Amst. 2021, 277, 109818. [Google Scholar] [CrossRef]
  19. Hasanuzzaman, M.; Nahar, K.; Alam, M.; Roychowdhury, R.; Fujita, M. Physiological, Biochemical, and Molecular Mechanisms of Heat Stress Tolerance in Plants. Int. J. Mol. Sci. 2013, 14, 9643–9684. [Google Scholar] [CrossRef]
  20. Sharma, P.; Jha, A.; Dubey, R.; Pessarakli, M. Reactive Oxygen Species, Oxidative Damage, and Antioxidative Defense Mechanism in Plants under Stressful Conditions. J. Bot. 2012, 2012, 217037. [Google Scholar] [CrossRef] [Green Version]
  21. Baron, K.N.; Schroeder, D.F.; Stasolla, C. Transcriptional response of abscisic acid (ABA) metabolism and transport to cold and heat stress applied at the reproductive stage of development in Arabidopsis thaliana. Plant. Sci. 2012, 188–189, 48–59. [Google Scholar] [CrossRef]
  22. Sharma, E.; Borah, P.; Kaur, A.; Bhatnagar, A.; Mohapatra, T.; Kapoor, S.; Khurana, J.P. A comprehensive transcriptome analysis of contrasting rice cultivars highlights the role of auxin and ABA responsive genes in heat stress response. Genomics 2021, 113, 1247–1261. [Google Scholar] [CrossRef] [PubMed]
  23. Haider, S.; Iqbal, J.; Shaukat, M.; Naseer, S.; Mahmood, T. The epigenetic chromatin-based regulation of somatic heat stress memory in plants. Plant Gene 2021, 27, 100318. [Google Scholar] [CrossRef]
  24. Ohama, N.; Sato, H.; Shinozaki, K.; Yamaguchi-Shinozaki, K. Transcriptional Regulatory Network of Plant Heat Stress Response. Trends Plant Sci. 2017, 22, 53–65. [Google Scholar] [CrossRef]
  25. Sarkar, J.; Chakraborty, U.; Chakraborty, B. High-temperature resilience in Bacillus safensis primed wheat plants: A study of dynamic response associated with modulation of antioxidant machinery, differential expression of HSPs and osmolyte biosynthesis. Environ. Exp. Bot. 2021, 182, 104315. [Google Scholar] [CrossRef]
  26. Richter, K.; Haslbeck, M.; Buchner, J. The Heat Shock Response: Life on the Verge of Death. Mol. Cell 2010, 40, 253–266. [Google Scholar] [CrossRef] [PubMed]
  27. Dobrá, J.; Černý, M.; Štorchová, H.; Dobrev, P.; Skalák, J.; Jedelský, P.L.; Lukšanová, H.; Gaudinová, A.; Pešek, B.; Malbeck, J.; et al. The impact of heat stress targeting on the hormonal and transcriptomic response in Arabidopsis. Plant. Sci. 2015, 231, 52–61. [Google Scholar] [CrossRef] [PubMed]
  28. Waqas, M.; Shahzad, R.; Khan, A.L.; Asaf, S.; Kim, Y.H.; Kang, S.M.; Bilal, S.; Hamayun, M.; Lee, I.J. Salvaging effect of triacontanol on plant growth, thermotolerance, macro-nutrient content, amino acid concentration and modulation of defense hormonal levels under heat stress. Plant Physiol. Biochem. 2016, 99, 118–125. [Google Scholar] [CrossRef]
  29. Qi, Y.X.; Liu, Y.B.; Rong, W.H. RNA-Seq and its applications: A new technology for transcriptomics. Hereditas 2011, 33, 1191–1202. [Google Scholar] [CrossRef]
  30. Liu, H.B.; Shi, J.H.; Wu, M.K.; Xu, D.L. The application and future prospect of RNA-Seq technology in Chinese medicinal plants. J. Appl. Res. Med. Aromat. 2021, 24, 100318. [Google Scholar] [CrossRef]
  31. Grabherr, M.; Haas, B.; Yassour, M.; Levin, J.; Thompson, D.; Amit, I.; Adiconis, X.; Fan, L.; Raychowdhury, R.; Zeng, Q.D.; et al. Full-Length transcriptome assembly from RNA-Seq data without a reference genome. Nat. Biotechnol. 2011, 29, 644–652. [Google Scholar] [CrossRef] [Green Version]
  32. Li, B.; Dewey, C. RSEM: Accurate transcript quantification from RNA-Seq data with or without a reference genome. BMC Bioinform. 2011, 12, 93–99. [Google Scholar] [CrossRef] [PubMed] [Green Version]
  33. Love, M.; Huber, W.; Anders, S. Moderated estimation of fold change and dispersion for RNA-Seq data with DESeq2. Genome Biol. 2014, 15, 550. [Google Scholar] [CrossRef]
  34. Wu, T.Z.; Hu, E.Q.; Xu, S.B.; Chen, M.J.; Guo, P.F.; Dai, Z.H.; Feng, T.Z.; Zhou, L.; Tang, W.L.; Zhan, L.; et al. clusterProfiler 4.0: A universal enrichment tool for interpreting omics data. Innovation 2021, 2, 100141. [Google Scholar] [CrossRef] [PubMed]
  35. de Hoon, M.J.L.; Imoto, S.; Nolan, J.; Miyano, S. Open Source Clustering Software. Bioinformatics 2004, 20, 1453–1454. [Google Scholar] [CrossRef] [PubMed] [Green Version]
  36. Saldanha, A.J. Java Treeview-extensible visualization of microarray data. Bioinformatics 2004, 20, 3246–3248. [Google Scholar] [CrossRef] [Green Version]
  37. Li, H.Y.; Hu, T.; Amombo, E.; Fu, J.M. Transcriptome profilings of two tall fescue (Festuca arundinacea) cultivars in response to lead (Pb) stress. BMC Genomics 2017, 18, 145. [Google Scholar] [CrossRef] [Green Version]
  38. Livak, K.J.; Schmittgen, T.D. Analysis of Relative Gene Expression Data Using Real-Time Quantitative PCR and the 2−ΔΔCT Method. Methods 2001, 25, 402–408. [Google Scholar] [CrossRef]
  39. Pal, S.; Sharma, R. Transcription factors and chaperone proteins play a role in launching a faster response to heat stress and aggregation. Comput. Biol. Chem. 2021, 97, 107534. [Google Scholar] [CrossRef]
  40. Zhao, Q.; Zhou, L.J.; Liu, J.C.; Du, X.X.; Asad, M.A.U.; Huang, F.D.; Pan, G.; Cheng, F.M. Relationship of ROS accumulation and superoxide dismutase isozymes in developing anther with floret fertility of rice under heat stress. Plant Physiol. Bioch. 2018, 122, 90–101. [Google Scholar] [CrossRef]
  41. Wan, B.L.; Lin, Y.J.; Mou, T.M. Expression of rice Ca2+-dependent protein kinases (CDPKs) genes under different environmental stresses. Febs. Lett. 2007, 581, 1179–1189. [Google Scholar] [CrossRef] [Green Version]
  42. Asgary, S.; Karimi, R.; Pour, P.M.; Heydarpour, F.; Mostafaei, S.; Farzaei, M.H.; Moradi, S.; Aneva, I.Y. Is consumption of pomegranate supplementation effective on oxidative stress biomarkers including MDA, ox-LDL, POX 1, GPX, TAC, and TBRAS? A systematic review and meta-analysis of randomized controlled trials. Curr. Prob. Cardiol. 2022, 101198, in press. [Google Scholar] [CrossRef] [PubMed]
  43. Wassie, M.; Zhang, W.H.; Zhang, Q.; Ji, K.; Cao, L.W.; Chen, L. Exogenous salicylic acid ameliorates heat stress-induced damages and improves growth and photosynthetic efficiency in alfalfa (Medicago sativa L.). Ecotox. Environ. Saf. 2020, 191, 110206. [Google Scholar] [CrossRef] [PubMed]
  44. Larkindale, J.; Mishkind, M.; Vierling, E. Plant Responses to High Temperature. Plant Abiotic. Stress 2005, 100, 100–144. [Google Scholar]
  45. Sarkar, S.; Islam, A.K.M.A.; Barma, N.C.D.; Ahmed, J.U. Tolerance mechanisms for breeding wheat against heat stress: A review. S. Afr. J. Bot. 2021, 138, 262–277. [Google Scholar] [CrossRef]
  46. Wen, F.; Wu, X.Z.; Li, T.J.; Jia, M.L.; Liu, X.S.; Li, P.; Zhou, X.J.; Ji, X.X.; Yue, X.M. Genome-wide survey of heat shock factors and heat shock protein 70s and their regulatory network under abiotic stresses in Brachypodium distachyon. PLoS ONE 2017, 12, e0180352. [Google Scholar] [CrossRef] [Green Version]
  47. Singh, S.; Chopperla, R.; Shingote, P.; Chhapekar, S.S.; Deshmukh, R.; Khan, S.; Padaria, J.C.; Sharma, T.R.; Solanke, A.U. Overexpression of EcDREB2A transcription factor from finger millet in tobacco enhances tolerance to heat stress through ROS scavenging. J. Biotechnol. 2021, 336, 10–24. [Google Scholar] [CrossRef]
  48. Wei, S.W.; Zhang, L.; Huo, G.T.; Ge, G.J.; Luo, L.J.; Yang, Q.C.; Yang, X.; Long, P. Comparative transcriptomics and metabolomics analyses provide insights into thermal resistance in lettuce (Lactuca sativa L.). Sci. Hortic. 2021, 289, 110423. [Google Scholar] [CrossRef]
  49. Pucciariello, C.; Banti, V.; Perata, P. ROS signaling as common element in low oxygen and heat stresses. Plant Physiol. Bioch. 2012, 59, 3–10. [Google Scholar] [CrossRef] [Green Version]
  50. Balla, K.; Bencze, S.; Janda, T.; Veisz, O. Analysis of heat stress tolerance in winter wheat. Acta Agron. Hung. 2009, 57, 437–444. [Google Scholar] [CrossRef]
  51. Gad, M.; Ron, M. Could Heat Shock Transcription Factors Function as Hydrogen Peroxide Sensors in Plants? Ann. Bot. 2006, 98, 279–288. [Google Scholar]
  52. Timperio, A.M.; Egidi, M.G.; Zolla, L. Proteomics applied on plant abiotic stresses: Role of heat shock proteins (HSP). J. Proteom. 2008, 71, 391–411. [Google Scholar] [CrossRef] [PubMed]
  53. Wang, X.R.; Yan, B.; Shi, M.; Zhou, W.; Zekria, D.; Wang, H.Z.; Kai, G.Y. Overexpression of a Brassica campestris HSP70 in tobacco confers enhanced tolerance to heat stress. Protoplasma 2016, 253, 637–645. [Google Scholar] [CrossRef] [PubMed]
  54. Zhao, D.Q.; Xia, X.; Su, J.H.; Wei, M.R.; Wu, Y.Q.; Tao, J. Overexpression of herbaceous peony HSP70 confers high temperature tolerance. BMC Genom. 2019, 21, 70. [Google Scholar] [CrossRef] [PubMed]
  55. Huang, Y.Z.; Xuan, H.D.; Yang, C.F.; Guo, N.; Wang, H.T.; Zhao, J.M.; Xing, H. GmHsp90A2 is involved in soybean heat stress as a positive regulator. Plant Sci. 2019, 285, 26–33. [Google Scholar] [CrossRef]
  56. Dhakal, S.; Reiter, J.W.; Laroche, A.; Schultz, E.A. Leaf vein pattern response to heat and drought requires genes that influence PINFORMED1 localization and is mimicked by ABA treatment. Environ. Exp. Bot. 2021, 185, 104426. [Google Scholar] [CrossRef]
  57. Hays, D.B.; Do, J.H.; Mason, R.E.; Morgan, G.; Finlayson, S.A. Heat stress induced ethylene production in developing wheat grains induces kernel abortion and increased maturation in a susceptible cultivar. Plant Sci. 2007, 172, 1113–1123. [Google Scholar] [CrossRef]
  58. Larkindale, J.; Huang, B. Thermotolerance and antioxidant systems in Agrostis stolonifera: Involvement of salicylic acid, abscisic acid, calcium, hydrogen peroxide, and ethylene. J. Plant Physiol. 2004, 161, 405–413. [Google Scholar] [CrossRef]
  59. El-Bassiony, A.M.; Ghoname ElSayed, A.; el-awadi, M.; Fawzy, Z.; Gruda, N. Ameliorative Effects of Brassinosteroids on Growth and Productivity of Snap Beans Grown Under High Temperature. Gesunde Pflanz 2012, 64, 175–182. [Google Scholar] [CrossRef]
  60. Hu, Y.B.; Zhao, L.F.; Chong, K.; Wang, T. Overexpression of OsERF1, a novel rice ERF gene, up-regulates ethylene-responsive genes expression besides affects growth and development in Arabidopsis. J. Plant Physiol. 2008, 165, 1717–1725. [Google Scholar] [CrossRef]
  61. He, Y.H.; Xue, J.; Li, H.; Han, S.K.; Jiao, J.Q.; Rao, J.P. Ethylene response factors regulate ethylene biosynthesis and cell wall modification in persimmon (Diospyros kaki L.) fruit during ripening. Postharvest Biol. Tec. 2020, 168, 111255. [Google Scholar] [CrossRef]
  62. Zhang, H.N.; Pan, X.L.; Liu, S.H.; Lin, W.Q.; Li, Y.H.; Zhang, X.M. Genome-wide analysis of AP2/ERF transcription factors in pineapple reveals functional divergence during flowering induction mediated by ethylene and floral organ development. Genomics 2021, 113, 474–489. [Google Scholar] [CrossRef] [PubMed]
  63. Klay, I.; Gouia, S.; Liu, M.; Mila, I.; Khoudi, H.; Bernadac, A.; Bouzayen, M.; Pirrello, J. Ethylene Response Factors (ERF) are differentially regulated by different abiotic stress types in tomato plants. Plant Sci. 2018, 274, 137–145. [Google Scholar] [CrossRef]
  64. Choi, H.I.; Hong, J.H.; Ha, J.O.; Kang, J.Y.; Kim, S.Y. ABFs, a Family of ABA-responsive Element Binding Factors*. J. Biol. Chem. 2000, 275, 1723–1730. [Google Scholar] [CrossRef] [PubMed] [Green Version]
  65. Zhu, J.K. Abiotic Stress Signaling and Responses in Plants. Cell 2016, 167, 313–324. [Google Scholar] [CrossRef] [PubMed]
  66. Zhang, C.Y.; Li, C.; Liu, W.J.; Lv, Y.D.; Yu, C.S.; Li, H.Y.; Zhao, T.; Liu, B. The OsABF1 transcription factor improves drought tolerance by activating the transcription of COR413-TM1 in rice. J. Exp. Bot. 2017, 68, 4695–4707. [Google Scholar] [CrossRef] [PubMed] [Green Version]
  67. Wang, W.B.; Qiu, X.P.; Yang, Y.X.; Kim, H.S.; Jia, X.Y.; Yu, H.; Kwak, S.S. Sweetpotato bZIP Transcription Factor IbABF4 Confers Tolerance to Multiple Abiotic Stresses. Front. Plant Sci. 2019, 10, 630. [Google Scholar] [CrossRef] [Green Version]
  68. Li, J.B.; Zhao, S.; Yu, X.; Du, W.; Li, H.; Sun, Y.; Sun, H.; Ruan, C.J. Role of Xanthoceras sorbifolium MYB44 in tolerance to combined drought and heat stress via modulation of stomatal closure and ROS homeostasis. Plant Physiol. Bioch. 2021, 162, 410–420. [Google Scholar] [CrossRef]
  69. Guan, Q.M.; Yue, X.L.; Zeng, H.T.; Zhu, J.H. The Protein Phosphatase RCF2 and Its Interacting Partner NAC019 Are Critical for Heat Stress-Responsive Gene Regulation and Thermotolerance in Arabidopsis. Plant Cell 2014, 26, 438–453. [Google Scholar] [CrossRef] [Green Version]
  70. Chen, C.H.; Chen, X.Q.; Han, J.; Lu, W.L.; Ren, Z.H. Genome-wide analysis of the WRKY gene family in the cucumber genome and transcriptome-wide identification of WRKY transcription factors that respond to biotic and abiotic stresses. BMC Plant Biol. 2020, 20, 443. [Google Scholar] [CrossRef]
  71. Koini, M.A.; Alvey, L.; Allen, T.; Tilley, C.A.; Harberd, N.P.; Whitelam, G.C.; Franklin, K.A. High Temperature-Mediated Adaptations in Plant Architecture Require the bHLH Transcription Factor PIF4. Curr. Biol. 2009, 19, 408–413. [Google Scholar] [CrossRef] [Green Version]
  72. Srivastava, R.; Deng, Y.; Howell, S. Stress sensing in plants by an ER stress sensor/transducer, bZIP28. Front. Plant Sci. 2014, 5, 59. [Google Scholar] [CrossRef] [PubMed] [Green Version]
  73. Wu, Z.; Li, T.; Liu, X.Y.; Yuan, G.Z.; Hou, H.Z.; Teng, N.J. A novel R2R3-MYB transcription factor LlMYB305 from Lilium longiflorum plays a positive role in thermotolerance via activating heat-protective genes. Environ. Exp. Bot. 2021, 184, 104399. [Google Scholar] [CrossRef]
  74. Fu, Q.T.; Yu, D. Q Expression profiles of AtWRKY25, AtWRKY26 and AtWRKY33 under abiotic stresses. Yi Chuan 2010, 32, 848–856. [Google Scholar] [CrossRef] [PubMed]
  75. Deng, M.D.; Wang, Y.; Kuzma, M.; Chalifoux, M.; Tremblay, L.; Yang, S.J.; Ying, J.F.; Sample, A.; Wang, H.M.; Griffiths, R.; et al. Activation tagging identifies Arabidopsis transcription factor AtMYB68 for heat and drought tolerance at yield determining reproductive stages. Plant J. 2020, 104, 1535–1550. [Google Scholar] [CrossRef] [PubMed]
  76. Tang, N.; Zhang, H.; Li, X.H.; Xiao, J.H.; Xiong, L.Z. Constitutive activation of transcription factor OsbZIP46 improves drought tolerance in rice. Plant Physiol. 2012, 158, 1755–1768. [Google Scholar] [CrossRef] [Green Version]
  77. Xi, Y.; Ling, Q.Q.; Zhou, Y.; Liu, X.; Qian, Y.X. ZmNAC074, a maize stress-responsive NAC transcription factor, confers heat stress tolerance in transgenic Arabidopsis. Front. Plant Sci. 2022, 13, 986628. [Google Scholar] [CrossRef]
  78. Schulz, P.; Herde, M.; Romeis, T. Calcium-dependent protein kinases: Hubs in plant stress signaling and development. Plant Physiol. 2013, 163, 523–530. [Google Scholar] [CrossRef] [Green Version]
  79. Xu, J.; Tian, Y.S.; Peng, R.H.; Xiong, A.S.; Zhu, B.; Jin, X.F.; Gao, F.; Fu, X.Y.; Hou, X.L.; Yao, Q.H. AtCPK6, a functionally redundant and positive regulator involved in salt/drought stress tolerance in Arabidopsis. Planta 2010, 231, 1251–1260. [Google Scholar] [CrossRef]
  80. Saijo, Y.; Hata, S.; Kyozuka, J.; Shimamoto, K.; Izui, K. Over-expression of a single Ca2+-dependent protein kinase confers both cold and salt/drought tolerance on rice plants. Plant J. 2000, 23, 319–327. [Google Scholar] [CrossRef]
  81. Zhao, Y.L.; Du, H.W.; Wang, Y.K.; Wang, H.L.; Yang, S.Y.; Li, C.H.; Chen, N.; Yang, H.; Zhang, Y.H.; Zhu, Y.; et al. The calcium-dependent protein kinase ZmCDPK7 functions in heat-stress tolerance in maize. J. Integr. Plant Biol. 2021, 63, 510–527. [Google Scholar] [CrossRef]
Figure 1. Phenotypic, physiological and biochemical analysis of C. tangshen in response to heat stress. (A): Phenotypes of C. tangshen seedlings under normal conditions; (B): phenotypes of C. tangshen seedlings after 7 d heat treatment; (C): chlorophyll content; (D): electrolyte leakage (EL); (E): malondialdehyde (MDA) content. Four weeks old plants were kept under optimal moderate (22/18 °C) or high (38/35 °C) temperature treatments. There were three repeats for this experiment. The asterisks indicate significant differences based on one-way ANOVA with Fisher’s LSD test (**, p < 0.01).
Life 13 00168 g001
Figure 2. GO classification of assembled unigenes. The unigenes were annotated into the three main GO categories: biological process, cellular component, and molecular function.
Life 13 00168 g002
Figure 3. KOG annotation of assembled unigenes. The unigenes were annotated into twenty-five main classifications, including RNA processing and modification, chromatin structure and dynamics, energy production and conversion, amino acid transport, and metabolism, etc.
Life 13 00168 g003
Figure 4. KEGG classification of unigenes. The unigenes were annotated into five main classifications: cellular processes, environmental information processing, genetic information processing, metabolism, and organismal systems.
Life 13 00168 g004
Figure 5. Hierarchical clustering analysis of differentially expressed genes. The red color represents high expression levels, and blue represents low expression levels. The values besides the colors represented log2 (FPKM + 1).
Life 13 00168 g005
Figure 6. The statistics results of enriched GO terms. The unigenes were annotated into the three GO categories: biological process, cellular component, and molecular function.
Life 13 00168 g006
Figure 7. Clustering of the differentially expressed genes related to the representative gene category in heat treatment compared with CK. Red color denoted genes with high expression levels, while blue color indicated genes with low expression levels. The relative expression levels of DEGs were calculated using the log2 ratio.
Life 13 00168 g007
Figure 8. The qRT-PCR analysis of 10 DEGs in the leaves of heat-treated (Ht) and control (CK) plants.
Life 13 00168 g008
Figure 9. Differentially expressed genes (DEGs) related to plant hormone signal transduction in Ht vs. CK. The green frame indicated the downregulated gene, and red frame denoted the upregulated gene.
Life 13 00168 g009
Table 1. Statistical analysis of the sequencing data.
SampleTotal ReadsTotal
Bases
Clean ReadsClean
Bases
Q20 Rate (%)Q30 Rate (%)GC (%)
CK-145,863,9726,879,595,80044,915,0086,680,680,39897.8593.4644.94
CK-247,993,6647,199,049,60047,205,0207,025,130,94898.1094.0544.77
CK-353,683,1248,052,468,60052,814,7307,734,007,77198.0393.8744.67
average49,180,2537,377,038,00048,311,5867,146,606,37297.99 93.79 44.79
Ht-151,810,4647,771,569,60050,974,2727,534,318,72798.0293.8545.00
Ht-245,663,0966,849,464,40044,953,3646,625,104,74298.1094.0745.65
Ht-350,863,9207,629,588,00049,951,7667,400,820,96698.2294.4445.24
average49,445,8277,416,874,00048,626,4677,186,748,14598.11 94.1245.30
Table 2. Statistics of gene annotation by databases.
DatabaseKOGKEGGNRSwiss-ProtGOTotal UnigenesOverall Annotated
Gene Number19,21812,56330,13126,19319,54632,71930,464
Annotation Ratio0.58740.38400.92090.80050.5974-0.9311
Table 3. The upregulated CDPKs genes in heat treatment compared with CK.
Gene IDLog2 Ratiop-Valueq ValueGene Description
PB.23444.13.03450.000160.001745Calcium-dependent protein kinase 1 OS = Oryza sativa subsp. japonica OX = 39947 GN = CPK1 PE = 2 SV = 1
PB.16020.110.4825.72 × 10−182.04 × 10⁻¹⁶Calcium-dependent protein kinase 8 OS = Arabidopsis thaliana OX = 3702 GN = CPK8 PE = 1 SV = 1
PB.1840.11.16870.0079450.049257Calcium-dependent protein kinase 1 OS = Oryza sativa subsp. japonica OX = 39947 GN = CPK1 PE = 2 SV = 1
PB.15694.17.60791.11 × 10−61.79 × 10⁻⁵Calcium-dependent protein kinase 8 OS = Arabidopsis thaliana OX = 3702 GN = CPK8 PE = 1 SV = 1
PB.13451.13.05789.96 × 10−112.45 × 10⁻⁹Calcium-dependent protein kinase 1 OS = Arabidopsis thaliana OX = 3702 GN = CPK1 PE = 1 SV = 1
PB.12258.11.01920.000190.002038Calcium-dependent protein kinase 30 OS = Arabidopsis thaliana OX = 3702 GN = CPK30 PE = 1 SV = 1
PB.13498.11.00047.03 × 10−111.75 × 10⁻⁹Calcium-dependent protein kinase 8 OS = Arabidopsis thaliana OX = 3702 GN = CPK8 PE = 1 SV = 1
PB.23444.13.03450.000160.001745Calcium-dependent protein kinase 1 OS = Oryza sativa subsp. japonica OX = 39947 GN = CPK1 PE = 2 SV = 1
PB.16020.110.4825.72 × 10−182.04 × 10⁻¹⁶Calcium-dependent protein kinase 8 OS = Arabidopsis thaliana OX = 3702 GN = CPK8 PE = 1 SV = 1
PB.32683.12.46361.97 × 10−63.06 × 10⁻⁵Calcium-binding protein CML24 OS = Arabidopsis thaliana OX = 3702 GN = CML24 PE = 2 SV = 2
PB.25136.11.71802.06 × 10−84.12 × 10⁻⁷Probable calcium-binding protein CML46 OS = Arabidopsis thaliana OX = 3702 GN = CML46 PE = 1 SV = 1
PB.1840.11.16870.0079450.049257Calcium-dependent protein kinase OS = Oryza
sativa subsp. japonica OX = 39947 GN = CPK1 PE = 2 SV = 1
PB.31428.15.04033.81 × 10−704.27 × 10−68Probable calcium-binding protein CML40 OS = Arabidopsis thaliana OX = 3702 GN = CML40 PE = 2 SV = 1
PB.31509.18.202700Probable calcium-binding protein CML44 OS = Arabidopsis thaliana OX = 3702 GN = CML44 PE = 2 SV = 2
PB.15694.17.60791.11 × 10−61.79 × 10⁻⁵Calcium-dependent protein kinase 8 OS = Arabidopsis thaliana OX = 3702 GN = CPK8 PE = 1 SV = 1
PB.13451.13.05789.96 × 10−112.45 × 10⁻⁹Calcium-dependent protein kinase 1 OS = Arabidopsis thaliana OX = 3702 GN = CPK1 PE = 1 SV = 1
PB.12258.11.01920.000190.002038Calcium-dependent protein kinase 30 OS = Arabidopsis thaliana OX = 3702 GN = CPK30 PE = 1 SV = 1
PB.14842.13.91401.78 × 10−2417.04 × 10−239Calcium-dependent protein kinase 8 OS = Arabidopsis thaliana OX = 3702 GN = CPK8 PE = 1 SV = 1
PB.13498.11.00047.03 × 10−111.75 × 10⁻⁹Calcium-dependent protein kinase 8 OS = Arabidopsis thaliana OX = 3702 GN = CPK8 PE = 1 SV = 1
Table 4. The upregulated bZIP TFs in heat treatment compared with CK.
Gene IDLog2 Ratiop-Valueq-ValueGene Description
PB.6276.13.43121.57 × 10−802.10 × 10−78bZIP transcription factor 17 OS = Arabidopsis thaliana OX = 3702 GN = BZIP17 PE = 1 SV = 2
PB.22986.13.34791.30 × 10−82.66 × 10⁻⁷ABSCISIC ACID-INSENSITIVE 5-like protein 5 OS = Arabidopsis thaliana OX = 3702 GN = ABF2 PE = 1 SV = 1
PB.21759.13.26782.75 × 10−873.94 × 10⁻⁸bZIP transcription factor 17 OS = Arabidopsis thaliana OX = 3702 GN = BZIP17 PE = 1 SV = 2
PB.19784.12.94574.47 × 10−151.40 × 10⁻¹³bZIP transcription factor 17 OS = Arabidopsis thaliana OX = 3702 GN = BZIP17 PE = 1 SV = 2
PB.30413.12.21211.54 × 10−501.27 × 10−48bZIP transcription factor 53 OS = Arabidopsis thaliana OX = 3702 GN = BZIP53 PE = 1 SV = 1
PB.20861.11.11846.48 × 10−81.22 × 10⁻⁶Probable transcription factor PosF21 OS = Arabidopsis thaliana OX = 3702 GN = POSF21 PE = 2 SV = 1
Table 5. The upregulated NAC TFs in heat treatment compared with CK.
Gene IDLog2 Ratiop-Valueq-ValueGene Description
PB.15241.18.36231.41 × 10−93.15 × 10⁻⁸NAC domain-containing protein 91 OS = Arabidopsis thaliana OX = 3702 GN = NAC091 PE = 1 SV = 1
PB.12957.18.14206.04 × 10−101.40 × 10⁻⁸NAC domain-containing protein 78 OS = Arabidopsis thaliana OX = 3702 GN = NAC078 PE = 2 SV = 2
PB.31443.14.79421.32 × 10−912.01 × 10−89NAC domain-containing protein 2 OS = Arabidopsis thaliana OX = 3702 GN = NAC002 PE = 1 SV = 2
PB.25504.14.30261.63 × 10−2305.91 × 10−228NAC domain-containing protein 2 OS = Solanum lycopersicum OX = 4081 GN = NAP2 PE = 2 SV = 1
PB.27680.13.63232.95 × 10−733.49 × 10−71NAC domain-containing protein JA2L OS = Solanum lycopersicum OX = 4081 GN = JA2L PE = 2 SV = 1
PB.29002.13.38757.42 × 10−1561.85 × 10−153NAC domain-containing protein 2 OS = Arabidopsis thaliana OX = 3702 GN = NAC002 PE = 1 SV = 2
PB.29160.13.19969.66 × 10−2253.41 × 10−222NAC domain-containing protein 2 OS = Arabidopsis thaliana OX = 3702 GN = NAC002 PE = 1 SV = 2
PB.12308.12.60772.87 × 10−823.91 × 10−80NAC domain-containing protein 78 OS = Arabidopsis thaliana OX = 3702 GN = NAC078 PE = 2 SV = 2
PB.17150.11.73930.0071780.045244NAC domain-containing protein 17 OS = Arabidopsis thaliana OX = 3702 GN = NAC017 PE = 2 SV = 1
PB.12444.11.40193.30 × 10−149.93 × 10⁻¹³NAC domain-containing protein 82 OS = Arabidopsis thaliana OX = 3702 GN = NAC082 PE = 1 SV = 1
PB.23584.11.20425.20 × 10−131.48 × 10⁻¹¹NAC domain-containing protein 53 OS = Arabidopsis thaliana OX = 3702 GN = NAC053 PE = 2 SV = 1
Table 6. The upregulated WRKY TFs in heat treatment compared with CK.
Gene IDLog2 Ratiop-Valueq-ValueGene Description
PB.28576.12.13074.14 × 10−50.000509Probable WRKY transcription factor 41 OS = Arabidopsis thaliana OX = 3702 GN = WRKY41 PE = 2 SV = 2
PB.9306.12.75007.58 × 10−152.35 × 10⁻¹³Probable WRKY transcription factor 46 OS = Arabidopsis thaliana OX = 3702 GN = WRKY46 PE = 1 SV = 1
PB.26632.11.20388.50 × 10−122.24 × 10⁻¹⁰Probable WRKY transcription factor 40 OS = Arabidopsis thaliana OX = 3702 GN = WRKY40 PE = 1 SV = 1
PB.17400.11.84841.52 × 10−144.65 × 10⁻¹³Probable WRKY transcription factor 53 OS = Arabidopsis thaliana OX = 3702 GN = WRKY53 PE = 1 SV = 1
PB.27665.11.17630.0002310.002425Probable WRKY transcription factor 40 OS = Arabidopsis thaliana OX = 3702 GN = WRKY40 PE = 1 SV = 1
PB.31800.11.43880.0006960.006323Probable WRKY transcription factor 75 OS = Arabidopsis thaliana OX = 3702 GN = WRKY75 PE = 2 SV = 1
PB.9501.11.27912.97 × 10−50.000375F-box/LRR-repeat protein 3 OS = Arabidopsis thaliana OX = 3702 GN = FBL3 PE = 2 SV = 1
PB.30350.12.12581.62 × 10−511.36 × 10−49Probable WRKY transcription factor 70 OS = Arabidopsis thaliana OX = 3702 GN = WRKY70 PE = 1 SV = 1
PB.28576.12.13074.14 × 10−50.000509Probable WRKY transcription factor 41 OS = Arabidopsis thaliana OX = 3702 GN = WRKY41 PE = 2 SV = 2
Table 7. The downregulated bHLH TFs in Heat treatment compared with CK.
Gene IDLog2 Ratiop-Valueq-ValueGene Description
PB.28723.1−1.39562.71 × 10−74.75 × 10⁻⁶Transcription factor bHLH30 OS = Arabidopsis thaliana OX = 3702 GN = BHLH30 PE = 1 SV = 1
PB.8767.1−1.65983.01 × 10−171.04 × 10⁻¹⁵Transcription factor bHLH74 OS = Arabidopsis thaliana OX = 3702 GN = BHLH74 PE = 1 SV = 1
PB.30938.1−1.40281.41 × 10−113.69 × 10⁻¹⁰Transcription factor bHLH147 OS = Arabidopsis thaliana OX = 3702 GN = BHLH147 PE = 1 SV = 1
Disclaimer/Publisher’s Note: The statements, opinions and data contained in all publications are solely those of the individual author(s) and contributor(s) and not of MDPI and/or the editor(s). MDPI and/or the editor(s) disclaim responsibility for any injury to people or property resulting from any ideas, methods, instructions or products referred to in the content.

