Abstract
Previous study revealed that isocitrate dehydrogenase (NADP (+)) 2, mitochondrial (IDH2), lactate dehydrogenase A (LDHA), and lactate dehydrogenase B (LDHB) genes were significantly differentially expressed in liver tissues of Holstein cows among different lactation periods and associated with lipid and protein metabolism; hence, they were considered as candidates for milk production traits. Herein, the genetic effects of the three genes on milk yield, fat, and protein traits were studied by association analysis using 926 Chinese Holstein cows from 45 sire families. As a result, five single nucleotide polymorphisms (SNPs) in IDH2, one in LDHA, and three in LDHB were identified by re-sequencing, and subsequently, they were genotyped in 926 Chinese Holstein cows by genotyping by target sequencing (GBTS). With the animal model, single-locus association analysis revealed that four SNPs in IDH2 and one SNP in LDHA were significantly associated with milk, fat, and protein yields (p ≤ 0.0491), and three SNPs in LDHB were associated with milk yield, milk fat yield, and fat percentage (p ≤ 0.0285). Further, four IDH2 SNPs were found to form a haplotype block significantly associated with milk yield, fat yield, protein yield, and protein percentage (p ≤ 0.0249). In addition, functional predictions indicated that one SNP in LDHA, g.26304153G>A, may affect transcription factor binding and two SNPs, g.88544541A>G and g.88556310T>C could alter LDHB mRNA secondary structure. In summary, this study profiled the significant genetic effects of IDH2, LDHA, and LDHB on milk yield and composition traits and provided referable genetic markers for genomic selection programs in dairy cattle.
1. Introduction
Milk, as a crucial dietary component in the human diet, serves as a significant source of essential nutrients, providing ample high-quality proteins and energy for the human body [1]. In modern times, there is a growing demand for higher-quality milk due to increased interest in nutrition and better health. This has made improving both the quality and quantity of milk production a pressing concern. The milk production traits in dairy cattle breeding are primarily governed by polygenic regulation involving minor-effect genes [2]. So far, substantial-associated variants have been detected in dairy cattle, with 7411, 18,171, and 20,873 loci for milk yield, protein, and lipid composition, respectively (28 April 2024, http://www.animalgenome.org/cgi-bin/QTLdb/). Only three genes with large to moderate effects, namely diacylglycerol O-acyltransferase 1 (DGAT1) [3,4], growth hormone receptor (GHR) [5], and ATP-binding cassette subfamily G member 2 (ABCG2) [6], were confirmed as predominantly causative genes underlying milk composition in dairy cattle. In the early stage, several candidate functional genes and loci associated with milk production traits were explored by previous studies [7,8,9,10], and further exploration in this field is needed.
Since 2009, the application of genomic selection (GS) has played a pivotal role in addressing the challenge of slow genetic improvement in dairy cattle through the more accurate and earlier selection of individuals with superior milk production characteristics in breeding programs [11]. Previous studies have shown that adding known functional gene information to SNP marker data can improve the accuracy of genomic breeding value prediction [12,13]. Therefore, it is of great significance to mine and screen functional genes affecting milk production traits.
In previous research, transcriptomes and proteomes studies were conducted on liver tissues from Holstein cows during the dry period, early lactation, and peak of lactation and identified nine candidate functional proteins/genes associated with milk production traits, with a particular focus on three genes, isocitrate dehydrogenase (NADP (+)) 2, mitochondrial (IDH2), lactate dehydrogenase A (LDHA), and lactate dehydrogenase B (LDHB) that played critical roles in the glycolytic process, pyruvate and energy metabolism, and the glucagon signaling pathway [14]. IDH2 is involved in the decarboxylation of isocitrate to α-ketoglutarate, a process that is closely linked to fatty acid biosynthesis [15]. Both LDHA and LDHB genes belong to the lactate dehydrogenase family and are involved in the anaerobic glycolysis process under anaerobic conditions thereby associated with lipid production [16,17,18,19]. In addition, the IDH2 gene is located near the peaks of the reported quantitative trait loci (QTLs) for milk yield and protein percentage [20,21] with a distance of 0.52~3.69 cM on BAT21. LDHA is within the known QTL regions for milk yield (6.93 Mb to the peak) as well as close to the two SNPs, ARS-BFGL-NGS-24998 (0.17 Mb) associated with milk protein percentage and UA-IFASA-8605 (4.35 Mb) associated with milk fat yield, fat percentage and protein percentage identified by GWAS [18]. LDHB is 0.31~4.35 Mb to eight SNPs, BTA-10187-rs29015749 (0.31 Mb), BTB-01267305 (0.44 Mb), Hapmap59202-rs29011704 (1.12 Mb), Hapmap60862-rs29018508 (2.34 Mb), BTA-74498-no-rs (2.98 Mb), Hapmap48069-BTA-74468 (3.35 Mb), BFGL-NGS-116999 (4.24 Mb), and BTA-74479-no-rs (4.35 Mb) that were significantly associated with milk traits [22].
Until now, no correlation between these three genes and milk traits has been reported. Consequently, the purpose of this study was to systematically identify genetic variances within the IDH2, LDHA, and LDHB genes and evaluate their impact on milk yield and composition traits in the Chinese Holstein population. Potential functional mutations were proposed, as well as providing valuable genetic markers for genome selection programs.
2. Materials and Methods
2.1. Animals and Phenotypes Data Collection
The animals used in this study comprised 926 Chinese Holstein cows who were the daughters of 45 sires and were from 22 dairy farms belonging to Beijing Sunlon Livestock Development Co., Ltd. (Beijing, China). All cows were under uniform feeding conditions and conducted regular standardized performance testing for dairy herd improvement (DHI). The body condition score (BSC) is regularly monitored to assess reproductive parameters, including pregnancy rates and calving intervals, to assess fertility. Phenotypic values of 305-day milk yield, fat yield, fat percentage, protein yield, and protein percentage during first (926 cows) and second (632 cows) lactations were provided by the Beijing Dairy Cattle Centre (Beijing, China) and the descriptive statistics of these data are shown in Supplementary Table S1.
2.2. DNA Extraction and Quality Control
The genomic DNAs from the 45 semen and 926 blood samples were extracted using the salt-out procedures and TIANamp Blood DNA Kits (Tiangen, Beijing, China), respectively. The quantity and quality of the extracted DNA samples were, respectively, measured by a NanoDrop 2000 Spectrophotometer (Thermo Scientific, Hudson, DE, USA) and 1% agarose gel electrophoresis.
2.3. SNP Identification and Genotyping
A total of 28 primers (Supplementary Table S2) were designed to amplify the entire coding region and 2000 bp of up/downstream flanking regions of IDH2, LDHA and LDHB genes with Primer 3 version 0.4.0 (http://bioinfo.ut.ee/primer3-0.4.0/, accessed on 15 January 2024) based on the genomic sequence of the bovine IDH2 (GenBank accession no.: NC_037348.1), LDHA (GenBank accession no.: NC_037356.1) and LDHB (GenBank accession no.: NC_037332.1). The primers were synthesized by Beijing Genomics Institute (BGI, Beijing, China). Two DNA pools were randomly constructed and used for all the polymerase chain reactions (PCR), and each pool had 22–23 semen DNAs with equal concentration (50 ng/μL) per sample. The final reaction volume of PCR included 2 μL genomic DNA (50 ng/μL), 1.25 μL of each primer (10 pmol/μL), 12.5 μL Premix TaqTM (Takara, Dalian, China) and 8 μL RNase-free deionized water (Tiangen, Beijing, China). PCR conditions were as follows: initial denaturation at 94 °C for 5 min, followed by 35 cycles at 94 °C for 30 s, 60 °C for 30 s, 72 °C for 30 s, and a final extension at 72 °C for 7 min. After the amplification, the purified PCR products were bi-directionally sequenced in Beijing Qinke Xinye Biotechnology Co., Ltd. (Beijing, China), and the sequences were analyzed by CHROMAS (version 2.23) and NCBI-BLAST+2.15.0 (https://blast.ncbi.nlm.nih.gov/Blast.cgi, accessed on 20 January 2024) to detect the potential SNPs. The genotyping by target sequencing (GBTS) technology was used to genotype the identified SNPs in 926 cows by Shijiazhuang Breeding Biotechnology Co., Ltd. (Shijiazhuang, Hebei, China).
2.4. Estimation of Linkage Disequilibrium
As for the identified SNPs of each gene, the extent of Linkage Disequilibrium (LD) was estimated by the Haploview 4.2 (Broad Institute of MIT and Harvard, Cambridge, MA, USA). The D’ value is proportional to the degree of LD, and haplotypes with frequencies greater than 0.05 were retained.
2.5. Association Analysis
The association analyses between SNPs and/or haplotype blocks and the five milk production traits on first or second lactation were conducted by SAS 9.4 mixed procedure using the following animal model:
For each trait, y is the phenotypic value of each cow; μ is the overall mean; HYS is the fixed effect of farm (1–22: 22 farms), year (1–4: 2012–2015), and season (1, April–May; 2, June–August; 3, September–November; and 4, December–March); M is the age of calving as a covariant; b is the regression coefficient of covariant M; G is the genotype or haplotype combination effect; a is the individual random additive genetic effect, distributed as with the additive genetic variance ; and e is the random residual, distributed as with identity matrix I and residual error variance . Bonferroni correction was applied for multiple testing, and the significant level of the multiple tests was equal to the raw p value divided by the number of tests. A statistically significant association was considered distinct from a null effect if the raw p value is less than 0.05/n, where n is the number of genotypes or haplotype combinations. Meanwhile, the additive effect (a), dominant effect (d), and substitution effect (α) were calculated as follows: ; ; , where, AA, BB, and AB are the least square means of the milk production traits in the corresponding genotypes, p and q are the frequency of allele A and allele B, respectively.
2.6. Biological Function Prediction
The JASPAR database (http://jaspar.genereg.net/, accessed on 10 March 2024) was used to predict alterations in transcription factor binding sites (TFBSs) caused by SNPs in the 5′ regulatory regions of the IDH2, LDHA, and LDHB genes (relative score ≥ 0.90).
RNAfold Web Server (http://rna.tbi.univie.ac.at/cgi-bin/RNAWebSuite/RNAfold.cgi, accessed on 25 March 2024) was utilized to predict the changes in mRNA secondary structure for SNPs in untranslated region (UTR) and exon regions. The minimum free energy (MFE) of the optimal secondary structure reflects the stability of mRNA structure. A lower MFE value indicates greater stability in the mRNA structure.
3. Results
3.1. SNPs Identification in IDH2, LDHA and LDHB Genes
Five SNPs were identified in the IDH2 gene, one SNP in the LDHA gene, and three SNPs in the LDHB gene. Specifically, within the IDH2 gene, two SNPs (g.21496168A>G and g.21494708C>G) were located in the 5′ flanking region, two SNPs (g.21482140C>T and g.21479397C>T) were identified in introns, and one SNP (g.21478496G>A) was present in the 3′ flanking region. For the LDHA gene, g.26304153G>A was identified in the 5′ flanking region. In the LDHB gene, three SNPs (g.88543276A>G, g.88544541A>G, and g.88556310T>C) were detected in the 5′ flanking region, exon 1, and exon 4, respectively, with g.88544541A>G and g.88556310T>C being synonymous mutations. The genotypic and allelic frequencies of all identified SNPs are summarized in Table 1.

Table 1.
Detailed information of nine SNPs identified in IDH2, LDHA, and LDHB genes.
3.2. Association Analysis between SNP/Haplotype Block and Five Milk Traits
The genetic association between the nine SNPs of IDH2, LDHA, and LDHB and five milk production traits in dairy cows was analyzed (Table 2). In IDH2, two SNPs (g.21496168A>G and g.21494708C>G) were significantly associated with milk, fat, and protein yields in both the first and second lactations (p ≤ 0.0491). Two other SNPs (g.21482140C>T and g.21479397C>T) exhibited significant associations on milk, fat, and protein yields in the first lactation (p ≤ 0.0102), and with five milk traits in the second lactation (p ≤ 0.0058). SNP g.21478496G>A was significantly associated with milk, fat, and protein yields, as well as fat percentage, in the second lactation (p ≤ 0.0052). SNP g.26304153G>A in the LDHA gene was significantly associated with fat yield in the first lactation (p ≤ 0.0146) and milk, fat, and protein yields in the second lactation (p ≤ 0.0159). For the LDHB gene, SNPs g.88543276A>G and g.88556310T>C displayed significant associations with fat yield in the first lactation (p ≤ 0.0285) and with milk yield and fat percentage in the second lactation (p ≤ 0.0254). SNP g.88544541A>G was significantly associated with milk yield, fat yield, fat percentage, and protein yield in the second lactation (p ≤ 0.0023). Further results on the additive, dominant, and substitution effects of the SNPs in the IDH2, LDHA, and LDHB genes are presented in Supplementary Table S3.
Table 2.
Associations of the SNPs in IDH2, LDHA, and LDHB genes with milk production traits in two lactations in Chinese Holstein (LSM ± SE).
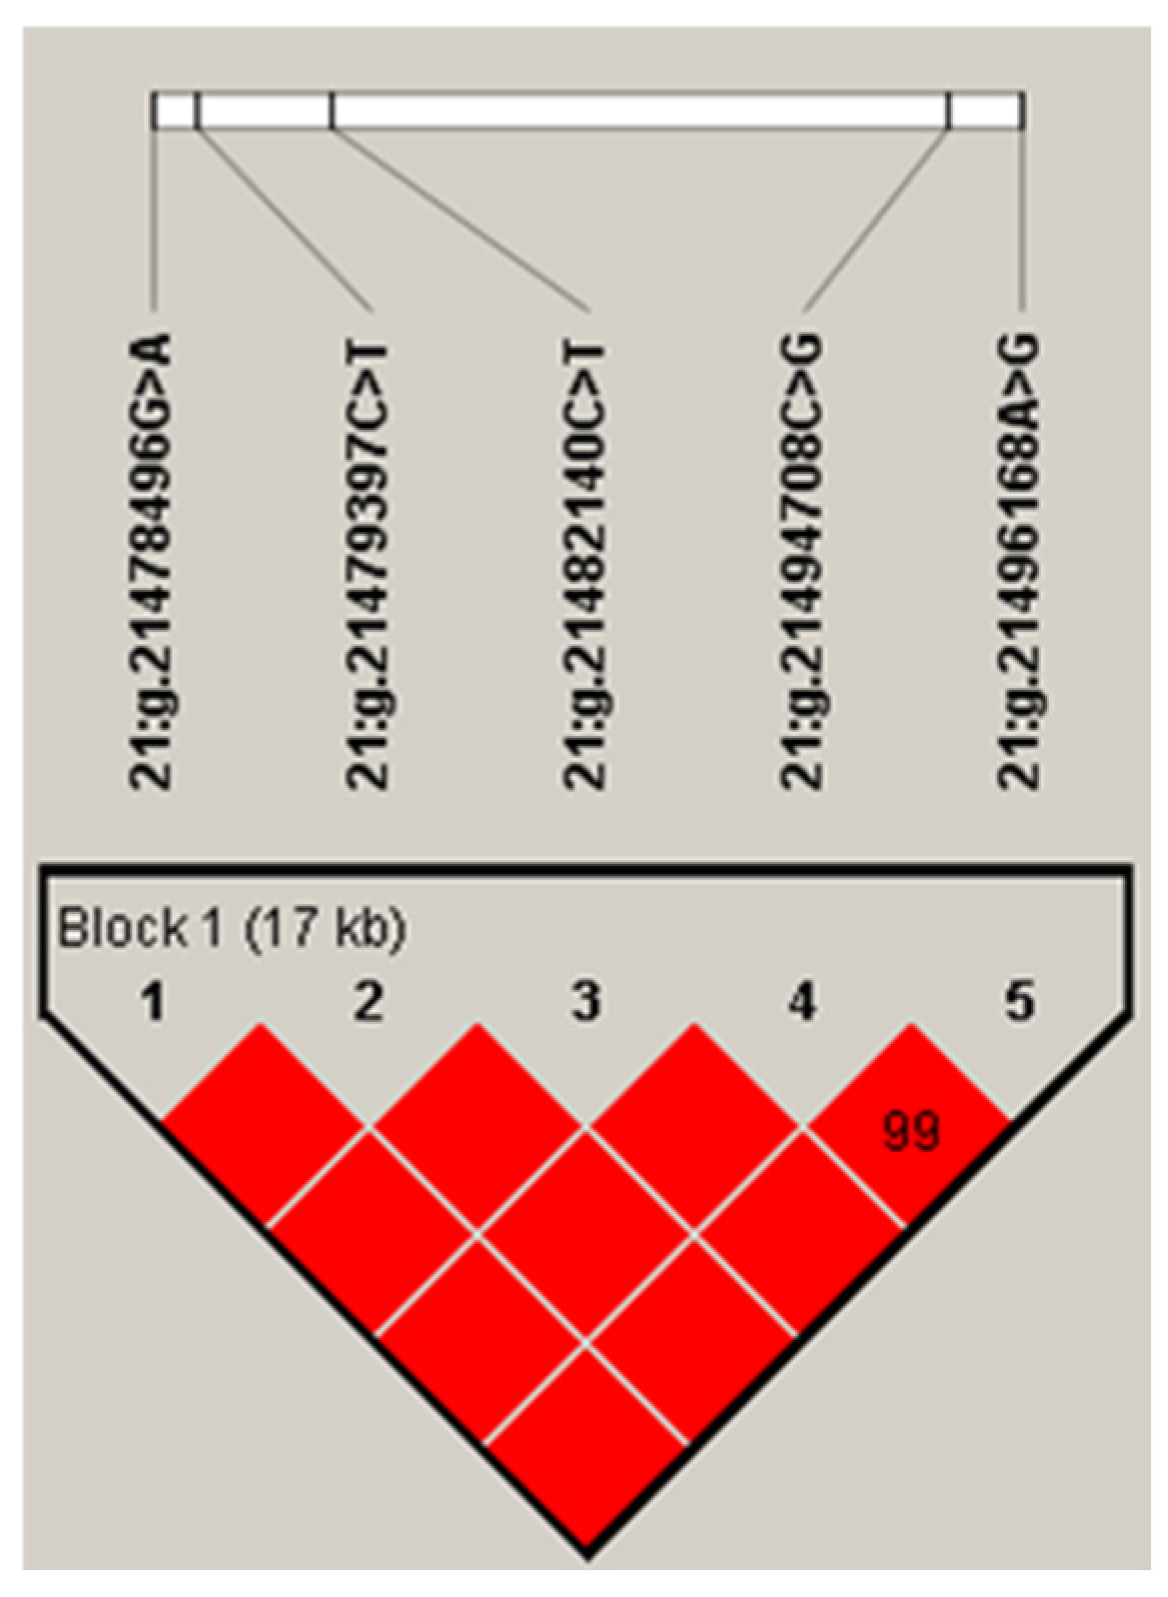
The five SNPs in the IDH2 gene had a strong linkage, forming a haplotype block (D′ = 0.99; Figure 1). The frequency of the four haplotypes, H1 (ACCGA), H2 (ACCCG), H3 (GTTCG), and H4 (GCCCG), were 50.2%, 30.1%, 14.8%, and 4.4%, respectively. Haplotype-based association analysis showed that the haplotype block was significantly associated with milk, fat, and protein yields, and protein percentage in first lactation (p ≤ 0.007), and milk and fat yields, and protein percentage in second lactation (p ≤ 0.0249; Table 3).
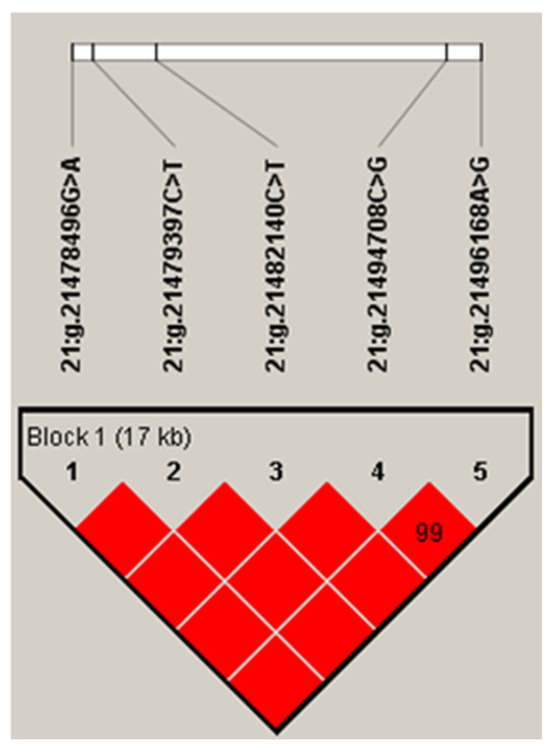
Figure 1.
Linkage disequilibrium estimated between SNPs in IDH2 gene (D′ ≥ 0.99–1.00). The block indicates haplotype block, and the text above the horizontal numbers is the SNP names. The values in boxes are pairwise SNP correlations (D′), while bright red boxes indicate complete LD (D′ = 1).
Table 3.
Haplotypes analysis of IDH2 gene (LSM ± SE).
3.3. Effects of SNP Mutations on Gene Transcriptional Activity
Changes in transcription factor binding sites (TFBS) were predicted for four SNPs located in the 5′ flanking regions of the IDH2, LDHA, and LDHB genes (Table 4). The allele A of g.21496168A>G of IDH2 was predicted to create binding site (BS) for transcription factor (TF) ETS1 (relative score (RS) = 0.97), allele G of g.21494708C>G of IDH2 for TFAP2E (RS = 0.92), allele G of g.26304153G>A of LDHA for THAP1 (RS = 0.90), allele A of g.88543276A>G of LDHB for PDX1 (RS = 0.90) and HOXA5 (RS = 0.93), and allele G of g.88543276A>G of LDHB for GATA1 (RS = 0.95), GATA2 (RS = 0.91) and TCF7 (RS = 0.95).
Table 4.
Transcription factor binding sites (TFBSs) prediction for IDH2, LDHA, and LDHB genes.
3.4. mRNA Structural Variations Caused by Synonymous Mutation
The secondary structure of mRNA was predicted for two SNPs in the UTR and exon regions of the LDHB gene (Table 5). The results indicated that substituting G for A in g.88544541A>G led to a decrease in the MFE of mRNA secondary structure, resulting in increased stability of LDHB. Similarly, when T replaced C in g.88556310T>C, the MFE of mRNA secondary structure decreased, leading to enhanced stability of LDHB expression.
Table 5.
The minimum free energy (MFE) values of optimal secondary structure of LDHB mRNA.
4. Discussion
Based on previous transcriptomes and proteomes studies in the liver from different lactation periods that identified the IDH2, LDHA, and LDHB genes as promising candidates for milk production traits in dairy cattle, this study further confirmed these genes have significant genetic effects on milk yield and compositions.
The IDH2 is a mitochondrial enzyme that assumes a pivotal role in cellular metabolism by catalyzing the oxidative decarboxylation of isocitrate to yield α-ketoglutarate and NADPH within the Krebs cycle [23]. This enzyme is believed to have critical functions in glucose metabolism, fatty acids metabolism, and glutamine metabolism [24,25]. Research has revealed that IDH2 knockout results in insulin resistance (IR) and suppressed hepatic lipogenesis and inflammation [26,27]. In ruminants, lactate serves as a crucial glucogenic substrate for gluconeogenesis, and the key enzymes involved in this pathway are lactate dehydrogenase (LDHA and LDHB), which catalyzes the bidirectional conversion of pyruvate and lactic acid [28,29]. In the context of early lactation cows with ketosis, Xu et al. have proposed that the upregulated expression of LDHA may prevent excessive loss of adipose tissue, thereby preserving energy reserves during this period [30]. An extensive analysis of LDHB expression across various tissues unveiled that the gene is predominantly expressed in adipose tissues, suggesting a probable role for LDHB in fat deposition processes [31]. These studies collectively point to the IDH2, LDHA, and LDHB genes as crucial regulators of lipid metabolism, aligning with the results of this study, which demonstrate their significant impact on milk fat traits.
Transcription factors (TFs), a crucial class of protein molecules, may potentially cause variations in gene expression among individuals with different genotypes [32]. In this study, for instance, the TF THP1 disappeared when the allele G mutated to A of g.26304153G>A of the LDHA. Previous studies have shown that THAP1 could enhance the transcriptional activity of target genes [33], and the loss of this regulatory effect could explain the phenotypic data, where cows with genotype AA had lower fat yield than those with genotype GG. This suggests that the positive genetic effects of allele G on milk production traits may be due to the activation of LDHA expression by THAP1. This finding highlights g.26304153G>A as a potentially critical mutation affecting milk fat traits, warranting further in-depth exploration.
The mRNA secondary structure can regulate gene expression by affecting the stability of RNA molecules, the efficiency of translation, and the activity of regulatory proteins [34,35,36,37]. It was observed that when the allele was either G at g.88544541A>G or T at g.88556310T>C, the mRNA secondary structure stability of LDHB was both lower than that of allele A or C, suggesting that the mRNA expression of LDHB may be more stable with alleles G or T. Combined with previous studies indicating the possible involvement of the LDHB gene in lipid metabolism, these findings suggest that the G or T alleles may be favorable for the development of milk fat traits. In this study, the milk fat phenotype of cows with genotypes GG and TT was relatively higher than that of AA and CC. These results indicate that the enhanced mRNA stability associated with alleles G and T may positively influence LDHB expression, ultimately contributing to improved milk fat production. The discovery of these allele-specific effects on gene expression underscores their potential importance in breeding programs focused on enhancing milk fat traits, meriting further research.
5. Conclusions
In conclusion, through phenotype–genotype association analysis, this study first demonstrated that the IDH2, LDHA, and LDHB genes have significant impacts on milk yield and composition traits in the Holstein cattle population. The SNP g.26304153G>A in 5′ flanking region regulates the transcriptional activity of the LDHA gene by changing the binding site of transcription factor THAP1, and SNPs g.88544541A>G and g.88556310T>C alter the stability of LDHB mRNA secondary structure, implying these SNPs may be potential causal mutations. The findings provided valuable genetic markers for genomic selection programs in dairy cattle.
Supplementary Materials
The following supporting information can be downloaded at: https://www.mdpi.com/article/10.3390/life14101228/s1, Table S1: Descriptive statistics of the phenotypic values for milk production traits in two lactations; Table S2: Primers for PCR used in SNPs identification of IDH2, LDHB, and LDHA genes; Table S3: Additive, dominant, and allele substitution effects of 10 SNPs in IDH2, LDHB, and LDHA on milk yield and composition traits in Chinese Holstein cattle during two lactations.
Author Contributions
Conceptualization, D.S.; methodology, Y.S. and L.X.; validation, Z.W.; formal analysis, Y.S.; investigation, Y.S. and Z.W.; resources, D.S.; data curation, Y.S. and B.H.; writing—original draft preparation, Y.S.; writing—review and editing, B.H. and D.S.; supervision, B.H.; project administration, D.S.; funding acquisition, D.S. All authors have read and agreed to the published version of the manuscript.
Funding
This research was funded by the National Key R&D Program of China (2021YFF1000700); the S&T Program of Hebei (22326321D); Science and Technology Program of Inner Mongolia Autonomous Region (2021GG0102); STI 2030-Major Projects (2023ZD04069); Key R & D project of Ningxia Hui Autonomous Region (2021BEF02018) and the Program for Changjiang Scholar and Innovation Research Team in University (IRT_15R62).
Institutional Review Board Statement
The study was conducted in accordance with the Guide for the Care and Use of Laboratory Animals and approved by the Institutional Animal Care and Use Committee (IACUC) at China Agricultural University (Beijing, China; permit number: DK996).
Informed Consent Statement
Not applicable.
Data Availability Statement
The datasets generated and/or analyzed during the current study are available in the article and Supplementary Materials.
Acknowledgments
We appreciate the Beijing Dairy Cattle Center for providing the semen and blood samples and phenotypic data.
Conflicts of Interest
The authors declare no conflicts of interest.
References
- Cimmino, F.; Catapano, A.; Petrella, L.; Villano, I.; Tudisco, R.; Cavaliere, G. Role of Milk Micronutrients in Human Health. Front. Biosci. 2023, 28, 41. [Google Scholar] [CrossRef] [PubMed]
- Gross, J.J. Limiting Factors for Milk Production in Dairy Cows: Perspectives from Physiology and Nutrition. J. Anim. Sci. 2022, 100, skac044. [Google Scholar] [CrossRef] [PubMed]
- Grisart, B.; Farnir, F.; Karim, L.; Cambisano, N.; Kim, J.-J.; Kvasz, A.; Mni, M.; Simon, P.; Frère, J.-M.; Coppieters, W.; et al. Genetic and Functional Confirmation of the Causality of the DGAT1 K232A Quantitative Trait Nucleotide in Affecting Milk Yield and Composition. Proc. Natl. Acad. Sci. USA 2004, 101, 2398–2403. [Google Scholar] [CrossRef] [PubMed]
- Grisart, B.; Coppieters, W.; Farnir, F.; Karim, L.; Ford, C.; Berzi, P.; Cambisano, N.; Mni, M.; Reid, S.; Simon, P.; et al. Positional Candidate Cloning of a QTL in Dairy Cattle: Identification of a Missense Mutation in the Bovine DGAT1 Gene with Major Effect on Milk Yield and Composition. Genome Res. 2002, 12, 222–231. [Google Scholar] [CrossRef]
- Blott, S.; Kim, J.-J.; Moisio, S.; Schmidt-Küntzel, A.; Cornet, A.; Berzi, P.; Cambisano, N.; Ford, C.; Grisart, B.; Johnson, D.; et al. Molecular Dissection of a Quantitative Trait Locus: A Phenylalanine-to-Tyrosine Substitution in the Transmembrane Domain of the Bovine Growth Hormone Receptor Is Associated With a Major Effect on Milk Yield and Composition. Genetics 2003, 163, 253–266. [Google Scholar] [CrossRef]
- Cohen-Zinder, M.; Seroussi, E.; Larkin, D.M.; Loor, J.J.; Wind, A.E.D.; Lee, J.-H.; Drackley, J.K.; Band, M.R.; Hernandez, A.G.; Shani, M.; et al. Identification of a Missense Mutation in the Bovine ABCG2 Gene with a Major Effect on the QTL on Chromosome 6 Affecting Milk Yield and Composition in Holstein Cattle. Genome Res. 2005, 15, 936–944. [Google Scholar] [CrossRef]
- Jia, R.; Fu, Y.; Xu, L.; Li, H.; Li, Y.; Liu, L.; Ma, Z.; Sun, D.; Han, B. Associations between Polymorphisms of SLC22A7, NGFR, ARNTL and PPP2R2B Genes and Milk Production Traits in Chinese Holstein. BMC Genom. Data 2021, 22, 47. [Google Scholar] [CrossRef]
- Han, B.; Yuan, Y.; Liang, R.; Li, Y.; Liu, L.; Sun, D. Genetic Effects of LPIN1 Polymorphisms on Milk Production Traits in Dairy Cattle. Genes 2019, 10, 265. [Google Scholar] [CrossRef]
- Peng, P.; Liu, Y.; Zheng, W.; Han, B.; Wang, K.; Sun, D. Identification of Genetic Effects of ACADVL and IRF6 Genes with Milk Production Traits of Holstein Cattle in China. Genes 2022, 13, 2393. [Google Scholar] [CrossRef]
- Shi, L.; Liu, L.; Lv, X.; Ma, Z.; Li, C.; Li, Y.; Zhao, F.; Sun, D.; Han, B. Identification of Genetic Effects and Potential Causal Polymorphisms of CPM Gene Impacting Milk Fatty Acid Traits in Chinese Holstein. Anim. Genet. 2020, 51, 491–501. [Google Scholar] [CrossRef]
- Meuwissen, T.H.; Hayes, B.J.; Goddard, M.E. Prediction of Total Genetic Value Using Genome-Wide Dense Marker Maps. Genetics 2001, 157, 1819–1829. [Google Scholar] [CrossRef] [PubMed]
- Liu, A.; Lund, M.S.; Boichard, D.; Karaman, E.; Fritz, S.; Aamand, G.P.; Nielsen, U.S.; Wang, Y.; Su, G. Improvement of Genomic Prediction by Integrating Additional Single Nucleotide Polymorphisms Selected from Imputed Whole Genome Sequencing Data. Heredity 2020, 124, 37–49. [Google Scholar] [CrossRef] [PubMed]
- Pausch, H.; MacLeod, I.M.; Fries, R.; Emmerling, R.; Bowman, P.J.; Daetwyler, H.D.; Goddard, M.E. Evaluation of the Accuracy of Imputed Sequence Variant Genotypes and Their Utility for Causal Variant Detection in Cattle. Genet. Sel. Evol. 2017, 49, 24. [Google Scholar] [CrossRef] [PubMed]
- Xu, L.; Shi, L.; Liu, L.; Liang, R.; Li, Q.; Li, J.; Han, B.; Sun, D. Analysis of Liver Proteome and Identification of Critical Proteins Affecting Milk Fat, Protein, and Lactose Metabolism in Dariy Cattle with iTRAQ. Proteomics 2019, 19, e1800387. [Google Scholar] [CrossRef] [PubMed]
- Jo, S.H.; Son, M.K.; Koh, H.J.; Lee, S.M.; Song, I.H.; Kim, Y.O.; Lee, Y.S.; Jeong, K.S.; Kim, W.B.; Park, J.W.; et al. Control of Mitochondrial Redox Balance and Cellular Defense against Oxidative Damage by Mitochondrial NADP+-Dependent Isocitrate Dehydrogenase. J. Biol. Chem. 2001, 276, 16168–16176. [Google Scholar] [CrossRef] [PubMed]
- Zhao, D.; Kogut, M.H.; Genovese, K.J.; Hsu, C.-Y.; Lee, J.T.; Farnell, Y.Z. Altered Expression of Lactate Dehydrogenase and Monocarboxylate Transporter Involved in Lactate Metabolism in Broiler Wooden Breast. Poult. Sci. 2020, 99, 11–20. [Google Scholar] [CrossRef]
- Cahn, R.D.; Zwilling, E.; Kaplan, N.O.; Levine, L. Nature and Development of Lactic Dehydrogenases: The Two Major Types of This Enzyme Form Molecular Hybrids Which Change in Makeup during Development. Science 1962, 136, 962–969. [Google Scholar] [CrossRef]
- Dawson, D.M.; Goodfriend, T.L.; Kaplan, N.O. Lactic dehydrogenases: Functions of the two types rates of synthesis of the two major forms can be correlated with metabolic differentiation. Science 1964, 143, 929–933. [Google Scholar] [CrossRef]
- Pesce, A.; Mckay, R.H.; Stolzenbach, F.; Cahn, R.D.; Kaplan, N.O. The comparative enzymology of lactic dehydrogenases. i. properties of the crystalline beef and chicken enzymes. J. Biol. Chem. 1964, 239, 1753–1761. [Google Scholar] [CrossRef]
- Bagnato, A.; Schiavini, F.; Rossoni, A.; Maltecca, C.; Dolezal, M.; Medugorac, I.; Sölkner, J.; Russo, V.; Fontanesi, L.; Friedmann, A.; et al. Quantitative Trait Loci Affecting Milk Yield and Protein Percentage in a Three-Country Brown Swiss Population. J. Dairy Sci. 2008, 91, 767–783. [Google Scholar] [CrossRef]
- Viitala, S.M.; Schulman, N.F.; de Koning, D.J.; Elo, K.; Kinos, R.; Virta, A.; Virta, J.; Mäki-Tanila, A.; Vilkki, J.H. Quantitative Trait Loci Affecting Milk Production Traits in Finnish Ayrshire Dairy Cattle. J. Dairy Sci. 2003, 86, 1828–1836. [Google Scholar] [CrossRef] [PubMed]
- Cole, J.B.; Wiggans, G.R.; Ma, L.; Sonstegard, T.S.; Lawlor, T.J.; Crooker, B.A.; Van Tassell, C.P.; Yang, J.; Wang, S.; Matukumalli, L.K.; et al. Genome-Wide Association Analysis of Thirty One Production, Health, Reproduction and Body Conformation Traits in Contemporary U.S. Holstein Cows. BMC Genom. 2011, 12, 408. [Google Scholar] [CrossRef] [PubMed]
- Pan, J.H.; Tang, J.; Redding, M.C.; Beane, K.E.; Conner, C.L.; Cho, Y.J.; Zhao, J.; Kim, J.H.; Kong, B.C.; Lee, J.H.; et al. Hepatic Transcriptomics Reveals That Lipogenesis Is a Key Signaling Pathway in Isocitrate Dehydrogenase 2 Deficient Mice. Genes 2019, 10, 728. [Google Scholar] [CrossRef] [PubMed]
- Cairns, R.A.; Mak, T.W. Oncogenic Isocitrate Dehydrogenase Mutations: Mechanisms, Models, and Clinical Opportunities. Cancer Discov. 2013, 3, 730–741. [Google Scholar] [CrossRef] [PubMed]
- Li, J.; He, Y.; Tan, Z.; Lu, J.; Li, L.; Song, X.; Shi, F.; Xie, L.; You, S.; Luo, X.; et al. Wild-Type IDH2 Promotes the Warburg Effect and Tumor Growth through HIF1α in Lung Cancer. Theranostics 2018, 8, 4050–4061. [Google Scholar] [CrossRef]
- Gong, F.; Gao, L.; Ding, T. IDH2 Protects against Nonalcoholic Steatohepatitis by Alleviating Dyslipidemia Regulated by Oxidative Stress. Biochem. Biophys. Res. Commun. 2019, 514, 593–600. [Google Scholar] [CrossRef]
- Lee, S.J.; Cha, H.; Kim, H.; Lee, J.H.; Park, J.-W. Amelioration of Late-Onset Hepatic Steatosis in IDH2-Deficient Mice. Free Radic. Res. 2017, 51, 368–374. [Google Scholar] [CrossRef]
- Fassah, D.M.; Jeong, J.Y.; Baik, M. Hepatic Transcriptional Changes in Critical Genes for Gluconeogenesis Following Castration of Bulls. Asian-Australas. J. Anim. Sci. 2018, 31, 537–547. [Google Scholar] [CrossRef]
- Wang, X.; Liu, H.; Ni, Y.; Shen, P.; Han, X. Lactate Shuttle: From Substance Exchange to Regulatory Mechanism. Hum. Cell 2022, 35, 1–14. [Google Scholar] [CrossRef]
- Xu, Q.; Li, X.; Ma, L.; Loor, J.J.; Coleman, D.N.; Jia, H.; Liu, G.; Xu, C.; Wang, Y.; Li, X. Adipose Tissue Proteomic Analysis in Ketotic or Healthy Holstein Cows in Early Lactation1. J. Anim. Sci. 2019, 97, 2837–2849. [Google Scholar] [CrossRef]
- Wu, W.; Zhang, Z.; Chao, Z.; Li, B.; Li, R.; Jiang, A.; Kim, K.-H.; Liu, H. Transcriptome Analysis Reveals the Genetic Basis of Skeletal Muscle Glycolytic Potential Based on a Pig Model. Gene 2021, 766, 145157. [Google Scholar] [CrossRef] [PubMed]
- Kasowski, M.; Grubert, F.; Heffelfinger, C.; Hariharan, M.; Asabere, A.; Waszak, S.M.; Habegger, L.; Rozowsky, J.; Shi, M.; Urban, A.E.; et al. Variation in Transcription Factor Binding Among Humans. Science 2010, 328, 232–235. [Google Scholar] [CrossRef] [PubMed]
- Yellajoshyula, D.; Pappas, S.S.; Rogers, A.E.; Choudhury, B.; Reed, X.; Ding, J.; Cookson, M.R.; Shakkottai, V.G.; Giger, R.J.; Dauer, W.T. THAP1 Modulates Oligodendrocyte Maturation by Regulating ECM Degradation in Lysosomes. Proc. Natl. Acad. Sci. USA 2021, 118, e2100862118. [Google Scholar] [CrossRef] [PubMed]
- Dethoff, E.A.; Chugh, J.; Mustoe, A.M.; Al-Hashimi, H.M. Functional Complexity and Regulation through RNA Dynamics. Nature 2012, 482, 322–330. [Google Scholar] [CrossRef]
- Giedroc, D.P.; Cornish, P.V. Frameshifting RNA Pseudoknots: Structure and Mechanism. Virus Res. 2009, 139, 193–208. [Google Scholar] [CrossRef]
- Cruz, J.A.; Westhof, E. The Dynamic Landscapes of RNA Architecture. Cell 2009, 136, 604–609. [Google Scholar] [CrossRef]
- Larson, M.H.; Greenleaf, W.J.; Landick, R.; Block, S.M. Applied Force Reveals Mechanistic and Energetic Details of Transcription Termination. Cell 2008, 132, 971–982. [Google Scholar] [CrossRef]
Disclaimer/Publisher’s Note: The statements, opinions and data contained in all publications are solely those of the individual author(s) and contributor(s) and not of MDPI and/or the editor(s). MDPI and/or the editor(s) disclaim responsibility for any injury to people or property resulting from any ideas, methods, instructions or products referred to in the content. |
© 2024 by the authors. Licensee MDPI, Basel, Switzerland. This article is an open access article distributed under the terms and conditions of the Creative Commons Attribution (CC BY) license (https://creativecommons.org/licenses/by/4.0/).