Article

Selected Lark Mitochondrial Genomes Provide Insights into the Evolution of Second Control Region with Tandem Repeats in Alaudidae (Aves, Passeriformes)

1
College of Wildlife and Protected Area, Northeast Forestry University, Harbin 150040, China
2
BGI Research, Shenzhen 518083, China
3
BGI Research, Wuhan 430074, China
4
School of Life Sciences, Heilongjiang University, Harbin 150080, China
5
State Forestry and Grassland Administration Detecting Center of Wildlife, Harbin 150040, China
*
Author to whom correspondence should be addressed.
Life 2024, 14(7), 881; https://doi.org/10.3390/life14070881
Submission received: 22 May 2024 / Revised: 30 June 2024 / Accepted: 5 July 2024 / Published: 15 July 2024
(This article belongs to the Section Genetics and Genomics)

Abstract

:
The control region (CR) regulates the replication and transcription of the mitochondrial genome (mitogenome). Some avian mitogenomes possess two CRs, and the second control region (CR2) may enhance replication and transcription; however, the CR2 in lark mitogenome appears to be undergoing loss and is accompanied by tandem repeats. Here, we characterized six lark mitogenomes from Alaudala cheleensis, Eremophila alpestris, Alauda razae, and Calandrella cinerea and reconstructed the phylogeny of Passerida. Through further comparative analysis among larks, we traced the evolutionary process of CR2. The mitochondrial gene orders were conserved in all published lark mitogenomes, with Cytb-trnT-CR1-trnP-ND6-trnE-remnant CR2 with tandem repeat-trnF-rrnS. Phylogenetic analysis revealed Alaudidae and Panuridae are sister groups at the base of Sylvioidea, and sporadic losses of CR2 may occur in their common ancestor. CR sequence and phylogeny analysis indicated CR2 tandem repeats were generated within CR2, originating in the ancestor of all larks, rather than inherited from CR1. The secondary structure comparison of tandem repeat units within and between species suggested slipped-strand mispairing and DNA turnover as suitable models for explaining the origin and evolution of these repeats. This study reveals the evolutionary process of the CR2 containing tandem repeat in Alaudidae, providing reference for understanding the evolutionary characteristics and dynamics of tandem repeats.

1. Introduction

The mitochondrial (mt) genome (mitogenome) typically contains thirteen protein-coding genes (PCGs), two ribosomal RNAs (rRNA), twenty-two transfer RNAs (tRNA), and one non-coding region (control region, CR) in most vertebrate animals [1]. Since the complete mitogenome of the domestic chicken (Gallus gallus) was sequenced, gene rearrangements have been identified frequently in many bird mitogenomes, and seven alternative mt gene orders have been reported in hotspot regions of CR and flanking genes [2,3,4,5,6,7,8,9,10,11,12]. These rearranged gene orders can be derived from a common ancestor by a tandem duplication of CR and neighboring genes followed by subsequent degeneration and/or loss of partial duplicate genes, i.e., tandem duplication and random loss (TDRL) model [10,11,12,13]. Moreover, intermolecular recombination has also been proposed as a mechanism underlying the generation of the aforementioned mt gene orders [14].
As the region of the mitogenome with the highest rate of evolution, CR generally controls the transcription of mt genes and H strand replication. Some bird lineages have two copies of CRs in their mitogenomes along with gene rearrangements [2,3,4,5,6,7,8,9,10,11,12]. This duplication might be linked to a higher metabolic rate [11] and potentially even longer lifespans [15]. The second CR (CR2) can maintain high similarity with CR1 through concerted evolution [4,5] or randomly lose some sequences to become remnant CR2 (rCR2) and eventually be lost [9]. Tandem repeats have been widely observed in the CR of animal mitogenome, and the number of repeat units can vary among species [16], populations [17], or even within an individual [18], resulting in highly variable lengths of the CR. Tandem repeat can be present in both CR1 and CR2, but it is still unknown whether the tandem repeats in CR2 originated from CR1. Several models have been proposed to interpret the origin and evolution of tandem repeats, including recombination and transposition [19], unequal crossing over [20], and slipped-strand mispairing [21,22]. However, there is still a limited understanding of the evolutionary characteristics of tandem repeats.
The lark family Alaudidae comprises 21 genera and 100 species distributed across six continents [23,24,25]. Previous research has found that Alaudidae mitogenomes have an integral CR1 and one rCR2 with tandem repeats [26,27,28]. Recently, advancements have been made in exploring possible scenarios and mechanisms for the evolution of duplicated regions within mitogenomes of Passeriformes [11,12]. Our study contributes to this growing body of work by investigating the evolutionary progression of gene arrangement and rCR2 in Alaudidae.
On the other hand, it was suggested that mapping mt gene orders onto the resolved phylogenetic tree using mitogenomes was useful for understanding the evolutionary progression of gene arrangement and duplicated CR in Alaudidae [11]. However, the phylogeny of Alaudidae, particularly the interfamily relationships, remains debated. Several studies revealed that Alaudidae was sister to the clade of other Sylvioidea species [11,28,29,30,31,32,33,34,35,36], while the other showed that Alaudidae has a close relationship with Panuridae [37,38,39,40,41,42,43,44,45].
To address the above questions, we amplified and sequenced four mitogenomes of Alaudala cheleensis and Eremophila alpestris and assembled two mitogenomes of Alauda razae and Calandrella cinerea using sequencing data obtained from the SRA database. We then characterized their structure by comparing them with other published Alaudidae mitogenomes. Using Sylvioidea mitogenomes available in GenBank up to April 2024, we reconstructed the phylogeny of Passerida and mapped the mt gene order and tandem repeats onto the phylogenetic tree. With the use of CR sequence analysis, we focused on mt gene arrangement and duplications of CR and tandem repeats in Alaudidae and attempted to reconstruct their evolutionary progression.

2. Materials and Methods

2.1. Samples Collection, DNA Extraction, and Data Download

We collected muscle samples of two A. cheleensis and two E. alpestris individuals in Manzhouli, Inner Mongolia Autonomous Region. These specimens were stored at −80 °C and were provided by the sample library of the State Forestry and Grassland Administration Detecting Center of Wildlife (Harbin, China). Samples were legally collected and were properly preserved for applications in law enforcement mainly in cases involving forensic analysis. Sample collection and experimentation were approved by the Northeast Forestry University Institutional Review Board of Ethics and Administration of Experimental Animals.
Total genomic DNA was isolated using a tissue extraction kit (AxyPrep DNA, Hangzhou, China) and quantified with a DU-640 Nucleic Acid-Protein Analysis System (Beckman Coulter, Brea, CA, USA) according to the user’s manual.
Sixty-one Passeriformes mitogenomes including six larks and two Psittaciformes mitogenomes were downloaded from NCBI for phylogenetic analysis (detail see Section 2.4). In addition, based on the sampling location of an A. cheleensi sample (44.10 N 100.93 E) and a phylogenetic analysis of some subspecies, we identified an unpublished mitogenome (MN356181) belonging to the subspecies A. cheleensi heinei (Figure S1). As a note, this subspecies is currently recognized as the independent species A. heinei [46,47], and we adopted this classification in the present study. The raw sequencing data of Alauda razae (SRX7050284) and Calandrella cinerea (SRX16766684) [48] were downloaded from the SRA database for subsequent mitogenome assembly.

2.2. PCR Amplification and Sequencing

To minimize the possibility of obtaining nuclear copies of mt genes (Numts), the entire mitogenomes were amplified in long overlapping fragments using the long and accurate polymerase chain reaction (LA-PCR) by nine primer pairs (Table S1). LA-PCRs were conducted in an Eppendorf thermocycler in a volume of 50 μL containing approximately 100 ng DNA template, 1× PCR buffer (10 mM Tris–HCl pH 8.3, 50 mM KCl, and 1.5 mM MgCl2), 0.2 mM dNTP, 0.2 μM each primer, and 2.5 U LA Taq DNA polymerase or PrimeSTAR GXL DNA Polymerase (TaKaRa, Dalian, China). Thermal cycling included 94 °C for 1 min, followed by 35 cycles of 94 °C for 1 min, 50–60 °C for 45 s, 72 °C for 1 min 30 s, and a final extension of 10 min at 72 °C. Amplification products were separated with a 1% agarose gel. The bands containing exact DNA fragments from the same individual were recovered and purified using an AxyPrep™ DNA Gel Extraction Kit (AxyGen, Hangzhou, China) according to the manufacturer’s instructions. Recovered PCR products were sequenced directly using Sanger sequencing in an ABI 3730 DNA Analyzer following the primer-walking strategy (performed by BGI, Beijing, China).

2.3. Mitogenome Assembly, Annotation, and Mitogenome Analysis

The Sanger sequencing data of A. cheleensis and E. alpestris were assembled using the SeqMan software (DNAStar, Madison, WI, USA) based on overlapping fragments. For the Illumina sequencing data of A. razae and C. cinerea, quality control was initially conducted using fastp with default parameters [49]. Subsequently, the assembly was performed to reconstruct mitogenomes using GetOrganelle pipeline [50], with the A. arvensis mitogenome used as a reference [26]. Genes in the mitogenomes were annotated using Geneious 10.1.3 [51], employing other Alaudidae species as references [26,27,28]. The annotation of tRNA genes referred to the results of tRNAscan-SE 1.21 [52]. Annotation of all mt genes was checked by aligning them with those of other Passeriformes species from GenBank.
The circular mitogenome maps were drawn using the online tool CGView [53]. The nucleotide composition was calculated and analyzed using Geneious 10.1.3 [51]. Composition skew values were calculated using AT-skew = [A − T]/[A + T] and GC-skew = [G − C]/[G + C] [54]. The relative synonymous codon usage (RSCU) was analyzed using Phylosuit v.1.2.3 [55]. The secondary structures of RNAs were predicted using MITOS [56]. The conserved elements in CRs were analyzed with reference to previous studies [26,57,58], and the tandem repeats in CRs were detected by Tandem Repeat Finder [59]. Potential secondary structures of tandem repeat unit were examined, and their free energies were estimated using MFOLD [60]. The local alignment of all sequences was calculated using the program water from the EMBOSS package [61] based on the Smith–Waterman algorithm. To better trace the evolutionary history of tandem repeats in CR2, we examined the presence of tandem repeats in the CRs of all published Sylvioidea mitogenomes (Table S2) and performed a Fisher’s exact test to examine the association between the presence of tandem repeats in CR1 and CR2.

2.4. Phylogenetic Analysis

Based on the above inspection results (Table S2), we sampled all types of mitogenomes (categorized by whether CR2 is complete and whether CRs has tandem repeats) within each family under Sylvioidea for phylogenetic analysis. In addition, we also included 17 species from the Muscicapoidea, Passeroidea, and Paroidea as well as 2 species from the Psittaciformes as outgroups, resulting in a total of 71 mitogenomes for phylogenetic analysis (Table S3).
To maximize the phylogenetic information, all RNAs and PCGs [62] were selected for all species except for two species (Oxylabes madagascariensis and Donacobius atricapilla) due to missing ND6, trnP, and trnE. CRs were excluded from phylogenetic analyses since these sequences had poor phylogenetic performance and might produce tree topologies inconsistent with real evolutionary relationships among species [11].
We used Phylosuit v.1.2.3 [55,63] to conduct, manage, and streamline the analyses with the help of several plug-in programs. The PCGs and RNAs sequences were aligned in MAFFT with the default parameters [64], and the PCG alignments were further refined using the codon-aware program MACSE v2.06 [65]. The sites suitable for phylogenetic analysis were selected in Gblocks [66] and were then concatenated by the plug-in concatenate sequence option in PhyloSuite v.1.2.3. The optimal partitioning scheme for nucleotide substitution models for each gene was determined by PartitionFinder v.2.0 [67] under a greedy search algorithm with linked branch lengths based on AICc. Table S4 lists the best-fit substitution models and partitioning schemes for each gene.
Phylogenetic analyses were conducted using BI and ML methods. The BI analysis was performed using MrBayes v.3.1.2 [68] based on the optimal model of each partition. Two sets of four chains were allowed to run simultaneously for 80,000,000 generations, and each set was sampled every 1000 generations. The convergence and mixing of the chains of each analysis were evaluated using Tracer v.1.6.1 [69] to check that the ESS values were all superior to 200. A consensus tree was then calculated after excluding the first 25% of trees as burn-in. The ML analysis was performed using IQ-TREE v.1.6.8 [70] under the models selected for each identified partition and SH-aLRT assuming 10,000 replicates and nonparametric bootstrapping with 1000 replicates were used to estimate the node reliability.

3. Results

3.1. General Characteristics of Six Mitochondrial Genomes

The sizes of the mitogenomes for two A. cheleensis, two E. alpestris, A. arazae, and C. cinerea were found to be 17,383 bp, 17,383 bp, 17,855 bp, 17,702 bp, 17,216 bp, and 17,293 bp, respectively. Inter- and intra-species differences in sequence lengths were mainly caused by variations in CR2 (Figure 1). Each mitogenome contained the typical 13 PCGs, 22 tRNA genes, two rRNA genes, and two CRs (Figure 1). Overall, 28 genes were encoded on the H-strand, while the ND6 gene and 8 tRNAs were encoded on the L-strand (Figure 1). The gene arrangement order of the four lark mitogenomes is the same: All are Cytb-trnT-CR1-trnP-ND6-trnE-rCR2-trnF-rrnS. These characteristics are similar to other lark mitogenomes published in the past, such as A. arvensis [26] and Melanocorypha mongolica [27].
Similar to other avian mitogenomes [72,73,74], the A + T content was higher than the G + C content in either the whole or every partition of mitogenomes (PCGs, tRNAs, rRNAs, and CRs). The highest A + T content was found in CR2, ranging from 67.1% in A. cheleensis to 79.2% in E. alpestris. The composition skew showed that the AT skew of the whole mitogenome was positive, while the GC skew was negative, indicating the presence of more As than Ts and more Cs than Gs, respectively (Table S5). For different partitions of mitogenomes, PCGs showed slight A skew and obvious C skew, rRNAs showed moderate A skew and slight C skew, tRNAs showed slight A/G skew, CR1 showed slight T skew and obvious C-skew, and CR2 showed slight A skew and obvious C skew. Among the three codon positions, an obvious T skew was recovered at the second position, while the most significant A skew was found at the third position. Although all three codon positions showed C skew, the degree of bias increased gradually from first to third (Table S5).
The RSCU results of 13 PCGs indicated that codons ending with A and C were more frequent than those ending with U and G (Figure S2). This observation was consistent with the results of nucleotide skews and may be a result of the nucleotide bias present in the mitogenome [75,76]. The start/stop codons of 13 PCGs were conserved among two species, except for the stop codon of Cytb. All PCGs were initiated with ATG and terminated with one of the three types of stop codons including the standard (TAA, TAG), the non-standard (AGG, AGA), and the incomplete (TA, T) (Table S6). All tRNAs were predicted to form the typical cloverleaf structure including the amino acid acceptor arm, anticodon arm, dihydrouracil arm and TψC arm, except trnS1 (AGY), which had lost the dihydrouracil arm in most metazoan mitogenomes (such as E. alpestris in Figure S3).

3.2. Phylogenetic Analyses

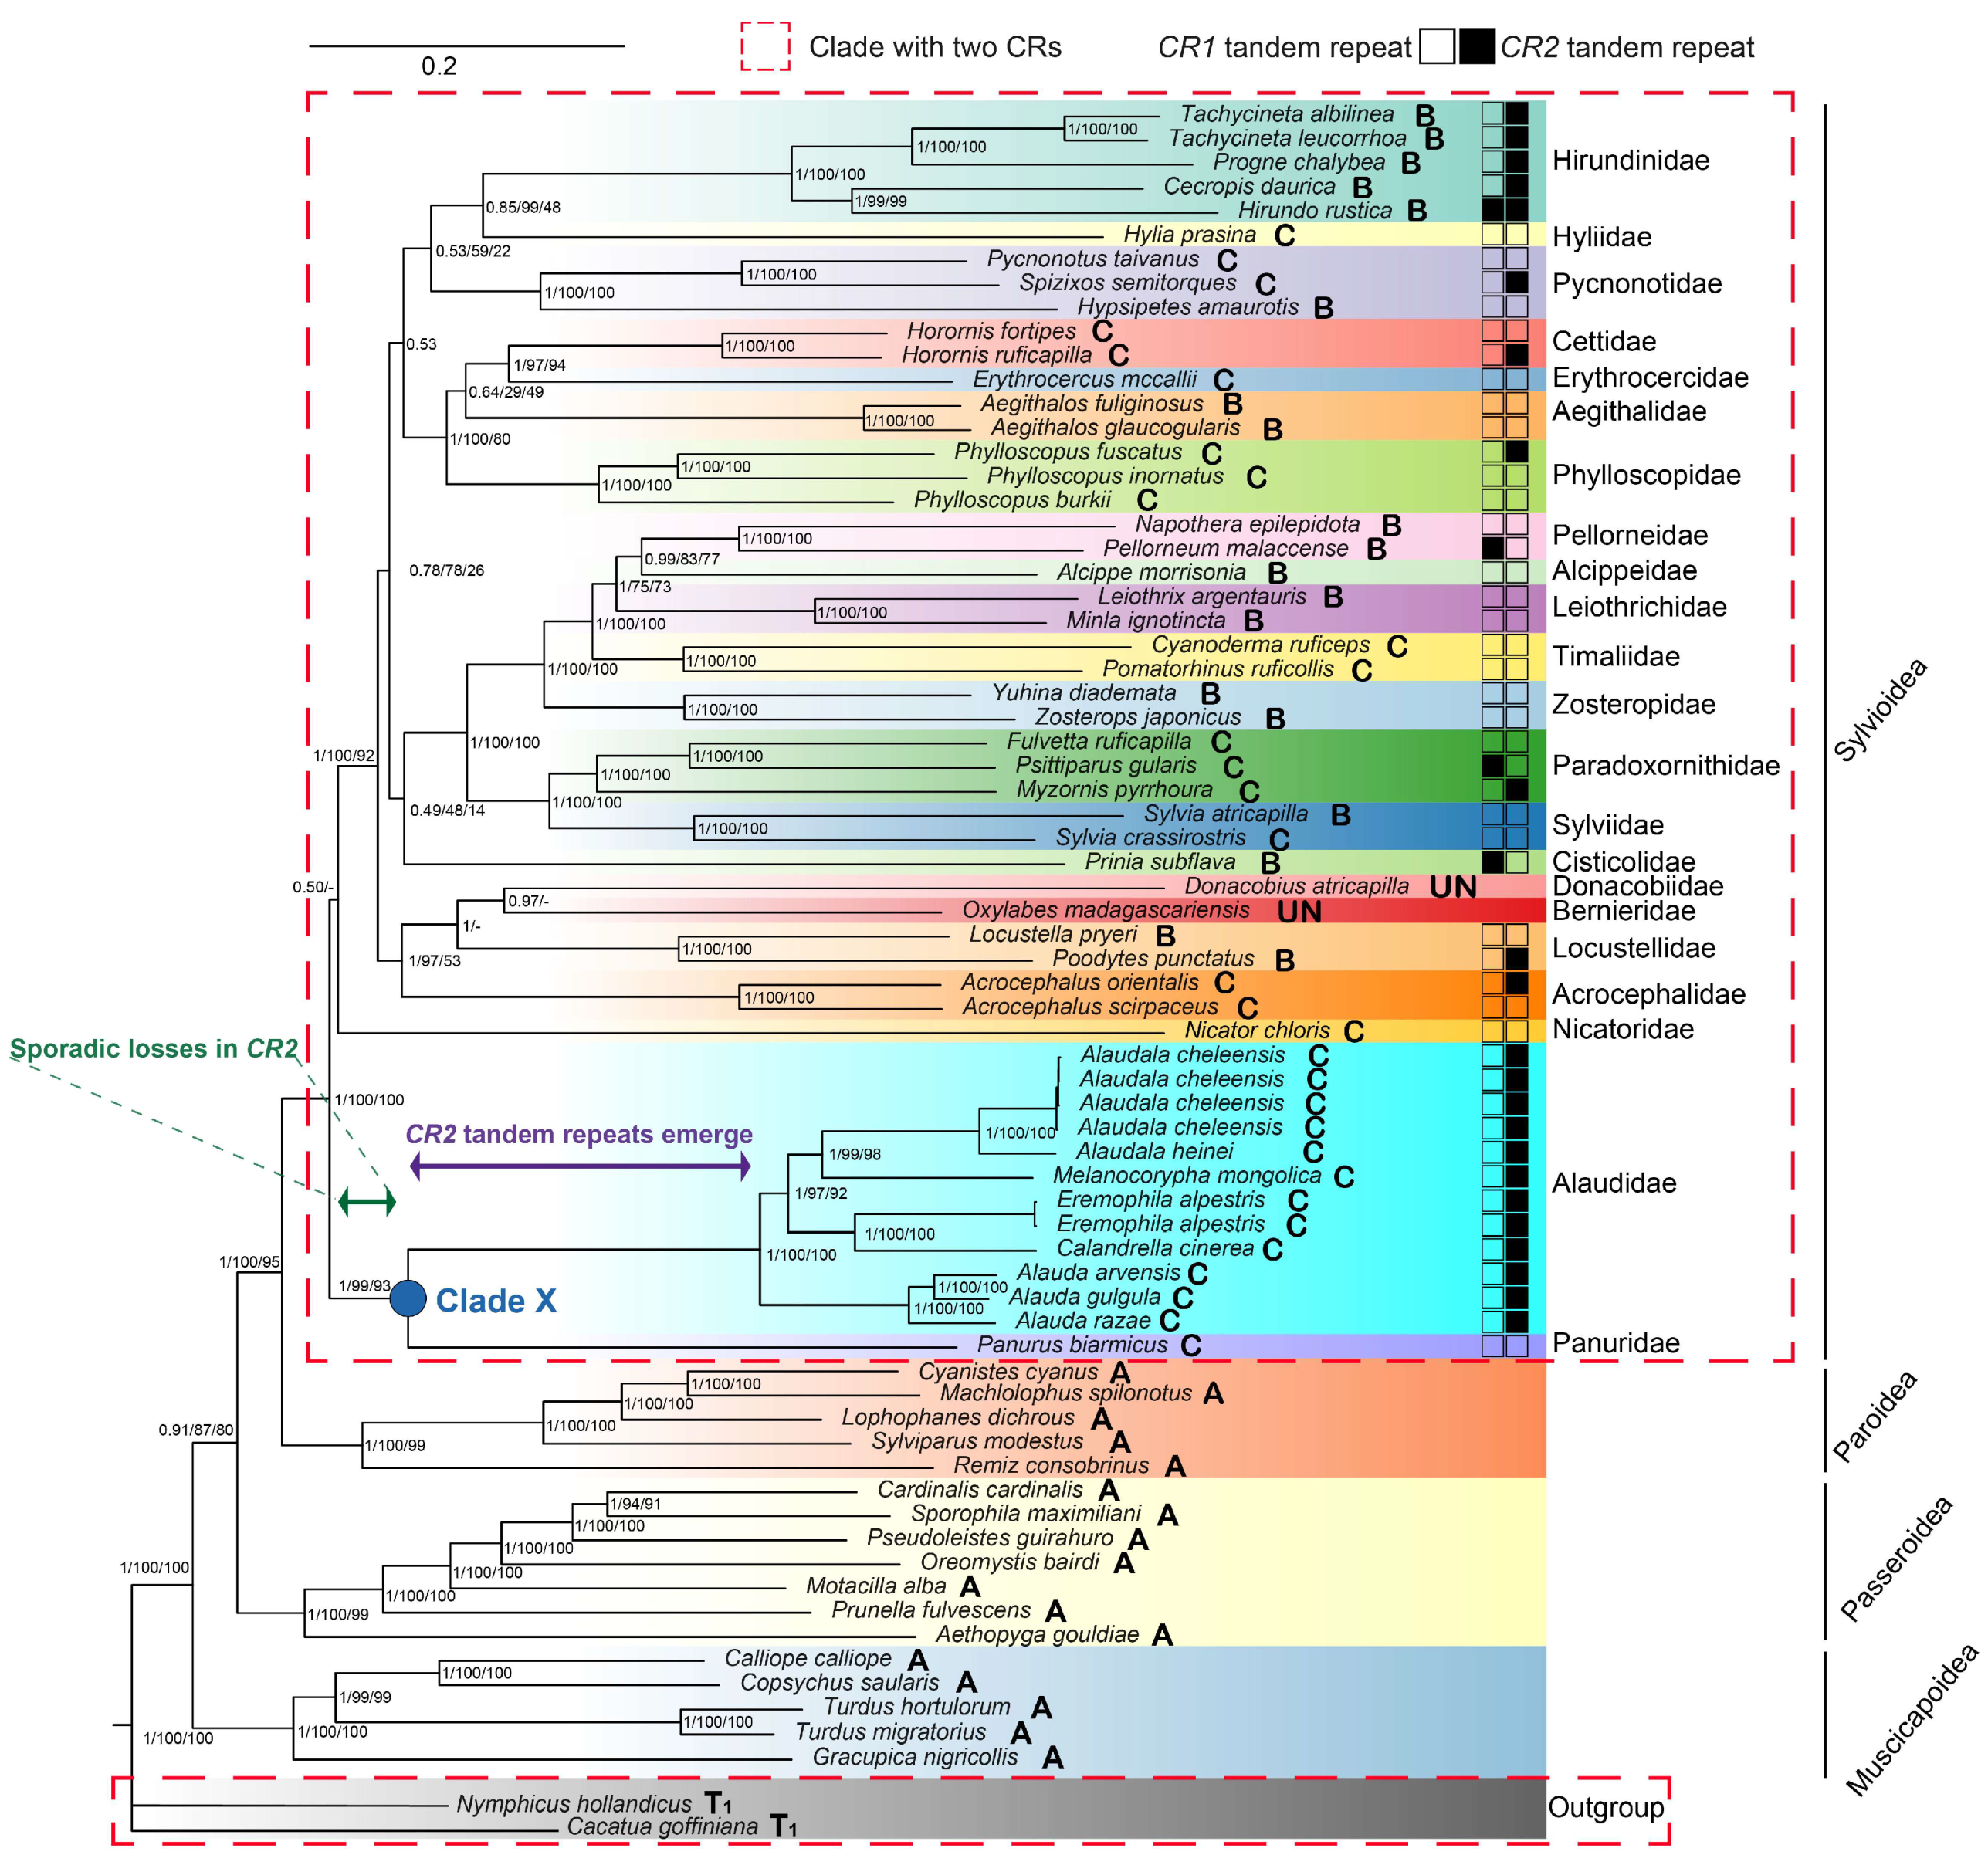
BI and ML phylogenetic trees showed nearly identical topologies in which 69 Passerida mitogenomes diverged into four major clades (Muscicapoidea, Passeroidea, Paroidea, and Sylvioidea) with maximal nodal support (PP ≥ 0.91, SH-aLRT ≥ 87, and BP ≥ 80, Figure 2). In Sylvioidea, Alaudidae is sister to Panuridae (PP = 1, SH-aLRT = 99, and BP = 93,) and both families formed a root clade X. The remaining families, including Nicatoridae, formed a separate cluster with less support. In Alaudidae, three Alauda species formed a clade sister to a clade containing all the remaining species in this family. In the latter clade, the clade containing E. alpestris and C. cinerea is sister to the clade containing M. mongolica and Alaudala genus. All nodes within Alaudidae are well supported (PP = 1, SH-aLRT ≥ 96.7, and BP ≥ 92).
The mt gene order and tandem repeats in CRs were mapped onto the phylogenetic tree (Figure 2). All Sylvioidea species as well as two outgroup species have duplicated CRs with the gene order B, C, or T1. Tandem repeats in CR2 are widely present in Alaudidae and Hirundinidae but only occur in individual species of a few other families in Sylvioidea (Figure 2, Table S2). The mt gene order C with rCR2 occurred in the clade X of Alaudidae and Paridae, in which CR2 tandem repeats only appeared in the rCR2 of all Alaudidae.

3.3. CR Analysis

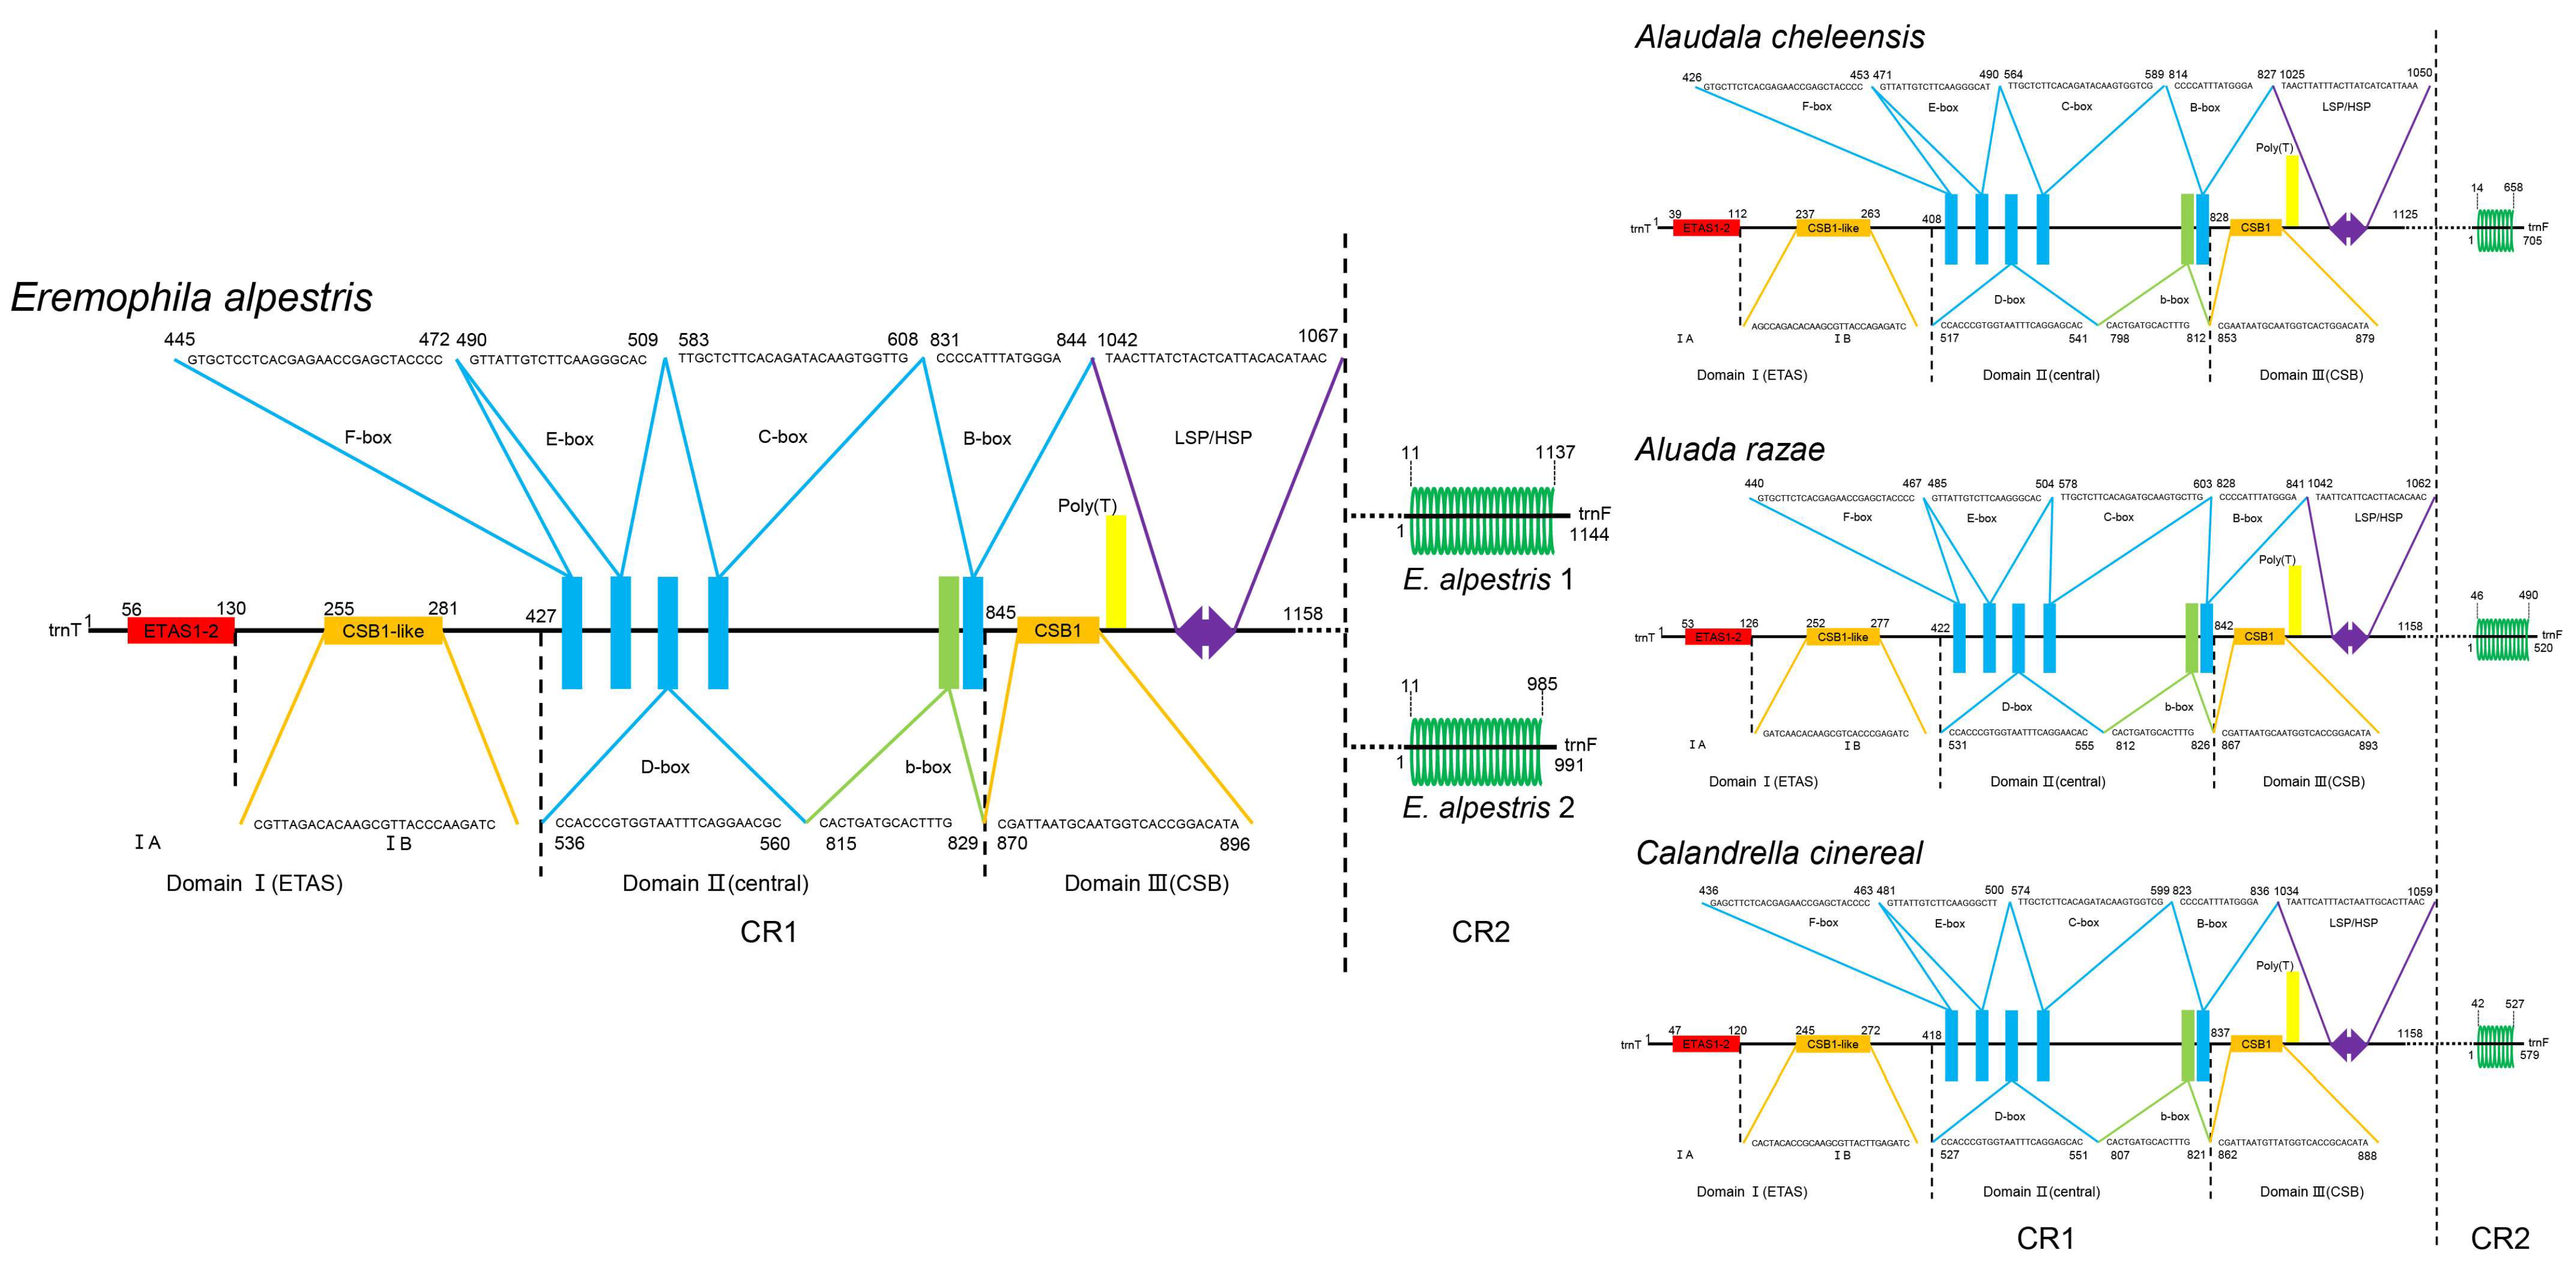
The CR1s could be divided into three domains [26] (Figure 3). ETAS1-2 and CSB1-like elements were distributed in Domain I. There were six conserved sequence elements: F-boxes, E-boxes, D-boxes, C-boxes, b-boxes, and B-boxes in Domain II. A LSP/HSP region and a CSB1 conserved element with a downstream poly-T were distributed in Domain III. However, these conservative sequence elements of CR1 were not detected in CR2. Instead, only tandem repeats were found (Figure 3).
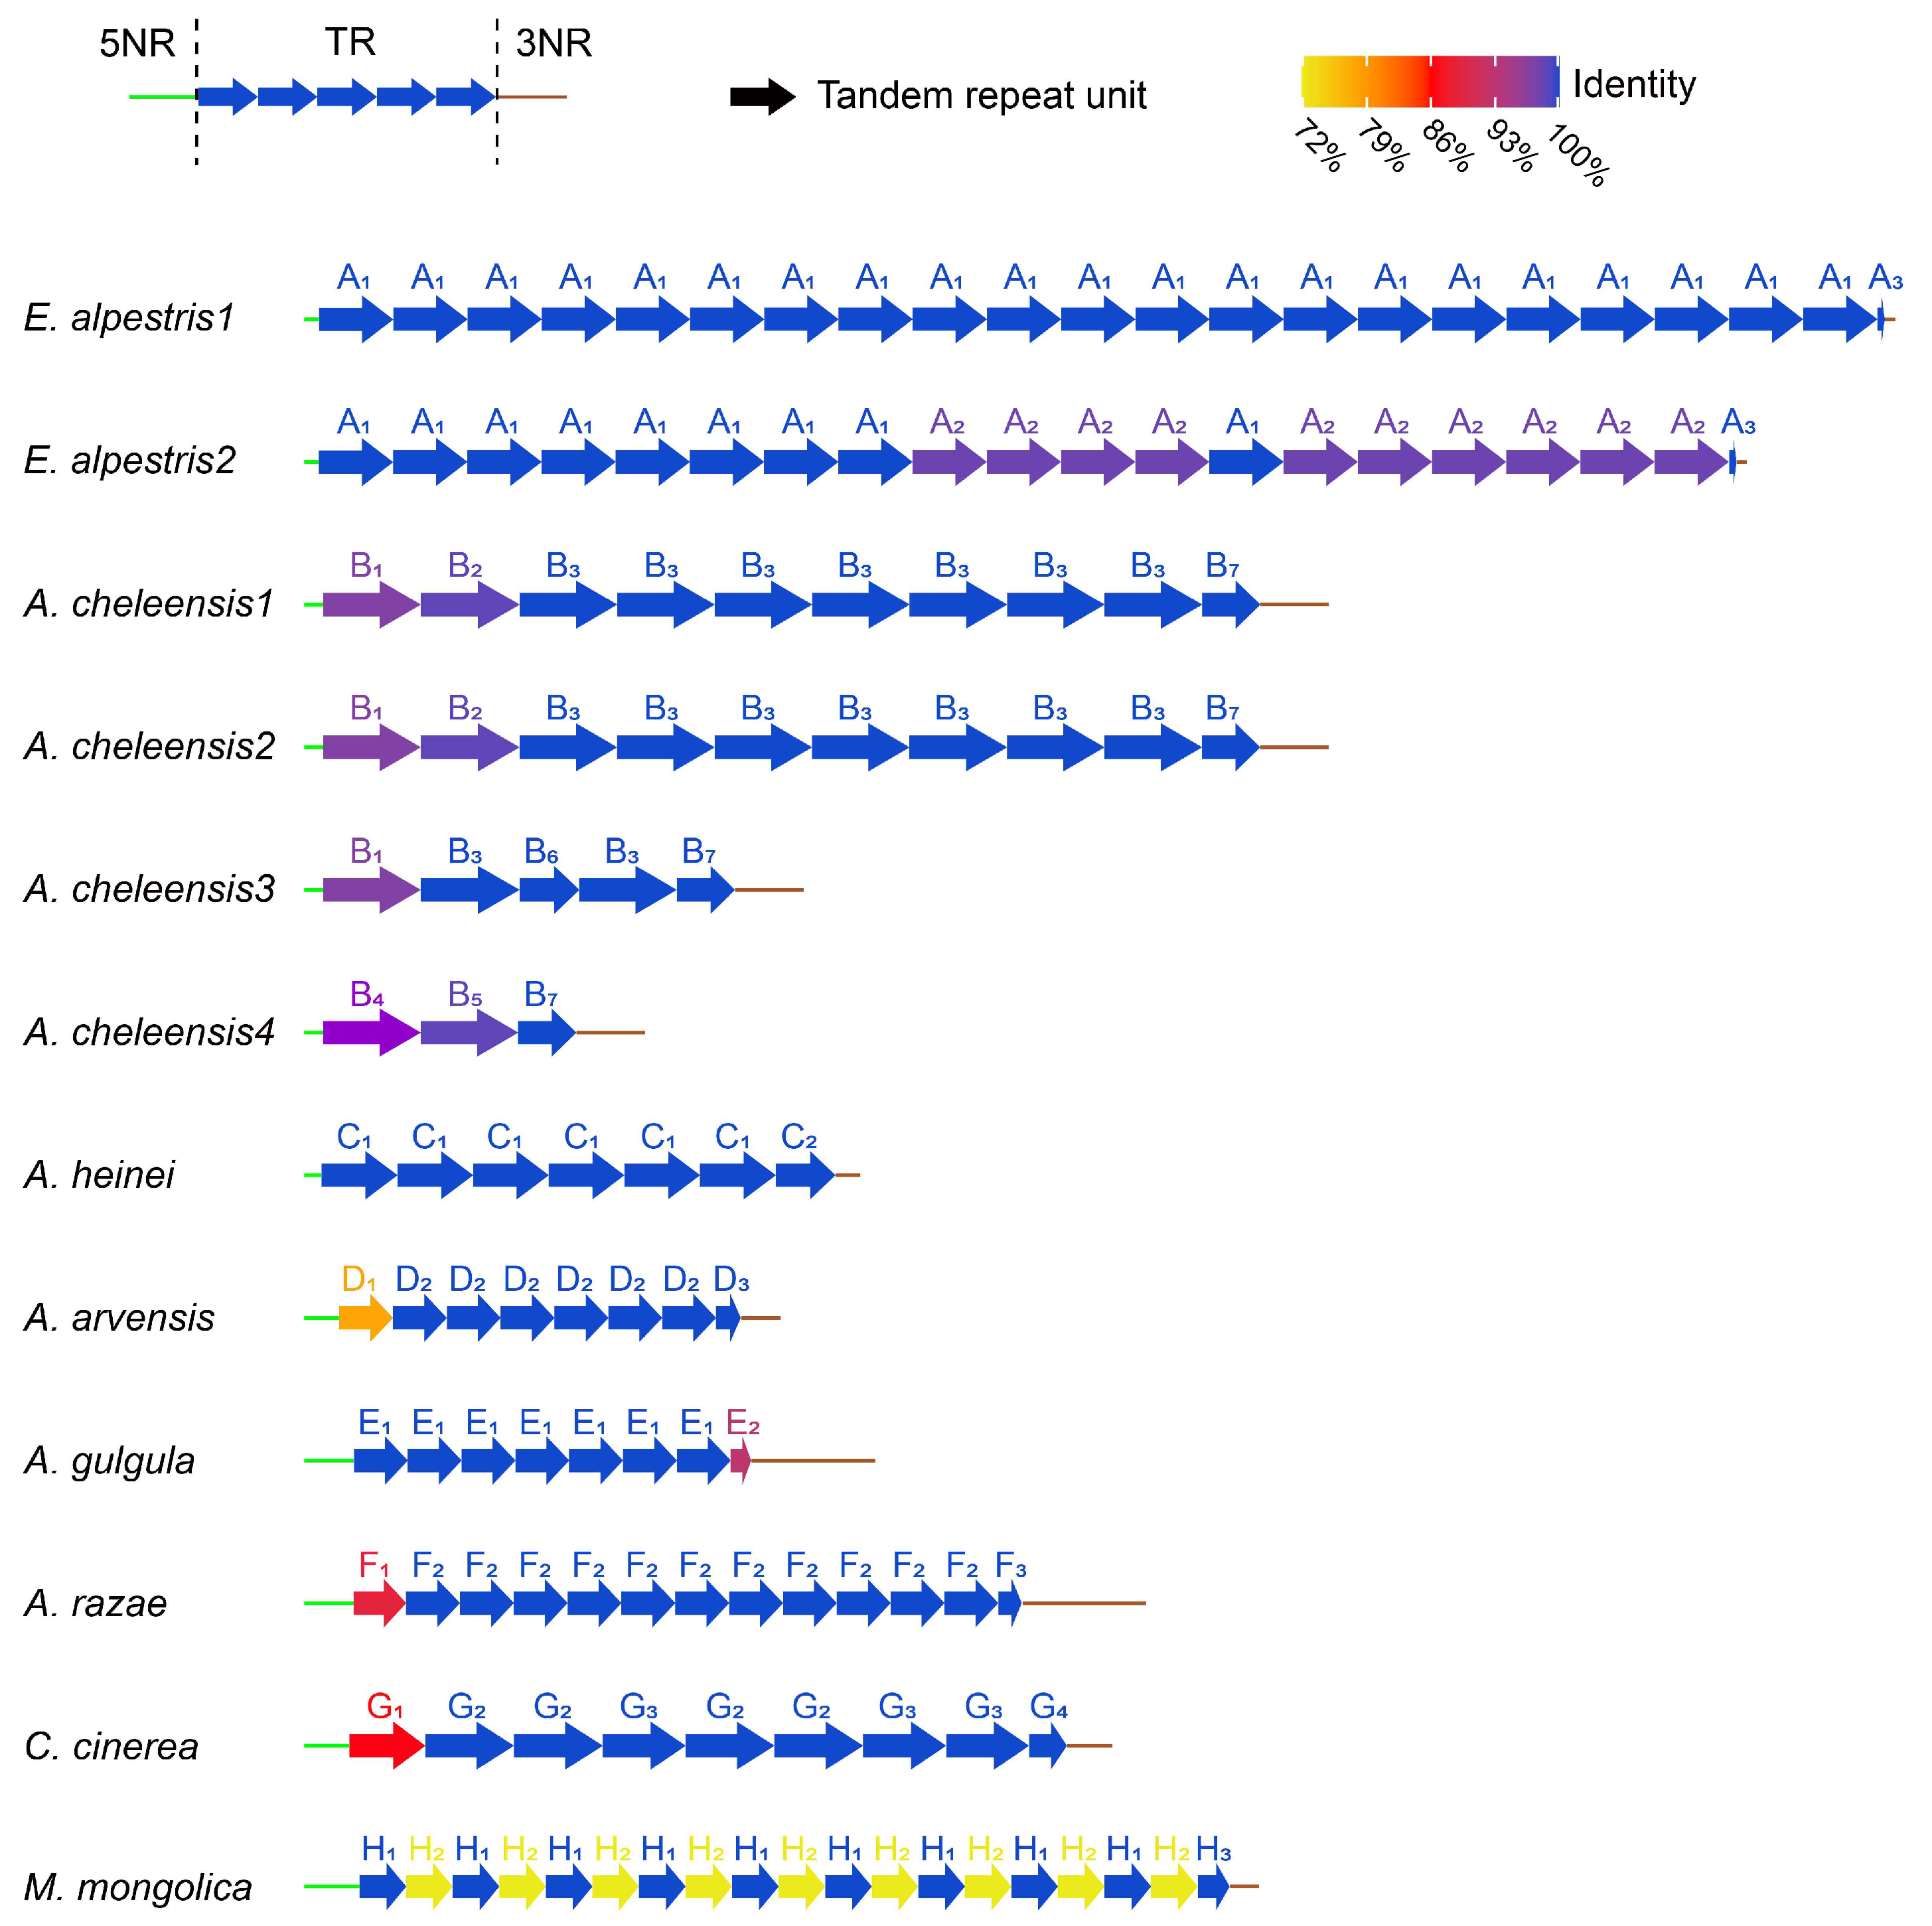
The structure of rCR2 could be divided into three regions (Table S7, Figure 4): 5′ non-repeat region (5NR), tandem repeat (TR), and 3′ non-repeat region (3NR). Both non-repeat regions showed intra-species conservation and inter-species variation (Table S7, Figure 4). To determine the origin of tandem repeats in rCR2, we compared the sequences of seven patterns, including 5NR, TR unit, 3NR, 5NR + TR unit, TR unit + 3NR, 5NR + TR unit + 3NR, and 5NR + 3NR, with any partial sequences on each mitogenome. Apart from the 3NR of rCR2 aligning with 100% similarity to the rrnS 5′ in Alauda gulgula (Figure 5a), we did not find any homologous regions in the entire mitogenome. This suggests that CR2 has undergone sporadic deletions.
In TR, the copy numbers of repeat units varied both inter- and intra-species. Sequences of repeat units differed greatly in length and similarity inter-species but were conserved intra-species (Table 1, Tables S7 and S8 and Figure 4). It should be noted that the initial repeat units (D1, F1, and G1) of A. arvensis, A. razae, and C. cinerea were significantly different from the other repeat units within species, while there were no point mutations among the other repeat units within species (Table 1, Figure 4). Additionally, in the rCR2 of M. mongolica, there were nine mutation differences between two types of smaller repeat units (H1 and H2), which combined to form a new repeat unit (H1 + H2). The similarity between the newly formed combined units was 100% (Table 1).
We manually aligned the consensus sequences of repeat units for different species and calculated the pairwise similarity (Figure 5b, Table S8). We found that these sequences are homologous and exhibit greater similarity among species that are closely related. In the alignment, Alaudala genus species and C. cinerea exhibited lower similarity with other larks due to the presence of some TATA motifs. Repeat units of M. mongolica are more similar to the latter half of repeat unit of E. alpestris. It is worth noting that the AAAG motif exists in all larks and appears twice in E. alpestris. Combined with the special repeat pattern ([H1 + H2]n) found in M. mongolica, it is speculated that the repeat unit of the E. alpestris has evolved through the fusion of two ancestral single units.
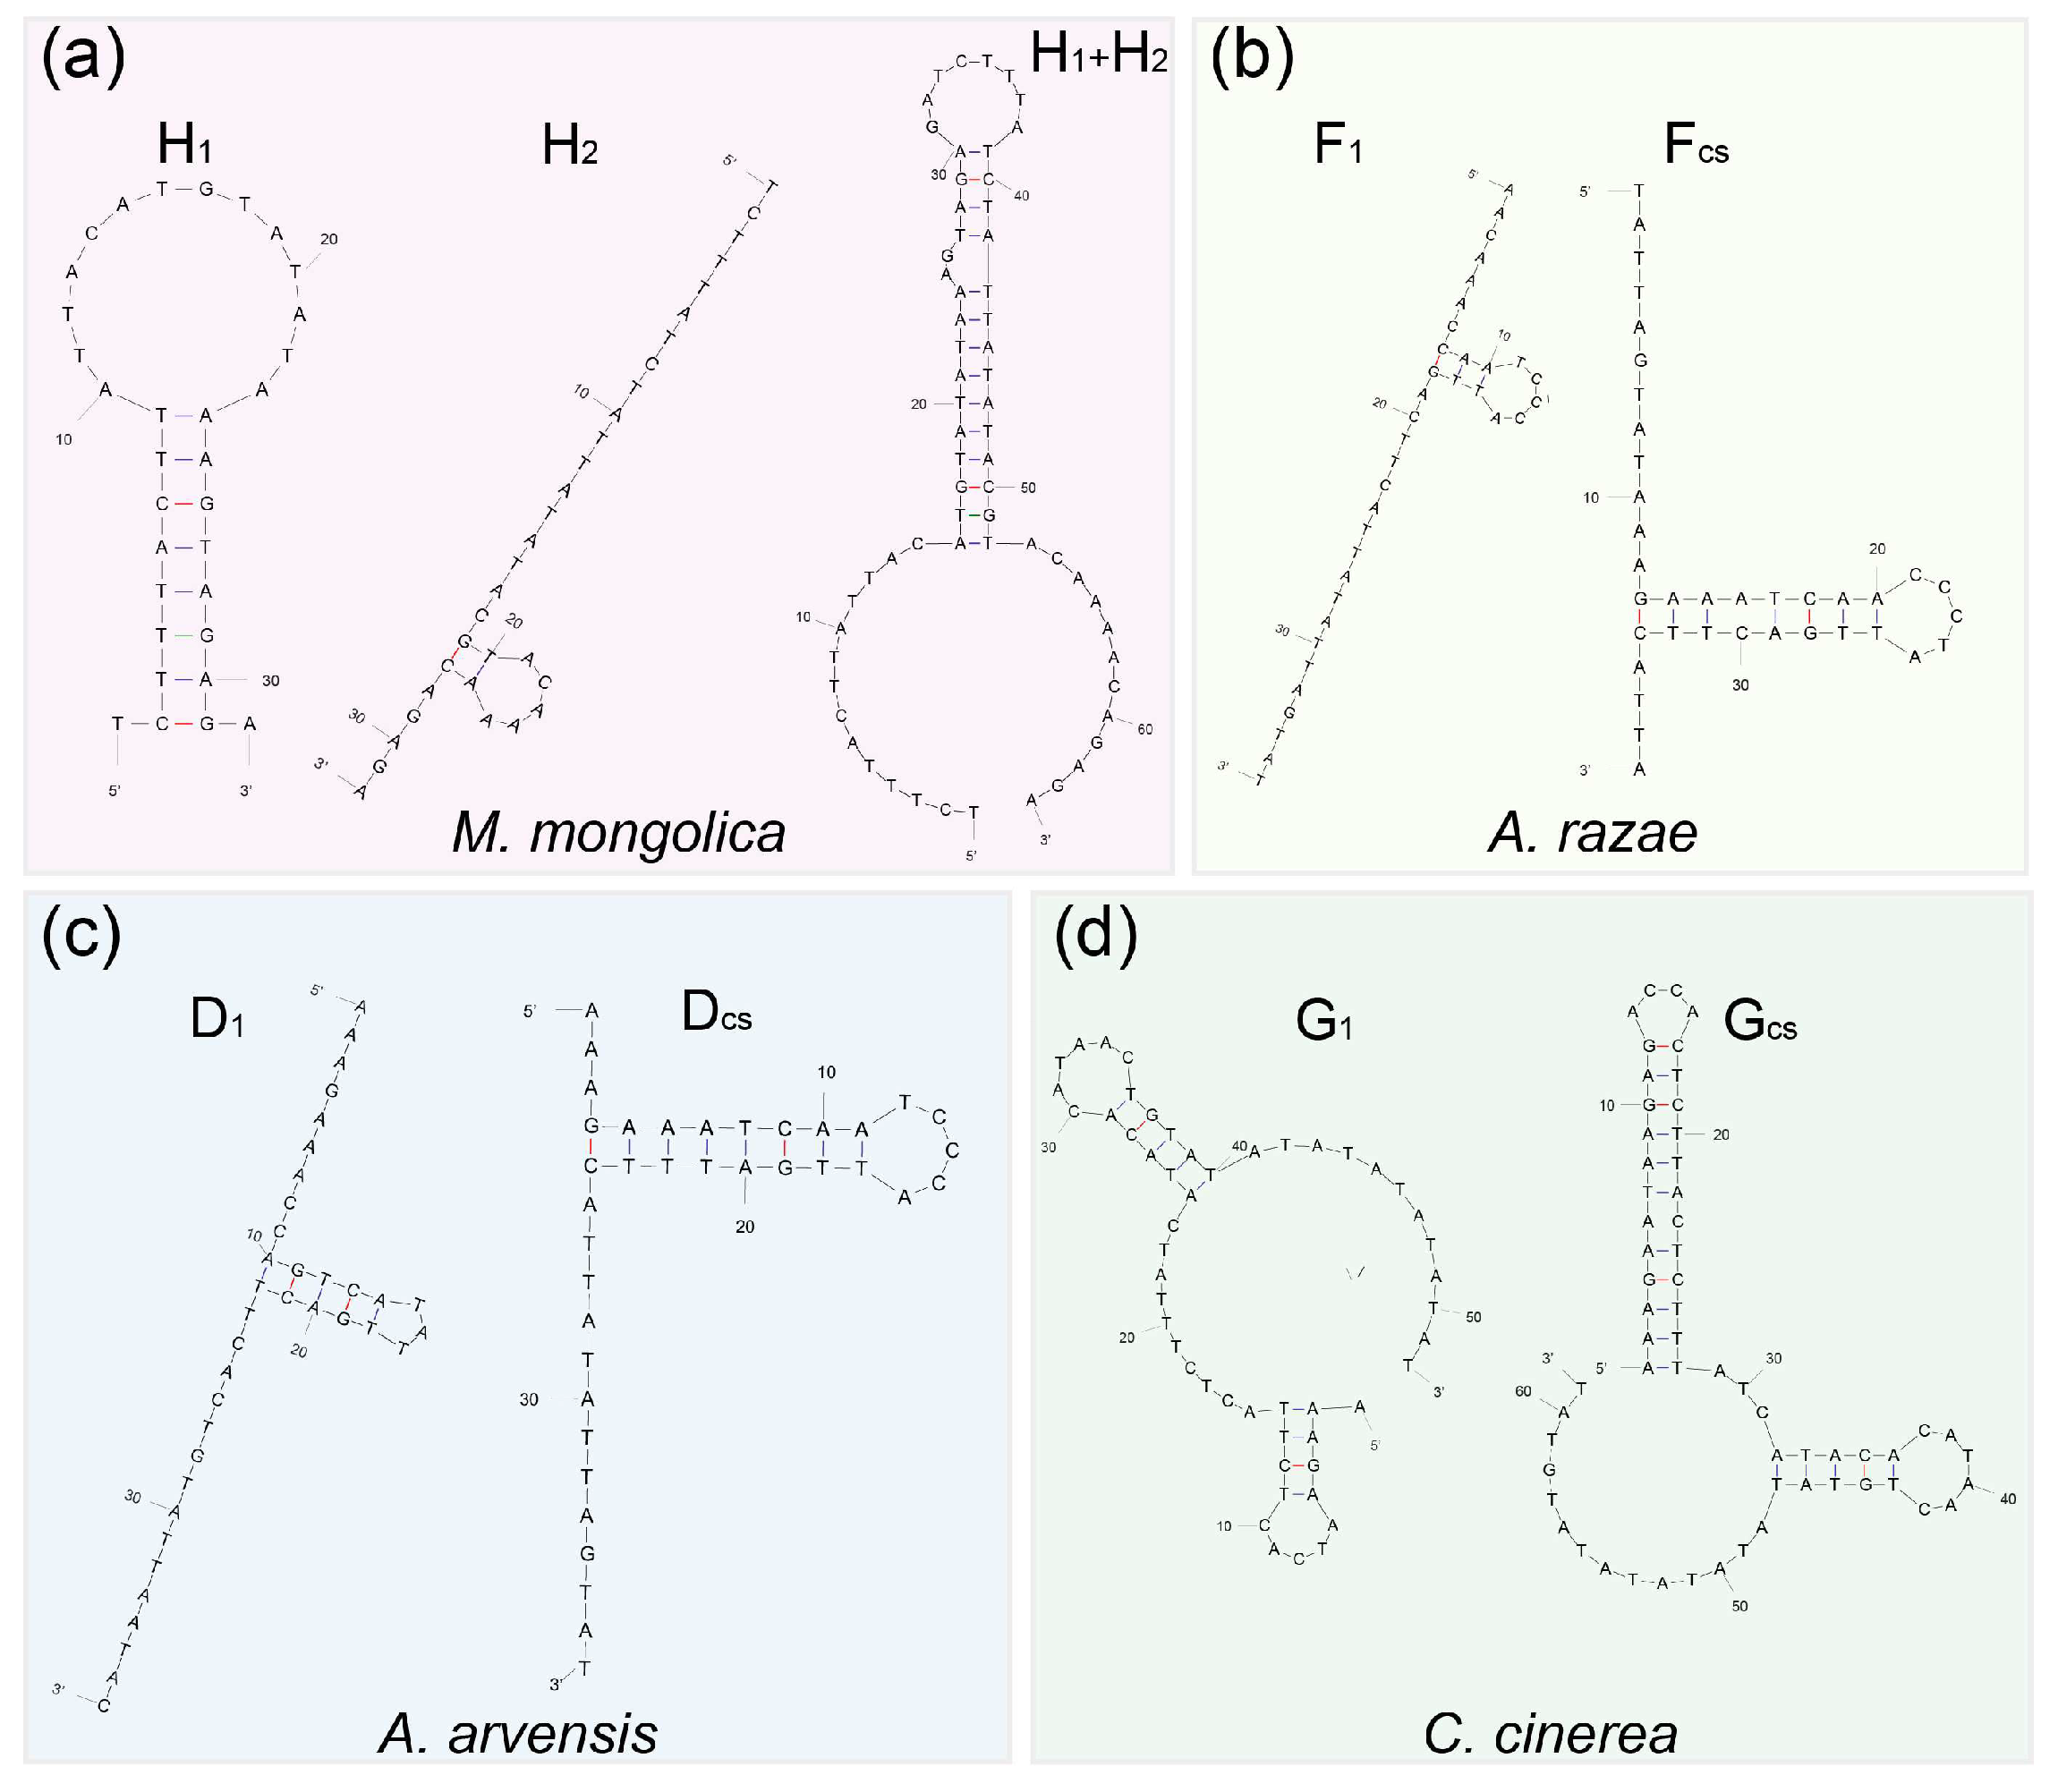
We examined the secondary structures of one and two units in CR2 tandem repeats in eight different larks (Table 1, Figure S4). Nearly all reconstructed secondary structures of repeat units consisted of stems and loops and formed multiple or extensive stem-and-loop structures. In contrast to one repeat unit, the secondary structures of combinations of two repeat units were more complex, with higher free energy values (Table 1, Figure S4). Interestingly, the repeat unit H2 of M. mongolica cannot spontaneously form a secondary structure (0.1 kcal M-1), but it can form a secondary structure with higher free energy by combining with H1 into a repeat unit (H1 + H2) (Figure 6a). Additionally, the initial repeat unit of A. arvensis, A. razae, and C. cinerea cannot form a stable secondary structure, and its free energy is lower compared to that of the subsequent repeat units (Table 1, Figure 6b–d), suggesting that they may have been eliminated during the evolution of tandem repeats.

3.4. Gene Rearrangement

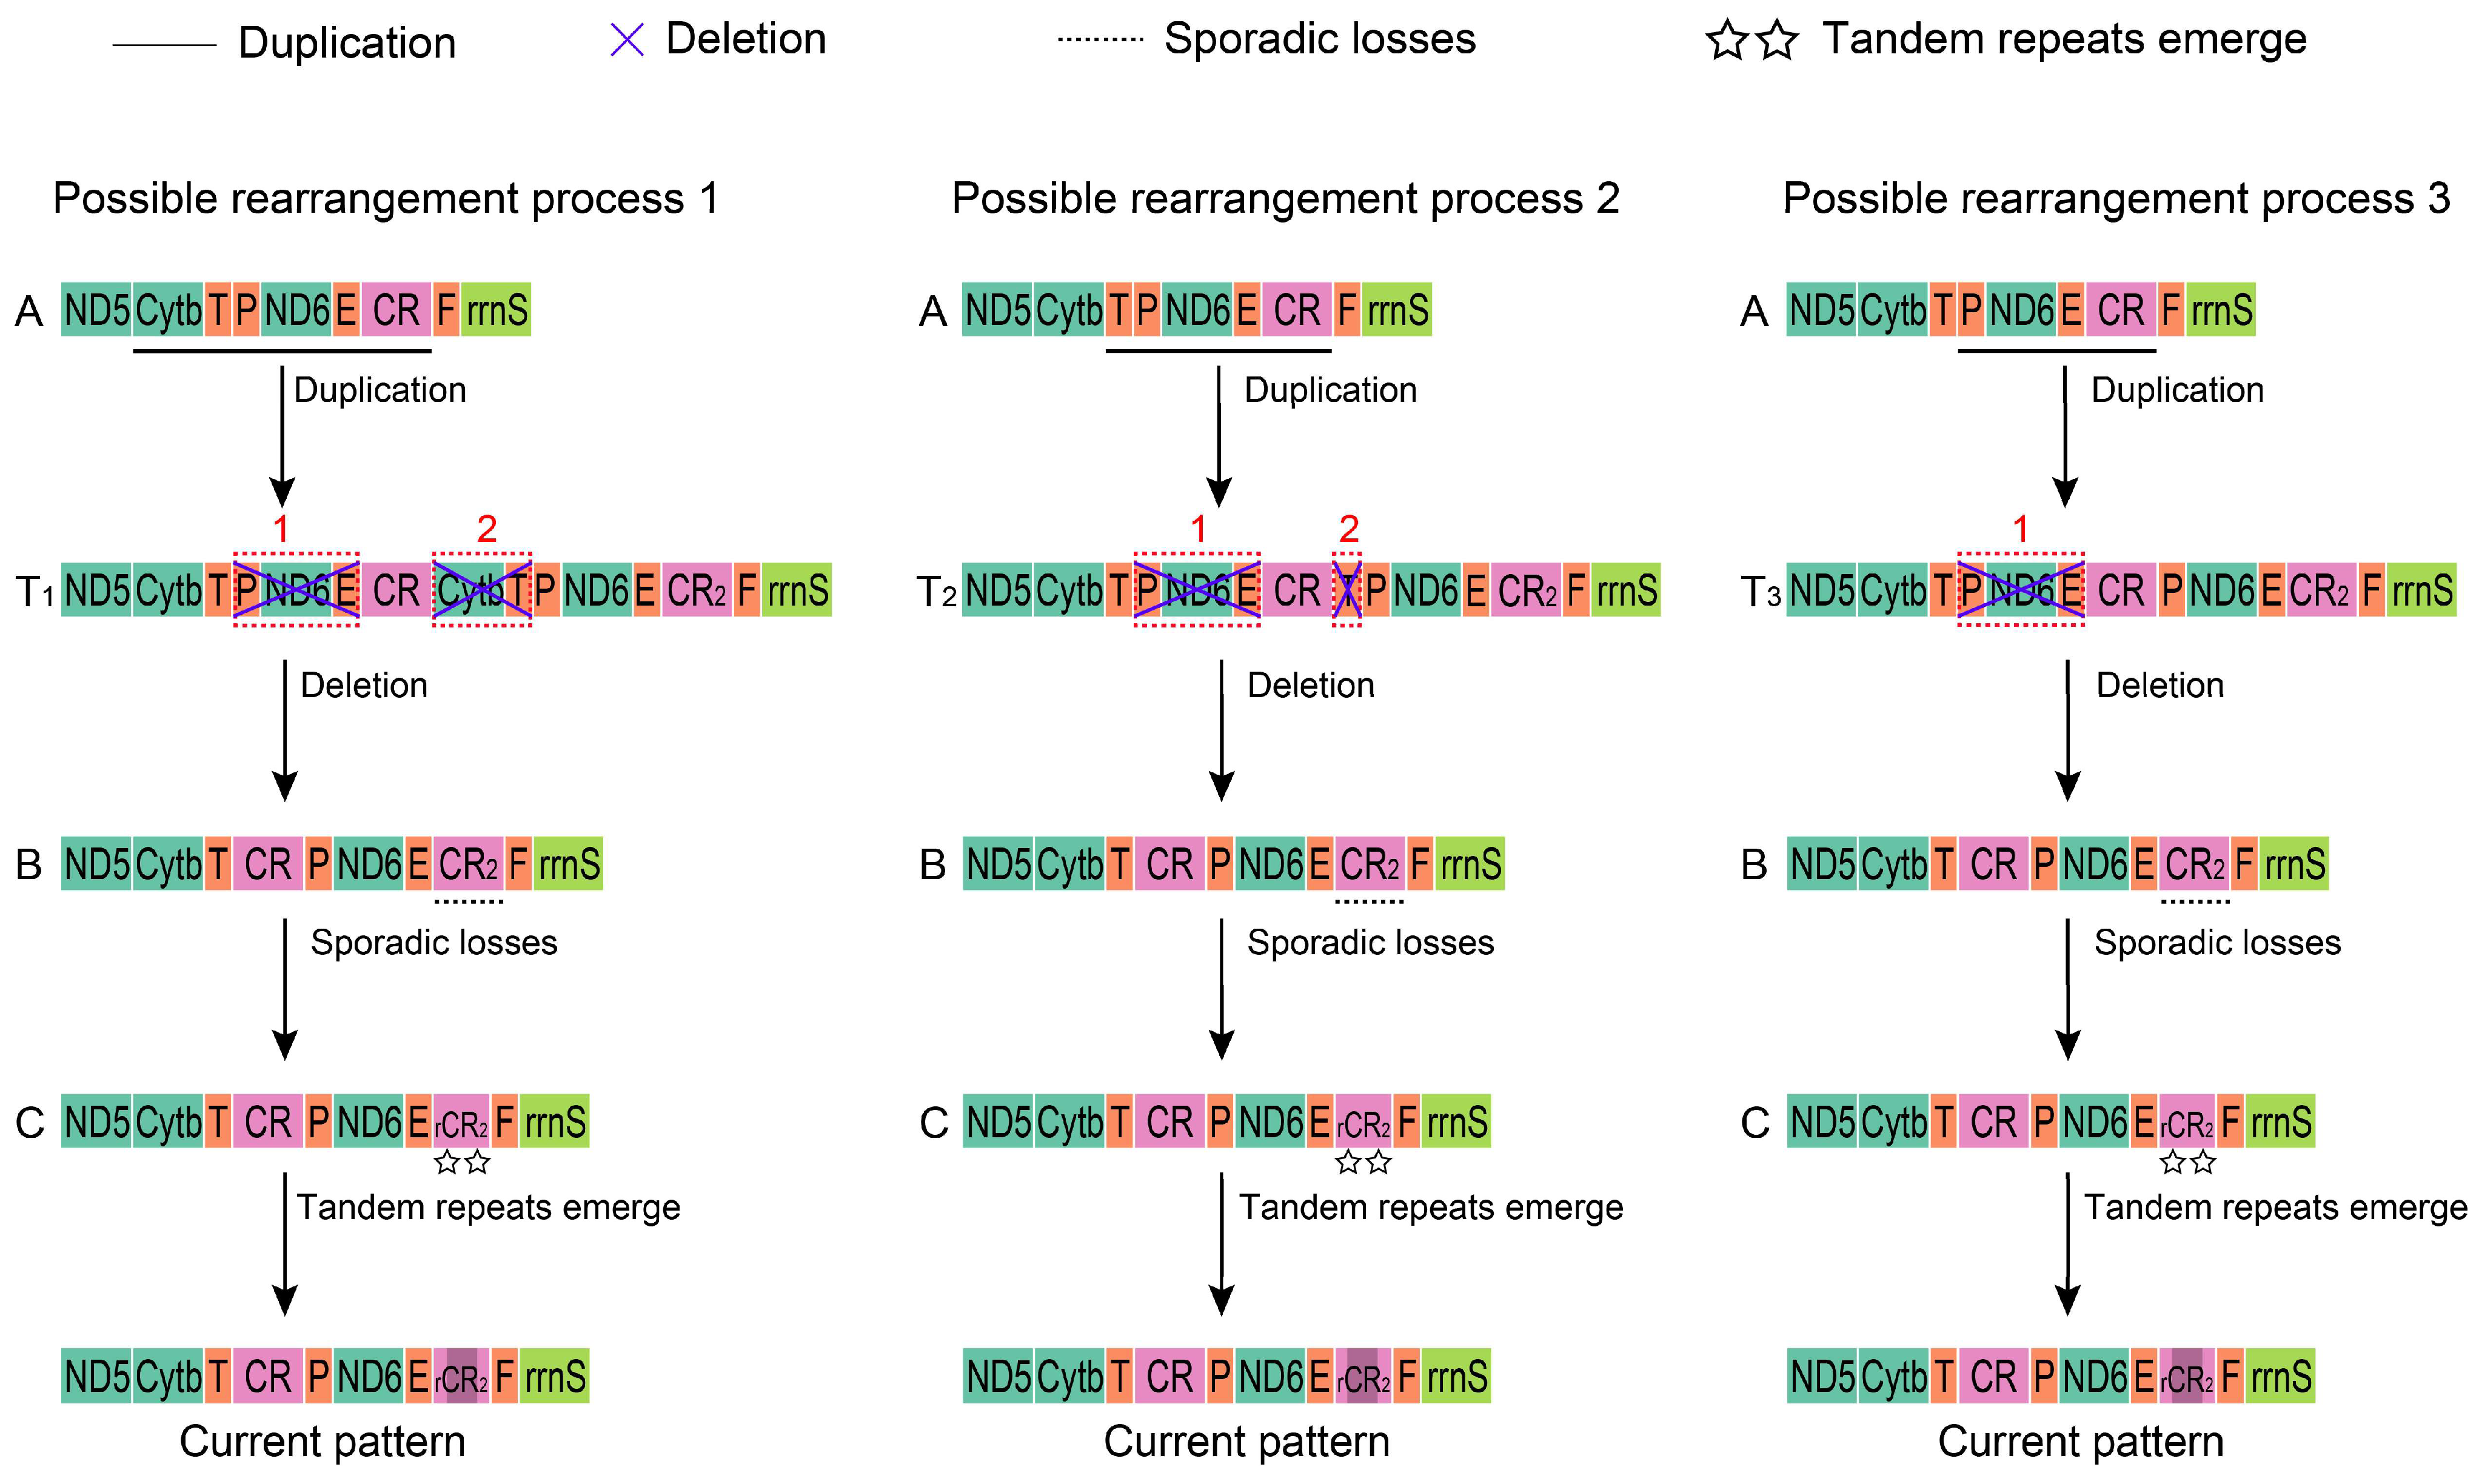
Based on the TDRL model and previous research, we speculated on three possible processes of mt gene arrangement for these Alaudidae species starting from the avian ancestral gene order (type A) [10,11,12,13] (Figure 7). In process I, the Cytb-trnT-trnP-ND6-trnE-CR fragment in the mt gene order A was first duplicated, followed by the loss of two small fragments (trnP-ND6-trnE and Cytb-trnT). Then, as indel events and mutations continuously accumulated in completed CR2, the mt gene order B transitioned to C, with tandem repeats emerging last in rCR2. The shorter fragment of trnT-trnP-ND6-trnE-CR duplicated first, and then, two losses of trnP1-ND6-trnE and trnT occurred in process II, while in process III, the shortest fragment of trnP-ND6-trnE-CR was firstly duplicated, followed by a loss of trnP-ND6-trnE. The rest of the rearrangement in processes II and III were the same as in process I, leading to the final observed mt gene order.

4. Discussion

4.1. Phylogenetic Relationships

Sparse sampling in phylogenetic studies of Sylvioidea species can introduce bias. Some molecular phylogenetic studies have neglected to include species from Panuridae and Nicatoridae, leading to the placement of Alaudidae at the edge of Sylvioidea [11,28,29,30,31,32,33,34]. However, when including either Nicatoridae species [35,36] or Panuridae [37,38] or both [39,40,41,42,43,44,45], Alaudidae and Panuridae were found to cluster together and form a sister clade to the rest of the birds in Sylvioidea. In this study, the mitochondrial genomes provided further evidence for the sister relationship between Alaudidae and monotypic family Panuridae, confirming their basal position within Sylvioidea (Figure 2). It is worth noting that the location of Nicatoridae was uncertain due to low nodal support. This might be resolved with large data sets, as indicated by previous studies [44,45]. The phylogenetic relationships within Alaudidae were well supported and consistent with both phylogeny using multi-locus and SNP datasets [23,24].

4.2. Evolutionary Progression of Mt Gene Arrangement in Alaudidae

The study by Mackiewicz [11] suggested that the arrangement of the mt gene in Sylvioidea may have been the result of recent independent rearrangements or inheritance from an early Psittaciformes ancestor. The TDRL model, which accounts for intermediate gene orders and residual repetitive genes, is considered the most plausible explanation for these rearrangements [10,11,12,13]. In relation to Alaudidae, we speculated on three possible processes of mt gene rearrangement (Figure 7). The mt gene order with three types of duplication (T1, T2, and T3, Figure 7) was similar to those found in other birds, such as T1 in Ardea cinerea [4] and Grus virgo [6]; T2 in Bubo blakistoni [3] and Diomedea melanophris [7]; and T3 in Crypturellus tataupa and Rhea americana [10]. If the mt gene arrangement of Alaudidae was a recent occurrence within Sylvioidea, all three possible rearrangement processes of Alaudidae mitogenomes would be possible. Process III was the most parsimonious compared to processes I and II. However, if the mt gene order in Sylvioidea (Passeriformes) was inherited from ancestor Psittaciformes, then process I becomes the most likely explanation for the observed gene order given the specific mt gene duplication (T1) found in Psittaciformes.
A special case is observed in A. gulgula, where the rCR2 3NR and rrnS 5′end show a 100% similarity across 81 base pairs (Figure 5a), which is hard to explain with the TDRL model. An alternative explanation is the occurrence of a recent recombination event. While avian mtDNA genetic variation is generally thought to be minimally affected by recombination [77], there is experimental and circumstantial evidence suggesting the existence of recombination in animal mtDNA [14,78]. Two recombination models explained the origin of this sequence: One involves direct inter-molecular insertion induced by the mini-circles excised from one mtDNA molecule [79], while the other involves illegitimate elongation induced by the stem-loop structures in tRNAs or some non-replication origins [80]. Further investigation and empirical evidence are needed to determine the precise mechanism underlying this phenomenon.
Additionally, all observed mt gene orders in clade X of Alaudidae and Panuridae have been classified as type C with rCR2 (Figure 2 and Figure 6). This suggests that CR2 duplications and sporadic losses occurred prior to the divergence between Alaudidae and Panuridae, and this trait could be a synapomorphy of clade X (Figure 2). Taking into account that Alaudidae diverged approximately 20 million years ago [23,24,44,45], it is plausible that the type C with rCR2 arrangement has existed for over 20 million years. Certainly, sequencing more complete mitogenomes from other larks could further highlight the evolutionary progression of mt gene arrangement in Alaudidae.

4.3. Evolutionary Progression of rCR2 in Alaudidae

Unlike other birds with CR2 sharing similarity with CR1 [2,3,4,5,6,7,8,9,10,11,12], the CR2 of these larks has lost homology with CR1 due to severe degradation and the presence of tandem repeats. We established the homology between these tandem repeats among larks, suggesting that their ancestor’s CR2 already possessed tandem repeats (Figure 2). However, it is more likely that these repeats originated from an ancestor of Alaudidae after the divergence of clade X rather than being inherited from the CR1 (Figure 2), similar to the CR2 tandem repeats observed in Accipitridae [81]. This is supported by the absence of repeats or homologous sequences in CR1 of any Alaudidae species. Meanwhile, the occurrence of CR tandem repeats in Sylvioidea species was infrequent (Figure 2, Table S2) and showed no association with tandem repeats in CR1 (Fisher’s exact test p = 0.1063). Additionally, the distribution of tandem repeats in CR2 was random in all Sylvioidea species except for Alaudidae and Hirundinidae (Figure 2, Table S2). All of this reduced the possibility of tandem repeats in rCR2 being inherited from CR1 when tracing back to the common ancestor of Sylvioidea. Similarly, tandem repeats only appeared at the end of complete CR2 that was highly homologous to CR1 in some birds of Sylvioidea, such as Locustella pleskei (KY230383), Poodytes punctatus (KC545398), and Acrocephalus orientalis (NC_046418) (Figure S5).
Due to the lack of extensive recombination in avian mtDNA [77], slipped-strand mispairing is often considered the cause of the generation and evolution of tandem repeats, especially when single strands of the repeat units can form stable secondary structures [18,21,22]. This mechanism is well supported in these mtDNAs of larks: One or two repeat units could form stable secondary structures with multiple stem-loop and high free energy in all examined mtDNAs. In addition, the tandem repeats of these larks should originate from a common ancestor, but the paralogs (within species) of these repeat units are more similar than the orthologs (between species), which can be explained by the turnover model [20] or gene conversion [82]. The turnover model refers to the phenomenon that there was a turnover of repeat units within a tandem repeat, with new unit types arising through mutations and increasing in frequency through duplications and with the possibility of some types being lost through deletions and genetic drift [20,83]. This process is closely related to slipped-strand mispairing, and units capable of forming stable secondary structures will have an advantage in evolution [16,22]. Gene conversion refers to homologous recombination, where two duplicate genes exchange sequences between two molecules or within a single molecule [82]. Although both processes can make paralogs more similar than orthologs, considering that (1) the repeat units of these larks can form stable secondary structures, (2) the fusion of two units into one unit in E. alpestris, (3) the special arrangement of repeat units and comparison of secondary structures between repeat units in the M. mongolica, and (4) that the initial unit of tandem repeats has a less stable secondary structure (indicated by lower free energy) compared to the subsequent units in A. arvensis, A. razae, and C. cinerea, the DNA turnover model appears to be more suitable for describing the evolution of tandem repeats of larks.

5. Conclusions

In this study, mitogenomes of Alaudala cheleensis, Eremophila alpestris, Alauda razae, and Calandrella cinerea were characterized. Similar to other larks, these mitogenomes have a higher AT content (highest in CR2) and a tendency toward A skew and C skew. Codons ending with A and C were more frequent than those ending with U and G, and all tRNAs could be folded into classic cloverleaf structure except for trnS1 (AGY). All lark mitogenomes shared gene rearrangements of Cytb-trnT-CR1-trnP-nad6-trnE-rCR2-trnF-rrnS and contained tandem repeats in rCR2. The TDRL model can effectively explain the evolution of gene order, suggesting that this gene rearrangement could have evolved from the ancestral gene order in at least three ways. Alaudidae and Panuridae are sister groups at the base of Sylvioidea, and sporadic losses of CR2 may occur in their common ancestor. The tandem repeats in rCR2 are thought to have originated from an ancestor of Alaudidae rather than being inherited from CR1 (ancestor of Sylvioidea or Psittaciformes). They are most likely generated through slipped-strand mispairing and evolve through DNA turnover. Sequencing more lark mitogenomes could provide a better understanding of the gene rearrangements and CR2 tandem repeats of Alaudidae.

Supplementary Materials

The following supporting information can be downloaded at: https://www.mdpi.com/article/10.3390/life14070881/s1, Figure S1: Phylogenetic tree of several Alaudala species based on the Cyt b under three models; Figure S2: RSCU analysis of the PCGs of six mitogenomes of six species of larks; Figure S3: Secondary structures of 22 tRNAs of E. alpestris mitogenome; Figure S4: Secondary structures of one and two units; Figure S5: Alignment among CR1 and CR2 in some Sylvioidea species; Table S1: PCR primers used in this study for amplification and sequencing; Table S2: Published mitogenomes of Sylvioidea species; Table S3: GenBank accession numbers and gene order for the 71 sequences in this study; Table S4: The sites, subset partitions, and best models used in phylogenetic analysis; Table S5: Nucleotide composition and bias of six novel mitogenome; Table S6: Initial and terminal codons for protein-coding genes; Table S7: The structure of rCR2 in twelve larks; Table S8: Pairwise similarity for consensus sequences of repeat unit in CR2 repetitive sequences among eight lark species.

Author Contributions

Conceptualization, B.L.; methodology, C.J., B.L. and Y.Z.; software, C.J.; validation, C.J.; formal analysis, C.J., H.K., W.Z. and X.Z.; investigation, B.L. and C.J.; resources, B.L. and H.K.; data curation, C.J. and H.K.; writing—original draft preparation, C.J.; writing—review and editing, B.L., N.M. and Y.Z.; visualization, C.J; supervision, B.L.; project administration, B.L.; funding acquisition, B.L. All authors have read and agreed to the published version of the manuscript.

Funding

This research was funded by National Key R&D Program of China (Grant No. 2016YFC1201602) and the Fundamental Research Funds for the Central Universities (Grant NO. 2572018BE04). Funder: Department of Science and Technology, Northeast Forestry University.

Institutional Review Board Statement

All experiments were approved by THE INSTITUTIONAL REVIEW BOARD OF EXPERIMENTAL ANIMALS AND LIFE ETHICS OF NORTHEAST FORESTRY UNIVERSITY, approval number 2024053.

Data Availability Statement

The genome sequence data that support the findings of this study are openly available in GenBank of NCBI at https://www.ncbi.nlm.nih.gov/, accessed on 24 April 2024 (Accession number: MH061200-MH061203, PP719628-PP719629).

Acknowledgments

We are grateful to Wei Zhang, Yanchun Xu, and Suying Bai for their guidance and logistic assistance during collection of partial samples.

Conflicts of Interest

Author Yang Zhou was employed by the BGI Research. The remaining authors declare that the research was conducted in the absence of any commercial or financial relationships that could be construed as a potential conflict of interest.

References

  1. Moore, W.S. Inferring phylogenies from mtDNA variation: Mitochondrial-gene trees versus nuclear-gene trees. Evol. Int. J. Org. Evol. 1995, 49, 718–726. [Google Scholar] [CrossRef]
  2. Eberhard, J.R.; Wright, T.F. Rearrangement and evolution of mitochondrial genomes in parrots. Mol. Phylogenet. Evol. 2016, 94, 34–46. [Google Scholar] [CrossRef] [PubMed]
  3. Kang, H.; Li, B.; Ma, X.; Xu, Y. Evolutionary progression of mitochondrial gene rearrangements and phylogenetic relationships in Strigidae (Strigiformes). Gene 2018, 674, 8–14. [Google Scholar] [CrossRef] [PubMed]
  4. Zhou, X.; Lin, Q.; Fang, W.; Chen, X. The complete mitochondrial genomes of sixteen ardeid birds revealing the evolutionary process of the gene rearrangements. BMC Genom. 2014, 15, 573. [Google Scholar] [CrossRef] [PubMed]
  5. Urantowka, A.D.; Kroczak, A.; Strzala, T.; Zaniewicz, G.; Kurkowski, M.; Mackiewicz, P. Mitogenomes of Accipitriformes and Cathartiformes were subjected to ancestral and recent duplications followed by gradual degeneration. Genome Biol. Evol. 2021, 13, evab193. [Google Scholar] [CrossRef] [PubMed]
  6. Akiyama, T.; Nishida, C.; Momose, K.; Onuma, M.; Takami, K.; Masuda, R. Gene duplication and concerted evolution of mitochondrial DNA in crane species. Mol. Phylogenet. Evol. 2017, 106, 158–163. [Google Scholar] [CrossRef] [PubMed]
  7. Abbott, C.L.; Double, M.C.; Trueman, J.W.H.; Robinson, A.; Cockburn, A. An unusual source of apparent mitochondrial heteroplasmy: Duplicate mitochondrial control regions in Thalassarche albatrosses. Mol. Ecol. 2005, 14, 3605–3613. [Google Scholar] [CrossRef] [PubMed]
  8. Bensch, S. Mitochondrial genomic rearrangements in songbirds. Mol. Biol. Evol. 2000, 17, 107–113. [Google Scholar] [CrossRef] [PubMed]
  9. Gibb, G.C.; Kardailsky, O.; Kimball, R.T.; Braun, E.L.; Penny, D. Mitochondrial genomes and avian phylogeny: Complex characters and resolvability without explosive radiations. Mol. Biol. Evol. 2007, 24, 269–280. [Google Scholar] [CrossRef] [PubMed]
  10. Urantówka, A.D.; Kroczak, A.; Mackiewicz, P. New view on the organization and evolution of Palaeognathae mitogenomes poses the question on the ancestral gene rearrangement in Aves. BMC Genom. 2020, 21, 874. [Google Scholar] [CrossRef] [PubMed]
  11. Mackiewicz, P.; Urantówka, A.D.; Kroczak, A.; Mackiewicz, D. Resolving phylogenetic relationships within Passeriformes based on mitochondrial genes and inferring the evolution of their mitogenomes in terms of duplications. Genome Biol. Evol. 2019, 11, 2824–2849. [Google Scholar] [CrossRef] [PubMed]
  12. Caparroz, R.; Rocha, A.V.; Cabanne, G.S.; Tubaro, P.; Aleixo, A.; Lemmon, E.M.; Lemmon, A.R. Mitogenomes of two neotropical bird species and the multiple independent origin of mitochondrial gene orders in Passeriformes. Mol. Biol. Rep. 2018, 45, 279–285. [Google Scholar] [CrossRef]
  13. Boore, J.L. The duplication/random loss model for gene rearrangement exemplified by mitochondrial genomes of deuterostome animals. In Comparative Genomics: Empirical and Analytical Approaches to Gene Order Dynamics, Map Alignment and the Evolution of Gene Families; Springer: Dordrecht, The Netherlands, 2000; pp. 133–147. [Google Scholar] [CrossRef]
  14. Lunt, D.H.; Hyman, B.C. Animal mitochondrial DNA recombination. Nature 1997, 387, 247. [Google Scholar] [CrossRef] [PubMed]
  15. Skujina, I.; McMahon, R.; Lenis, V.P.E.; Gkoutos, G.V.; Hegarty, M. Duplication of the mitochondrial control region is associated with increased longevity in birds. Aging 2016, 8, 1781–1789. [Google Scholar] [CrossRef] [PubMed]
  16. Omote, K.; Nishida, C.; Dick, M.H.; Masuda, R. Limited phylogenetic distribution of a long tandem-repeat cluster in the mitochondrial control region in Bubo (Aves, Strigidae) and cluster variation in Blakiston’s Fish Owl (Bubo blakistoni). Mol. Phylogenet. Evol. 2013, 66, 889–897. [Google Scholar] [CrossRef] [PubMed]
  17. Mundy, N.I.; Winchell, C.S.; Woodruff, D.S. Tandem repeats and heteroplasmy in the mitochondrial DNA control region of the Loggerhead Shrike (Lanius ludovicianus). J. Hered. 1996, 87, 21–26. [Google Scholar] [CrossRef] [PubMed]
  18. Wang, X.; Liu, N.; Zhang, H.; Yang, X.J.; Huang, Y.; Lei, F. Extreme variation in patterns of tandem repeats in mitochondrial control region of yellow-browed tits (Sylviparus modestus, Paridae). Sci. Rep. 2015, 5, 13227. [Google Scholar] [CrossRef] [PubMed]
  19. Hasson, J.F.; Mougneau, E.; Cuzin, F.; Yaniv, M. Simian virus 40 illegitimate recombination occurs near short direct repeats. J. Mol. Biol. 1984, 177, 53–68. [Google Scholar] [CrossRef] [PubMed]
  20. Hoelzel, A.R. Evolution by DNA turnover in the control region of vertebrate mitochondrial DNA. Curr. Opin. Genet. Dev. 1993, 3, 891–895. [Google Scholar] [CrossRef] [PubMed]
  21. Levinson, G.; Gutman, G.A. Slipped-strand mispairing: A major mechanism for DNA sequence evolution. Mol. Biol. Evol. 1987, 4, 203–221. [Google Scholar] [CrossRef] [PubMed]
  22. Buroker, N.E.; Brown, J.R.; Gilbert, T.A.; O’Hara, P.J.; Beckenbach, A.T.; Thomas, W.K.; Smith, M.J. Length heteroplasmy of sturgeon mitochondrial DNA: An illegitimate elongation model. Genetics 1990, 124, 157–163. [Google Scholar] [CrossRef] [PubMed]
  23. Alström, P.; Barnes, K.N.; Olsson, U.; Barker, F.K.; Bloomer, P.; Khan, A.A.; Qureshi, M.A.; Guillaumet, A.; Crochet, P.-A.; Ryan, P.G. Multilocus phylogeny of the avian family Alaudidae (larks) reveals complex morphological evolution, non-monophyletic genera and hidden species diversity. Mol. Phylogenet. Evol. 2013, 69, 1043–1056. [Google Scholar] [CrossRef] [PubMed]
  24. Alström, P.; Mohammadi, Z.; Enbody, E.D.; Irestedt, M.; Engelbrecht, D.; Crochet, P.-A.; Guillaumet, A.; Rancilhac, L.; Tieleman, B.I.; Olsson, U.; et al. Systematics of the avian family Alaudidae using multilocus and genomic data. Avian Res. 2023, 14, 100095. [Google Scholar] [CrossRef]
  25. IOC World Bird List (v14.1). Available online: https://www.worldbirdnames.org/new (accessed on 14 May 2024).
  26. Qian, C.; Wang, Y.; Guo, Z.; Yang, J.; Kan, X. Complete mitochondrial genome of Skylark, Alauda arvensis (Aves: Passeriformes): The first representative of the family Alaudidae with two extensive heteroplasmic control regions. Mitochondrial DNA 2013, 24, 246–248. [Google Scholar] [CrossRef] [PubMed]
  27. Zeng, Z.; Lu, J.Y.; Yang, M.L.; Kang, H. Complete mitochondrial genome of the Mongolian Lark, Melanocorypha mongolica (Aves: Passeriformes). Mitochondrial DNA Part B 2017, 2, 266–267. [Google Scholar] [CrossRef] [PubMed]
  28. Yang, C.; Zhao, L.; Wang, Q.; Yuan, H.; Li, X.; Wang, Y. Mitogenome of Alaudala cheleensis (Passeriformes: Alaudidae) and comparative analyses of Sylvioidea mitogenomes. Zootaxa 2021, 4952, 331–353. [Google Scholar] [CrossRef] [PubMed]
  29. Groth, J.G. Molecular phylogenetics of finches and sparrows: Consequences of character state removal in cytochrome b sequences. Mol. Phylogenet. Evol. 1998, 10, 377–390. [Google Scholar] [CrossRef] [PubMed]
  30. Barker, F.K.; Cibois, A.; Schikler, P.; Feinstein, J.; Cracraft, J. Phylogeny and diversification of the largest avian radiation. Proc. Natl. Acad. Sci. USA 2004, 101, 11040–11045. [Google Scholar] [CrossRef] [PubMed]
  31. Ericson, P.G.P.; Klopfstein, S.; Irestedt, M.; Nguyen, J.M.T.; Nylander, J.A.A. Dating the diversification of the major lineages of Passeriformes (Aves). BMC Evol. Biol. 2014, 14, 8. [Google Scholar] [CrossRef]
  32. Barker, F.K. Mitogenomic data resolve basal relationships among Passeriform and passerida birds. Mol. Phylogenet. Evol. 2014, 79, 313–324. [Google Scholar] [CrossRef] [PubMed]
  33. Gibb, G.C.; England, R.; Hartig, G.; McLenachan, P.A.; Smith, B.L.T.; McComish, B.J.; Cooper, A.; Penny, D. New Zealand passerines help clarify the diversification of major songbird lineages during the Oligocene. Genome Biol. Evol. 2015, 7, 2983–2995. [Google Scholar] [CrossRef] [PubMed]
  34. Zhang, H.; Bai, Y.; Shi, X.; Sun, L.; Wu, X. The complete mitochondrial genomes of Tarsiger cyanurus and Phoenicurus auroreus: A phylogenetic analysis of Passeriformes. Genes Genom. 2018, 40, 151–165. [Google Scholar] [CrossRef] [PubMed]
  35. Beresford, P.; Barker, F.K.; Ryan, P.G.; Crowe, T.M. African endemics span the tree of songbirds (Passeri): Molecular systematics of several evolutionary ‘enigmas’. Proc. R. Soc. B-Biol. Sci. 2005, 272, 849–858. [Google Scholar] [CrossRef] [PubMed]
  36. Claramunt, S.; Cracraft, J. A bew time tree reveals earth history’s imprint on the evolution of modern birds. Sci. Adv. 2015, 1, e1501005. [Google Scholar] [CrossRef] [PubMed]
  37. Ericson, P.G.P.; Johansson, U.S. Phylogeny of Passerida (Aves: Passeriformes) based on nuclear and mitochondrial sequence data. Mol. Phylogenet. Evol. 2003, 1, 126–138. [Google Scholar] [CrossRef] [PubMed]
  38. Alström, P.; Ericson, P.G.P.; Olsson, U.; Sundberg, P. Phylogeny and classification of the avian superfamily Sylvioidea. Mol. Phylogenet. Evol. 2006, 38, 381–397. [Google Scholar] [CrossRef] [PubMed]
  39. Jonsson, K.A.; Fjeldsa, J. A phylogenetic supertree of oscine passerine birds (Aves: Passeri). Zool. Scr. 2006, 35, 149–186. [Google Scholar] [CrossRef]
  40. Johansson, U.S.; Fjelds, J.; Bowie, R. Phylogenetic relationships within passerida (Aves: Passeriformes): A review and a new molecular phylogeny based on three nuclear intron markers. Mol. Phylogenet. Evol. 2008, 48, 858–876. [Google Scholar] [CrossRef] [PubMed]
  41. Fregin, S.; Haase, M.; Olsson, U.; Alström, P. New insights into family relationships within the avian superfamily Sylvioidea (Passeriformes) based on seven molecular markers. BMC Evol. Biol. 2012, 12, 157. [Google Scholar] [CrossRef] [PubMed]
  42. Alström, P.; Hooper, D.M.; Liu, Y.; Olsson, U.; Mohan, D.; Gelang, M.; Le Manh, H.; Zhao, J.; Lei, F.; Price, T.D. Discovery of a relict lineage and monotypic family of passerine birds. Biol. Lett. 2014, 10, 20131067. [Google Scholar] [CrossRef] [PubMed]
  43. Selvatti, A.P.; Gonzaga, L.P.; de Moraes Russo, C.A. A Paleogene origin for crown passerines and the diversification of the oscines in the New World. Mol. Phylogenet. Evol. 2015, 88, 1–15. [Google Scholar] [CrossRef]
  44. Moyle, R.G.; Oliveros, C.H.; Andersen, M.J.; Hosner, P.A.; Benz, B.W.; Manthey, J.D.; Travers, S.L.; Brown, R.M.; Faircloth, B.C. Tectonic collision and uplift of Wallacea triggered the global songbird radiation. Nat. Commun. 2016, 7, 12709. [Google Scholar] [CrossRef] [PubMed]
  45. Oliveros, C.H.; Field, D.J.; Ksepka, D.T.; Barker, F.K.; Aleixo, A.; Andersen, M.J.; Alstrom, P.; Benz, B.W.; Braun, E.L.; Braun, M.J.; et al. Earth history and the passerine superradiation. Proc. Natl. Acad. Sci. USA 2019, 116, 7916–7925. [Google Scholar] [CrossRef] [PubMed]
  46. Alstrom, P.; van Linschooten, J.; Donald, P.F.; Sundev, G.; Mohammadi, Z.; Ghorbani, F.; Shafaeipour, A.; van den Berg, A.; Robb, M.; Aliabadian, M.; et al. Multiple species delimitation approaches applied to the avian lark genus Alaudala. Mol. Phylogenet. Evol. 2021, 154, 106994. [Google Scholar] [CrossRef] [PubMed]
  47. Ghorbani, F.; Aliabadian, M.; Zhang, R.; Irestedt, M.; Hao, Y.; Sundev, G.; Lei, F.; Ma, M.; Olsson, U.; Alstrom, P. Densely sampled phylogenetic analyses of the Lesser Short-Toed Lark (Alaudala rufescens)—Sand Lark (A. raytal) species complex (Aves, Passeriformes) reveal cryptic diversity. Zool. Scr. 2020, 49, 427–439. [Google Scholar] [CrossRef]
  48. Sigeman, H.; Strandh, M.; Proux-Wéra, E.; Kutschera, V.E.; Ponnikas, S.; Zhang, H.; Lundberg, M.; Soler, L.; Bunikis, I.; Tarka, M.; et al. Avian neo-sex chromosomes reveal dynamics of recombination suppression and W degeneration. Mol. Biol. Evol. 2021, 38, 5275–5291. [Google Scholar] [CrossRef] [PubMed]
  49. Chen, S.; Zhou, Y.; Chen, Y.; Gu, J. Fastp: An ultra-fast all-in-one FASTQ preprocessor. Bioinformatics 2018, 34, i884–i890. [Google Scholar] [CrossRef] [PubMed]
  50. Jin, J.-J.; Yu, W.-B.; Yang, J.-B.; Song, Y.; dePamphilis, C.W.; Yi, T.-S.; Li, D.-Z. GetOrganelle: A fast and versatile toolkit for accurate de novo assembly of organelle genomes. Genome Biol. 2020, 21, 241. [Google Scholar] [CrossRef] [PubMed]
  51. Kearse, M.; Moir, R.; Wilson, A.; Stones-Havas, S.; Cheung, M.; Sturrock, S.; Buxton, S.; Cooper, A.; Markowitz, S.; Duran, C.; et al. Geneious basic: An integrated and extendable desktop software platform for the organization and analysis of sequence data. Bioinformatics 2012, 28, 1647–1649. [Google Scholar] [CrossRef] [PubMed]
  52. Lowe, T.M.; Eddy, S.R. tRNAscan-SE: A program for improved detection of transfer RNA genes in genomic sequence. Nucleic Acids Res. 1997, 25, 955–964. [Google Scholar] [CrossRef]
  53. Stothard, P.; Grant, J.R.; Van Domselaar, G. Visualizing and comparing circular genomes using the CGView family of tools. Brief. Bioinform. 2019, 20, 1576–1582. [Google Scholar] [CrossRef] [PubMed]
  54. Perna, N.T.; Kocher, T.D. Patterns of nucleotide composition at fourfold degenerate sites of animal mitochondrial genomes. J. Mol. Evol. 1995, 41, 353–358. [Google Scholar] [CrossRef] [PubMed]
  55. Zhang, D.; Gao, F.; Jakovli, I.; Zou, H.; Wang, G.T. PhyloSuite: An integrated and scalable desktop platform for streamlined molecular sequence data management and evolutionary phylogenetics studies. Mol. Ecol. Resour. 2020, 20, 348–355. [Google Scholar] [CrossRef] [PubMed]
  56. Donath, A.; Jühling, F.; Al-Arab, M.; Bernhart, S.H.; Reinhardt, F.; Stadler, P.F.; Middendorf, M.; Bernt, M. Improved annotation of protein-coding genes boundaries in metazoan mitochondrial genomes. Nucleic Acids Res. 2019, 47, 10543–10552. [Google Scholar] [CrossRef] [PubMed]
  57. Randi, E.; Lucchini, V. Organization and evolution of the mitochondrial DNA control region in the avian genus Alectoris. J. Mol. Evol. 1998, 47, 449–462. [Google Scholar] [CrossRef]
  58. Ruokonen, M.; Kvist, L. Structure and evolution of the avian mitochondrial control region. Mol. Phylogenet. Evol. 2002, 23, 422–432. [Google Scholar] [CrossRef] [PubMed]
  59. Benson, G. Tandem repeats finder: A program to analyze DNA sequences. Nucleic Acids Res. 1999, 27, 573–580. [Google Scholar] [CrossRef] [PubMed]
  60. Zuker, M. Mfold web server for nucleic acid folding and hybridization prediction. Nucleic Acids Res. 2003, 31, 3406–3415. [Google Scholar] [CrossRef] [PubMed]
  61. Rice, P.; Longden, I.; Bleasby, A. EMBOSS: The european molecular biology open software suite. Trends Genet. 2000, 16, 276–277. [Google Scholar] [CrossRef] [PubMed]
  62. Zardoya, R.; Meyer, A. Phylogenetic performance of mitochondrial protein-coding genes in resolving relationships among vertebrates. Mol. Biol. Evol. 1996, 13, 933–942. [Google Scholar] [CrossRef]
  63. Xiang, C.Y.; Gao, F.; Jakovlić, I.; Lei, H.P.; Hu, Y.; Zhang, H.; Zou, H.; Wang, G.T.; Zhang, D. Using PhyloSuite for molecular phylogeny and tree-based analyses. iMeta 2023, 2, e87. [Google Scholar] [CrossRef]
  64. Katoh, K.; Standley, D.M. MAFFT multiple sequence alignment software version 7: Improvements in performance and ssability. Mol. Biol. Evol. 2013, 30, 772–780. [Google Scholar] [CrossRef] [PubMed]
  65. Ranwez, V.; Douzery, E.J.P.; Cambon, C.; Chantret, N.; Delsuc, F. MACSE v2: Toolkit for the alignment of coding sequences accounting for frameshifts and stop codons. Mol. Biol. Evol. 2018, 35, 2582–2584. [Google Scholar] [CrossRef] [PubMed]
  66. Talavera, G.; Castresana, J. Improvement of phylogenies after removing divergent and ambiguously aligned blocks from protein sequence alignments. Syst. Biol. 2007, 56, 564–577. [Google Scholar] [CrossRef] [PubMed]
  67. Lanfear, R.; Frandsen, P.B.; Wright, A.M.; Senfeld, T.; Calcott, B. PartitionFinder 2: New methods for selecting partitioned models of evolution for molecular and morphological phylogenetic analyses. Mol. Biol. Evol. 2017, 34, 772–773. [Google Scholar] [CrossRef] [PubMed]
  68. Ronquist, F.; Huelsenbeck, J.P. MrBayes 3: Bayesian phylogenetic inference under mixed models. Bioinformatics 2003, 19, 1572–1574. [Google Scholar] [CrossRef] [PubMed]
  69. Rambaut, A.; Drummond, A.J.; Xie, D.; Baele, G.; Suchard, M.A. Posterior summarisation in bayesian phylogenetics using tracer 1.7. Syst. Biol. 2018, 67, 901–904. [Google Scholar] [CrossRef] [PubMed]
  70. Nguyen, L.T.; Schmidt, H.A.; von Haeseler, A.; Minh, B.Q. IQ-TREE: A fast and effective stochastic algorithm for estimating maximum-likelihood phylogenies. Mol. Biol. Evol. 2015, 32, 268–274. [Google Scholar] [CrossRef] [PubMed]
  71. Available online: https://birdsoftheworld.org/bow/support/citations-and-references (accessed on 14 May 2024).
  72. Chen, W.; Miao, K.; Wang, J.; Wang, H.; Sun, W.; Yuan, S.; Luo, S.; Hu, C.; Chang, Q. Five new mitogenomes sequences of Calidridine sandpipers (Ayes: Charadriiformes) and comparative mitogenomics of genus Calidris. Peerj 2022, 10, e13268. [Google Scholar] [CrossRef] [PubMed]
  73. Yang, C.; Du, X.; Liu, Y.; Yuan, H.; Wang, Q.; Hou, X.; Gong, H.; Wang, Y.; Huang, Y.; Li, X.; et al. Comparative mitogenomics of the genus Motacilla (Aves, Passeriformes) and its phylogenetic implications. ZooKeys 2022, 1109, 49–65. [Google Scholar] [CrossRef] [PubMed]
  74. Yang, C.; Dong, X.; Wang, Q.; Hou, X.; Yuan, H.; Li, X. Mitochondrial genome characteristics of six Phylloscopus species and their phylogenetic implication. PeerJ 2023, 11, e16233. [Google Scholar] [CrossRef]
  75. Ding, H.; Bi, D.; Han, S.; Yi, R.; Zhang, S.; Ye, Y.; Gao, J.; Yang, J.; Kan, X. Mitogenomic codon usage patterns of superfamily Certhioidea (Aves, Passeriformes): Insights into asymmetrical bias and phylogenetic implications. Animals 2023, 13, 96. [Google Scholar] [CrossRef] [PubMed]
  76. Montana-Lozano, P.; Balaguera-Reina, S.A.; Prada-Quiroga, C.F. Comparative analysis of codon usage of mitochondrial genomes provides evolutionary insights into reptiles. Gene 2023, 851, 146999. [Google Scholar] [CrossRef] [PubMed]
  77. Berlin, S.; Smith, N.G.C.; Ellegren, H. Do avian mitochondria recombine? J. Mol. Evol. 2004, 58, 163–167. [Google Scholar] [CrossRef] [PubMed]
  78. Kurabayashi, A.; Sumida, M.; Yonekawa, H.; Glaw, F.; Vences, M.; Hasegawa, M. Phylogeny, recombination, and mechanisms of stepwise mitochondrial genome reorganization in Mantellid Frogs from Madagascar. Mol. Biol. Evol. 2008, 25, 874–891. [Google Scholar] [CrossRef] [PubMed]
  79. Sato, A.; Nakada, K.; Akimoto, M.; Ishikawa, K.; Ono, T.; Shitara, H.; Yonekawa, H.; Hayashi, J.L. Rare creation of recombinant mtDNA haplotypes in mammalian tissues. Proc. Natl. Acad. Sci. USA 2005, 102, 6057–6062. [Google Scholar] [CrossRef]
  80. Broughton, R.E.; Dowling, T.E. Length variation in mitochondrial DNA of the minnow Cyprinella spiloptera. Genetics 1994, 138, 179–190. [Google Scholar] [CrossRef] [PubMed]
  81. Cadahía, L.; Pinsker, W.; Negro, J.J.; Pavlicev, M.; Urios, V.; Haring, E. Repeated sequence homogenization between the control and pseudo-control regions in the mitochondrial genomes of the subfamily Aquilinae. J. Exp. Zoolog. B Mol. Dev. Evol. 2009, 312, 171–185. [Google Scholar] [CrossRef]
  82. Chen, J.M.; Cooper, D.N.; Chuzhanova, N.; Ferec, C.; Patrinos, G.P. Gene conversion: Mechanisms, evolution and human disease. Nat. Rev. Genet. 2007, 8, 762–775. [Google Scholar] [CrossRef] [PubMed]
  83. Rand, D.M.; Harrison, R.G. Molecular population genetics of mtDNA size variation in crickets. Genetics 1989, 121, 551–569. [Google Scholar] [CrossRef] [PubMed]
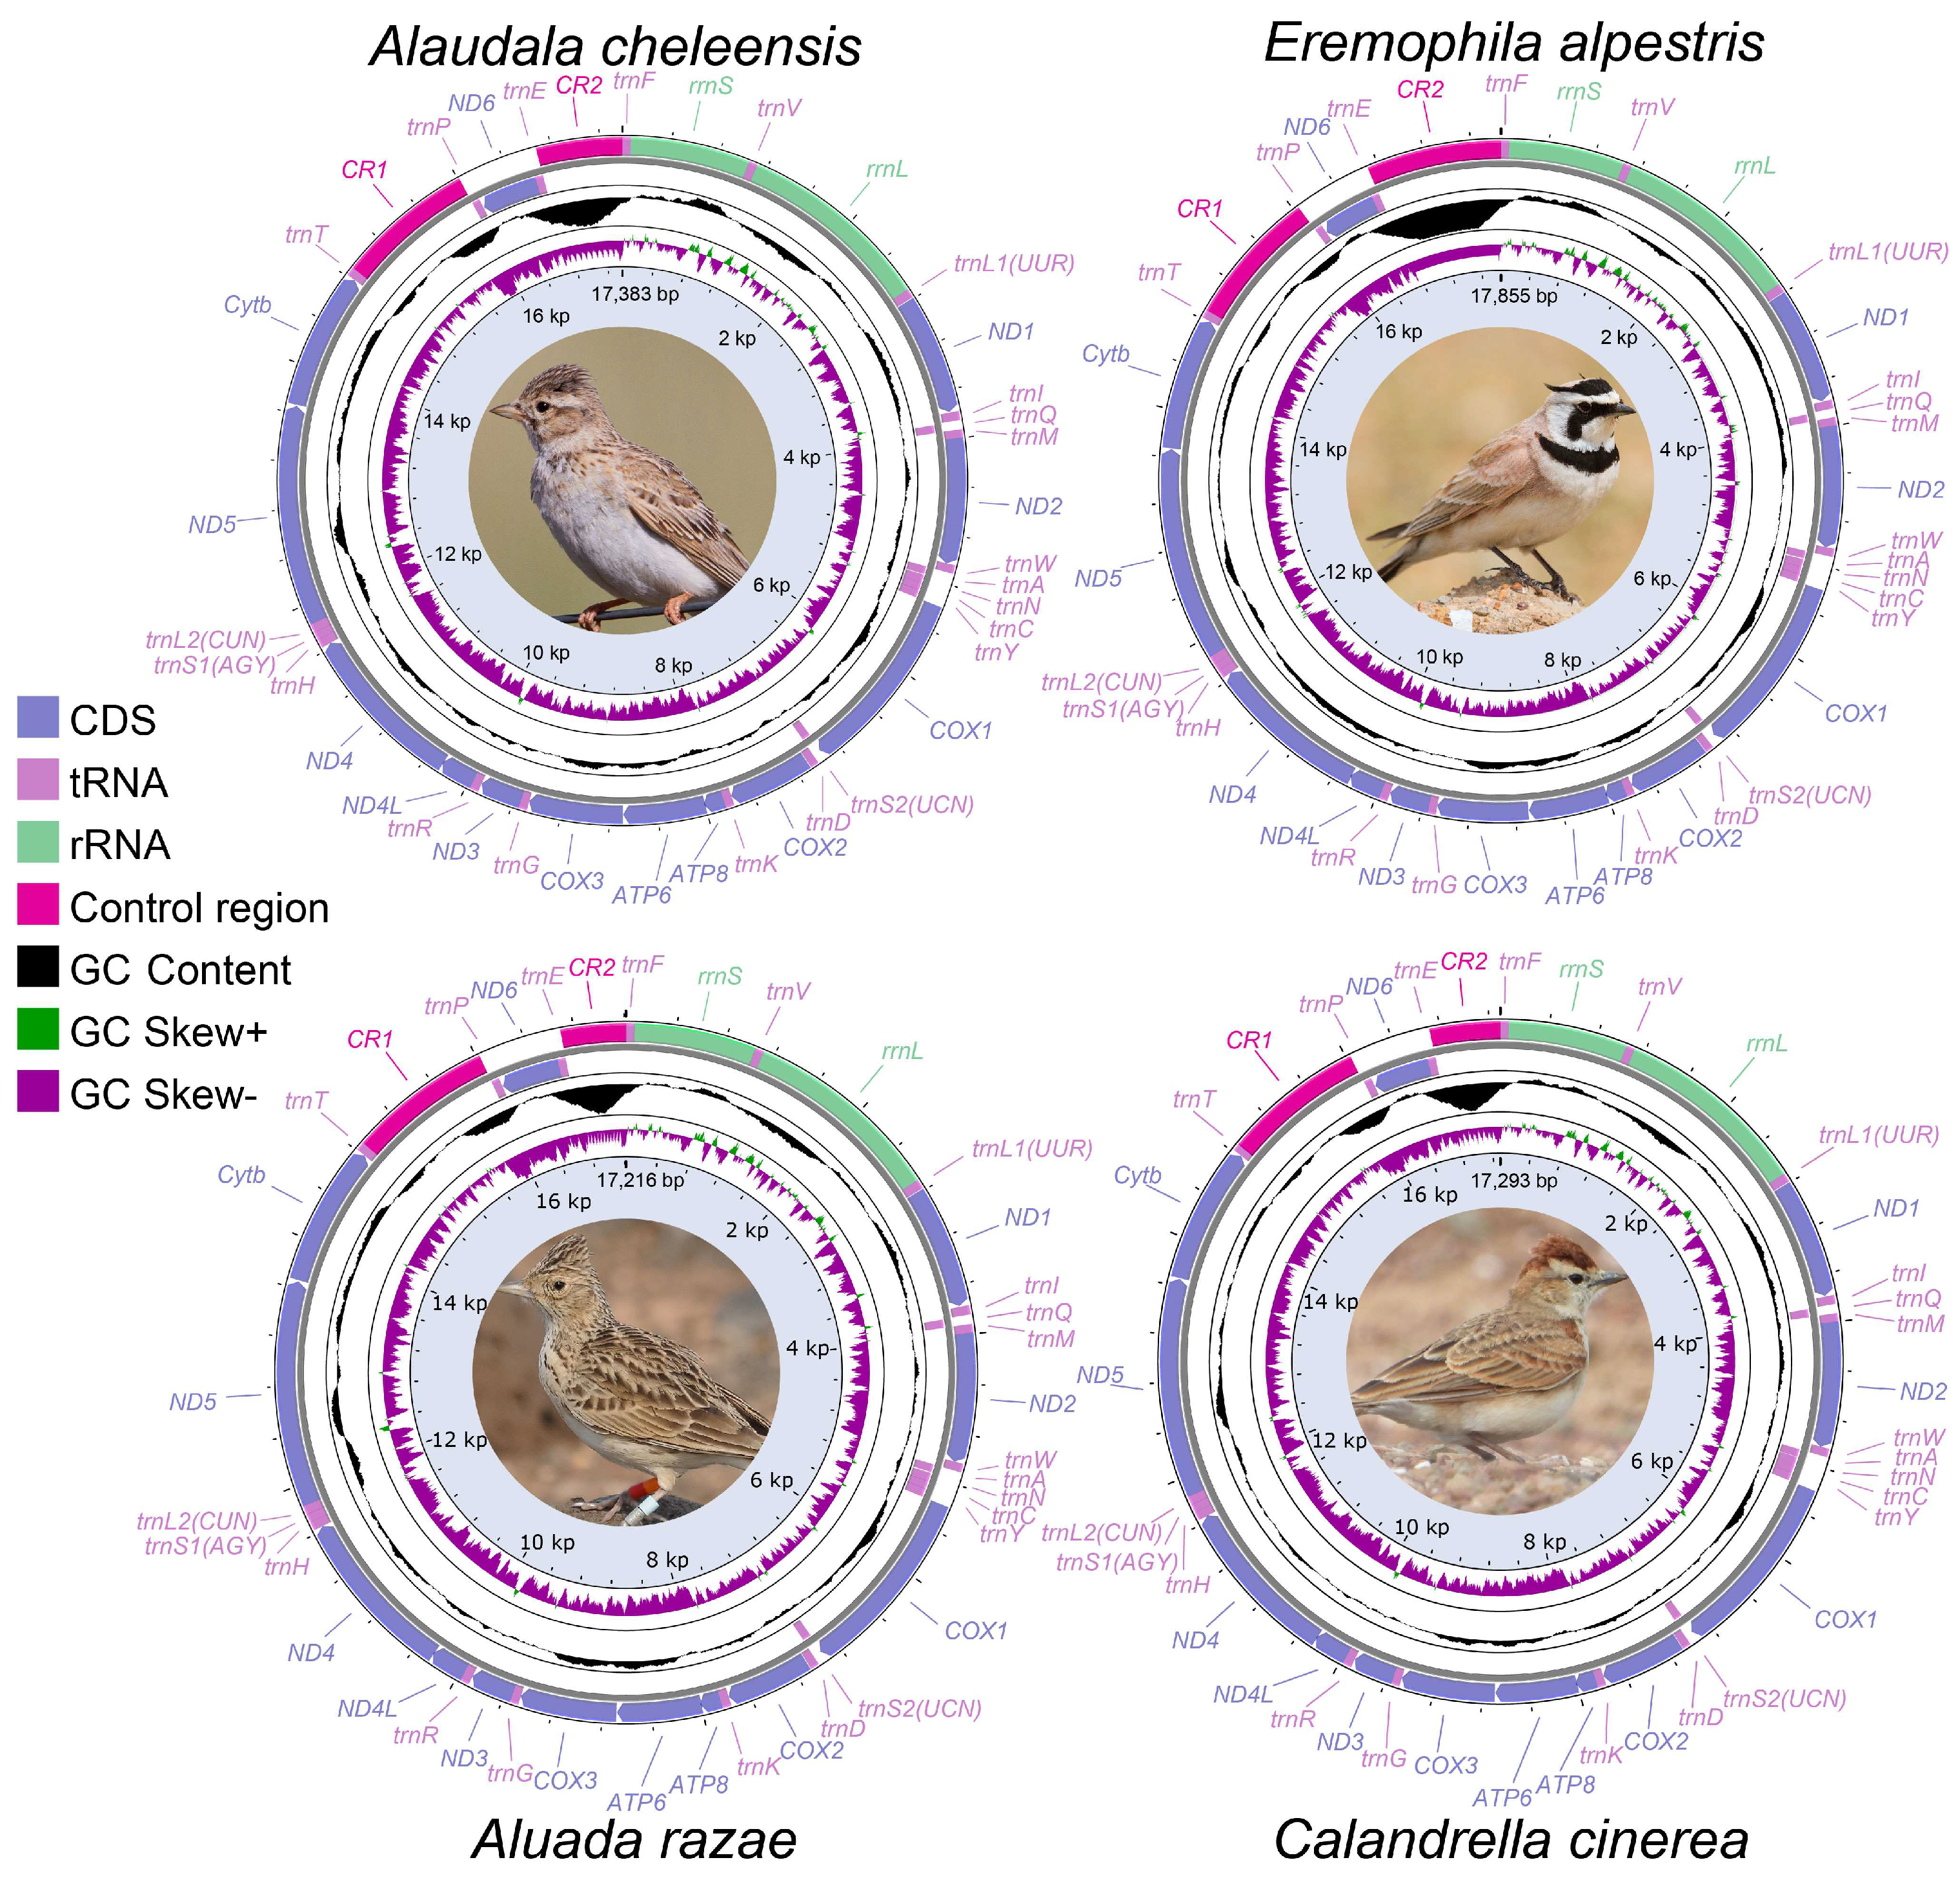
Figure 1. Mitochondrial genome map of four lark species. Genes encoded on the H or L strand are indicated on the outside or inside of the circular mitogenome map, respectively. Arrows indicate the gene transcription direction. The GC skew (50 bp window size) is plotted using a green and purple sliding window, indicating positive and negative values, respectively. GC content (500 bp window size) shows a deviation from the average GC content of the entire sequence. The photo is sourced from Birds of the World [71].
Life 14 00881 g001
Figure 2. Inferred phylogenetic relationships based on mitogenomes using BI and ML. The topological structure obtained from BI is shown. Node support values are listed at nodes in the order PP/SH-aLRT/BP, and - indicates topological conflicts. The species enclosed in red dashed lines has two CRs. The gene order (A, B, C, T1, UN = unknown) corresponding to Table S3 for each species is labeled after the species name (Specific gene order see Section 3.4 below). The left rectangle and the right rectangle following the species name represent the tandem repeats of CR1 and CR2, respectively. Unfilled indicates the absence of repeat, while filled indicates the presence of repeat. The green and purple bidirectional arrows represent the time of CR2 sporadic losses and the emergence of CR2 tandem repeats, respectively. Branch lengths of the outgroup have been shortened.
Life 14 00881 g002
Figure 3. The molecular organization of the CRs in new mitogenomes. The structures of CR1 and CR2 are respectively displayed on the left and right sides of the vertical dashed line. Different colors are used to represent distinct motifs. Green circles represent tandem repeat (Each circle represents a repeat unit.) The size of the gene is not scaled.
Life 14 00881 g003
Figure 4. The structure of rCR2 in 12 larks. The green horizontal line represents the sequence of 5NR, the brown horizontal line represents the sequence of 3NR, and the arrow represents each tandem repeat unit. The color of the arrow indicates the identity between the sequence of this repeat unit and the repeat unit consensus sequence within species. The lengths of 5NR, TR, 3NR, and each repeat unit are scaled according sequence lengths.
Life 14 00881 g004
Figure 5. (a) Alignment among 3′ NR of rCR2 and 5′ rrnS in A. gulgula. (b) Alignment among repeat unit in rCR2 of eight different larks. The sequences of all the larks were aligned using consensus sequences, except for M. mongolica, which was aligned using the H1. Inconsistent loci among sequences were marked by a colored background.
Life 14 00881 g005
Figure 6. (a) The secondary structures of two types of units (H1 and H2) and their combination (H1 + H2) in M. mongolica. (bd) The secondary structures are predicted, respectively, by the initial repeat unit and the consensus sequences of subsequent repeat units.
Life 14 00881 g006
Figure 7. Three possible rearrangement processes of Alaudidae mitogenomes. The size of the gene is not scaled. The black horizontal line indicates duplications of gene blocks. The blue cross mark indicates the random loss of the duplicated genes, and the red numbers above them indicate the times lost. The black horizontal dashed line indicates sporadic losses in CR2. The double stars indicate emergence of tandem repeats. Different types of genes are labeled with different colors. The black block in rCR2 represents tandem repeats. A, B, and C represent different mt gene orders. T1, T2, and T3 represent transitional states of gene rearrangement.
Life 14 00881 g007
Table 1. Sequence information for the haplotypes and consensus sequences of rCR2 repeat units of eight lark species.
SpeciesHaplotypeSequence (5′–3′)Similarity among HaplotypeFree Energy (kcal/mol)
One UnitTwo Unit
E. alpestrisACSAACAAAAGAAATCAATCCCATTTCTTTCTTTATTATACATATAATAAAGAG98.0~100.0%−9.04−18.26~−18.08
A1...................................................
A2..................T................................
A3.....----------------------------------------------
A. cheleensisBCSACACACGTATAAATAAAGACAGGACACCTT-ACGTCTTCTTATACTATTCTTATACTATTATACACGT94.1~100.0%−3.23~−2.63−8.17
B1......A.....G.................-.....................................
B2..............................T.....................................
B3..............................-.....................................
B4......A.....G.................-..........................G..........
B5..............................-..........................G..........
B6.........---------------------------................................
B7..............................-...........--------------------------
A. heineiCCSCACGTATAAGTAAAGAGAGGACACCTCACGTCTCCTTACTATTATACGTGTA100%−8.30~−7.54−18.48~−17.72
C1....................................................
C2............................................--------
A. arvensisDCSAAAGAAATCAATCCCATTGATTTCATTATATTAGTAT100.0%−6.81~−5.93−15.36
D1.......C..G..ATA....C....C.G.....A..C −2.58~−2.49
D2.....................................
D3.................--------------------
A. gulgulaECSAAAGAAATCAATCCCATTGATTTCATTATATTAGTAT92.9%−6.81~−5.93−15.36
E1.....................................
E2....G.........-----------------------
A. razaeFCSAAAGAAATCAACCCTATTGACTTCATTATATTAGTAT100%−3.10~−2.22−7.94
F1..CA..CCA.T...-...................... −0.90~−0.10
F2.....................................
F3................---------------------
C. cinereaGCSAAAGAATAAGAGACCACTCTTACTCTTTATCATACACATAACTGTATATATATATATGTAT100%−7.70~−6.82−19.60
G1.......---------.A..CTTA..C.T.ATC.T...C.TAAC.G..........TA... −2.92~−2.31
G2.............................................................
G3............................................----.............
G4..........................
M. mongolicaH1TCTTTACTTATTACATGTATATAAAGTAGAGA −2.03
H2......TC.....T..ACG..C...AC..... 0.10
H3......................----------
H1 + H2TCTTTACTTATTACATGTATATAAAGTAGAGATCTTTATCTATTATATACGTACAAAACAGAGA100.0%−3.65
The haplotypes correspond to the Table S7 column “Tandem repeats”. Dashes indicate gaps, and dots indicate identity sites. The first repeat units (D1, F1, and G1) of A. arvensis, A. razae, and C. cinerea were excluded when calculating similarity among intra-species haplotype because they may be discarded during the evolution of tandem repeats. The free energy of sequence corresponds to the secondary structure shown in Figure 5 and Figure S5.
Disclaimer/Publisher’s Note: The statements, opinions and data contained in all publications are solely those of the individual author(s) and contributor(s) and not of MDPI and/or the editor(s). MDPI and/or the editor(s) disclaim responsibility for any injury to people or property resulting from any ideas, methods, instructions or products referred to in the content.