1. Introduction
The human leukocyte antigen (HLA; known as MHC in other vertebrates) plays a central role in the recognition and presentation of antigens to the immune system and represents the most polymorphic gene cluster in the human genome [
1]. This extensive polymorphism of the HLA genes among world populations results from selective pressures, including functional adaptations, particularly of bacteria, viruses, and parasites [
2,
3], which are particularly important in the understanding of human population variability. The HLA system in different populations is important in disease association, transplantation, and anthropological studies, among others. This genetic system located on the chromosomal region 6p21.3 encodes the HLA-class I (
HLA-A,
-B, and
-C), class II (
HLA-DRA1, DRB loci,
DQA1,
-DQB1,
-DPA1 and
-DPB1), and class III (encoding mostly complement system proteins) [
4]. The HLA class I and class II can be analyzed to compare populations and calculate genetic distances (e.g., correspondence analysis and dendrograms), which have become a feasible genetic marker between populations due to their correlation with the geographic spaces inhabited by human groups [
5].
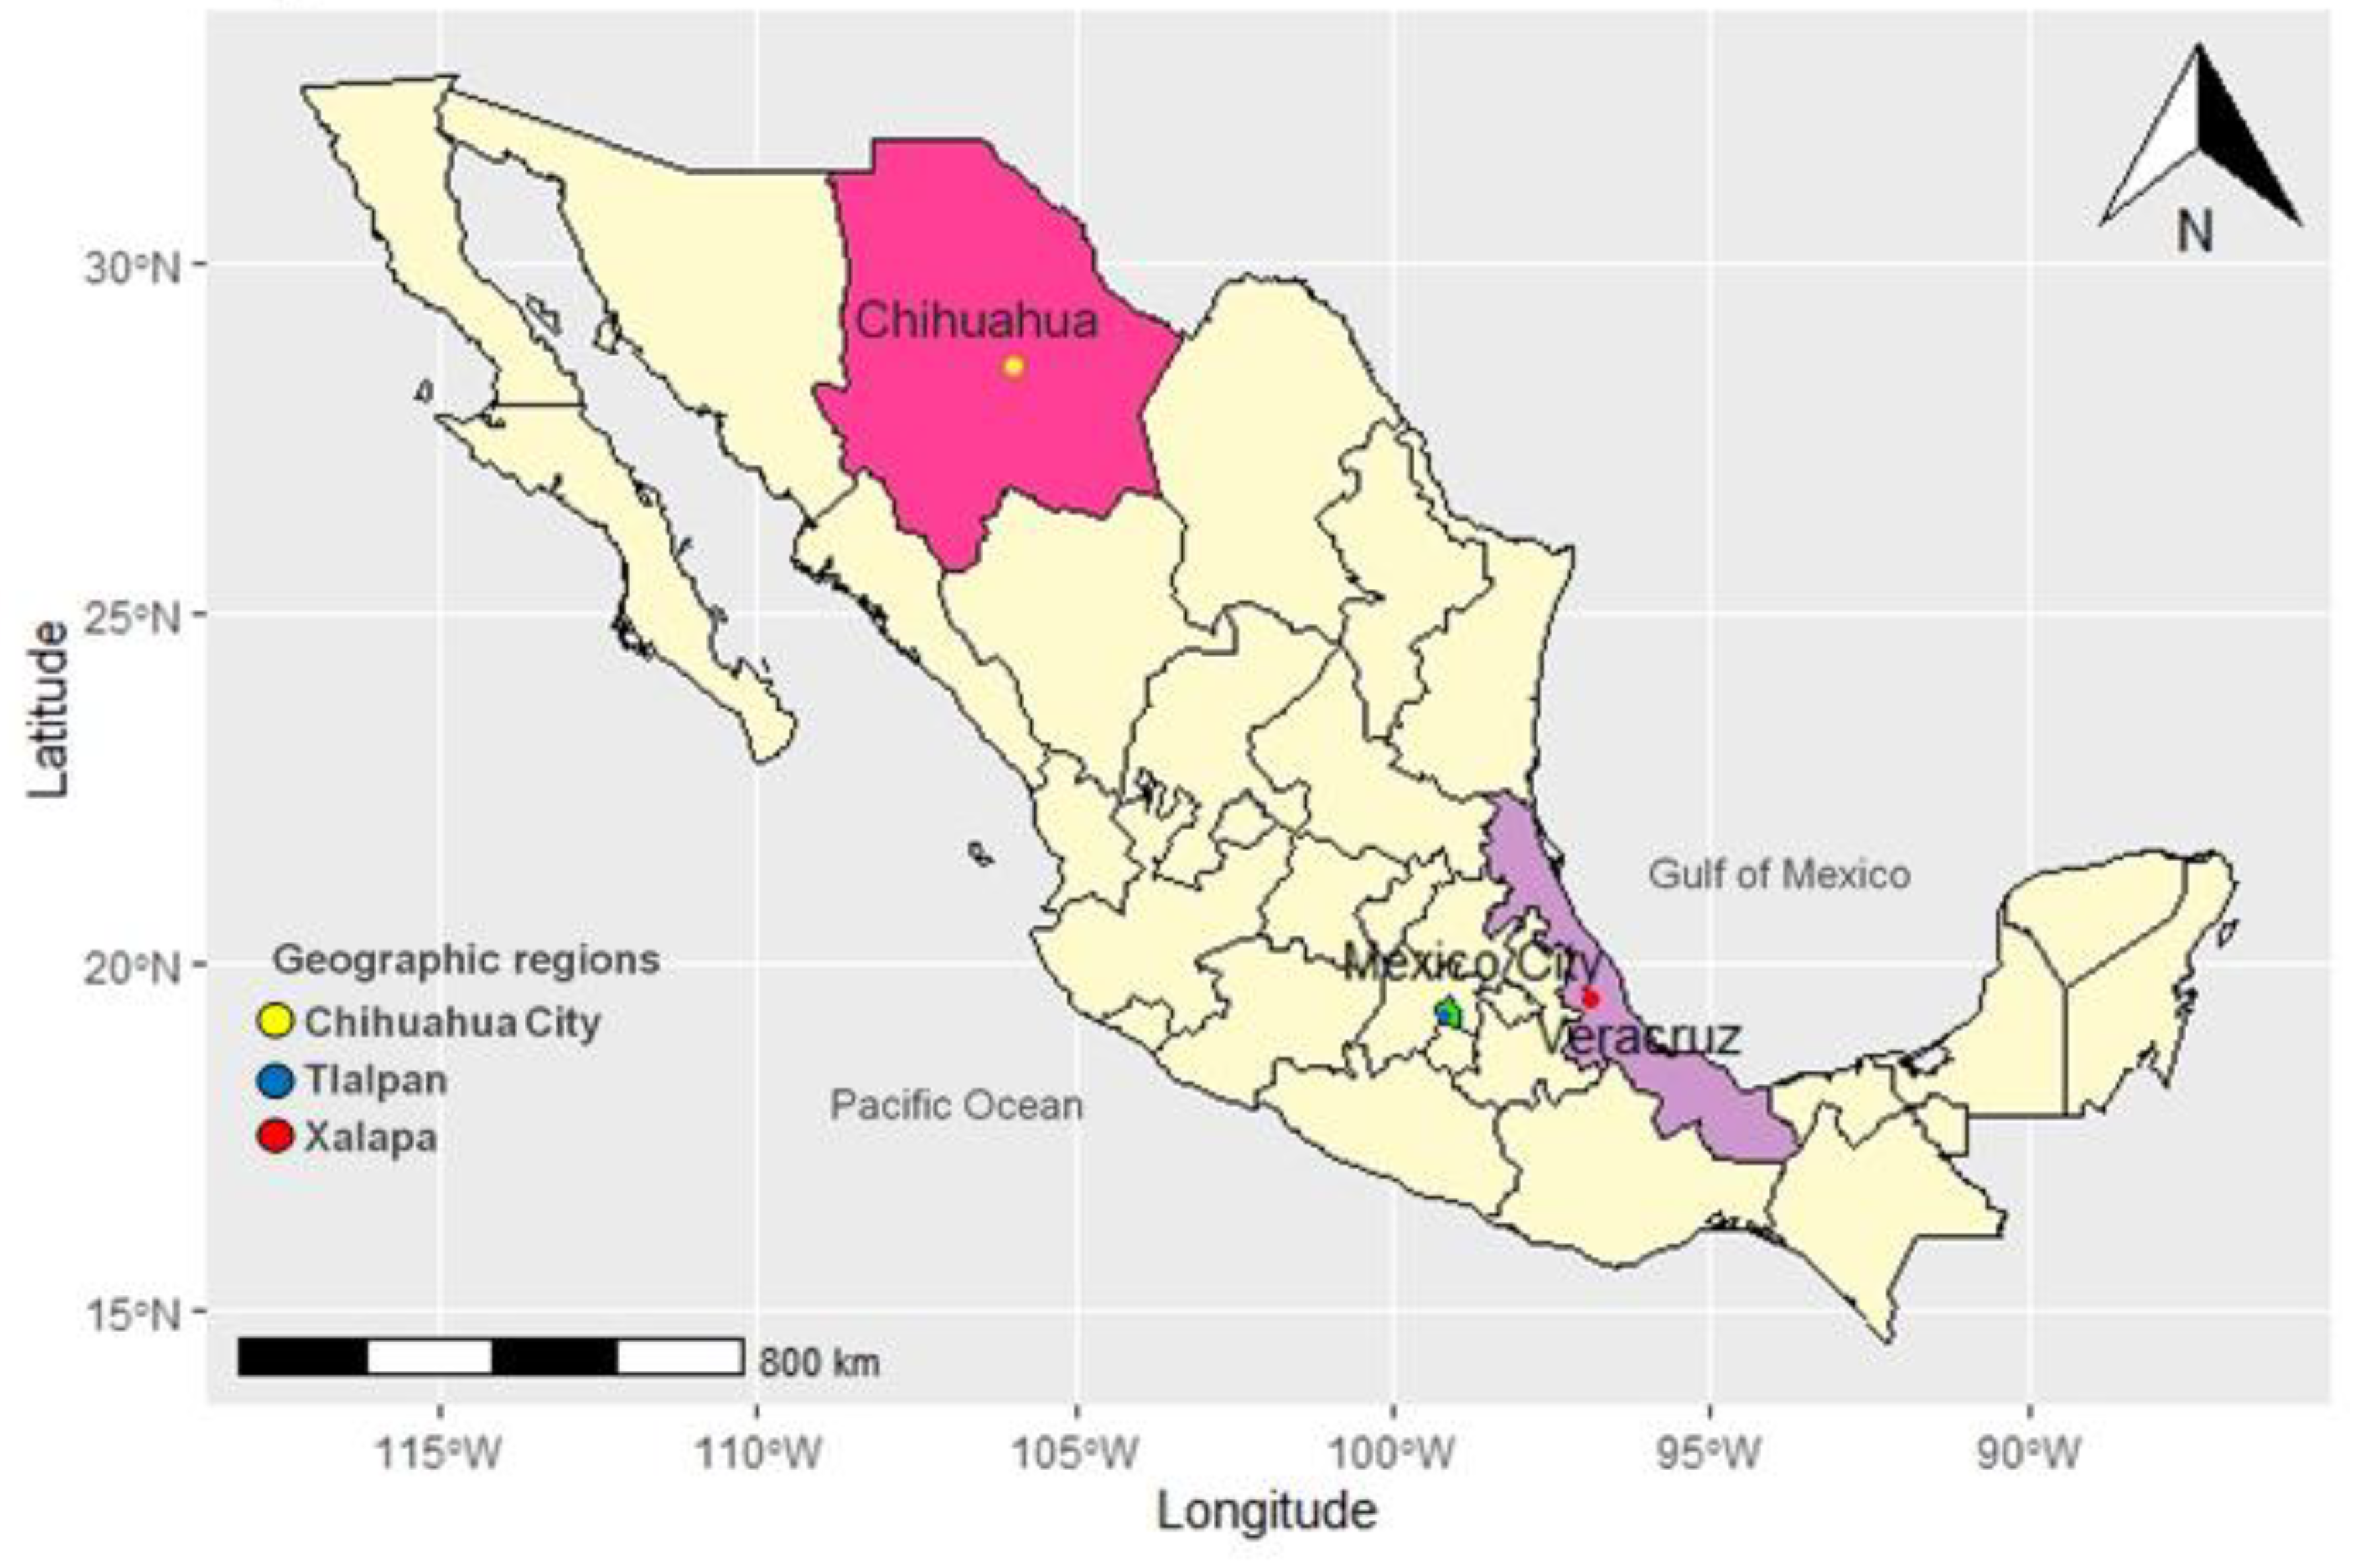
Mexico is located in the North American meridional region. The country’s territory has a total area of 1,972,550 km
2 and a total population of 128,632,000 inhabitants; the national population comprises a high percentage of Spanish speakers (spa-ISO 639-3 Ethnologue); in addition, there are 70 indigenous groups speaking 69 native languages distributed throughout the territory [
6,
7] (
Figure 1).
The genetic constitution of the Mexican population is very complex; at the time of the arrival of the Spanish conquistadors, the highest population density was located in the Mesoamerican region. After the Spanish conquest, indigenous groups settled in occupying the northern portion of the country came into contact with the Spaniards, who were attracted to this territory due to the discovery of large deposits of mineral resources along the road known as Real de Minas [
8]. The present-day populations of northern Mexico are the result of a process of miscegenation between native Amerindian, Spanish, and African populations; the resulting genetic recombination of these populations allowed the emergence of new mestizo populations [
9].
Mexico City is located in the central region of Mexico. It is the most highly populated city in the country, with 8,985,339 inhabitants [
10]. Mexico City has been inhabited by several indigenous groups; indeed, the Nahua group is currently the largest in the region; mainly in the mayoralty of Milpa Alta [
11,
12,
13]. Also, Mexico City is the economic, political, and social center of Mexico; most of its population speaks Spanish; nevertheless, some villages that are part of the city include Nahuatl speakers (nhw-ISO 639-3 Ethnologue) [
7,
11]. Tlalpan may have been the first urban settlement in the Basin of Mexico and was known as San Agustín de las Cuevas during the colonial period [
14]. Tlalpan has a total population of 650,567 inhabitants, which includes both urban (29%) and rural areas [
10] (
Figure 1).
In the north of the country, the state of Chihuahua is bordered to the south by the states of Durango and Sinaloa, to the East by Coahuila, and to the west by Sonora. Chihuahua City, which is the capital and the second most important urban center of the state, has a population of 819,543 inhabitants [
15] (
Figure 1). Chihuahua City was founded in the XVIIth century as a mining center and Spanish military enclave. [
16] Most of the population speaks Spanish; however, it includes a lower proportion of Tarahumara speakers (tar-ISO 639-3 Ethnologue) [
7,
12,
17]. Currently, the majority of the population is dedicated to industrial, commercial, and tourist activities, as most of the inhabitants reside in urban areas [
11,
15,
17].
The state of Veracruz is located in southern Mexico and is bordered to the north by the state of Tamaulipas, to the west by Hidalgo, Puebla, and Oaxaca, and to the southeast by the states of Tabasco and Chiapas. The total population of Veracruz is 8,127,832 inhabitants [
18]. During the pre-Hispanic period, Veracruz was home to four important indigenous cultures: Huastec, Otomi, Totonacs, and Olmecs. Xalapa is the state capital of Veracruz and occupies 0.17% of the territorial surface of the state, which almost 50% consists of urban areas [
19]. Numerous Spanish families established there, thus increasing the population, which is mostly composed of Spaniards and mestizos [
11,
12,
17]. Currently, Xalapa is the second-most populous municipality of the state, with a population of 457,928 inhabitants [
18], as shown in
Figure 1.
The aim of this study was to report the allele and haplotype distribution of the HLA class I (-A and -B) and class II (-DRB1 and -DQB1) genes among the Mexican population of three urban regions: Mexico City-Tlalpan, Chihuahua-Chihuahua City and Veracruz-Xalapa.
3. Results
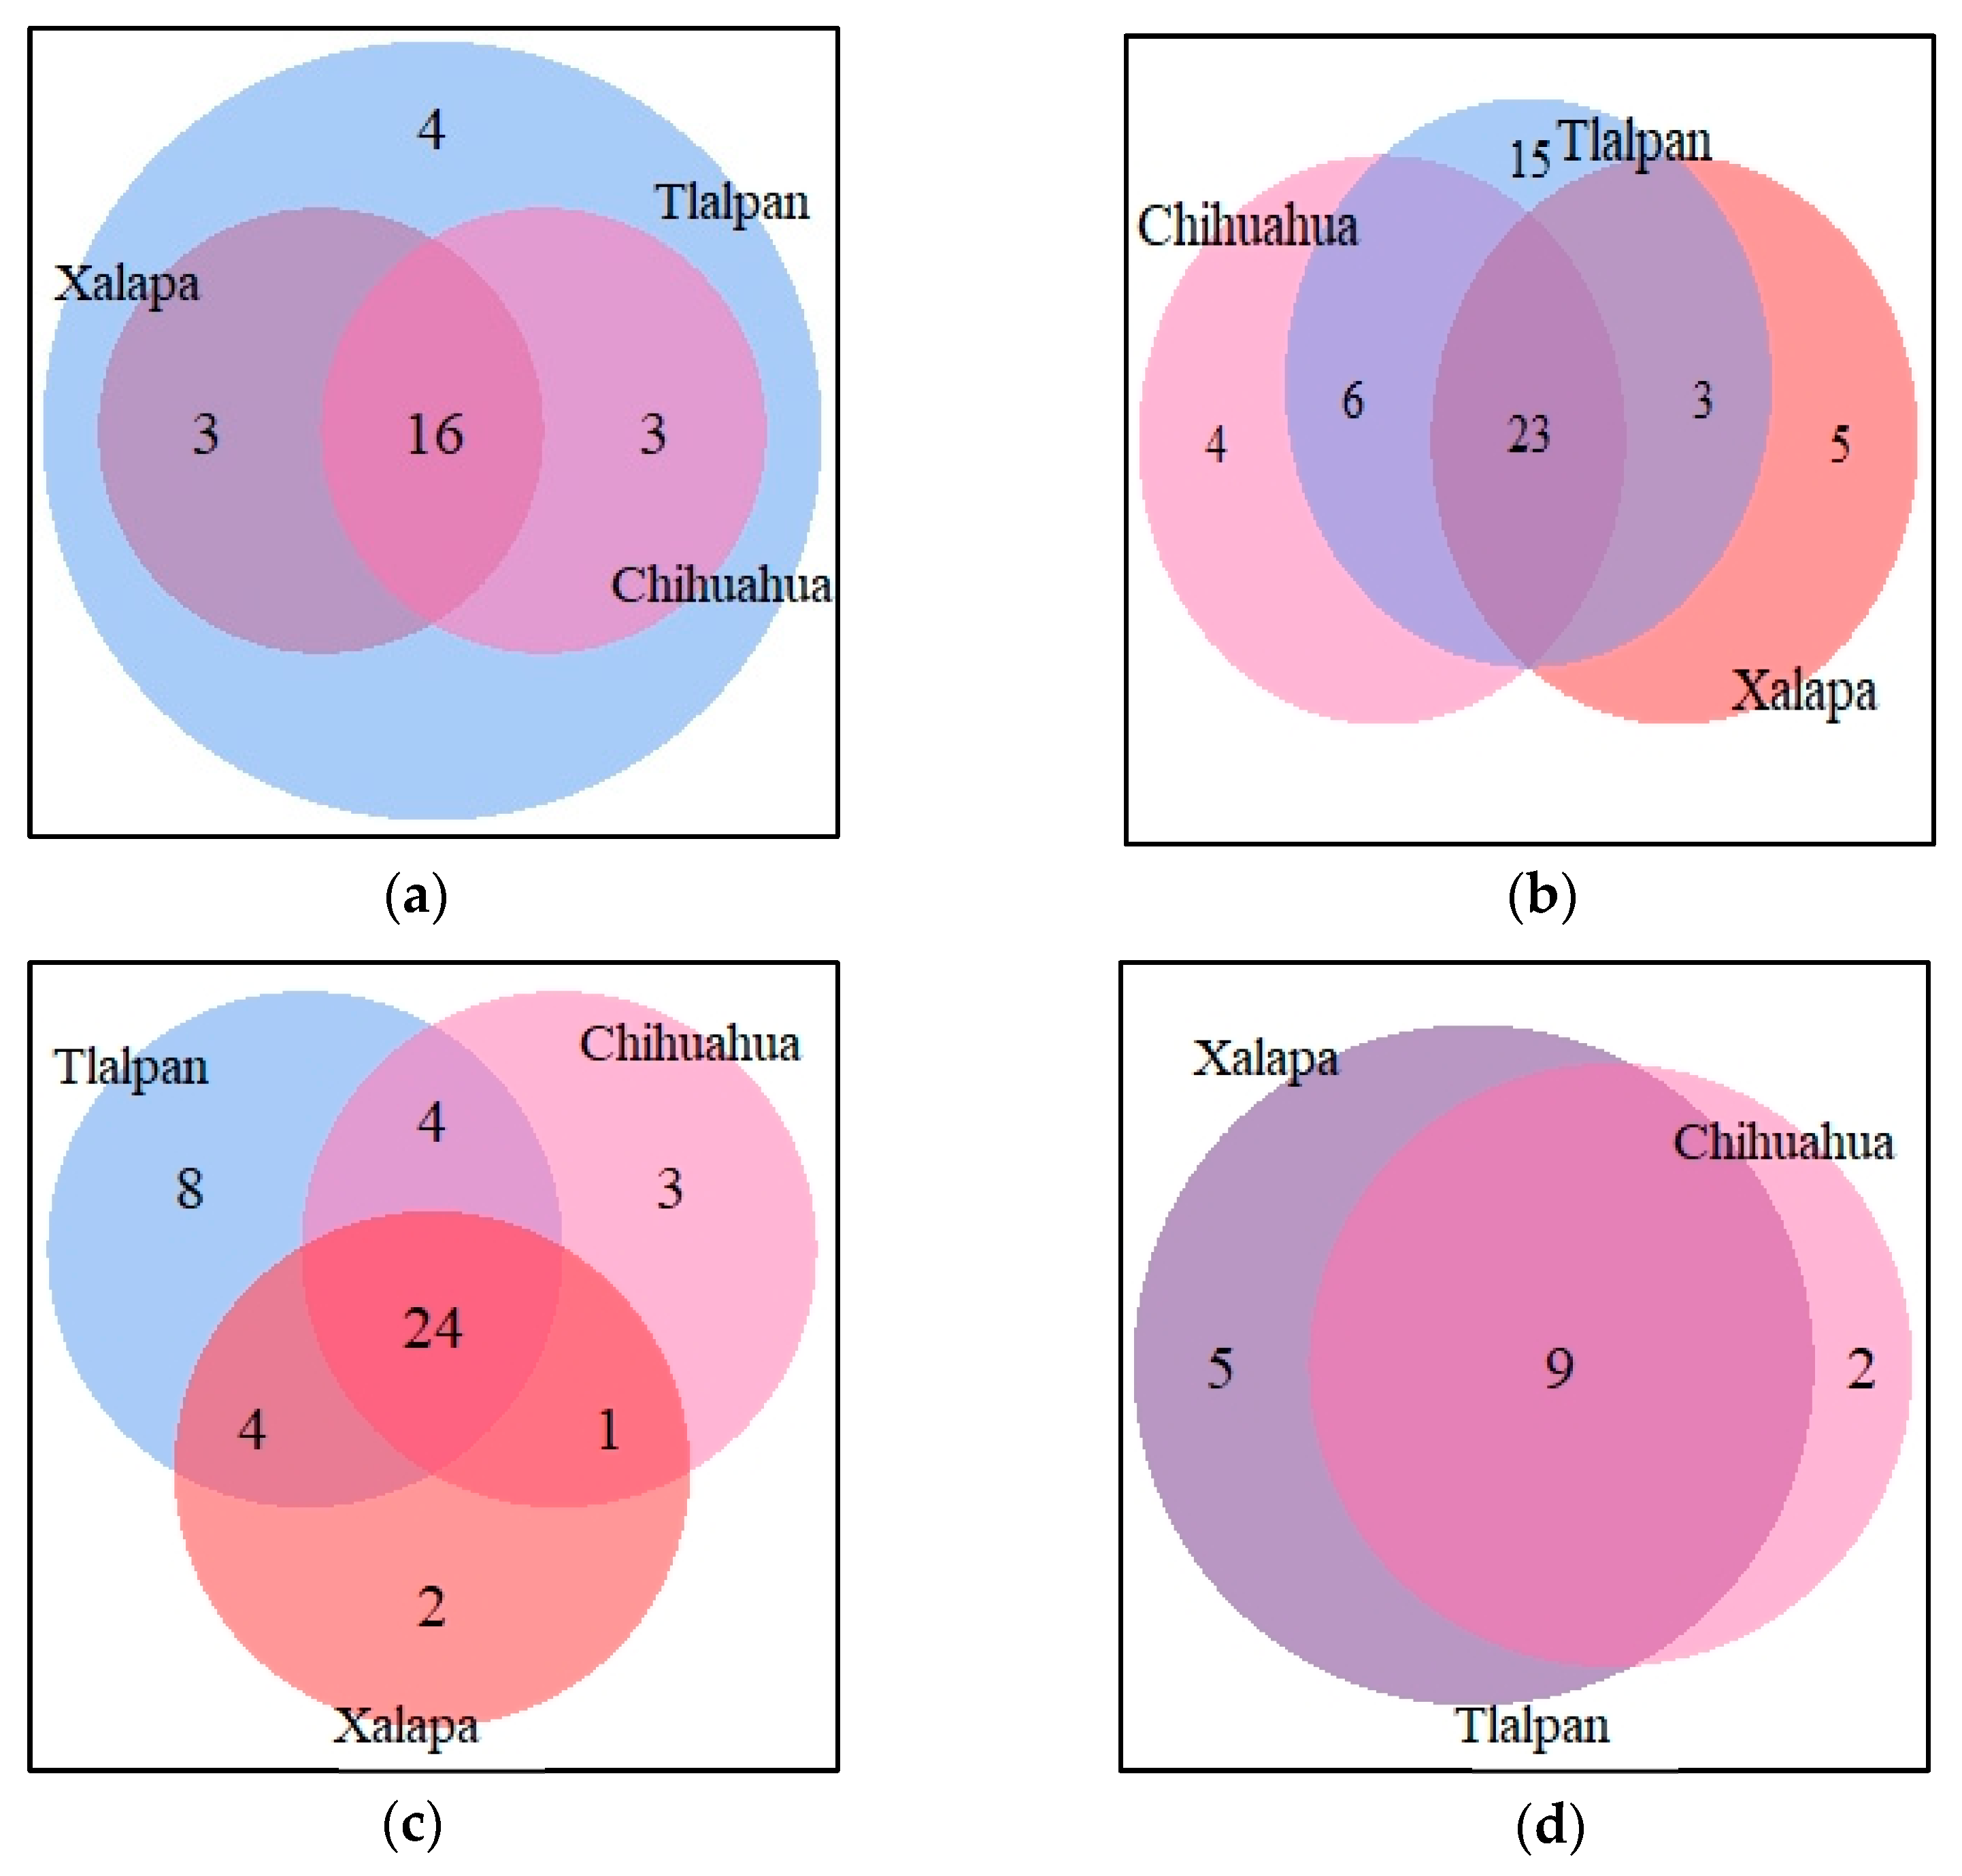
In the whole-population analysis (Mexican mestizo, MM, n = 502), we identified 26 alleles for HLA-A, 54 alleles in HLA-B, 46 alleles in HLA-DRB1, and 16 in HLA-DQB1. We observed the highest diversity of alleles in the -B and -DRB1 loci in our study population.
The number of alleles in each locus in the three populations, and their distribution in the studied population, are shown in
Figure 1. For the
HLA-A locus, there are 16 alleles shared, while
HLA-B shows 23 alleles; in Class II,
HLA-DRB1 has 24 alleles in common; and finally, in the
HLA-DQB1 locus only, alleles are in the three regions (
Figure 2).
The Class I alleles (-
A and
-B) and Class II (-
DRB1 and -
DQB1) data obtained for the three Mexican urban populations are provided in the
supplementary information S1–S4.
The estimates of HWE shows a deviation from expected/observed heterozygosity in MM for Class I loci:
HLA-A (Obs. Het. = 0.8725/Exp. Het. = 0.8714;
p = 0.013), and
HLA-B (Obs. Het. = 0.9383/Exp. Het. = 0.9326;
p = 0.007), but not for the Class II loci:
HLA-DRB1 (Obs. Het. = 0.9143/Exp. Het. = 0.9329;
p = 0.104) and
HLA-DQB1 (Obs. Het. = 0.8327/Exp. Het. = 0.8186;
p = 0.676). In the analysis of independent populations, the
HLA-A and
-B loci for the region Tlalpan differ in HWE (
p < 0.05); while, for the regions Chihuahua City and Xalapa, the four loci did not differ significantly in HWE; the results from each region are shown in
Table 1.
3.1. Allele Frequency
3.1.1. HLA-A
In locus
HLA-A for Tlalpan, the greatest variability was concentrated in 26 alleles; for Xalapa and Chihuahua, 19 alleles were found in each population. Alleles HLA-
A*02:01,
A*24:02, and
A*68:01 were the most frequent in the Tlalpan and Xalapa region, while
A*02:01,
A*24:02, and
A*01:01 in the Chihuahua region had the highest frequencies. We found statistically significant differences for the
A*01:01 allele (
p = 0.03) when comparing Tlalpan (6.06%) vs. Xalapa (1.79%). In the comparison of Tlalpan (13.79%) vs. Chihuahua (4.55%), statistically significant differences in the
A*68:01 allele frequency (
p = 0.001) were found, as were in the comparison Chihuahua (4.55%) vs. Xalapa (17.86%) (
p < 0.001); in addition, differences in the allele
A*01:01 (
p < 0.004) were found.
Table 2 shows the high-resolution for the
HLA-A alleles with an allele frequency (AF) ≥ 1.0%. A full-length table depicting all alleles identified is available in
Supplementary Table S1.
3.1.2. HLA-B
For the
HLA-B locus in the Tlalpan mayoralty, we reported 47 alleles, while for Veracruz-Xalapa we reported 31 alleles, and 33 alleles for the Chihuahua region. We found that
HLA-B*35:01,
B*39:01, and
B*40:02 were present in Tlalpan at ~36%; in the Chihuahua region
B*51:01, B*39:01, and
B*35:01 alleles were found in a great part of the population, with a total frequency of 34%. In the Xalapa municipality, the alleles with higher frequency were similar to those described previously in Tlalpan, but the top-three almost reach 45%. According to the frequencies shown in
Table 3, in the comparison of Tlalpan vs. Chihuahua regions, we found statistically significant differences in:
B*07:02 (
p = 0.034),
B*14:01 (
p = 0.027),
B*48:01 (
p = 0.027), and
B*51:01 (
p = 0.004). In Tlalpan vs. Xalapa regions, no statistically significant differences were found, and finally, in the Chihuahua vs. Xalapa comparison, statistically significant differences were detected in
B*08:01 (
p = 0.02),
B*35:01 (
p = 0.032),
B*40:02 (
p = 0.043), and
B*51:01 (
p < 0.03). Only alleles with AF ≥ 1.0% are included in
Table 3. A full-length table depicting the frequencies of all alleles identified is available in
Supplementary Table S2.
3.1.3. HLA-DRB1
For the
HLA-DRB1 locus in the Tlalpan region, we found the greatest variability with a total of 42 alleles, compared to Chihuahua and Xalapa, with 32 and 30 alleles, respectively. The
HLA-DRB1*04:07,
DRB1*08:02, and
DRB1*07:01 alleles were the most frequent in Tlalpan, in 36% of the population, while in Xalapa, the most frequent alleles were
DRB1*04:07,
DRB1*08:02, and
DRB1*04:04, in ~45% of the population, and in Chihuahua,
DRB1*04:04,
DRB1*04:07,
DRB1*07:01, and
DRB1*08:02 were found in 34% of the population. When comparisons were performed, interestingly, we found statistically significant differences in the allele
DRB1*04:07 for the Tlalpan (16.67%) vs. Chihuahua (10.23%) comparison (
p < 0.05), Tlalpan (16.67%) vs. Xalapa (27.38%) comparison (
p = 0.002), and Chihuahua (10.23%) vs. Xalapa (27.38%) comparison (
p < 0.001). When Tlalpan vs. Chihuahua regions were compared, we found statistically significant differences in the allele
DRB1*14:01 (
p < 0.001); and in Tlalpan vs. Xalapa regions, for the alleles
DRB1*03:01 (
p = 0.013),
DRB1*04:11 (
p= 0.025), and
DRB1*14:06 (
p = 0.042). Finally, in Chihuahua vs. Xalapa:
DRB1*03:01 (
p < 0.02). Only alleles with AF ≥ 1.0% are included in
Table 4. A full-length table depicting the frequencies of all alleles identified is available in
Supplementary Table S3.
3.1.4. HLA-DQB1
For
HLA-DQB1 locus, the alleles
DQB1*03:01,
DQB1*03:02, and
DQB1*04:02 were found in higher frequency in Tlalpan (65%) and Xalapa (75.9%). For the population of Chihuahua, the alleles with higher occurrence were
DQB1*03:02,
DQB1*03:01, and
DQB1*05:01 with 59.1% of the whole population. Interestingly, we found only 11 alleles in the Chihuahua region, compared with 14 alleles in the other two regions. When comparisons were made, statistically significant differences were obtained when we compared Tlalpan (2.42%) vs. Chihuahua (5.68%) (
p < 0.05) for the allele
DQB1*06:03. When Tlalpan vs. Chihuahua regions were compared, we found statistically significant differences in the alleles
DQB1*02:01 (
p = 0.009),
DQB1*02:02 (
p = 0.043), and
DQB1*03:02 (
p = 0.001). In Tlalpan vs. Chihuahua:
DQB1*02:02 (
p < 0.004),
DQB1*03:02 (
p < 0.001), and
DQB1*05:01 (
p = 0.028). The AF for those alleles > 1% is observed in
Table 5. A full-length table depicting the frequencies of all alleles identified is available in
Supplementary Table S4.
3.2. Haplotype Frequency
In the whole population, 761 haplotypes were detected, shared by the four loci. The Tlalpan population was where most haplotypes were identified (514), followed by Chihuahua (166), and Xalapa (149). Similarly, we reported five haplotypes with a frequency >1.0% in the MM population:
HLA-A*02:01-B*35:01-DRB1*08:02-DQB1*04:02, A*68:01-B*39:01-DRB1*08:02-DQB1*04:02, A*02:01-B*35:01-DRB1*04:07-DQB1*03:02, and
A*68:01-B*39:01-DRB1*04:07-DQB1*03:02. Table 6 shows the haplotype frequencies for those that have a haplotype frequency (HF) >1.0%.
In the Tlalpan region, the most frequent haplotypes were: HLA-A*02:01-B*35:01-DRB1*08:02-DQB1*04:02 (HF = 1.97%), A*68:01-B*39:01-DRB1*08:02-DQB1*04:02 (HF = 1.97%), A*02:01-B*35:01-DRB1*04:07-DQB1*03:02 (HF = 1.52%), A*68:01-B*39:01-DRB1*04:07-DQB1*03:02 (HF = 1.06%), and A*01:01-B*08:01-DRB1*03:01-DQB1*02:01 (HF = 1.06%). A table including these haplotypes with an HF >1% is available in
Supplementary Table S5.
In Chihuahua, we found haplotypes with frequencies higher than 1.0% and the most frequent were
HLA-A*01:01-B*08:01-DRB1*03:01-DQB1*02:01 (HF = 2.27%), followed by
A*24:02-B*39:01-DRB1*04:07-DQB1*03:02 (HF = 1.70%). A table including haplotypes with an HF >1.0% is available in
Supplementary Table S5.
For Xalapa, we reported 11 haplotypes with a frequency >1.0%; the haplotype with the highest frequency (2.98%) was
HLA-A*24:02-B*35:01-DRB1*04:07-DQB1*03:02, followed by
A*02:01-B*35:01-DRB1*04:07-DQB1*03:02, and
A*02:01-B*35:01-DRB1*08:02-DQB1*04:02; both had a frequency of 2.38%. A table including haplotypes with an HF >1.0% is available in
Supplementary Table S5.
4. Discussion
Mexico’s population is mostly composed of Mestizos, as with other Latin American populations, which are a recently admixed population composed of Amerindian, European and, to a lesser extent, African and Asian ancestries. In this matter, an important role of ethnicity in the susceptibility to different inflammatory/autoimmune and infectious diseases has been attributable to the inclusion of HLA alleles by miscegenation with Caucasian, Asian, and African populations. Nevertheless, studies of the genetics of diseases are difficult to replicate due to the complex nature of the environmental factors and the degree of genetic variability among human populations.
Comparative analyses between Mexicans and other neighboring populations reveal significant differences in genetic diversity [
28]. The HLA allele-distribution varies between distinct populations; in our study the alleles
HLA-A*02:01, B*35:01, DRB1*04:07, and
DQB1*03:02 were found at the highest frequencies in the three studied regions. These alleles have been described in various Amerindian (Native Americans) groups, such as the Nahuas [
29]. In the Tarahumara indigenous population,
HLA-A*24:02:01,
B*40:02,
DRB1*08:02:01,
DQB*04:02 were described with a frequency greater than 10% [
30], and these alleles have also been found in our study at a frequency > 5% in each region; interestingly, the
HLA-B*40 has been reported in other Amerindian populations [
31]. For HLA class II,
DRB1*04:07 and
DQB1*03:02 alleles have been reported mainly in the Amerindian population; in Mexico, it has been reported more frequently in the Mayos population to the northeast of the country [
32], and these alleles have been found to be the most frequent for the three regions analyzed in our study.
Similarly, the five haplotypes that showed the highest frequency in Tlalpan mayoralty were HLA-A*02:01-B*35:01-DRB1*08:02-DQB1*04:02, A*68:01-B*39:01-DRB1*04:07-DQB1*03:02, A*68:01-B*39:01-DRB1*08:02-DQB1*04:02, and A*02:01-B*35:01-DRB1*04:07-DQB1*03:02, which have been reported as Amerindian haplotypes of indigenous groups such as the Teneek, Seri, and Mayos [
33], while the haplotype A*01:01-B*08:01-DRB1*03:01-DQB1*02:01 was principally reported in Caucasian population [
34].
In Mexico’s Chihuahua, the most frequent haplotype was
HLA-A*01:01-B*08:01-DRB1*03:01-DQB1*02:01. This haplotype has been reported in the European population, while
A*24:02-B*39:01-DRB1*04:07-DQB1*03:02 has been described in ethnic groups such as the Mayos and Mazatecas [
35].
For the Xalapa population, the haplotype with the highest frequency was
A*24:02-B*35:01-DRB1*04:07-DQB1*03:02, followed by
A*02:01-B*35:01-DRB1*04:07-DQB1*03:02 and
A*02:01-B*35:01-DRB1*08:02-DQB1*04:02. Other studies have described these haplotypes as frequent in native Amerindians [
33,
36]. These results showed that most of the haplotypes found in the Tlalpan and Xalapa population were of Amerindian origin, while one haplotype of Caucasian origin was found at a higher frequency in Chihuahua compared with the other two populations, probably as a product of contact with the Spaniards conquers, who were attracted by the discovery of large deposits of mineral resources [
8].
In some populations, genetic associations have been described with the presence of HLA alleles with different clinical phenotypes/diseases. The
HLA-B*35 has been associated with increased risk of developing pulmonary arterial hypertension in systemic sclerosis patients [
37], and we found a high frequency of this allele in our Mexican mestizo population; remarkably, it has been reported at a greater proportion in the Xalapa region compared to Tlalpan and Chihuahua. In our study population, we found the HLA class II alleles,
DRB1*04:04 and
DRB1*04:05, which have been described as associated with susceptibility to rheumatoid arthritis [
38,
39,
40], while the
DRB1*03:01 allele with Systemic Lupus Erythematosus [
41,
42]. Another allele associated with autoimmune diseases is
HLA-A*01:01, which has been associated with the development of psoriatic arthritis in the Chinese population [
43]. In a pilot study in the Mexican population,
HLA-DQB1*05 was associated with susceptibility of reinfection with human papillomavirus [
44]. Two alleles (
HLA-DRB1*03:01 and
DRB1*04:04) that we found in greater proportions in our study have been conferred with an increased risk of Addison’s disease [
45]. Diabetes mellitus type 1 is one of the most complex diseases with the highest incidence in Mexico; the
DQB1*05:01 and
DQB1*02:01 alleles that occur in linkage disequilibrium with the
DRB1*03:01 [
46] allele, are presented with a frequency >1%. Interestingly, the
DRB1*03: 01-DQB1* 02:01 haplotype was found as the most frequent haplotype in the Chihuahua region.
It is important to know the relationship between HLA alleles and the development of diseases, as some alleles are distributed in higher proportions in different regions of Mexico, which may act as a form of epidemiological monitoring. Our results are important for future comparative genetic studies in different Latin American ethnic groups, particularly Mexican Mestizos and Amerindians.

 ,
, 


