Non-Invasive Diagnosis of Malignancies Based on the Analysis of Markers in Exhaled Air

Abstract
:
1. Introduction
2. Materials and Methods
2.1. Description of Test Groups
2.2. Diagnostic Methods to Confirm Diagnosis
2.3. Developed Method of Analysis and Experimental Diagnosis Method
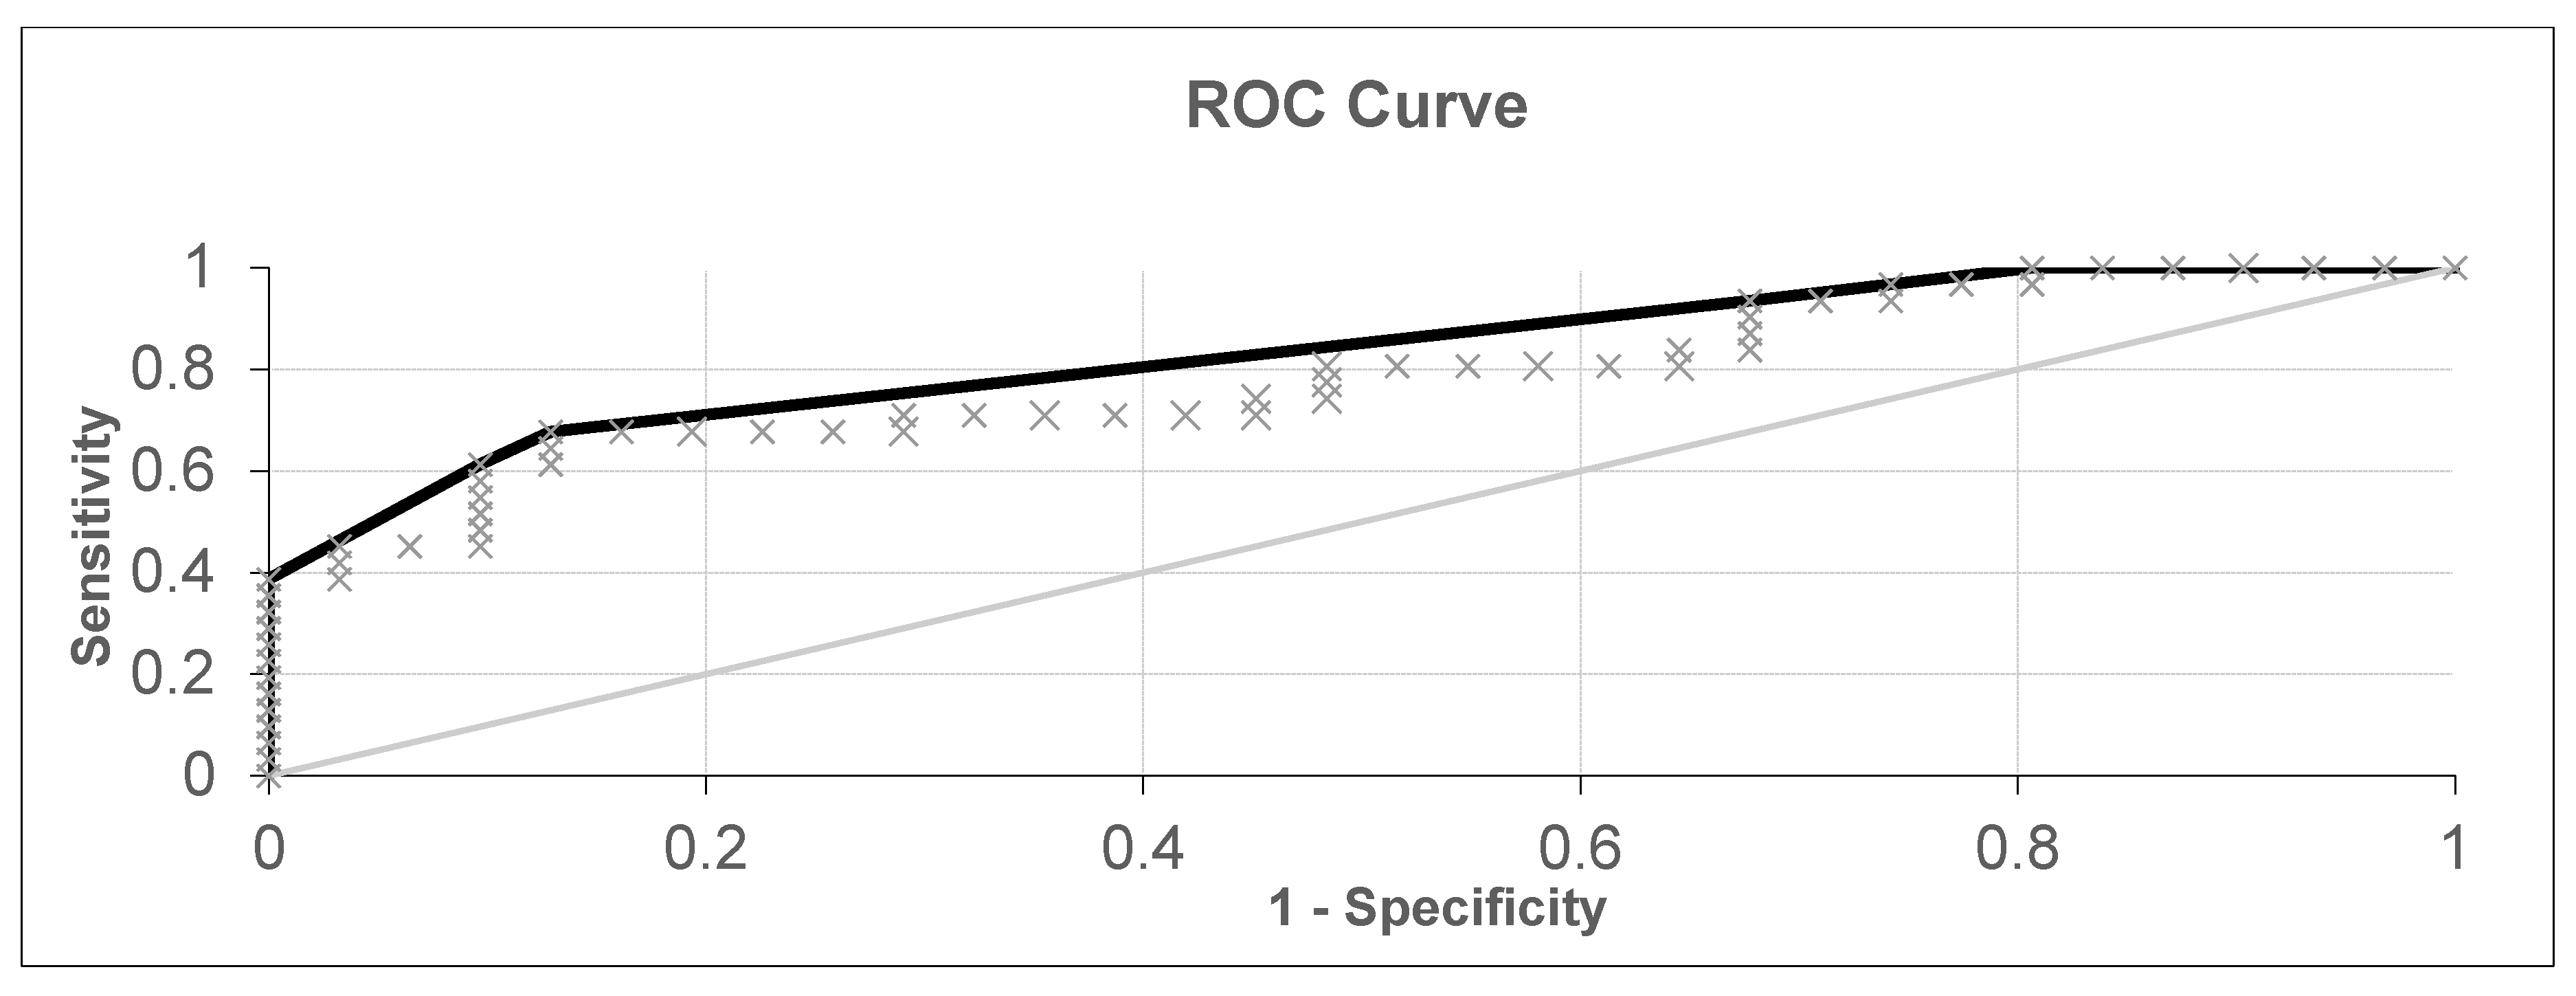
3. Results
4. Conclusions
Author Contributions
Funding
Conflicts of Interest
References
- Zhuikova, L.D.; Choynzonov, E.L.; Ananina, O.A.; Odintsova, I.N. Cancer incidence in Siberia and Russian Far East. Sib. J. Oncol. 2019, 18, 5–11. [Google Scholar] [CrossRef] [Green Version]
- Globocan 2018 [Internet]; International Agency for Research on Cancer: Lyon, France, September 2013; Available online: http://globocan.iarc.fr (accessed on 1 September 2020).
- Allemani, C.; Matsuda, T.; Di Carlo, V.; Harewood, R.; Matz, M.; Nikšić, M.; Bonaventure, A.; Valkov, M.; Johnson, C.J.; Estève, J.; et al. Global surveillance of trends in cancer survival 2000–14 (CONCORD-3): Analysis of individual records for 37 513 025 patients diagnosed with one of 18 cancers from 322 population-based registries in 71 countries. Lancet 2018, 391, 1023–1075. [Google Scholar] [CrossRef] [Green Version]
- Ghosal, R.; Kloer, P.; Lewis, K.E. A review of novel biological tools used in screening for the early detection of lung cancer. Postgrad. Med. J. 2009, 85, 358–363. [Google Scholar] [CrossRef] [PubMed]
- Jatin, P.S.; Snehal, G.P. Head and Neck Surgery and Oncology; Mosby: London, UK, 2013; p. 713. ISBN 9780323415187. [Google Scholar]
- The National Comprehensive Cancer Network. Clinical Practice Guidelines in Oncology. Available online: https://www.nccn.org/professionals/physician_gls/default.aspx (accessed on 13 July 2020).
- Harris, A.; Lyu, L.; Wasserman-Winko, T.; George, S.; Johnson, J.T.; Nilsen, M.L. Neck disability and swallowing function in posttreatment head and neck cancer patients. Otolaryngol. Head Neck Surg. 2020, 1–8. [Google Scholar] [CrossRef]
- Krilaviciute, A.; Stock, C.; Leja, M.; Brenner, H. Potential of non-invasive breath tests for preselecting individuals for invasive gastric cancer screening endoscopy. J. Breath Res. 2018, 12, 036009. [Google Scholar] [CrossRef]
- Opitz, P.; Herbarth, O. The volatilome—Investigation of volatile organic metabolites (VOM) as potential tumor markers in patients with head and neck squamous cell carcinoma (HNSCC). J. Otolaryngol. Head Neck Surg. 2018, 47, 42. [Google Scholar] [CrossRef]
- Bouza, M.; Gonzalez-Soto, J.; Pereiro, R.; de Vicente, J.C.; Sanz-Medel, A. Exhaled breath and oral cavity VOCs as potential biomarkers in oral cancer patients. J. Breath Res. 2017, 11, 1. [Google Scholar] [CrossRef]
- Leunis, N.; Boumans, M.L.; Kremer, B.; Din, S.; Stobberingh, E.; Kessels, A.G.H.; Kross, K.W. Application of an electronic nose in the diagnosis of head and neck cancer. Laryngoscope 2013, 124, 1377–1381. [Google Scholar] [CrossRef] [Green Version]
- Jia, Z.; Patra, A.; Kutty, V.K.; Venkatesan, T. Critical review of volatile organic compound analysis in breath and in vitro cell culture for detection of lung cancer. Metabolites 2019, 9, 52. [Google Scholar] [CrossRef] [Green Version]
- Feinberg, T.; Alkoby-Meshulam, L.; Herbig, J.; Cancilla, J.C.; Torrecilla, J.S.; Mor, N.G.; Bar, J.; Ilouze, M.; Haick, H.; Peled, N. Cancerous glucose metabolism in lung cancer—Evidence from exhaled breath analysis. J. Breath Res. 2016, 10, 26012. [Google Scholar] [CrossRef]
- Handa, H.; Usuba, A.; Maddula, S.; Baumbach, J.I.; Mineshita, M.; Miyazawa, T. Exhaled breath analysis for lung cancer detection using ion mobility spectrometry. PLoS ONE 2014, 9, e114555. [Google Scholar] [CrossRef] [PubMed]
- Wang, C.; Dong, R.; Wang, X.; Lian, A.; Chi, C.; Ke, C.; Guo, L.; Liu, S.; Zhao, W.; Xu, G.; et al. Exhaled volatile organic compounds as lung cancer biomarkers during one-lung ventilation. Sci. Rep. 2014, 4, 7312. [Google Scholar] [CrossRef] [PubMed] [Green Version]
- Peralbo-Molina, A.; Calderon-Santiago, M.; Priego-Capote, F.; Gamez, B.J.; De Castro, M.D.L. Identification of metabolomics panels for potential lung cancer screening by analysis of exhaled breath condensate. J. Breath Res. 2016, 10, 26002. [Google Scholar] [CrossRef]
- Song, G.; Qin, T.; Liu, H.; Xu, G.B.; Pan, Y.Y.; Xiong, F.X.; Gu, K.S.; Sun, G.P.; Chen, Z.D. Quantitative breath analysis of volatile organic compounds of lung cancer patients. Lung Cancer 2010, 67, 227–231. [Google Scholar] [CrossRef] [PubMed]
- Corradi, M.; Poli, D.; Banda, I.; Bonini, S.; Mozzoni, P.; Pinelli, S.; Alinovi, R.; Andreoli, R.; Ampollini, L.; Casalini, A.; et al. Exhaled breath analysis in suspected cases of non-small-cell lung cancer: A cross-sectional study. J. Breath Res. 2015, 9, 27101. [Google Scholar] [CrossRef] [PubMed]
- Hakim, M.; Broza, Y.Y.; Barash, O.; Peled, N.; Phillips, M.; Amann, A.; Haick, H. Volatile organic compounds of lung cancer and possible biochemical pathways. Chem. Rev. 2012, 112, 5949–5966. [Google Scholar] [CrossRef]
- Horváth, I.; Barnes, P.J.; Loukides, S.; Sterk, P.J.; Högman, M.; Olin, A.C.; Amann, A.; Antus, B.; Baraldi, E.; Bikov, A.; et al. A European Respiratory Society technical standard: Exhaled biomarkers in lung disease. Eur. Respir. J. 2017, 49, 1600965. [Google Scholar] [CrossRef] [Green Version]
- Chernov, V.I.; Choynzonov, E.L.; Kulbakin, D.E.; Obkhodskaya, E.V.; Obkhodskiy, A.V.; Popov, A.S.; Sachkova, A.S.; Sachkov, V.I. Cancer diagnosis by neural network analysis of data from semiconductor sensors. Diagnostics 2020, 10, 677. [Google Scholar] [CrossRef]
- Blatt, R.; Bonarini, A.; Calabró, E.; Della Torre, M.; Matteucci, M.; Pastorino, U. Lung cancer identification by an electronic nose based on an array of MOS sensors. In Proceedings of the IEEE International Conference on Neural Networks—Conference Proceedings, Orlando, FL, USA, 12–17 August 2007; pp. 1423–1428. [Google Scholar] [CrossRef]
- Shakeel, P.M.; Tolba, A.; Al-Makhadmeh, Z.; Jaber, M.M. Automatic detection of lung cancer from biomedical data set using discrete AdaBoost optimized ensemble learning generalized neural networks. Neural Comput. Appl. 2020, 32, 777–790. [Google Scholar] [CrossRef]
- Becker, M.; Zaidi, H. Imaging in head and neck squamous cell carcinoma: The potential role of PET/MRI. Br. J. Radiol. 2014, 87, 20130677. [Google Scholar] [CrossRef]
- Rivera, M.P.; Mehta, A.C.; Wahidi, M.M. Establishing the diagnosis of lung cancer. Chest 2013, 143, e142S–e165S. [Google Scholar] [CrossRef] [PubMed]


| n | % | |
|---|---|---|
| Number of patients with malignant pathology | 52 | 43.0 |
| Mean age | 60 | |
| Sex | ||
| Male | 43 | 82.7 |
| Female | 9 | 17.3 |
| TNM* staging | ||
| I | 8 | 15.4 |
| II | 23 | 44.2 |
| III | 15 | 28.8 |
| IV | 6 | 11.6 |
| Localization | ||
| Lungs | 21 | 40.4 |
| Larynx | 9 | 17.3 |
| Oral cavity | 5 | 9.6 |
| Oropharynx | 7 | 13.5 |
| Hypopharynx | 1 | 1.9 |
| Tongue | 6 | 11.6 |
| The mucous membrane of the alveolar process of the lower jaw | 3 | 5.7 |
| Tobacco consumption | ||
| Yes | 29 | 55.8 |
| No | 23 | 44.2 |
| n | % | |
|---|---|---|
| Control group (with no data on malignant pathology) | 69 | 57.0 |
| Mean age | 50 | |
| Sex | ||
| Male | 14 | 20.3 |
| Female | 55 | 79.7 |
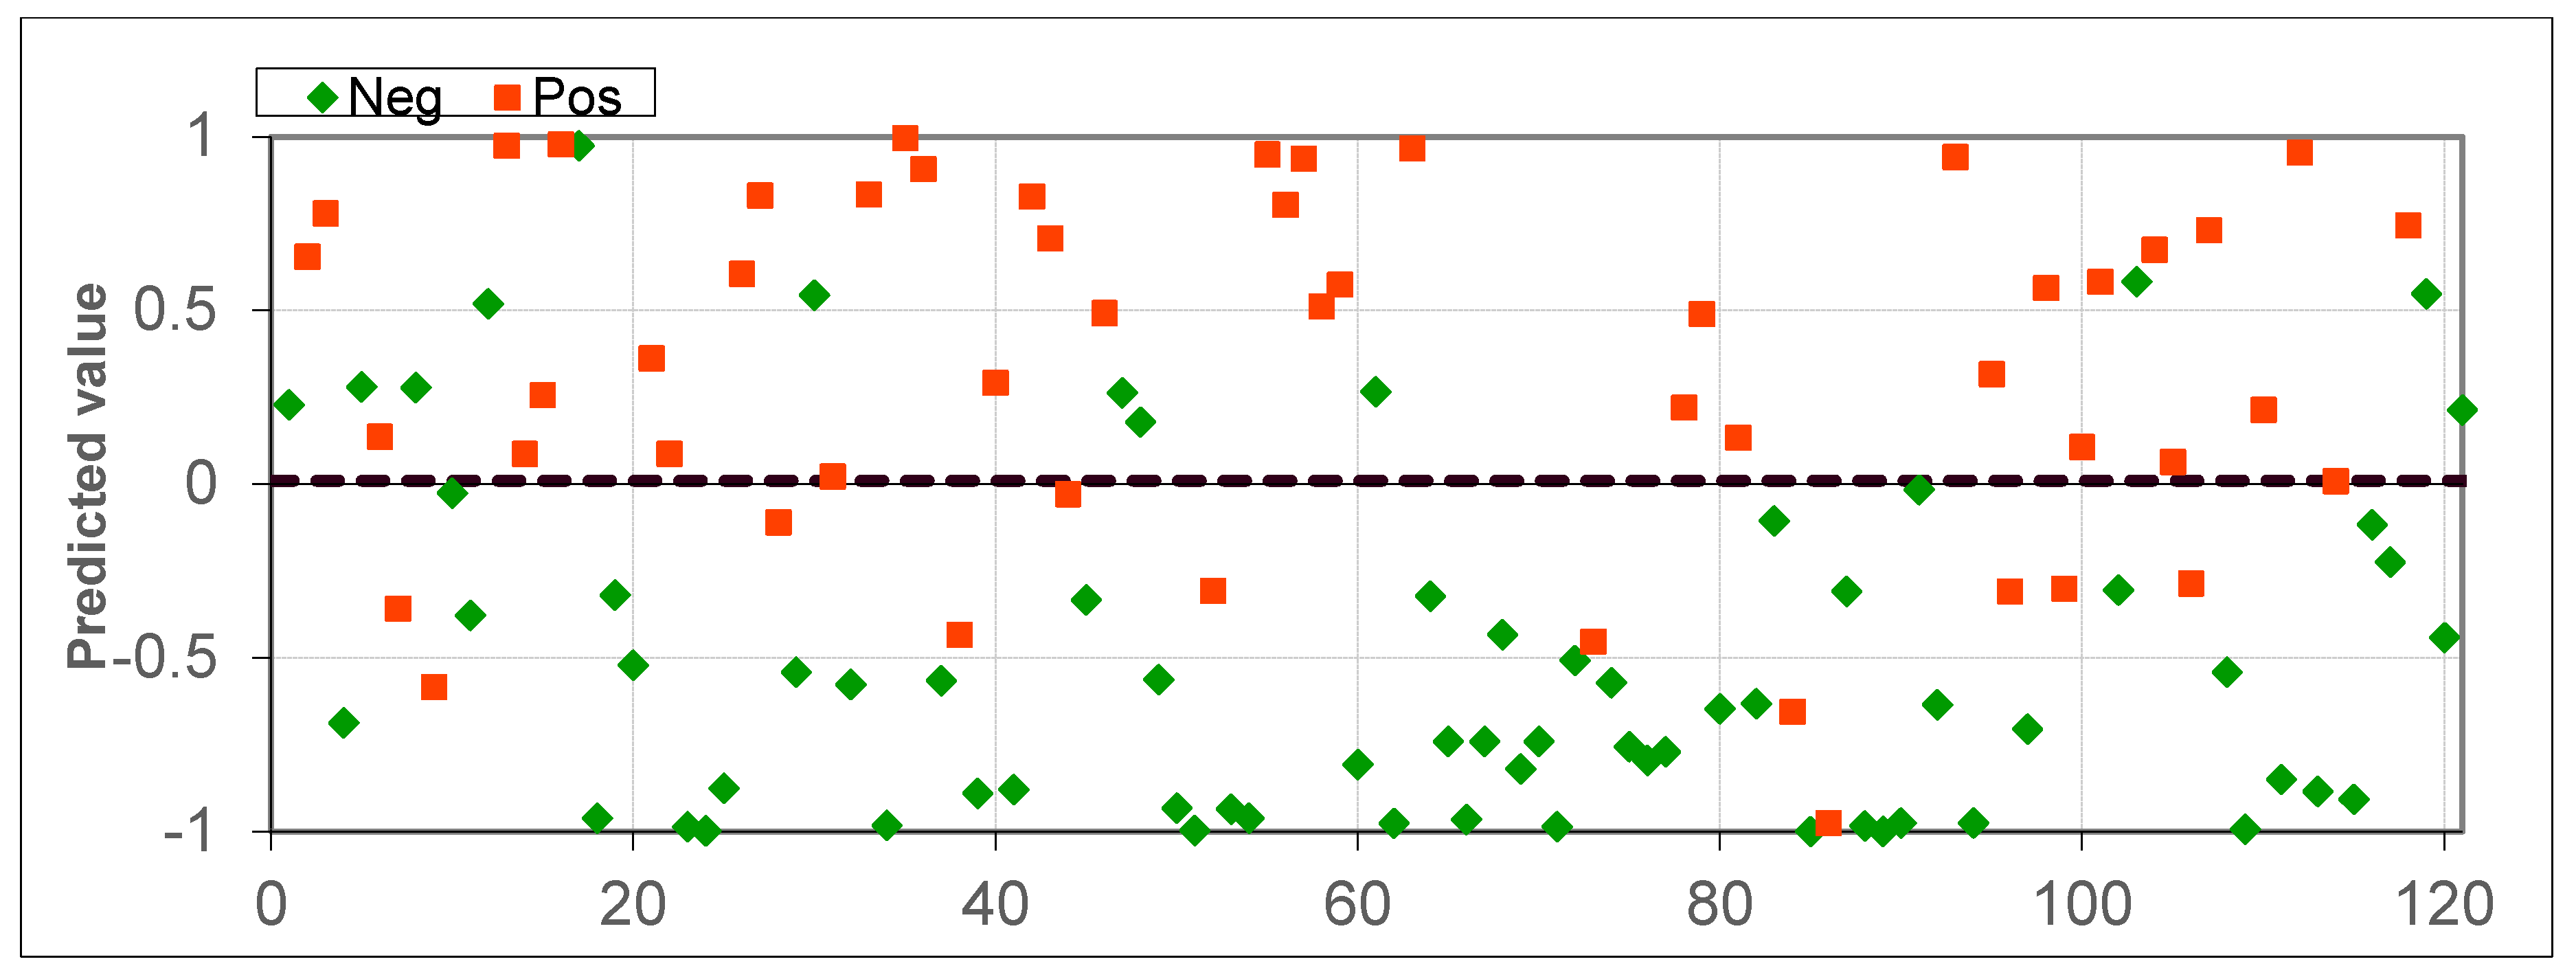
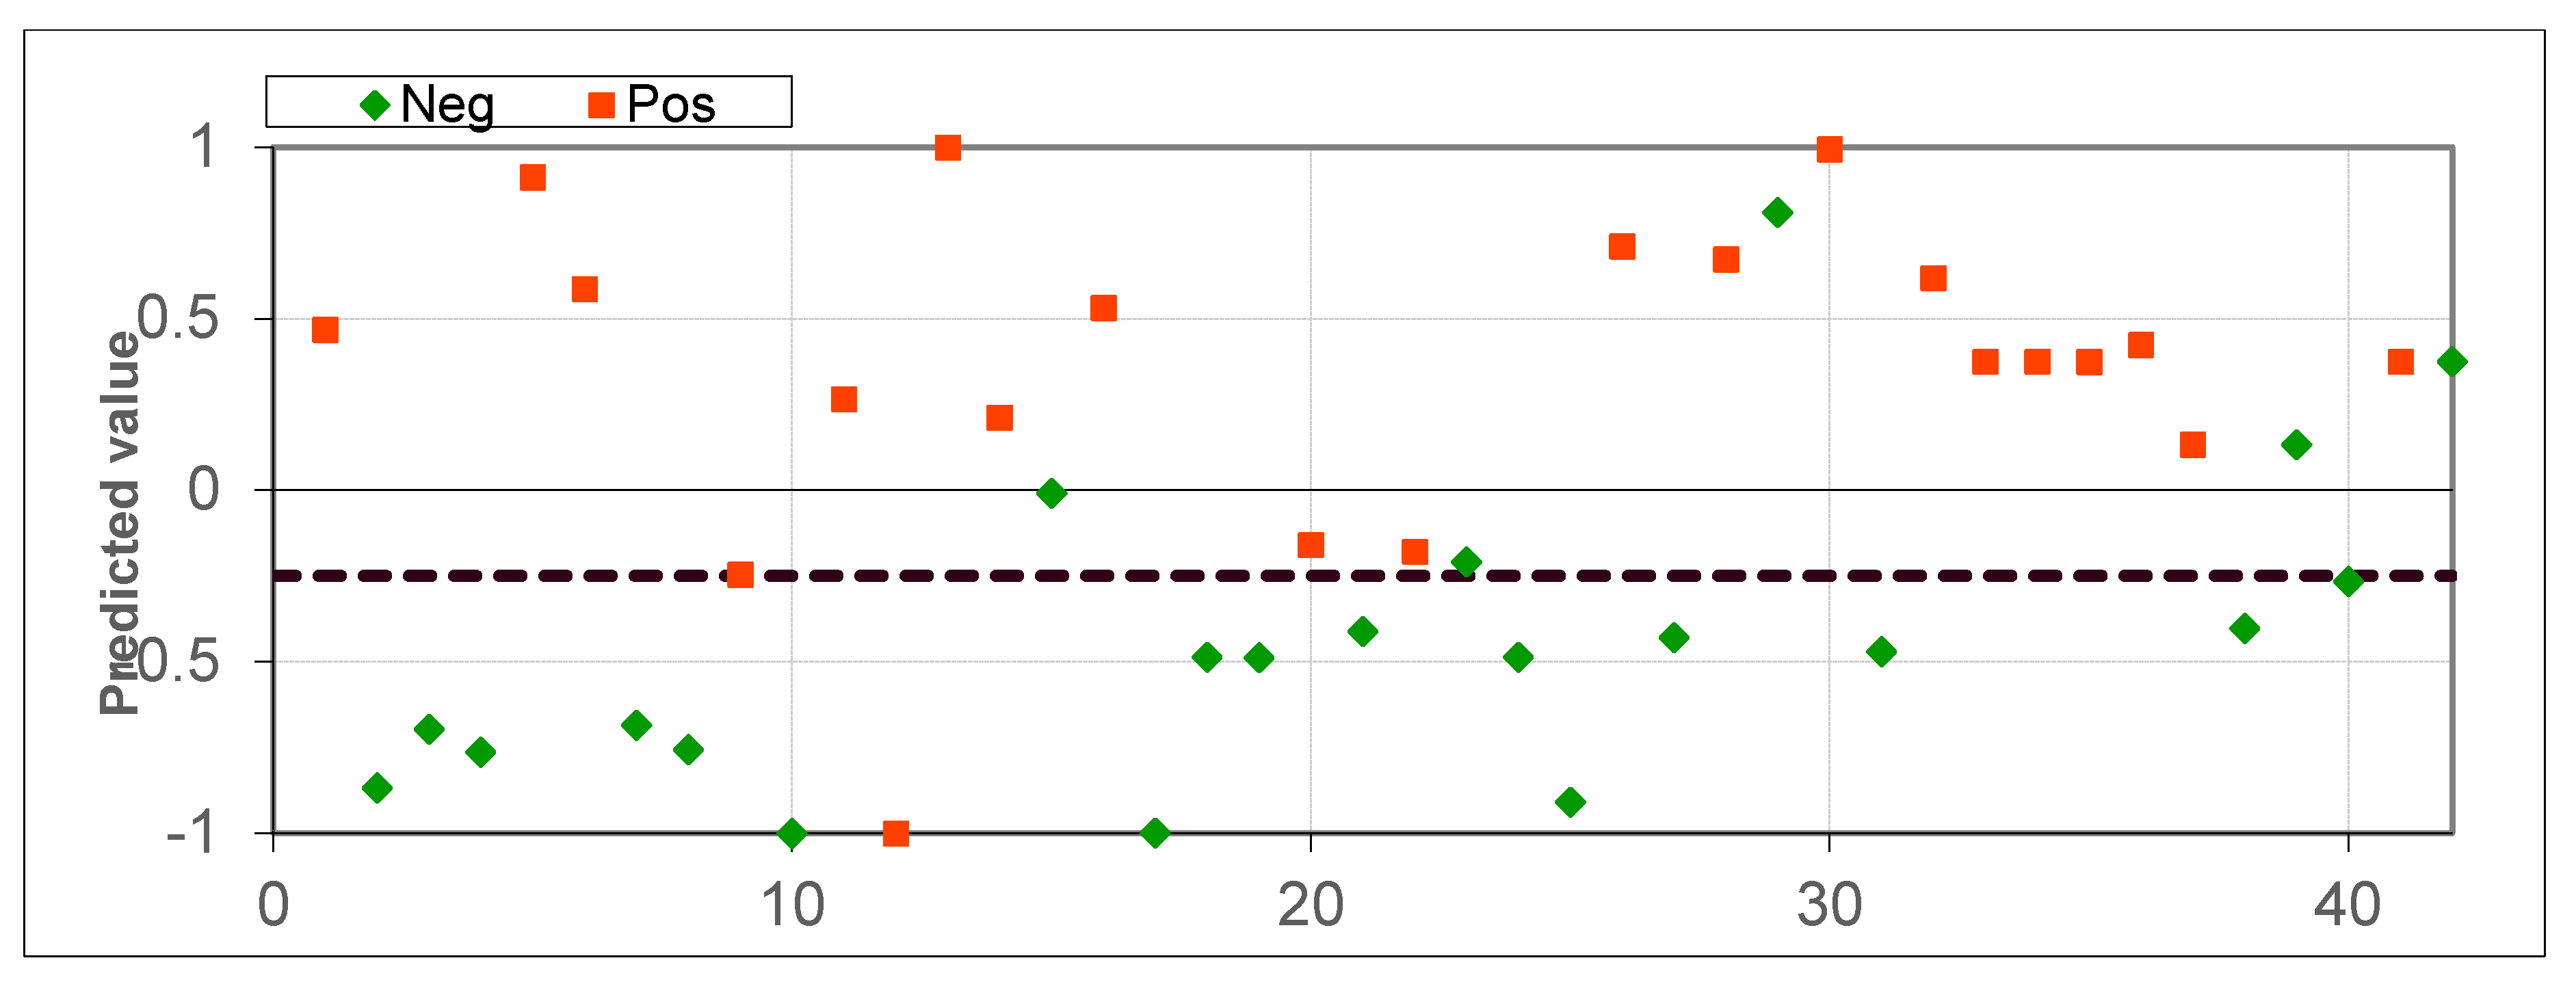
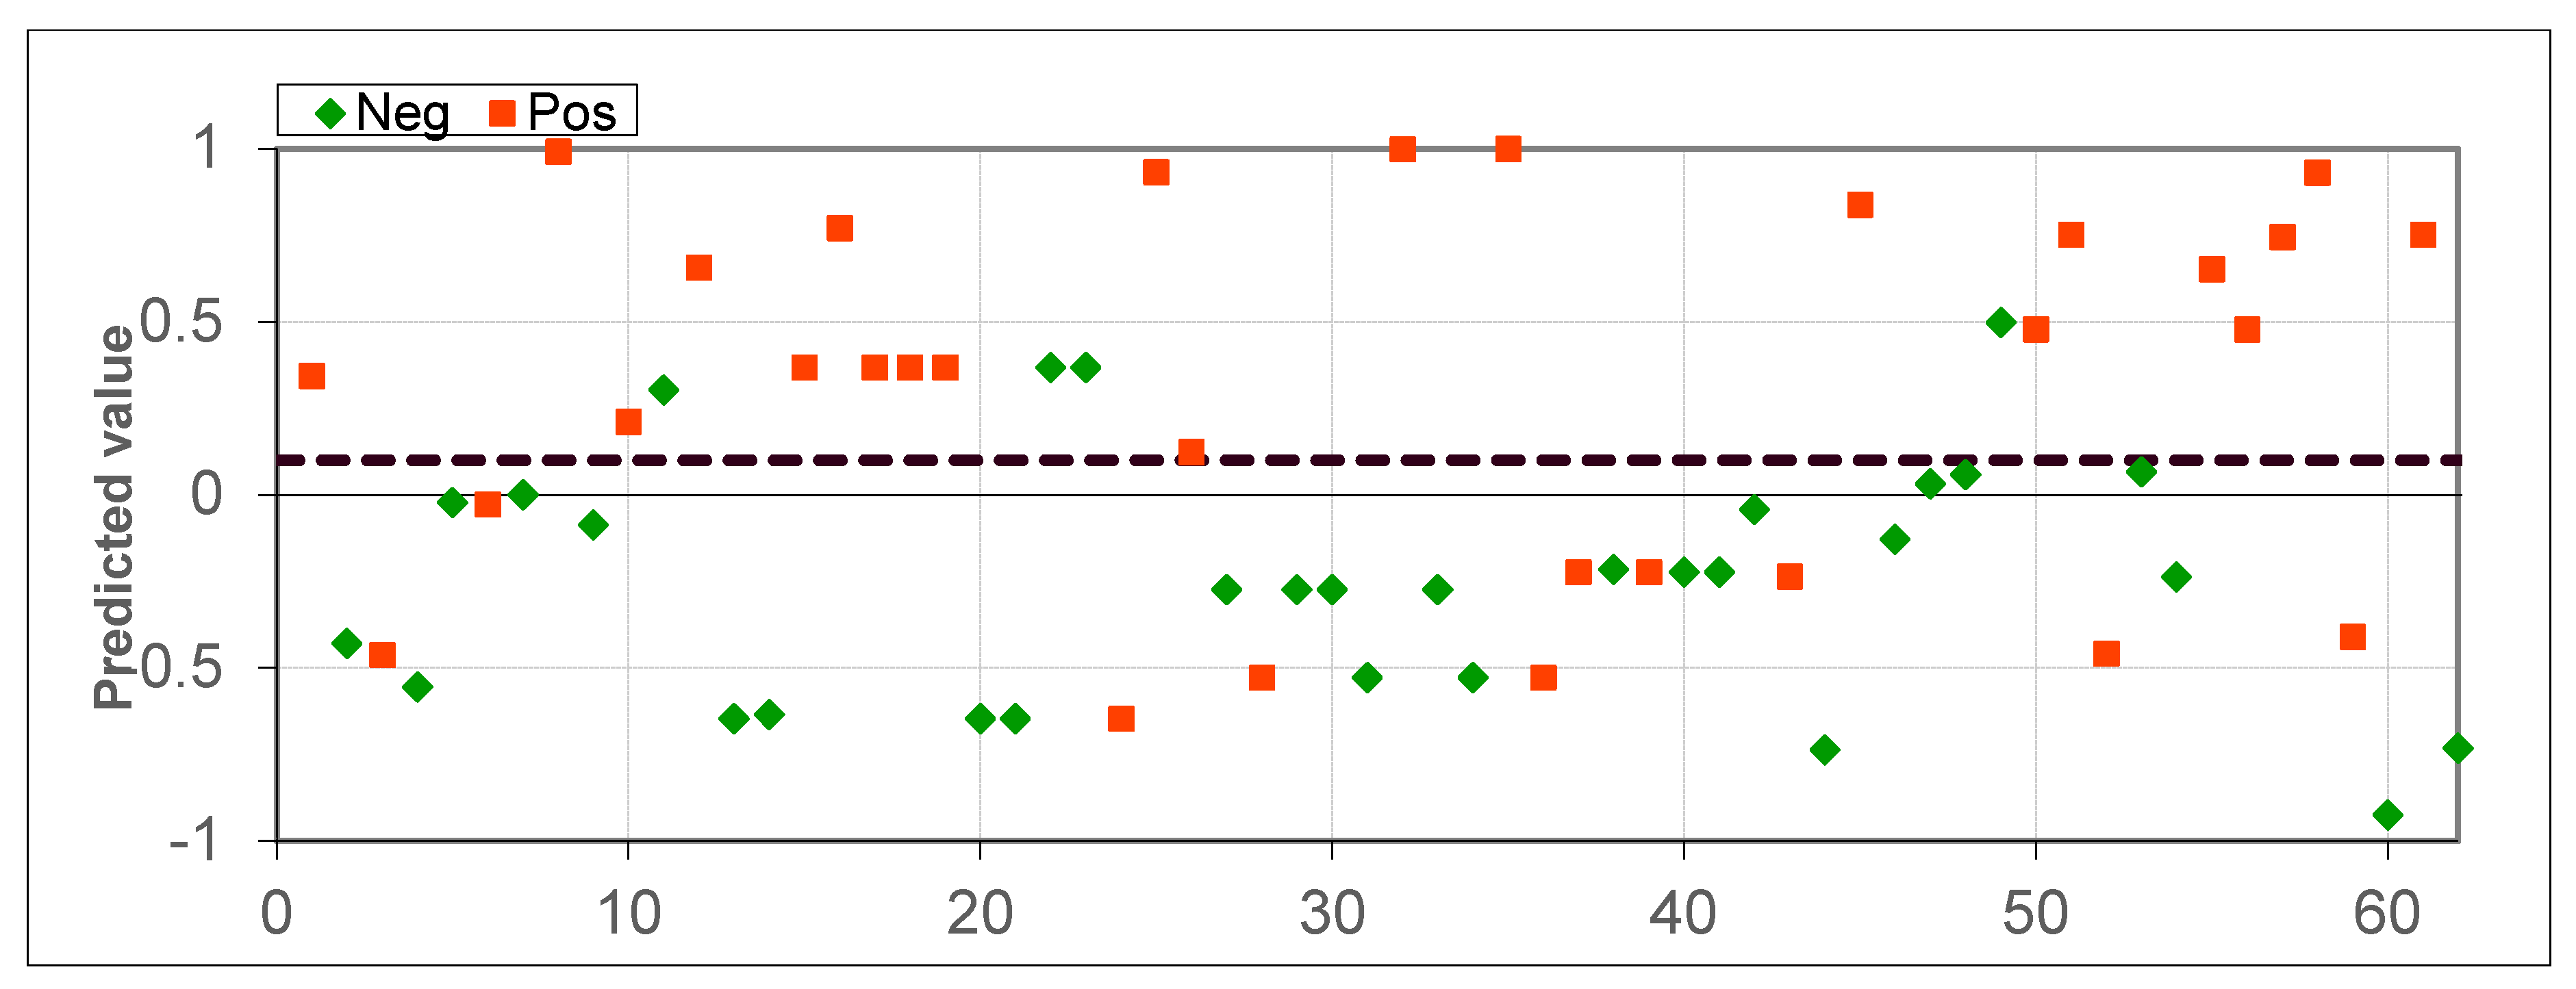
| N | Data Set Parameters | Accuracy | Sensitivity | Specificity |
|---|---|---|---|---|
| 1 | 69 healthy subjects and 31 subjects with laryngeal or oropharyngeal cancer + 21 subjects with lung cancer | 80.16% | 76.92% | 82.61% |
| 2 | 21 healthy subjects and 21 subjects with lung cancer | 85.71% | 95.24% | 76.19% |
| 3 | 31 healthy subjects and 31 laryngeal or oropharyngeal cancer | 77.41% | 67.74% | 87.1% |
Publisher’s Note: MDPI stays neutral with regard to jurisdictional claims in published maps and institutional affiliations. |
© 2020 by the authors. Licensee MDPI, Basel, Switzerland. This article is an open access article distributed under the terms and conditions of the Creative Commons Attribution (CC BY) license (http://creativecommons.org/licenses/by/4.0/).
Share and Cite
Chernov, V.I.; Choynzonov, E.L.; Kulbakin, D.E.; Menkova, E.N.; Obkhodskaya, E.V.; Obkhodskiy, A.V.; Popov, A.S.; Rodionov, E.O.; Sachkov, V.I.; Sachkova, A.S. Non-Invasive Diagnosis of Malignancies Based on the Analysis of Markers in Exhaled Air. Diagnostics 2020, 10, 934. https://doi.org/10.3390/diagnostics10110934
Chernov VI, Choynzonov EL, Kulbakin DE, Menkova EN, Obkhodskaya EV, Obkhodskiy AV, Popov AS, Rodionov EO, Sachkov VI, Sachkova AS. Non-Invasive Diagnosis of Malignancies Based on the Analysis of Markers in Exhaled Air. Diagnostics. 2020; 10(11):934. https://doi.org/10.3390/diagnostics10110934
Chicago/Turabian StyleChernov, Vladimir I., Evgeniy L. Choynzonov, Denis E. Kulbakin, Ekaterina N. Menkova, Elena V. Obkhodskaya, Artem V. Obkhodskiy, Aleksandr S. Popov, Evgeniy O. Rodionov, Victor I. Sachkov, and Anna S. Sachkova. 2020. "Non-Invasive Diagnosis of Malignancies Based on the Analysis of Markers in Exhaled Air" Diagnostics 10, no. 11: 934. https://doi.org/10.3390/diagnostics10110934
APA StyleChernov, V. I., Choynzonov, E. L., Kulbakin, D. E., Menkova, E. N., Obkhodskaya, E. V., Obkhodskiy, A. V., Popov, A. S., Rodionov, E. O., Sachkov, V. I., & Sachkova, A. S. (2020). Non-Invasive Diagnosis of Malignancies Based on the Analysis of Markers in Exhaled Air. Diagnostics, 10(11), 934. https://doi.org/10.3390/diagnostics10110934