Role of Adiponectin and Tumor Necrosis Factor-Alpha in the Pathogenesis and Evolution of Type 1 Diabetes Mellitus in Children and Adolescents

 , ,
, ,
Abstract
:1. Introduction
2. Materials and Methods
2.1. Ethics Statement
2.2. Study Design
2.3. Patient Data Collection
2.4. Data Analysis
3. Results
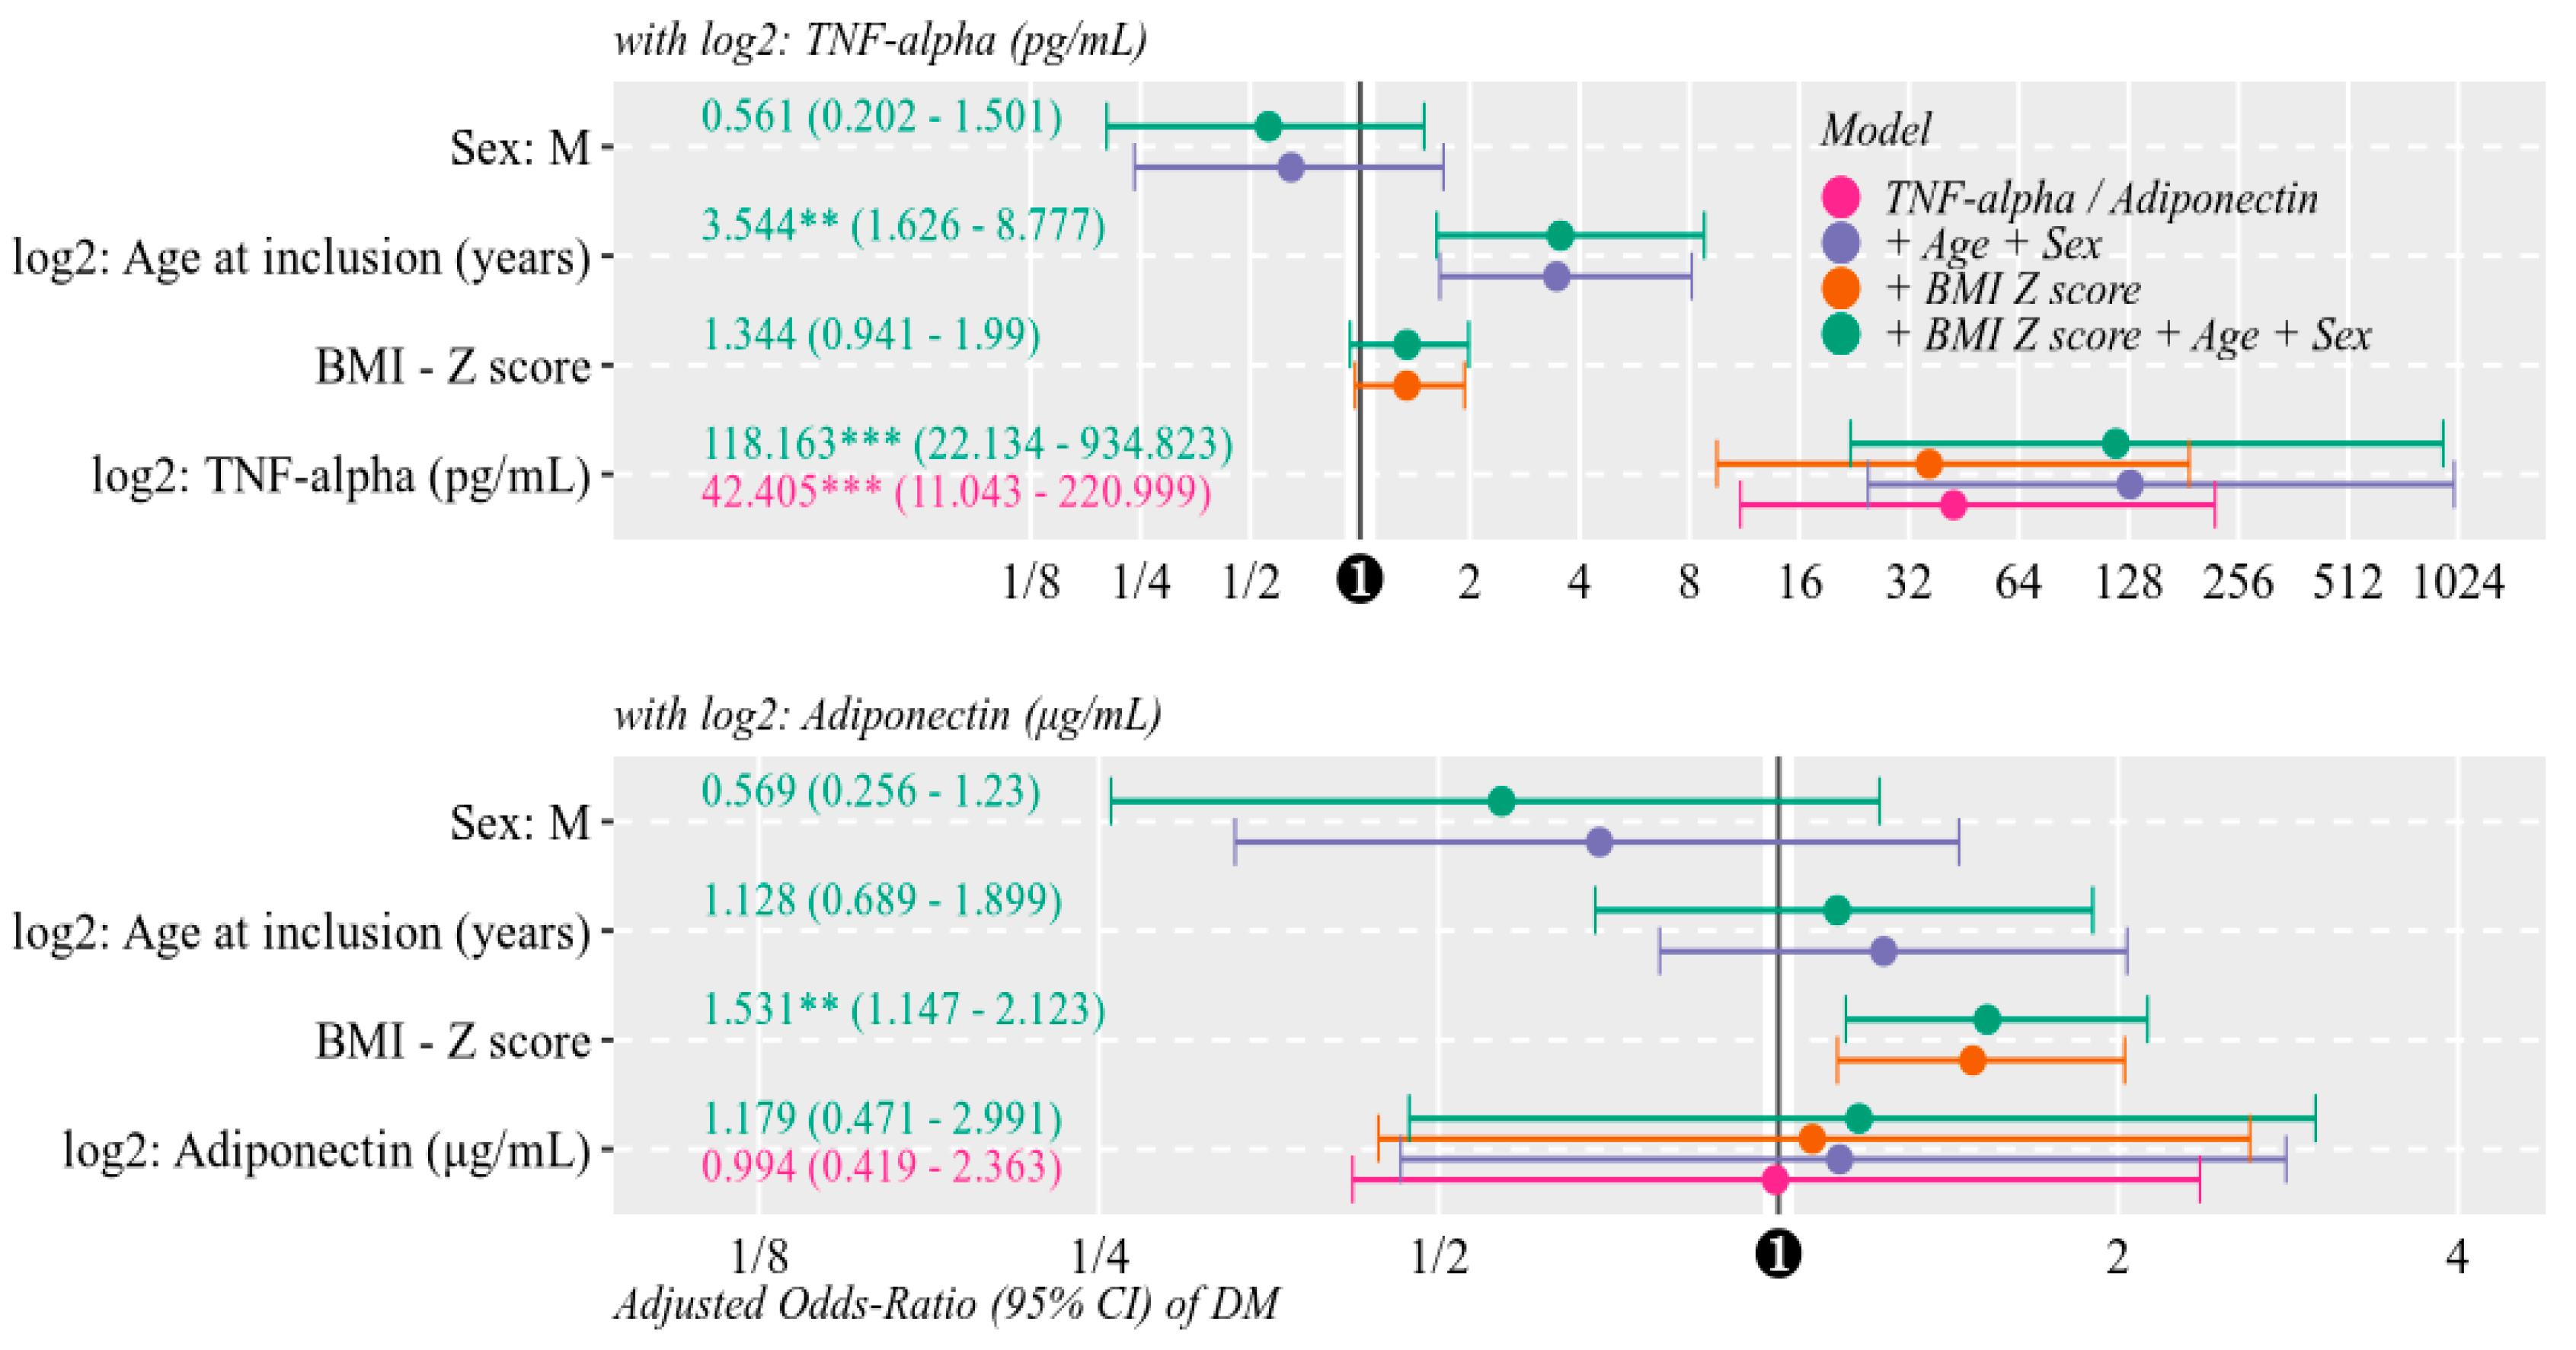
Multivariate Models
4. Discussion
5. Conclusions
Author Contributions
Funding
Acknowledgments
Conflicts of Interest
References
- Mayer-Davis, E.J.; Kahkoska, A.R.; Jefferies, C.; Dabelea, D.; Balde, N.; Gong, C.X.; Aschner, P.; Craig, M.E. ISPAD Clinical Practice Consensus Guidelines 2018: Definition, epidemiology, and classification of diabetes in children and adolescents. Pediatr. Diabetes 2018, 19, 7–19. [Google Scholar] [CrossRef] [PubMed]
- Tsalamandris, S.; Antonopoulos, A.S.; Oikonomou, E.; Papamikroulis, G.; Vogiatzi, G. Risk Factors and Cardiovascular Disease Prevention The Role of Inflammation in Diabetes: Current Concepts and Future Perspectives. Eur. Cardiol. Rev. 2019, 14, 50–59. [Google Scholar] [CrossRef] [PubMed] [Green Version]
- Moraru, D.; Moraru, E.; Oltean, C.; Bozomitu, L.; Stana, B.A. Date actuale privind diabetul zaharat de tip 1 la copil [Updated dates on diabetes mellitus type 1 in children]. Rev. Română Pediatr. 2008, 57, 214–227. [Google Scholar]
- Shi, J.; Fan, J.; Su, Q.; Yang, Z. Cytokines and Abnormal Glucose and Lipid Metabolism. Front. Endocrinol. 2019, 10, 703. [Google Scholar] [CrossRef] [PubMed]
- Yi, L.; Swensen, A.C.; Qian, W.J. Serum biomarkers for diagnosis and prediction of type 1 diabetes. Transl. Res. 2018, 201, 13–25. [Google Scholar] [CrossRef]
- Waugh, K.; Snell-Bergeon, J.; Michels, A.; Dong, F.; Steck, A.K.; Frohnert, B.I.; Norris, J.M.; Rewers, M. Increased inflammation is associated with islet autoimmunity and type 1 diabetes in the Diabetes Autoimmunity Study in the Young (DAISY). PLoS ONE 2017, 12, e0174840. [Google Scholar] [CrossRef] [Green Version]
- Mantovani, R.M.; Rocha, N.P.; Magalhães, D.M.; Barbosa, I.G.; Teixeira, A.L.; Simões e Silva, A.C. Early changes in adipokines from overweight to obesity in children and adolescents. J. Pediatr. (Versão em Port.) 2016, 92, 624–630. [Google Scholar] [CrossRef] [Green Version]
- Safai, N.; Eising, S.; Hougaard, D.M.; Mortensen, H.B.; Skogstrand, K.; Pociot, F.; Johannesen, J.; Svensson, J. Levels of adiponectin and leptin at onset of type 1 diabetes have changed over time in children and adolescents. Acta Diabetol. 2015, 52, 167–174. [Google Scholar] [CrossRef]
- Morales, A.; Wasserfall, C.; Brusko, T.; Carter, C.; Schatz, D.; Silverstein, J.; Ellis, T.; Atkinson, M. Adiponectin and leptin concentrations may aid in discriminating disease forms in children and adolescents with type 1 and type 2 diabetes. Diabetes Care 2004, 27, 2010–2014. [Google Scholar] [CrossRef] [Green Version]
- Huerta, M.G. Adiponectin and leptin: Potential tools in the differential diagnosis of pediatric diabetes? Rev. Endocr. Metab. Disord. 2006, 7, 187–196. [Google Scholar] [CrossRef]
- Aburawi, E.H.; Alkaabi, J.; Zoubeidi, T.; Shehab, A.; Lessan, N.; Al Essa, A.; Yasin, J.; Saadi, H.; Souid, A.K. Subclinical inflammation and endothelial dysfunction in young patients with diabetes: A study from United Arab Emirates. PLoS ONE 2016, 11, e0159808. [Google Scholar] [CrossRef] [PubMed]
- Miraglia, F.; Moraes Silveira, C.R.d.; Gomes Beghetto, M.; Oliveira, F.d.S.; Mello, E.D.d. Comportamiento de las adipocinas después de un año de seguimiento en el ambulatorio de obesidad de la niñez y la adolescencia. Nutr. Hosp. 2015, 32, 1554–1559. [Google Scholar] [CrossRef] [PubMed]
- Qiao, Y.; Chen, Y.; Pan, Y.; Tian, F.; Xu, Y.; Zhang, X.; Zhao, H. The change of serum tumor necrosis factor alpha in patients with type 1 diabetes mellitus: A systematic review and meta-analysis. PLoS ONE 2017, 12, e0176157. [Google Scholar] [CrossRef] [PubMed] [Green Version]
- Arroyo-Jousse, V.; Garcia-Diaz, D.F.; Codner, E.; Pérez-Bravo, F. Epigenetics in type 1 diabetes: TNFa gene promoter methylation status in Chilean patients with type 1 diabetes mellitus. Br. J. Nutr. 2016, 116, 1861–1868. [Google Scholar] [CrossRef] [Green Version]
- Karavanaki, K.; Karanika, E.; Georga, S.; Bartzeliotou, A.; Tsouvalas, M.; Konstantopoulos, I.; Fotinou, A.; Papassotiriou, I.; Karayianni, C. Cytokine response to diabetic ketoacidosis (DKA) in children with type 1 diabetes (T1DM). Endocr. J. 2011, 58, 1045–1053. [Google Scholar] [CrossRef] [Green Version]
- Popovic, D.S.; Sekerus, V. Levels of different adipocytokines in chronic complications of type 1 diabetes mellitus. Integr. Obes. Diabetes 2016, 2, 255–261. [Google Scholar] [CrossRef]
- Machnica, L.; Deja, G.; Polanska, J.; Jarosz-Chobot, P. Blood pressure disturbances and endothelial dysfunction markers in children and adolescents with type 1 diabetes. Atherosclerosis 2014, 237, 129–134. [Google Scholar] [CrossRef]
- Zorena, K.; Kula, M.; Malinowska, E.; Raczyńska, D.; Myśliwiec, M.; Raczyńska, K. Threshold serum concentrations of tumour necrosis factor alpha (TNFα) as a potential marker of the presence of microangiopathy in children and adolescents with type 1 diabetes mellitus (T1DM). Hum. Immunol. 2013, 74, 75–81. [Google Scholar] [CrossRef]
- Saud, A.M. Original Research Article Serum Levels of Tumor Necrosis Factor Alpha and Interleukine-12 in Some Iraqi Diabetic Patients Type1. Int. J.Curr. Microbiol. Appl. Sci. 2014, 3, 260–268. [Google Scholar]
- Hattersley, A.T.; Greeley, S.A.W.; Polak, M.; Rubio-Cabezas, O.; Njølstad, P.R.; Mlynarski, W.; Castano, L.; Carlsson, A.; Raile, K.; Chi, D.V.; et al. ISPAD Clinical Practice Consensus Guidelines 2018: The diagnosis and management of monogenic diabetes in children and adolescents. Pediatr. Diabetes 2018, 19, 47–63. [Google Scholar] [CrossRef]
- American Diabetes Association. Classification and diagnosis of diabetes. Diabetes Care 2017, 40, S11–S24. [Google Scholar] [CrossRef] [PubMed] [Green Version]
- R Core Team. R: A Language and Environment for Statistical Computing; R Foundation for Statistical Computing: Vienna, Austria, 2020; Available online: https://www.r-project.org/ (accessed on 16 December 2019).
- Gökşen, D.; Levent, E.; Kar, S.; Ozen, S.; Darcan, S. Serum adiponectin and hsCRP levels and non-invasive radiological methods in the early diagnosis of cardiovascular system complications in children and adolescents with type 1 diabetes mellitus. J. Clin. Res. Pediatr. Endocrinol. 2013, 5, 174–181. [Google Scholar] [CrossRef] [PubMed]
- Lipsky, L.M.; Gee, B.; Liu, A.; Nansel, T.R. Body mass index and adiposity indicators associated with cardiovascular biomarkers in youth with type 1 diabetes followed prospectively. Pediatr. Obes. 2017, 12, 468–476. [Google Scholar] [CrossRef] [PubMed]
- Kaas, A.; Pfleger, C.; Hansen, L.; Buschard, K.; Schloot, N.C.; Roep, B.O.; Mortensen, H.B. Association of adiponectin, interleukin (IL)-1ra, inducible protein 10, IL-6 and number of islet autoantibodies with progression patterns of type 1 diabetes the first year after diagnosis. Clin. Exp. Immunol. 2010, 161, 444–452. [Google Scholar] [CrossRef] [PubMed]
- Thorsen, S.U.; Pipper, C.B.; Eising, S.; Skogstrand, K.; Hougaard, D.M.; Svensson, J.; Pociot, F. Neonatal levels of adiponectin, interleukin-10 and interleukin-12 are associated with the risk of developing type 1 diabetes in childhood and adolescence: A nationwide Danish case-control study. Clin. Immunol. 2017, 174, 18–23. [Google Scholar] [CrossRef] [PubMed]
- Gokulakrishnan, K.; Aravindhan, V.; Amutha, A.; Abhijit, S.; Ranjani, H.; Anjana, R.M.; Unnikrishnan, R.; Miranda, P.; Narayan, K.M.; Mohan, V. Serum adiponectin helps to differentiate type 1 and type 2 diabetes among young Asian Indians. Diabetes Technol. Ther. 2013, 15, 696–702. [Google Scholar] [CrossRef] [PubMed] [Green Version]
- Jaleel, A.; Aheed, B.; Jaleel, S.; Zuberi, A. Circulating levels of adipokines and TNFα in patients with and without type 1 diabetes. J. Dow Univ. Heal. Sci. 2013, 7, 10–14. [Google Scholar]
- Anna, K.; Majewski, D.; Skowron, B.; Stankiewicz, W.; Fichna, P. Advances in Medical Sciences Serum leptin and adiponectin levels in children with type 1 diabetes mellitus—Relation to body fat mass and disease course. Adv. Med Sci. 2016, 61, 117–122. [Google Scholar] [CrossRef]
- Verrijn Stuart, A.A.; Schipper, H.S.; Tasdelen, I.; Egan, D.A.; Prakken, B.J.; Kalkhoven, E.; de Jager, W. Altered Plasma Adipokine Levels and in Vitro Adipocyte Differentiation in Pediatric Type 1 Diabetes. J. Clin. Endocrinol. Metab. 2012, 97, 463–472. [Google Scholar] [CrossRef] [Green Version]
- Karamifar, H.; Habibian, N.; Amirhakimi, G.; Karamizadeh, Z.; Alipour, A. Adiponectin is a Good Marker for Metabolic State among Type 1 Diabetes Mellitus Patients. Iran. J. Pediatr. 2013, 23, 295–301. [Google Scholar]
- LeCaire, T.J.; Palta, M. Longitudinal Analysis of Adiponectin through 20-Year Type 1 Diabetes Duration. J. Diabetes Res. 2015, 2015, 1–8. [Google Scholar] [CrossRef] [PubMed] [Green Version]
- Hecht Baldauff, N.; Tfayli, H.; Dong, W.; Arena, V.C.; Gurtunca, N.; Pietropaolo, M.; Becker, D.J.; Libman, I.M. Relationship of adiponectin and leptin with autoimmunity in children with new-onset type 1 diabetes: A pilot study. Pediatr. Diabetes 2016, 17, 249–256. [Google Scholar] [CrossRef] [PubMed] [Green Version]
- Alikaşifoğlu, A.; Gönç, N.; Özön, Z.A.; Sen, Y.; Kandemir, N. The relationship between serum adiponectin, tumor necrosis factor-alpha, leptin levels and insulin sensitivity in childhood and adolescent obesity: Adiponectin is a marker of metabolic syndrome. J. Clin. Res. Pediatr. Endocrinol. 2009, 1, 233–239. [Google Scholar] [CrossRef] [PubMed]
- El-Samahy, M.H.; Adly, A.A.M.; Ismail, E.A.; Salah, N.Y. Regulatory T cells with CD62L or TNFR2 expression in young type 1 diabetic patients: Relation to inflammation, glycemic control and micro-vascular complications. J. Diabetes Complicat. 2015, 29, 120–126. [Google Scholar] [CrossRef]
- Talaat, I.M.; Nasr, A.; Alsulaimani, A.A.; Alghamdi, H.; Alswat, K.A.; Almalki, D.M.; Abushouk, A.; Saleh, A.M.; Allam, G. Association between type 1, type 2 cytokines, diabetic autoantibodies and 25-hydroxyvitamin D in children with type 1 diabetes. J. Endocrinol. Investig. 2016, 39, 1425–1434. [Google Scholar] [CrossRef]
- Fatima, N.; Faisal, S.M.; Zubair, S.; Ajmal, M.; Siddiqui, S.S.; Moin, S.; Owais, M. Role of pro-inflammatory cytokines and biochemical markers in the pathogenesis of type 1 diabetes: Correlation with age and glycemic condition in diabetic human subjects. PLoS ONE 2016, 11, e0161548. [Google Scholar] [CrossRef] [Green Version]
- Seyfarth, J.; Förtsch, K.; Ahlert, H.; Laws, H.J.; Karges, B.; Deenen, R.; Köhrer, K.; Mayatepek, E.; Meissner, T.; Jacobsen, M. Dominant TNFα and impaired IL-2 cytokine profiles of CD4+ T cells from children with type-1 diabetes. Immunol. Cell Biol. 2017, 95, 630–639. [Google Scholar] [CrossRef]
- Alnek, K.; Kisand, K.; Heilman, K.; Peet, A.; Varik, K.; Uibo, R. Increased blood levels of growth factors, proinflammatory cytokines, and Th17 cytokines in patients with newly diagnosed type 1 diabetes. PLoS ONE 2015, 10, e0142976. [Google Scholar] [CrossRef]
- Tasci, E.; Ozbek, M.N.; Onenli Mungan, N.; Temiz, F.; Topaloglu, A.K.; Yuksel, B. Low Serum Adiponectin Levels in Children and Adolescents with Diabetic Retinopathy. Eurasian J. Med. 2011, 43, 18–22. [Google Scholar] [CrossRef]
- Shah, A.S.; Dolan, L.M.; Lauer, A.; Davis, C.; Dabelea, D.; Daniels, S.R.; Hamman, R.F.; Marcovina, S.; Wadwa, R.P.; Urbina, E.M. Adiponectin and arterial stiffness in youth with type 1 diabetes: The SEARCH for diabetes in youth study. J. Pediatr. Endocrinol. Metab. 2012, 25, 717–721. [Google Scholar] [CrossRef] [Green Version]
- Margoni, A.; Perrea, D.N.; Vlachos, I.; Prokopaki, G.; Pantopoulou, A.; Fotis, L.; Kostaki, M.; Papavassiliou, A.G. Serum leptin, adiponectin and tumor necrosis factor-α in hyperlipidemic rats with/without concomitant diabetes mellitus. Mol. Med. 2011, 17, 36–40. [Google Scholar] [CrossRef] [PubMed]
- Redondo, M.J.; Rodriguez, L.M.; Haymond, M.W.; Hampe, C.S.; Smith, E.O.; Balasubramanyam, A.; Devaraj, S. Serum adiposity-induced biomarkers in obese and lean children with recently diagnosed autoimmune type 1 diabetes. Pediatr. Diabetes 2014, 15, 543–549. [Google Scholar] [CrossRef] [PubMed]
- Heilman, K.; Zilmer, M.; Zilmer, K.; Kool, P.; Tillmann, V. Elevated plasma adiponectin and decreased plasma homocysteine and asymmetric dimethylarginine in children with type 1 diabetes. Scand. J. Clin. Lab. Investig. 2009, 69, 85–91. [Google Scholar] [CrossRef] [PubMed]
- Galler, A.; Heitmann, A.; Siekmeyer, W.; Gelbrich, G.; Kapellen, T.; Kratzsch, J.; Kiess, W. Increased arterial stiffness in children and adolescents with type 1 diabetes: No association between arterial stiffness and serum levels of adiponectin. Pediatr. Diabetes 2010, 11, 38–46. [Google Scholar] [CrossRef]
- Messaaoui, A.; Willems, D.; Mélot, C.; Dorchy, H. Risk markers for cardiovascular disease in young type 1 diabetic patients: Lipoproteins, high-sensitivity c-reactive protein and adiponectin. Acta Clin. Belg. 2012, 67, 79–82. [Google Scholar] [CrossRef]
- Alman, A.C.; Talton, J.W.; Wadwa, R.P.; Urbina, E.M.; Dolan, L.M.; Hamman, R.F.; D’Agostino, R.B.; Marcovina, S.M.; Dabelea, D.M. Inflammation, adiposity, and progression of arterial stiffness in adolescents with type 1 diabetes: The SEARCH CVD Study. J. Diabetes Complicat. 2018, 32, 995–999. [Google Scholar] [CrossRef]
- Habeeb, N.M.M.; Youssef, O.I.; Saab, A.A.R.; El Hadidi, E.S. Adiponectin as a marker of complications in type I diabetes. Indian Pediatr. 2012, 49, 277–280. [Google Scholar] [CrossRef]
- Babar, G.; Clements, M.; Dai, H.; Raghuveer, G. Assessment of biomarkers of inflammation and premature atherosclerosis in adolescents with type-1 diabetes mellitus. J. Pediatr. Endocrinol. Metab. 2019, 32, 109–113. [Google Scholar] [CrossRef]
- Bjornstad, P.; Pyle, L.; Kinney, G.L.; Rewers, M.; Johnson, R.J.; Maahs, D.M.; Snell-Bergeon, J.K. Adiponectin is associated with early diabetic kidney disease in adults with type 1 diabetes: A Coronary Artery Calcification in Type 1 Diabetes (CACTI) Study. J. Diabetes Complicat. 2017, 31, 369–374. [Google Scholar] [CrossRef] [Green Version]


| Parameters | Details | Cases | Controls | Total | Statistics |
|---|---|---|---|---|---|
| Group | 52 (44.1%) | 66 (55.9%) | 118 | ||
| Age at inclusion (years) | μ ± SD | 11.94 ± 4.45 | 11.09 ± 4.82 | 11.47 ± 4.66 | T-test: p = 0.327 |
| Age at onset (years) | μ ± SD | 6.67 ± 3.82 | N/A | 6.67 ± 3.82 | MW: p = 0.019 |
| Gender n (%) | Female | 30 (57.7%) | 32 (48.5%) | 62 (52.5%) | OR = 1.45 [0.70, 3.01] (p = 0.357) |
| Male | 22 (42.3%) | 34 (51.5%) | 56 (47.5%) | ||
| Patient’s residence area | rural | 24 (46.2%) | 26 (39.4%) | 50 (42.4%) | OR = 1.32 [0.63, 2.75] (p = 0.574) |
| urban | 28 (53.8%) | 40 (60.6%) | 68 (57.6%) | ||
| Weight–Z score | μ ± SD | 0.898 ± 1.24 | −0.317 ± 1.05 | 0.158 ± 1.27 | T-test: p < 0.001 |
| Height–Z score | μ ± SD | 0.426 ± 1.27 | 0.409 ± 1.26 | 0.417 ± 1.26 | T-test: p = 0.945 |
| Body mass index–Z score | μ ± SD | 0.298 ± 1.15 | −0.459 ± 1.61 | −0.125 ± 1.47 | Welch: p = 0.004 |
| Systolic blood pressure (mmHg) | μ ± SD | 102.71 ± 12.2 | 102.04 ± 12.6 | 102.26 ± 12.4 | MW: p = 0.377 |
| Diastolic blood pressure (mmHg) | μ ± SD | 57.08 ± 10.1 | 57.71 ± 9.64 | 57.28 ± 9.86 | MW: p = 0.603 |
| Parameters | Details | Cases | Controls | Statistics |
|---|---|---|---|---|
| Group | 52 (44.1%) | 66 (55.9%) | ||
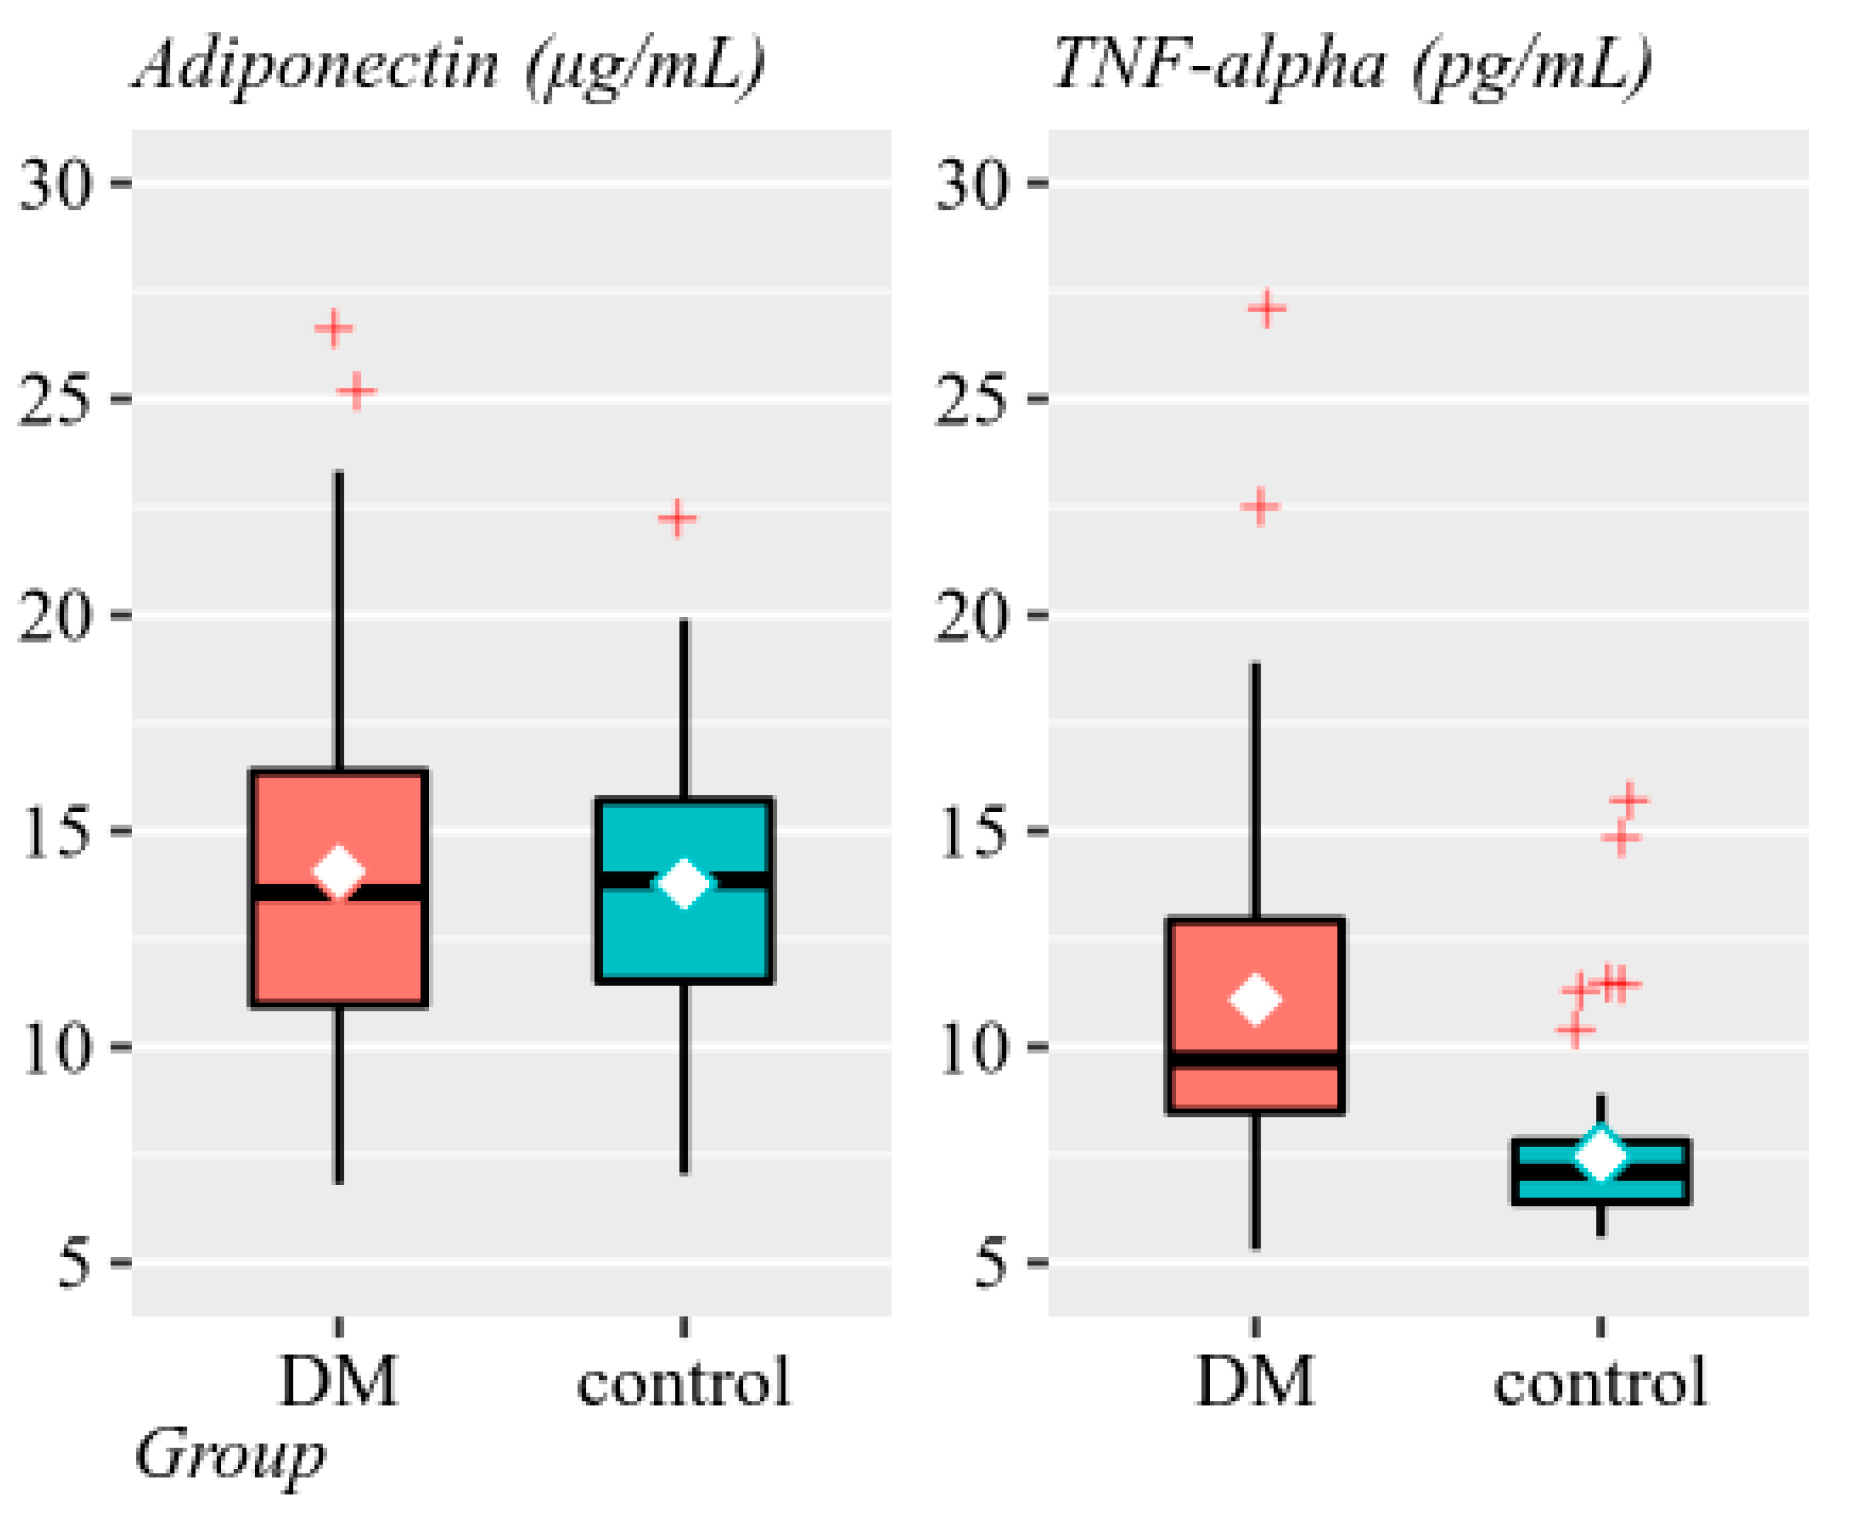
| Adiponectin (μg/mL) | μ ± SD | 14.07 ± 4.69 | 13.78 ± 3.39 | MW: p = 0.774 |
| M (range) | 13.57 (6.82:26.61) | 13.85 (7.05:22.31) | ||
| Gμ ± SD | 13.33 ± 1.4 | 13.34 ± 1.3 | ||
| Insulin resistance risk | medium-high | 10 (19.2%) | 10 (15.2%) | OR = 1.33 [0.51, 3.49] (p = 0.625) |
| low | 42 (80.8%) | 56 (84.8%) | ||
| TNF-alpha (pg/mL) | μ ± SD | 11.09 ± 4.21 | 7.47 ± 1.85 | MW: p < 0.001 |
| M (range) | 9.7 (5.3:27.1) | 7.1 (5.6:15.5) | ||
| Gμ ± SD | 10.46 ± 1.4 | 7.30 ± 1.22 | ||
| Inflammation risk | high | 42 (80.8%) | 8 (12.1%) | OR = 30.45 [11.08, 83.68] (p < 0.001) |
| normal | 10 (19.2%) | 58 (87.9%) |
| Parameters | Details | Cases | Controls | Statistics |
|---|---|---|---|---|
| Group | 52 (44.1%) | 66 (55.9%) | ||
| Triglycerides (mg/dL) | μ ± SD | 89.23 ± 51.7 | 73.30 ± 32.5 | MW: p = 0.109 |
| M (range) | 72 (26:318) | 66.5 (24:187) | ||
| Total cholesterol (mg/dL) | μ ± SD | 177.71 ± 42.7 | 155.59 ± 23.1 | MW: p = 0.001 |
| M (range) | 169 (111:353) | 155 (99:200) | ||
| HDL cholesterol (mg/dL) | μ ± SD | 55.44 ± 10.3 | 52.36 ± 10.1 | MW: p = 0.126 |
| M (range) | 54 (31:84) | 51.5 (31:78) | ||
| HbA1C (%) | μ ± SD | 9.03 ± 1.79 | 4.83 ± 0.477 | MW: p < 0.001 |
| M (range) | 8.7 (6.7:15.4) | 4.85 (4:5.9) |
| Variable | Details | DM | Control | Statistics |
|---|---|---|---|---|
| Group | 52 (44.1%) | 66 (55.9%) | ||
| 276G/TAdiponectin | GG | 8 (15.4%) | 3 (23.1%) | V = 0.17 (p = 0.390) |
| GT | 31 (59.6%) | 5 (38.5%) | ||
| TT | 13 (25.0%) | 5 (38.5%) | ||
| Adipo Q genotype | mutant | 16 (47.1%) | 31 (49.2%) | V = 0.07 (p = 0.774) |
| heterozygote | 15 (44.1%) | 24 (38.1%) | ||
| wild-type | 3 (8.8%) | 8 (12.7%) | ||
| GSTM genotype | M- | 22 (42.3%) | 6 (46.2%) | OR = 0.86 [0.25, 2.90], phi = 0.03 (p > 0.999) |
| M+ | 30 (57.7%) | 7 (53.8%) | ||
| GSTT genotype | T- | 17 (32.7%) | 4 (30.8%) | OR = 1.09 [0.29, 4.06], phi = 0.02 (p > 0.999) |
| T+ | 35 (67.3%) | 9 (69.2%) | ||
| TNF-alfa genotype | A1A1 | 39 (75.0%) | 9 (69.2%) | V = 0.09 (p = 0.761) |
| A1A2 | 12 (23.1%) | 4 (30.8%) | ||
| A2A2 | 1 (1.9%) | 0 |
| Parameters | Details | Cases | Controls | Statistics |
|---|---|---|---|---|
| Group | 52 (44.1%) | 66 (55.9%) | ||
| Insulin dose (IU/kg/day) | μ ± SD | 0.961 ± 0.26 | N/A | MW: p = 0.583 |
| M (range) | 1 (0.36:1.51) | N/A | ||
| Injections/day | 4 | 25 (48.1%) | N/A | V = 0.23 (p = 0.265) |
| 5 insulin pump | 23 (44.2%) 4 (7.7%) | N/A N/A |
| Parameters | Details | Cases | Statistics |
|---|---|---|---|
| Group | 52 (44.1%) | ||
| Autoimmune disease | Yes | 17 (32.7%) | OR = 64.58 [3.77, 106.01] (p < 0.001) |
| AIT+CD | 5 (9.6%) | ||
| AIT | 10 (19.2%) | ||
| CD | 2 (3.8%) | ||
| No | 35 (67.3%) | ||
| Age at onset of autoimmune disease (years) | μ ± SD | 9.18 ± 4.03 | MW: p = 0.493 |
| M (range) | 9 (2:16) |
| Parameters | Details | Cases | Statistics |
|---|---|---|---|
| Group | 52 (44.1%) | ||
| Retinopathy | minimal retinal changes | 1 (1.9%) | V = NA (p > 0.999) |
| mild diabetic nonproliferative retinopathy diabetica neproliferativa usoara | 1 (1.9%) | ||
| No | 50 (96.2%) | ||
| Nephropathy | transient microalbuminuria | 4 (7.7%) | V = NA (p > 0.999) |
| incipient diabetic nephropathy | 2 (3.8%) | ||
| No | 46 (88.5%) | ||
| Neuropathy | subclinical sensitive neuropathy | 14 (27%) | V = NA (p > 0.999) |
| sensitive neuropathy | 4 (7.7%) | ||
| aggravated sensitive neuropathy | 1 (1.9%) | ||
| No | 33 (63.5%) |
Publisher’s Note: MDPI stays neutral with regard to jurisdictional claims in published maps and institutional affiliations. |
© 2020 by the authors. Licensee MDPI, Basel, Switzerland. This article is an open access article distributed under the terms and conditions of the Creative Commons Attribution (CC BY) license (http://creativecommons.org/licenses/by/4.0/).
Share and Cite
Szabo, C.E.; Man, O.I.; Istrate, A.; Kiss, E.; Catana, A.; Creț, V.; Șerban, R.S.; Pop, I.V. Role of Adiponectin and Tumor Necrosis Factor-Alpha in the Pathogenesis and Evolution of Type 1 Diabetes Mellitus in Children and Adolescents. Diagnostics 2020, 10, 945. https://doi.org/10.3390/diagnostics10110945
Szabo CE, Man OI, Istrate A, Kiss E, Catana A, Creț V, Șerban RS, Pop IV. Role of Adiponectin and Tumor Necrosis Factor-Alpha in the Pathogenesis and Evolution of Type 1 Diabetes Mellitus in Children and Adolescents. Diagnostics. 2020; 10(11):945. https://doi.org/10.3390/diagnostics10110945
Chicago/Turabian StyleSzabo, Csilla Enikő, Oana Iulia Man, Alexandru Istrate, Eva Kiss, Andreea Catana, Victoria Creț, Radu Sorin Șerban, and Ioan Victor Pop. 2020. "Role of Adiponectin and Tumor Necrosis Factor-Alpha in the Pathogenesis and Evolution of Type 1 Diabetes Mellitus in Children and Adolescents" Diagnostics 10, no. 11: 945. https://doi.org/10.3390/diagnostics10110945