1. Introduction
Frailty is a concept globally used in geriatrics and is defined as a condition of increased vulnerability to endogenous and/or exogenous stressors associated with physiological decline, and it precedes disability in human life [
1,
2,
3,
4]. Originally, this concept was put forward in order to pick up aged individuals with a high risk of adverse health-related consequences, falls, disabilities, dependencies, and mortality [
1,
2,
3]. Recently, frailty has been increasingly recognized in scientific medical reports, including in chronic liver diseases (CLDs) where it can be found in nearly half of patients with liver cirrhosis (LC) [
5,
6,
7,
8]. Frailty is considered to be reversible, with promising data supporting rehabilitation and lifestyle interventional programs [
9,
10,
11]. Understanding how frailty is related to adverse outcomes requires looking at frailty as a systemic disorder as well as sarcopenia assessed by muscle mass decrease and muscle strength decline [
8,
12,
13]. However, frailty and sarcopenia can occur with different prevalence, with variable impacts on outcomes in patients on waiting lists for liver transplantation [
14].
Body composition analysis is an essential part of the assessment of nutritional status and can provide prognostically helpful insights and an opportunity to monitor the influences of nutrition-associated disease progression and nutritional interventions [
15]. Anthropometric measurements (AMs) are convenient and non-invasive to evaluate body composition and thus, they are suitable for nutritional evaluation in daily clinical practice [
15,
16,
17,
18]. Arm circumference (AC) and calf circumference (CC) are primarily used to calculate muscle mass, and body mass index (BMI), triceps skinfold thickness (TSF), and waist circumference (WC) are primarily used to calculate fat mass [
15]. Of those parameters, CC is recommended for its use in the revised Asian Working Group for Sarcopenia (AWGS) guidelines for the purpose of facilitating earlier identification of sarcopenic individuals [
19]. In the revised AWGS guidelines, 34 cm in men and 33 cm in women are the cutoff points in CC for sarcopenia [
19].
However, to the best of our knowledge, there have been scarce data regarding the relationship between frailty and AMs in patients with CLDs [
20]. The aim of the study was to elucidate the influence of AMs on frailty in patients with CLDs.
3. Results
3.1. Baseline Features
Baseline features of the study cohort (
n = 183 in male (median (IQR) age = 66 (53, 72) years) and
n = 192 in female (median (IQR) age = 66 (55, 72.8) years);
p = 0.6237) were presented in
Table 1. LC was identified at baseline in 72 cases (39.3%) in male participants and 58 cases (30.2%) in female participants (
p = 0.0660). Hepatitis C virus accounted for 39.3% in male participants (72/183) and 55.2% (106/192) in female participants. In terms of albumin-bilirubin (ALBI) grade, ALBI grade 1 was in the majority, both in male (125/183, 68.3%) and female (155/192, 80.7%) participants. In male participants, frailty patients had a significantly higher age (
p = 0.0126), lower serum albumin levels (
p < 0.0001), and a higher proportion of LC (
p = 0.0003) than prefrail or robust patients. Similarly, in female participants, patients had a significantly higher age (
p = 0.0146), lower serum albumin levels (
p = 0.0010), and a higher proportion of LC (
p = 0.0001) than prefrail or robust patients.
The median (IQR) WS in male and female participants were 1.28 (1.08, 1.44) m/s and 1.32 (1.16, 1.47) (p = 0.4618), respectively. Twenty-eight male patients (15.3%) and 27 female patients (14.1%) had a WS decrease (i.e., <1.0 m/s). The median (IQR) GS in male and female participants were 33.3 (28.0, 39.0) kg and 21.0 (17.7, 24.5) kg. Thirty-five male patients (19.1%) and 50 female patients (26.0%) had a GS decrease (i.e., <26 kg in male and <18 kg in female). Eighty-two male patients (44.8%) and 92 female patients (47.9%) reported exhaustion. Fourteen male patients (7.7%) and 11 female patients (5.7%) reported BW loss. Fifty-one male patients (27.9%) and 44 female patients (22.9%) reported low physical activity. The frailty point ranged from 0 to 4 (median point = 1) in male and 0 to 5 (median point = 1) in female participants. Robust (frailty point 0), prefrail (frailty point 1 or 2), and frailty (frailty point 3 or more) were observed in 63 (34.4%), 98 (53.6%), and 22 (12.0%) in male participants, respectively, and 63 (32.8%), 101 (52.6%), and 28 (14.6%) in female participants, respectively.
In terms of AMs, the median (IQR) AC (cm), TSF (cm), WC (cm), CC (cm), and BMI (kg/m2) in male vs. female were: 28 (26, 30) cm vs. 28 (25, 30.8) cm in AC (p = 0.1688), 12 (9, 16) mm vs. 20 (15, 27) mm in TSF (p < 0.0001), 36.9 (34.4, 39.2) cm vs. 34.8 (32.7, 37.4) cm in CC (p < 0.0001), 89.5 (83.5, 97.0) cm vs. 85.8 (80, 92.5) cm in WC (p < 0.0001), and 23.2 (21.4, 25.9) kg/m2 vs. 22.3 (20.1, 25.5) kg/m2 (p = 0.0136) in BMI.
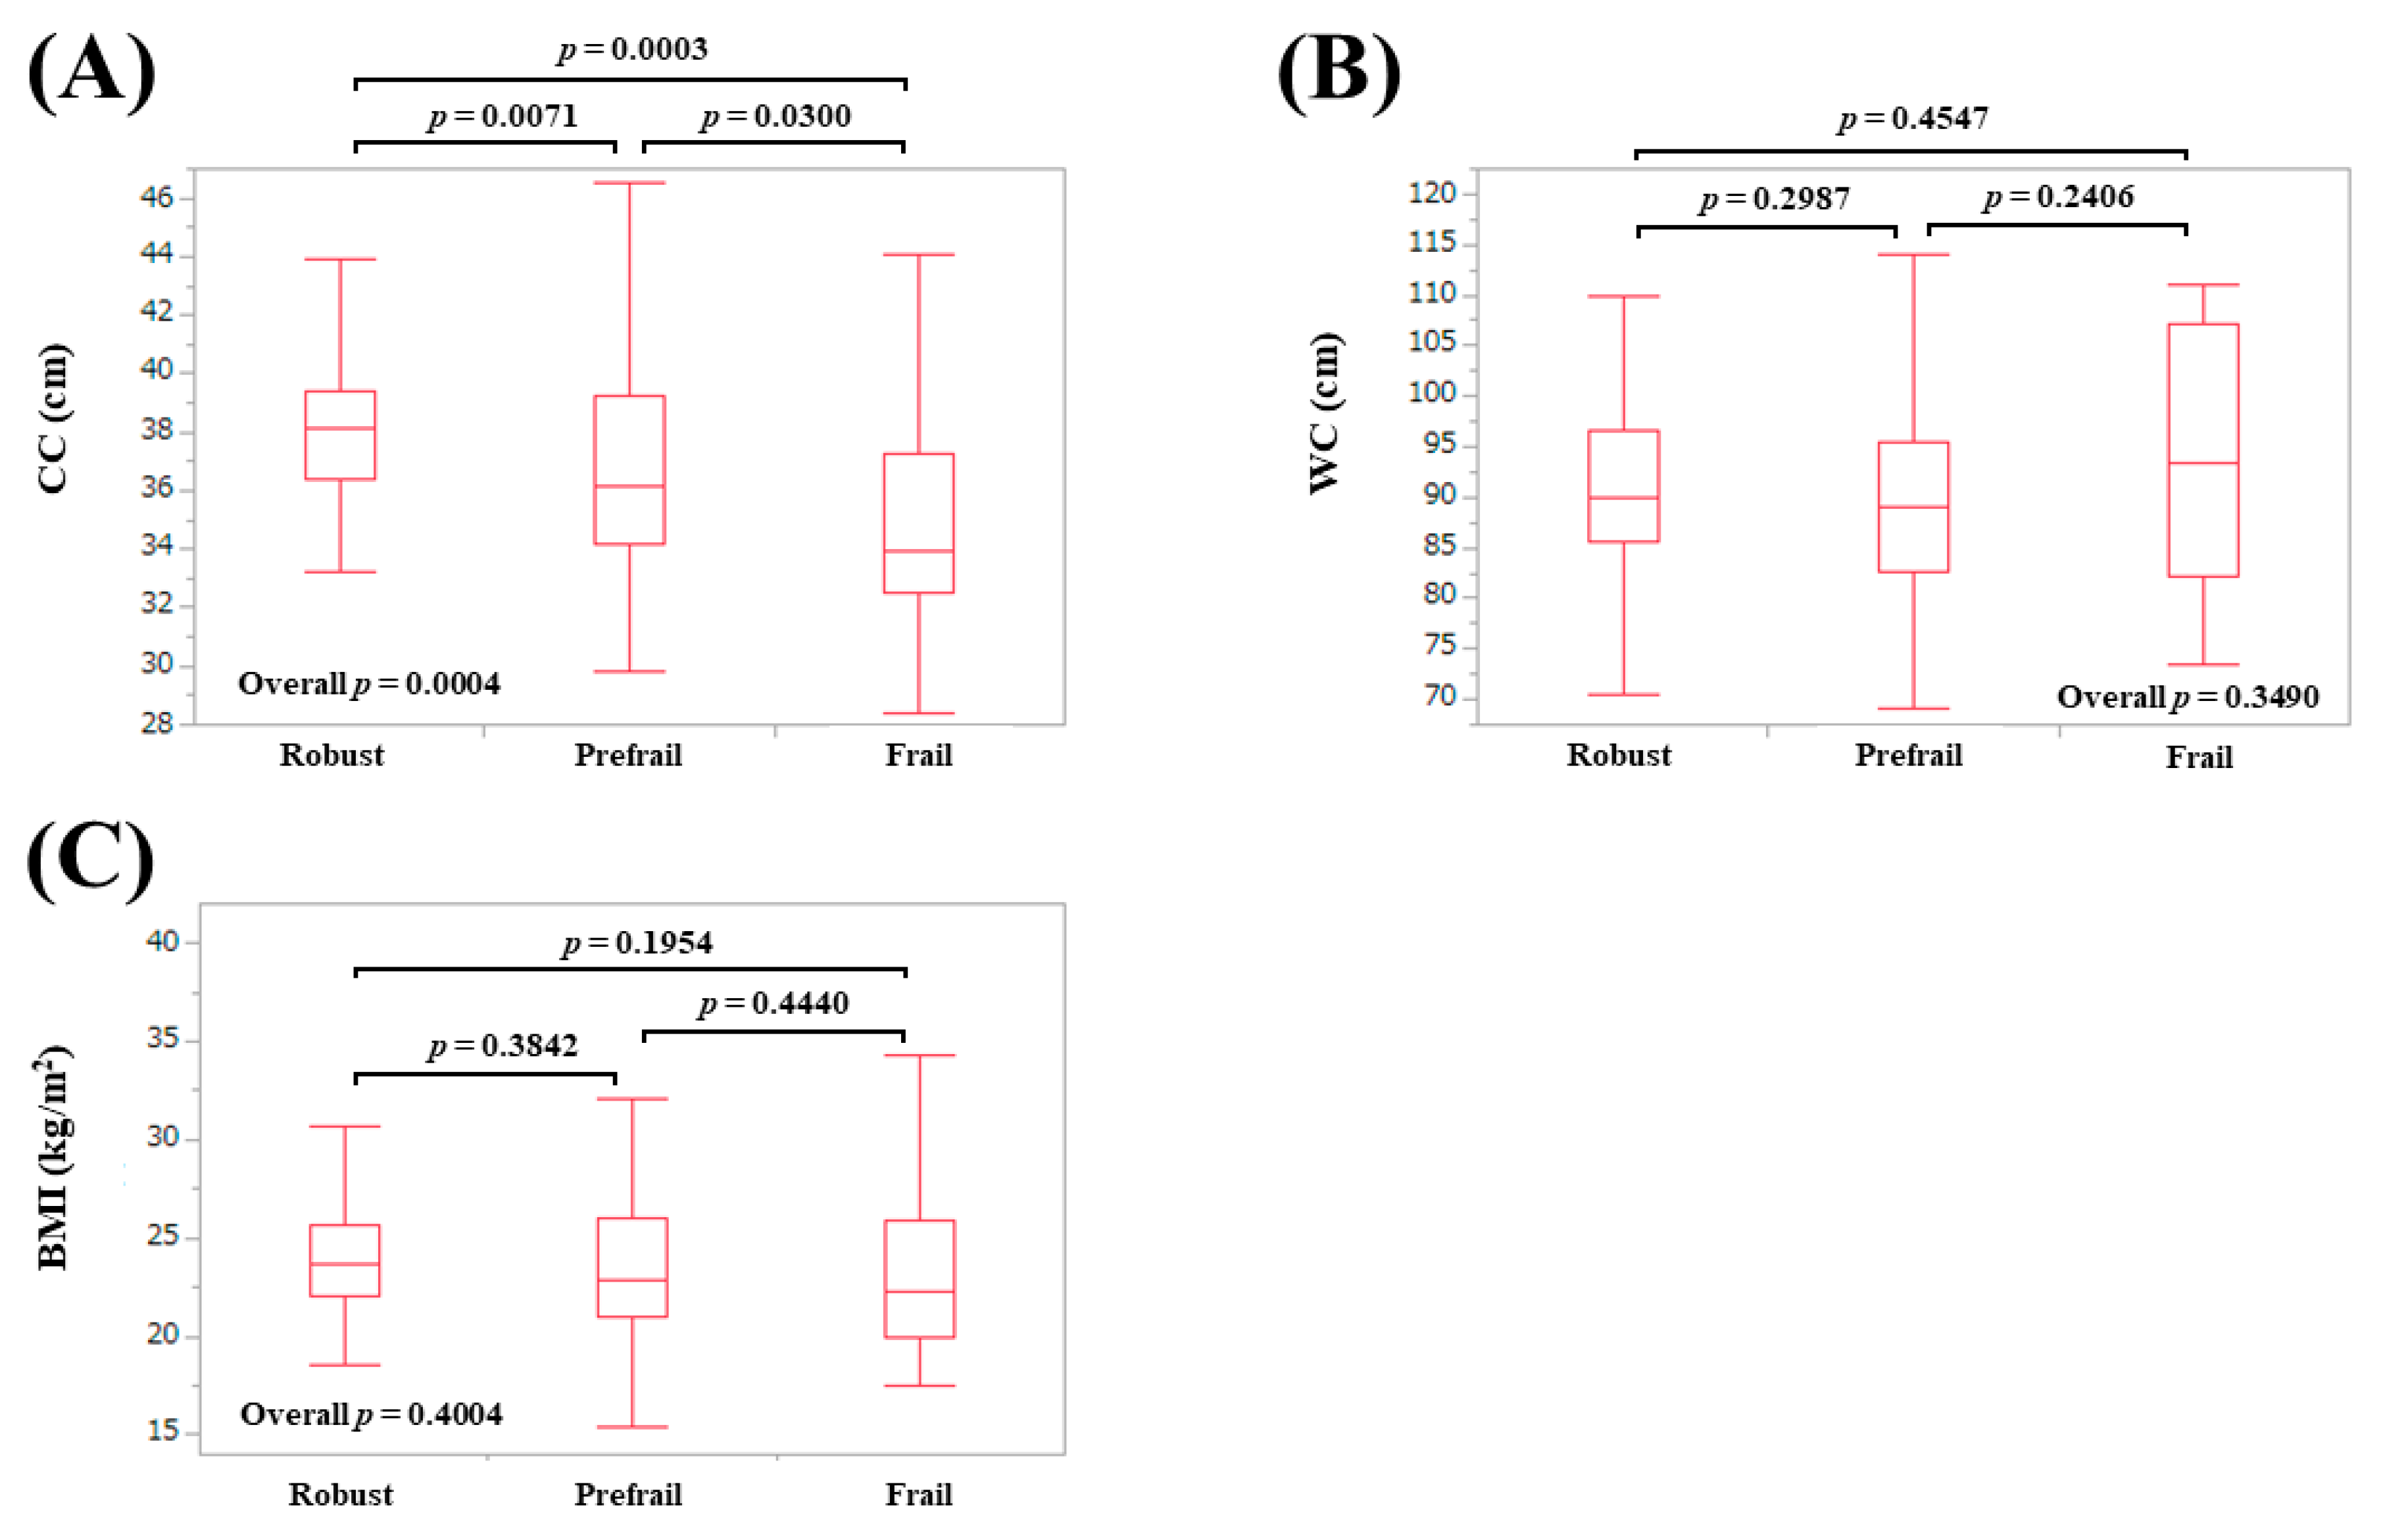
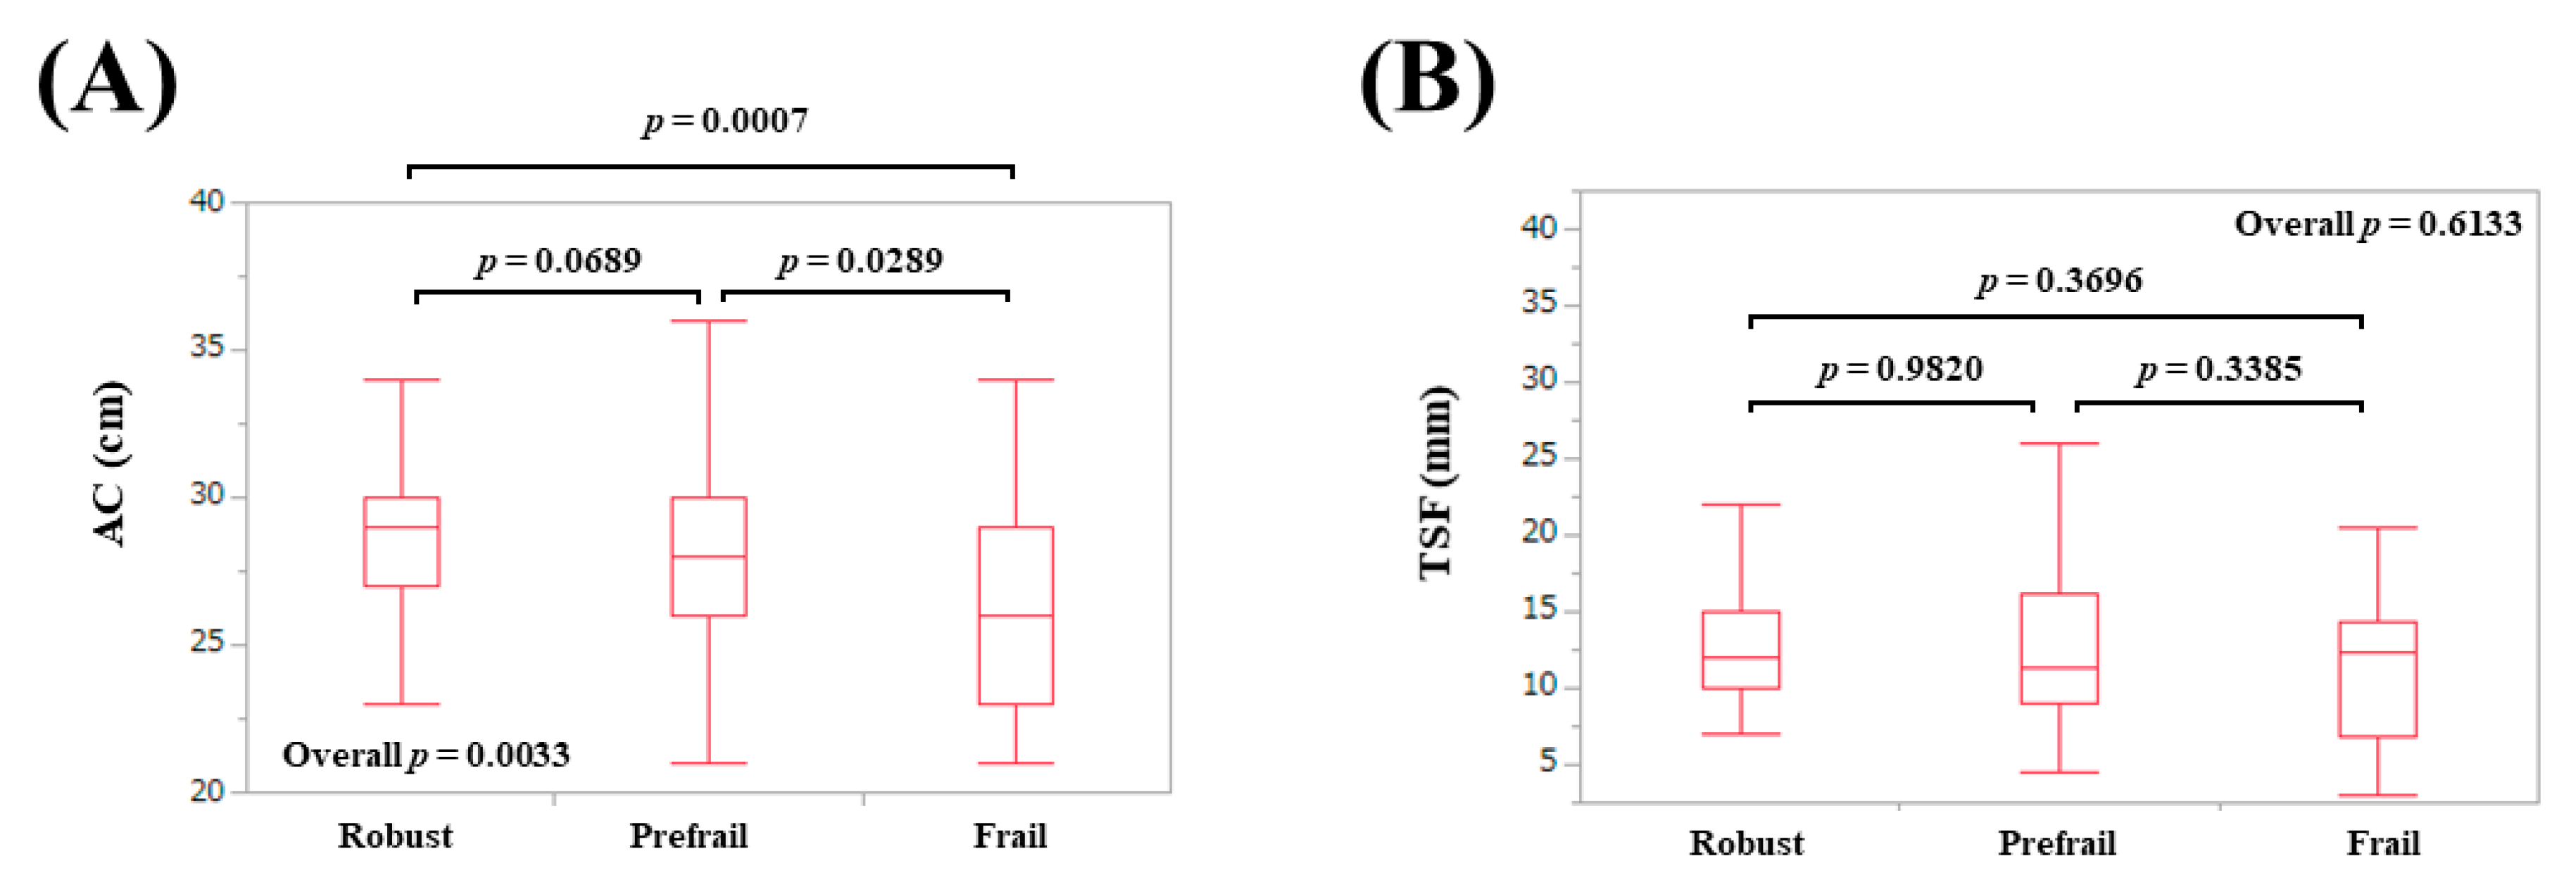
3.2. AMs According to Frailty Status in Males
The median (IQR) AC in patients defined as robust, prefrail, and frail were: 29 (27, 30) cm in robust, 28 (26, 30) cm in prefrail, and 26 (23, 29) cm in frail (overall
p = 0.0033) (
Figure 1A). The median (IQR) TSF in patients defined as robust, prefrail, and frail were: 12 (10, 15) mm in robust, 11.25 (9, 16.1) mm in prefrail, and 12.3 (6.9, 14.3) mm in frail (overall
p = 0.6133) (
Figure 1B). The median (IQR) CC in patients defined as robust, prefrail, and frail were: 38.1 (36.4, 39.4) cm in robust, 36.2 (34.2, 39.25) cm in prefrail, and 34.0 (32.5, 37.3) cm in frail (overall
p = 0.0004) (
Figure 2A). The median (IQR) WC in patients defined as robust, prefrail, and frail were: 90 (85.5, 96.5) cm in robust, 89 (82.7, 95.5) cm in prefrail, and 93.4 (82.3, 107.3) cm in frail (overall
p = 0.3490) (
Figure 2B). The median (IQR) BMI in patients defined as robust, prefrail, and frail were: 23.7 (22, 25.7) kg/m
2 in robust, 22.9 (21.0, 26) kg/m
2 in prefrail, and 22.3 (20.0, 26.0) kg/m
2 in frail (overall
p = 0.4004) (
Figure 2C).
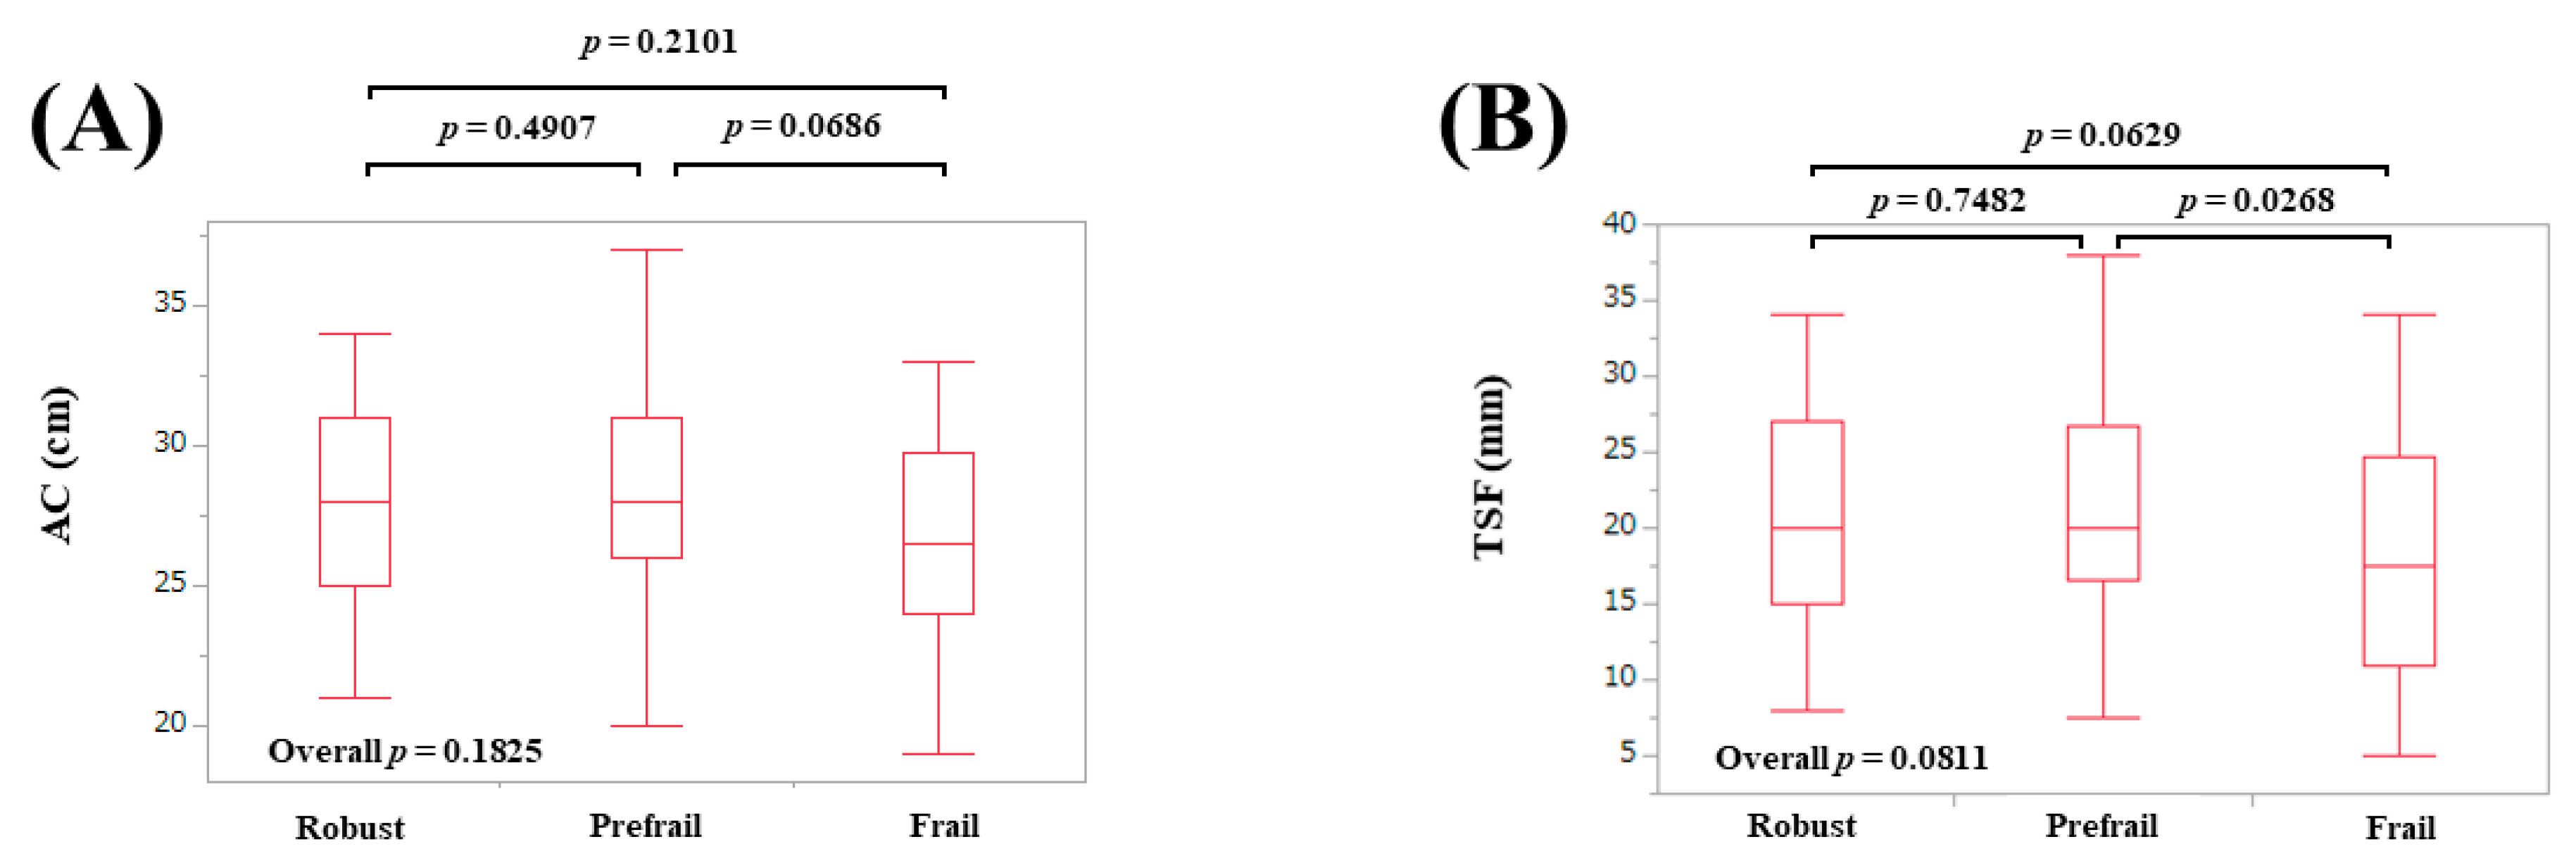
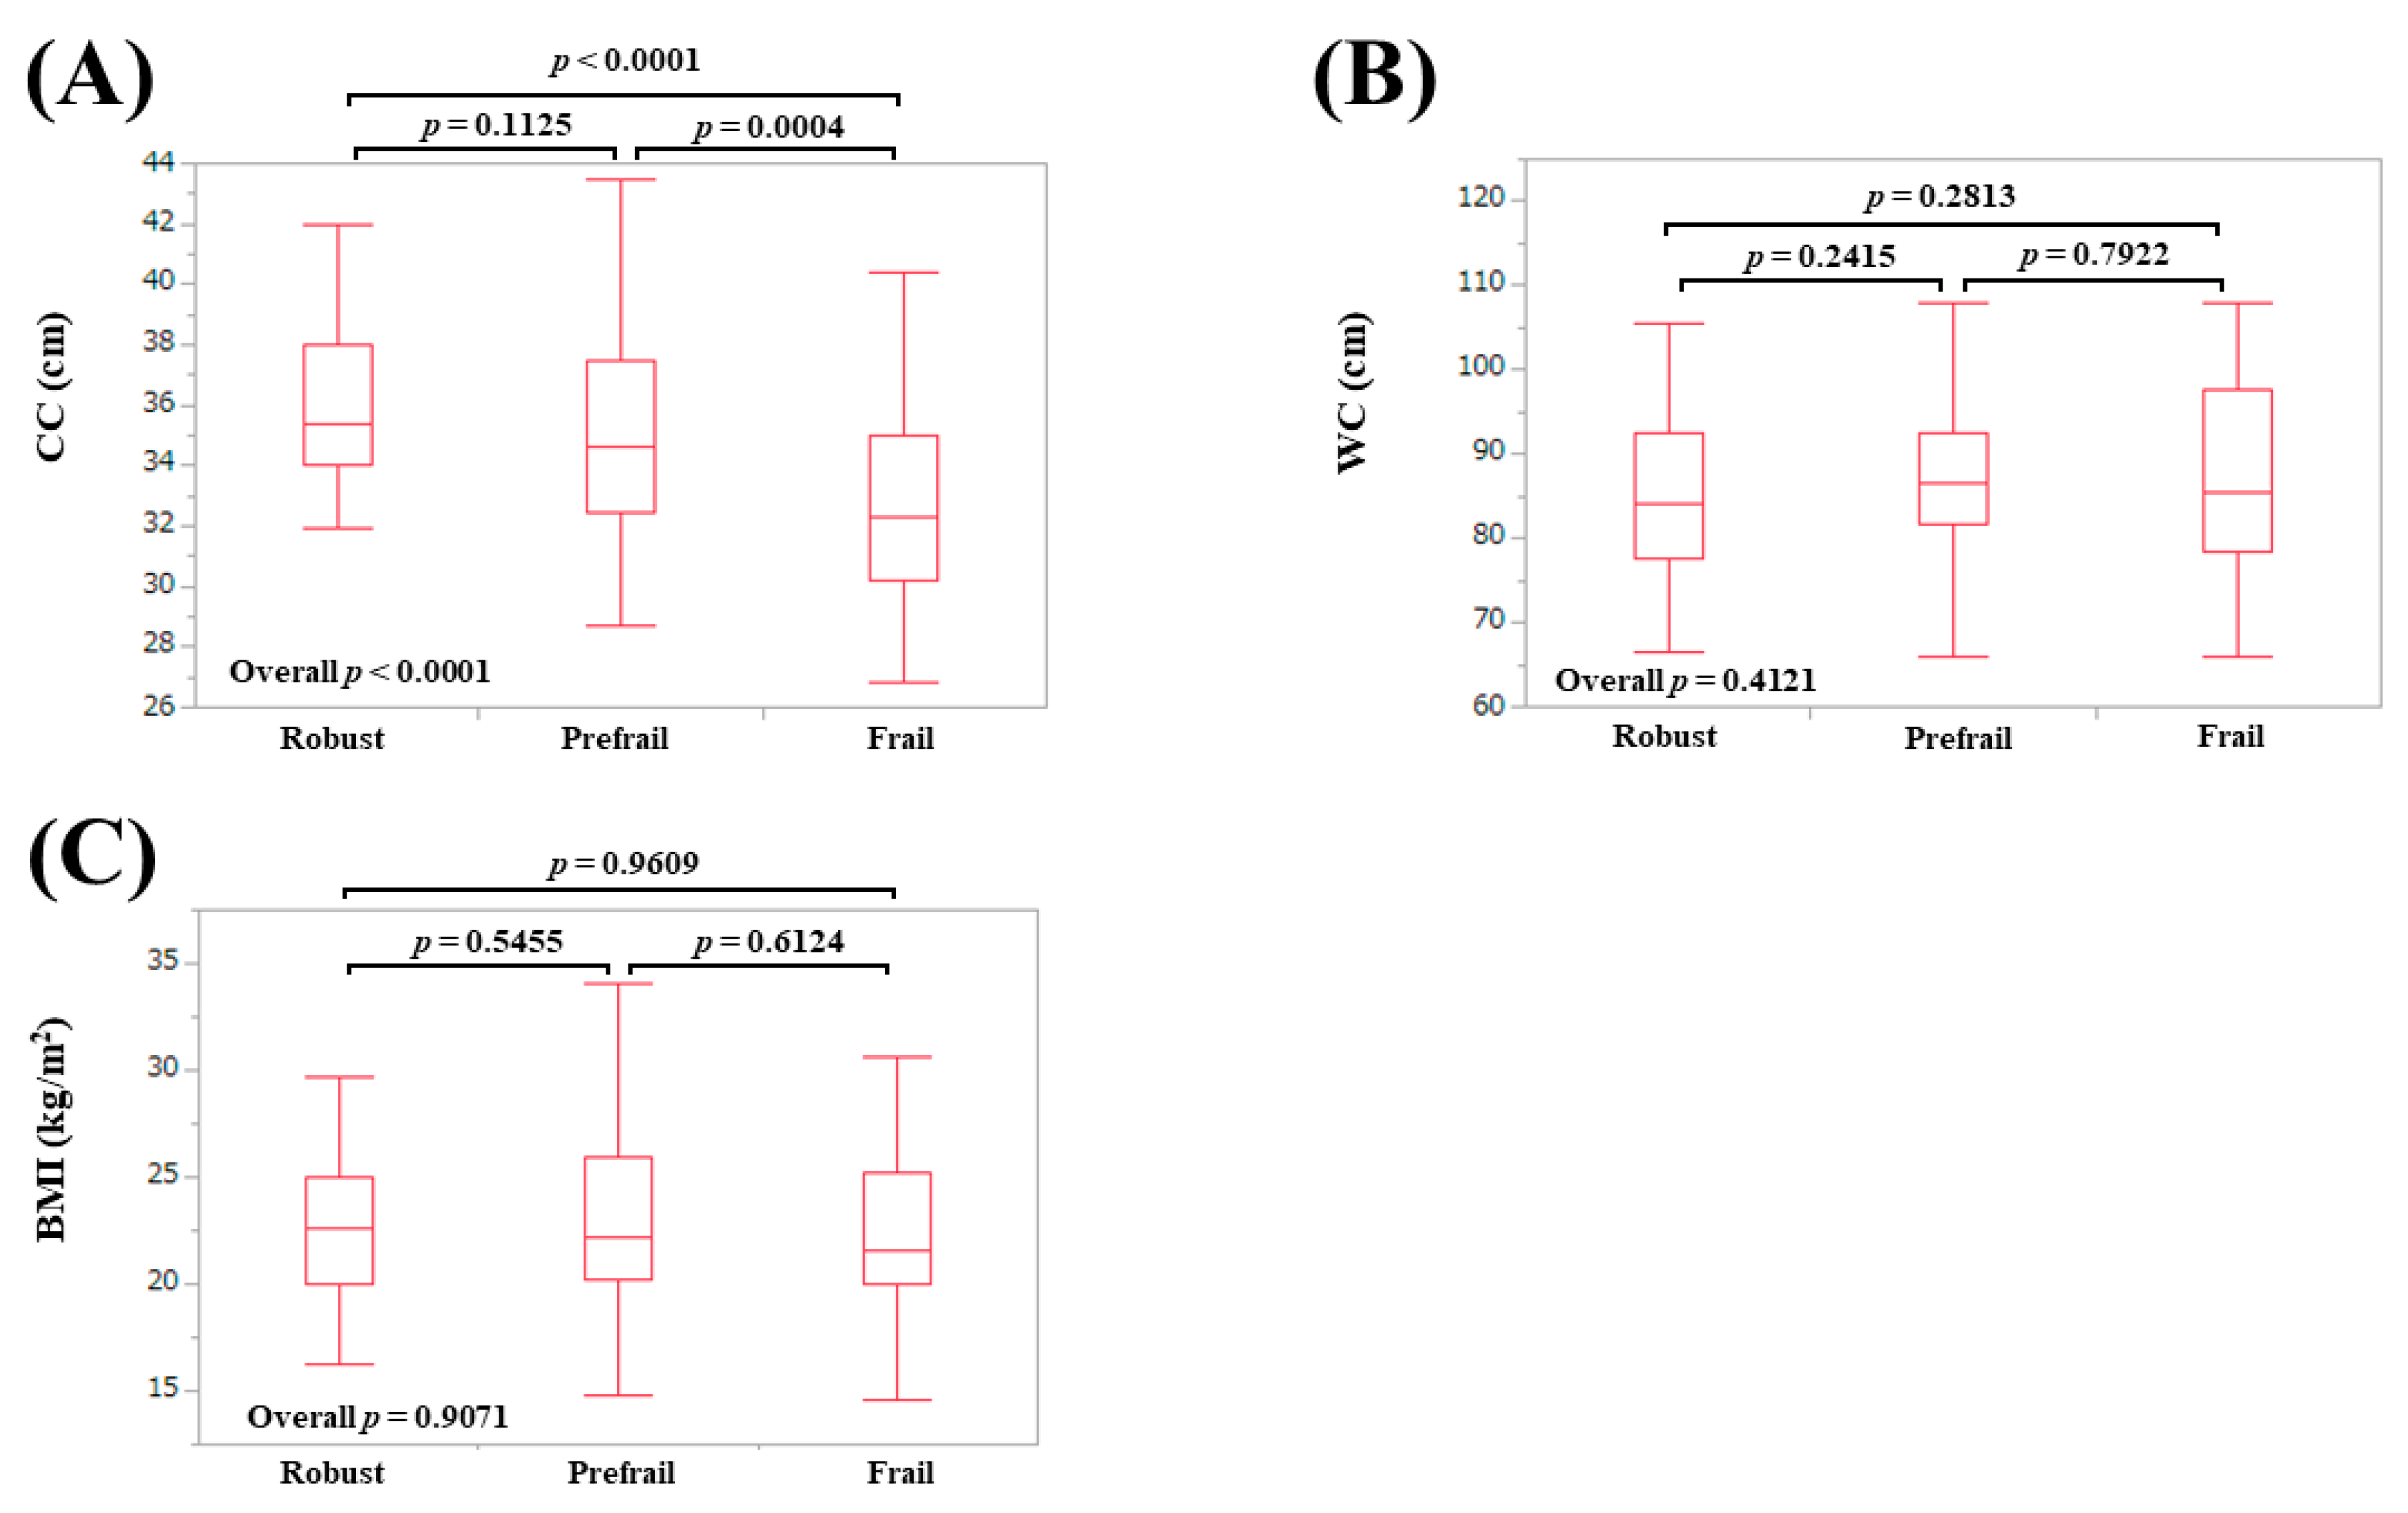
3.3. AMs According to Frailty Status in Females
The median (IQR) AC in patients defined as robust, prefrail, and frail were: 28 (25, 31) cm in robust, 28 (26, 31) cm in prefrail, and 26.5 (24, 29.75) cm in frail (overall
p = 0.1825) (
Figure 3A). The median (IQR) TSF in patients defined as robust, prefrail, and frail were: 20 (15, 27) mm in robust, 20 (16.5, 26.8) mm in prefrail, and 17.5 (11, 24.8) mm in frail (overall
p = 0.0811) (
Figure 3B). The median (IQR) CC in patients defined as robust, prefrail, and frail were: 35.4 (34, 38) cm in robust, 34.6 (32.5, 37.5) cm in prefrail, and 32.3 (30.2, 35) cm in frail (overall
p < 0.0001) (
Figure 4A). The median (IQR) WC in patients defined as robust, prefrail, and frail were: 84 (77.5, 92.4) cm in robust, 86.5 (81.8, 92.5) cm in prefrail, and 85.5 (78.6, 97.5) cm in frail (overall
p = 0.4121) (
Figure 4B). The median (IQR) BMI in patients defined as robust, prefrail, and frail were: 22.6 (20, 25) kg/m
2 in robust, 22.2 (20.3, 26.0) kg/m
2 in prefrail, and 21.6 (20.0, 25.3) kg/m
2 in frail (overall
p = 0.9071) (
Figure 4C).
3.4. AMs According to Frailty Phenotypes in Males
For the male participants, the values of AC (
p = 0.010) and CC (
p = 0.0339) in patients with a decrease in WS were significantly lower than those in each counterpart (
Table 2). The values of AC (
p < 0.0001), CC (
p < 0.0001), and BMI (
p = 0.0037) in patients with a decrease in GS were significantly lower than those in each counterpart (
Table 2). The values of AC (
p = 0.0278) and CC (
p = 0.0225) in patients with physical activity decrease were significantly lower than those in each counterpart (
Table 2). No significant differences of 5 AMs between the two groups were found in terms of fatigue and BW loss.
3.5. AMs According to Frailty Phenotypes in Females
In female participants, the values of TSF (
p = 0.0247) and CC (
p = 0.0002) in patients with a decrease in WS were significantly lower than those in each counterpart (
Table 3). The value of CC (
p = 0.0002) in patients with GS decrease was significantly lower than that in the counterpart (
Table 3). No significant differences of 5 AMs between the two groups were found in terms of fatigue, BW loss, and physical activity.
3.6. ROC Analysis for the Presence of Frailty in Males
ROC analysis for the presence of frailty in male participants revealed that CC had the highest AUC (AUC = 0.693), followed by AC (AUC = 0.676) among 5 AMs (
Table 4). Corresponding cutoff value, sensitivity, and specificity are shown in
Table 4.
3.7. ROC Analysis for the Presence of Frailty in Females
ROC analysis for the presence of frailty in female participants revealed that CC had the highest AUC (AUC = 0.734), followed by TSF (AUC = 0.62) among 5 AMs (
Table 4). Corresponding cutoff value, sensitivity, and specificity are shown in
Table 4.
3.8. Univariate and Multivariate Analyses of Factors Linked to Frailty in Males
In male participants, in the univariate analysis, age (
p = 0.0126), presence of LC (
p = 0.0003), serum albumin level (
p < 0.0001), AC (
p = 0.0038), and CC (
p = 0.0056) were observed to be significant factors associated with the presence of frailty (
Table 5). In the multivariate analysis for the five factors, only presence of LC (
p = 0.0433) was identified to be a significant factor linked to the presence of frailty (
Table 5). Corresponding odds ratio (OR) and confidence interval (CI) are shown in
Table 5.
3.9. Univariate and Multivariate Analyses of Factors Linked to Frailty in Females
In female participants, in the univariate analysis, age (
p = 0.0188), presence of LC (
p = 0.0003), serum albumin level (
p = 0.0010), AC (
p = 0.0491), TSF (
p = 0.0263), and CC (
p < 0.0001) were observed to be significant factors associated with the presence of frailty (
Table 5). In the multivariate analysis for the six factors, serum albumin (
p = 0.0444) and CC (
p = 0.0010) were identified to be significant factors linked to the presence of frailty (
Table 5). Corresponding OR and CI are shown in
Table 5.
4. Discussion
Japan is aging at an unprecedented speed and it will continue to age in the future. The same can apply to Japanese CLD patients [
29,
30]. As mentioned earlier, AMs are convenient and non-invasive to evaluate body composition [
15,
16,
17,
18]. How to use convenient markers in practice is of importance clinically. However, scarce data have provided a description of AMs and frailty in patients with CLDs [
20]. In our data, AC and CC were well stratified according to the frailty status in male and CC in female participants. In ROC analyses, CC had the highest AUC for frailty both in male (AUC = 0.693) and in female (AUC = 0.734) participants among five AMs. In the multivariate analysis, CC was an independent factor for frailty in female participants. Considering this, our results denoted that CC can be a useful AM for frailty in CLDs. Regarding sarcopenia surveillance, the revised AWGS guidelines propose separate algorithms for community vs. hospital settings [
19]. In community settings, assessment of muscle mass is not required for the diagnosis of sarcopenia in the revised AWGS guidelines. In both community and hospital settings, first screening for possible sarcopenia using CC or a questionnaire is recommended. CC appears to be helpful for the assessment of both sarcopenia and frailty. In addition, one should note that CC value decreases, even in the prefrail stage. On the other hand, in the multivariate analyses, the presence of LC in male participants and serum albumin levels in female participants were significant factors for frailty. Disease specific frailty in CLDs should be taken into account. Several reports have suggested that hepatic decompensation is associated with a significantly elevated risk of frailty and frailty is linked to a significantly elevated number and duration of hospital admissions for LC-related complications [
8,
31,
32,
33]. In our male non-LC patients (
n = 111), frailty was found in 5 patients (4.5%) and prefrailty was found in 57 patients (51.4%), while in our female non-LC patients (
n = 134), frailty was found in 11 patients (8.2%) and prefrailty was found in 70 patients (52.2%). One should also keep in mind that non-LC status does not deny the possibility of frailty.
The cutoff values of CC for sarcopenia in the revised AWGS guidelines are 34 cm in males and 33 cm in females, while in our ROC analysis for frailty, the optimal cutoff values of CC were 33.7 cm in males and 33.4 cm in females, which are almost identical to AWGS data [
19,
34]. Sarcopenia indicates physical frailty and sarcopenia forms the basis of frailty [
2,
35]. Sarcopenia itself causes lower limb muscle strength, falls, slow WS, and thus, decrease in physical activity can be induced. These all contribute to the development of frailty. Coincidence of cutoff values of CC between AWGS data and our data is not so surprising. Sarcopenia and frailty are unique, inter-related, and multi-dimensional issues in CLDs [
6]. Rolland et al. reported that female presenting with a CC <31 cm were three times more likely to have difficulties in moving [
36]. In our cohort, there were 21 female patients (10.9%) with a CC <31 cm. Of these, robustness was found in one patient, prefrailty in 11, and frailty in 9, which may support the usefulness of CC as a screening tool for frailty in female CLD patients. Fatigue and BW loss (phenotypes for frailty) did not correlate with AMs, both in male and female participants, in our data. As expected, AMs can correlate with physical function.
BMI and WC were not significant factors linked to frailty, both in male and female participants, in our analysis. A close correlation between higher abdominal obesity and frailty in males has been reported [
37]. Another study reported that being overweight was significantly associated with prefrailty and obesity was associated with prefrailty and frailty in females [
38]. The reasons for these discrepancies between their data and our data are unclear and further studies regarding the impact of obesity on frailty in CLDs is necessary. AC means the sum of arm muscle circumference and TSF [
15]. Thus, both muscle mass and fat mass can affect AC value. This may be linked to our findings that AC was not a significant factor in the multivariate analysis, both for male and female participants, although it was significant in the univariate analysis, both for male and female participants.
Several limitations associated with the study must be mentioned. Firstly, this observational study had a retrospective and cross-sectional nature, with subjects from a single hospital. Secondly, our data included population data from CLD patients in Japan; thus, additional studies on subjects from other parts of the world are needed to confirm and expand or adapt our results for each population. Thirdly, patients with large ascites who could suffer from a WS decline were not included in this study, therefore this possibly creates bias. Finally, due to the cross-sectional nature of our study, the causal relationship between AMs and frailty is unclear. Interpretation with caution to our study data is required. Our study results nevertheless implied that AMs and frailty in CLDs are closely correlated, especially in CC. In conclusion, CC can be helpful for predicting frailty, especially in female CLD patients.


