
A Retrospective Analysis of the Correlation between Functional Imaging and Clinical Outcomes in Grade 3 Neuroendocrine Tumors (NETs G3)

 , ,
, ,  ,
,  and
and
Abstract
1. Introduction
2. Materials and Methods
2.1. Study Design and Patient Population
2.2. Radiological Selection and Characterization
2.3. Statistical Analysis
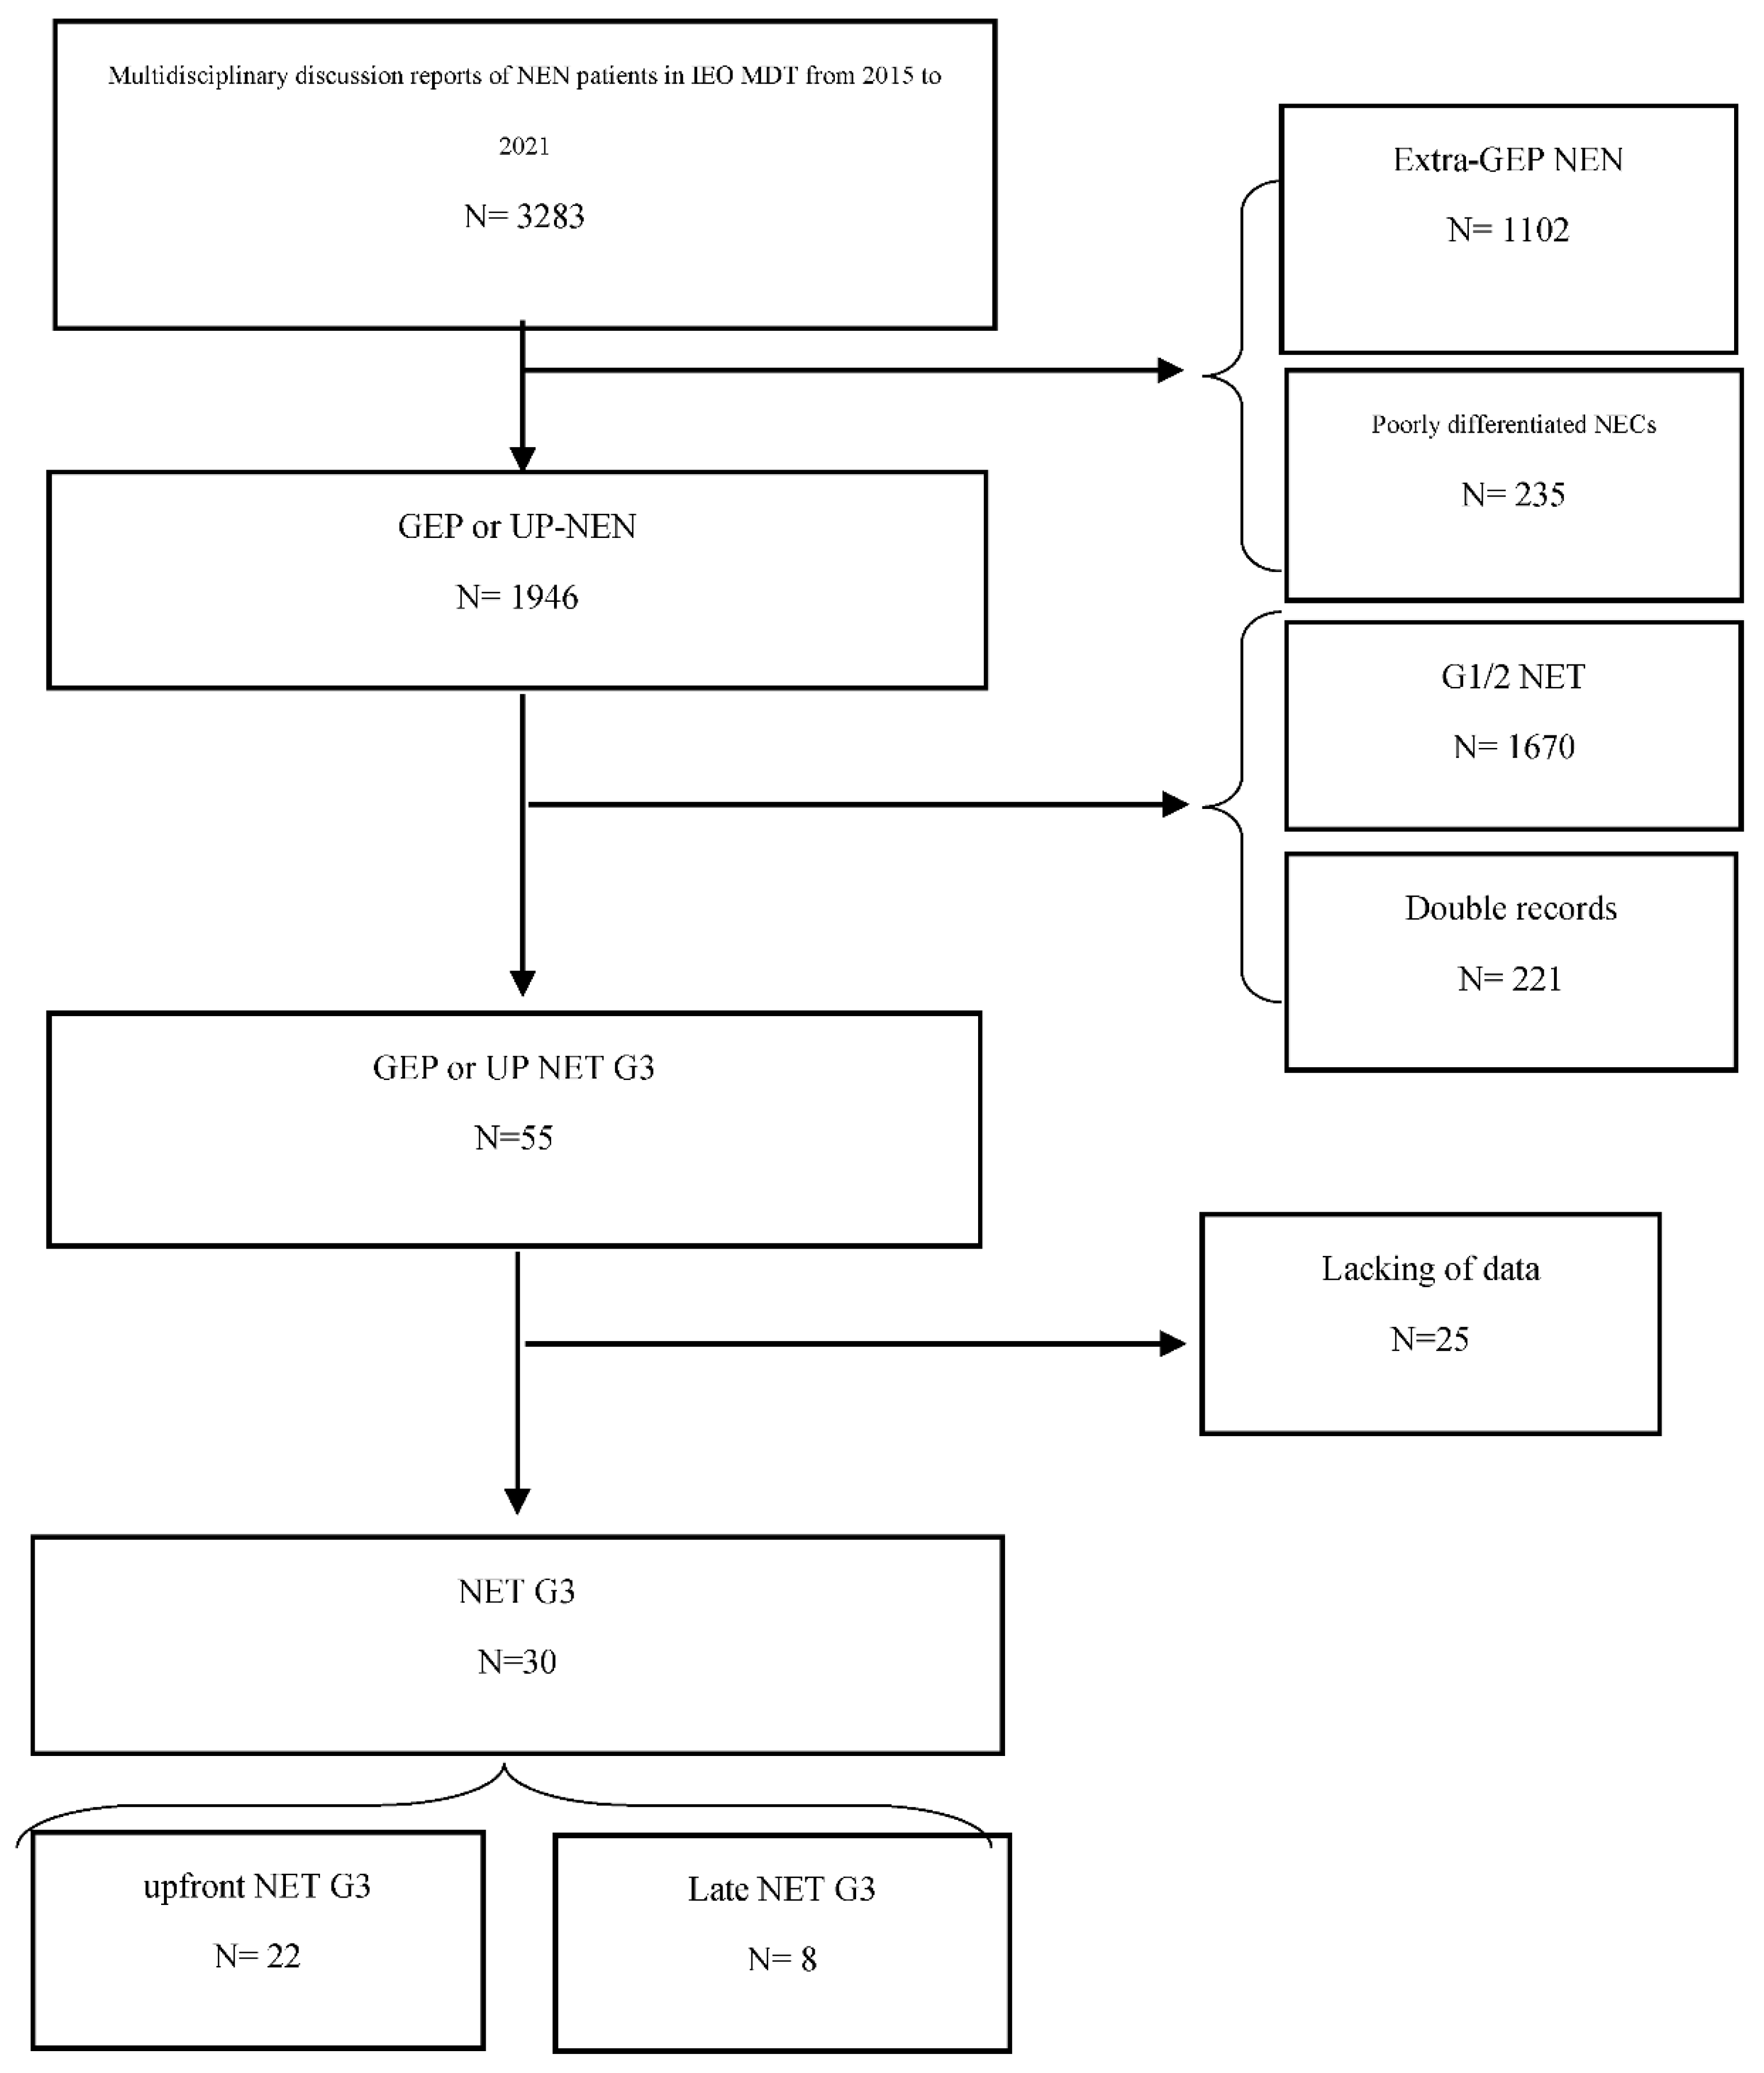
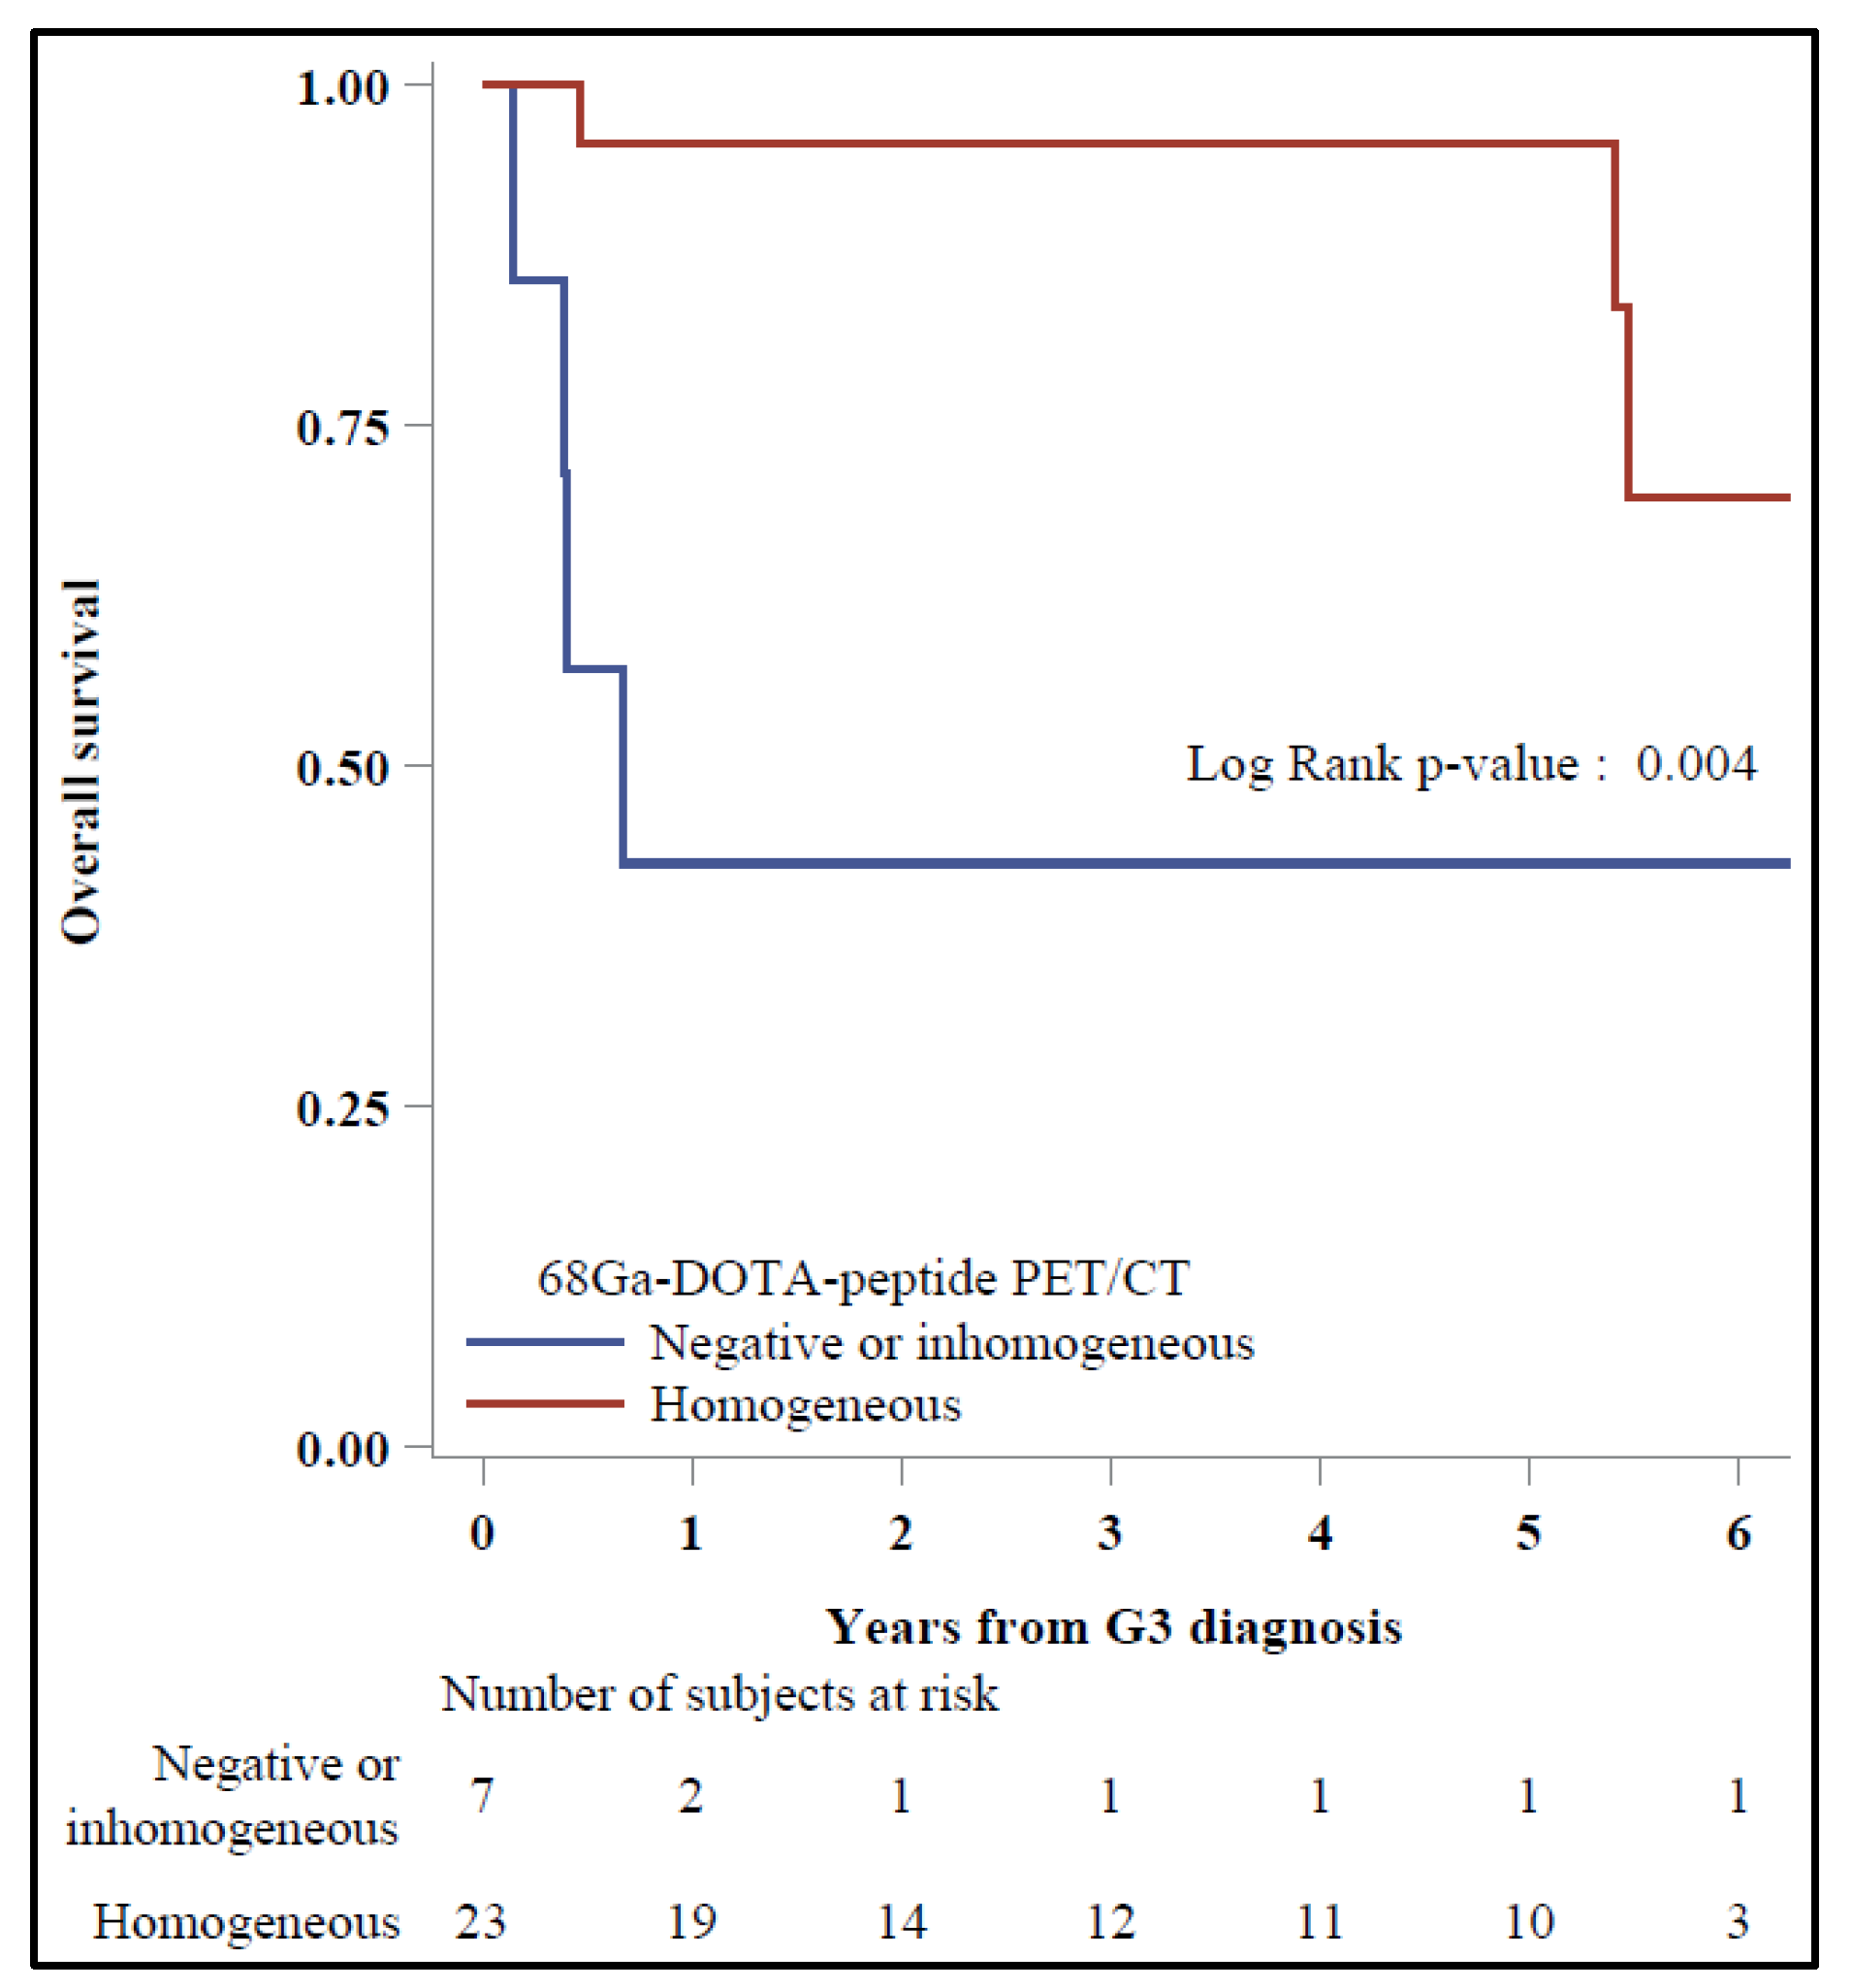
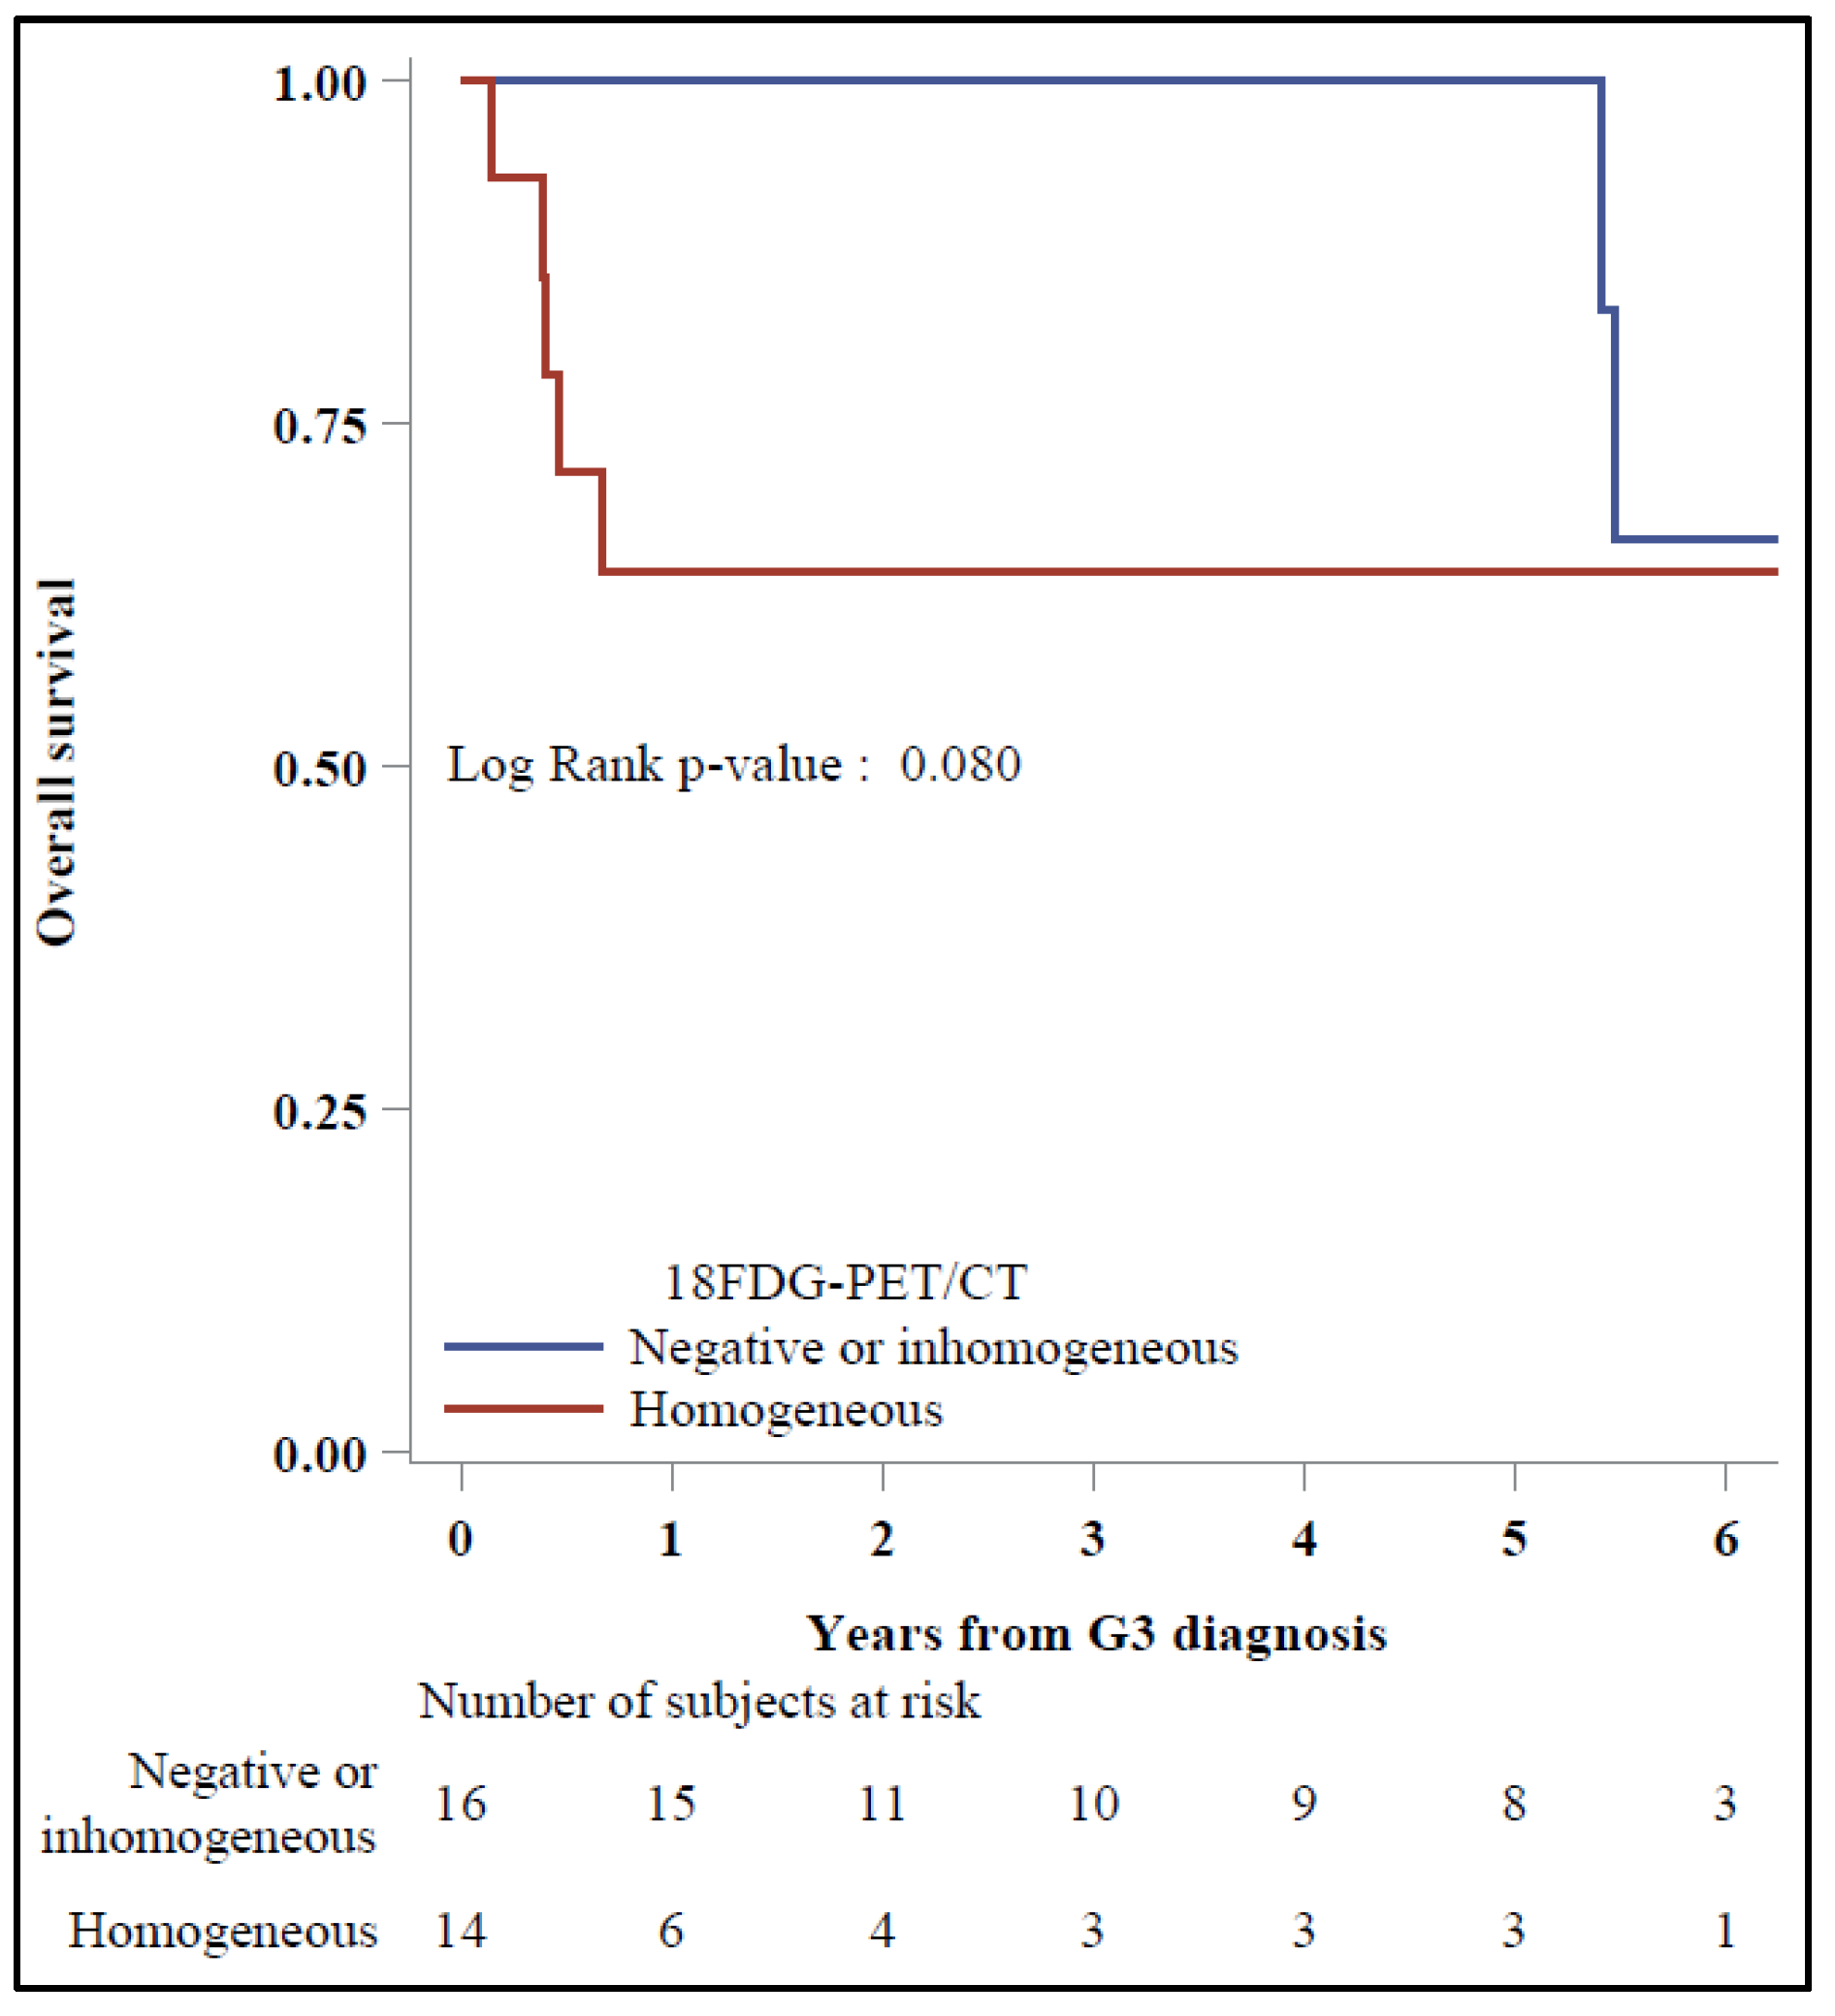
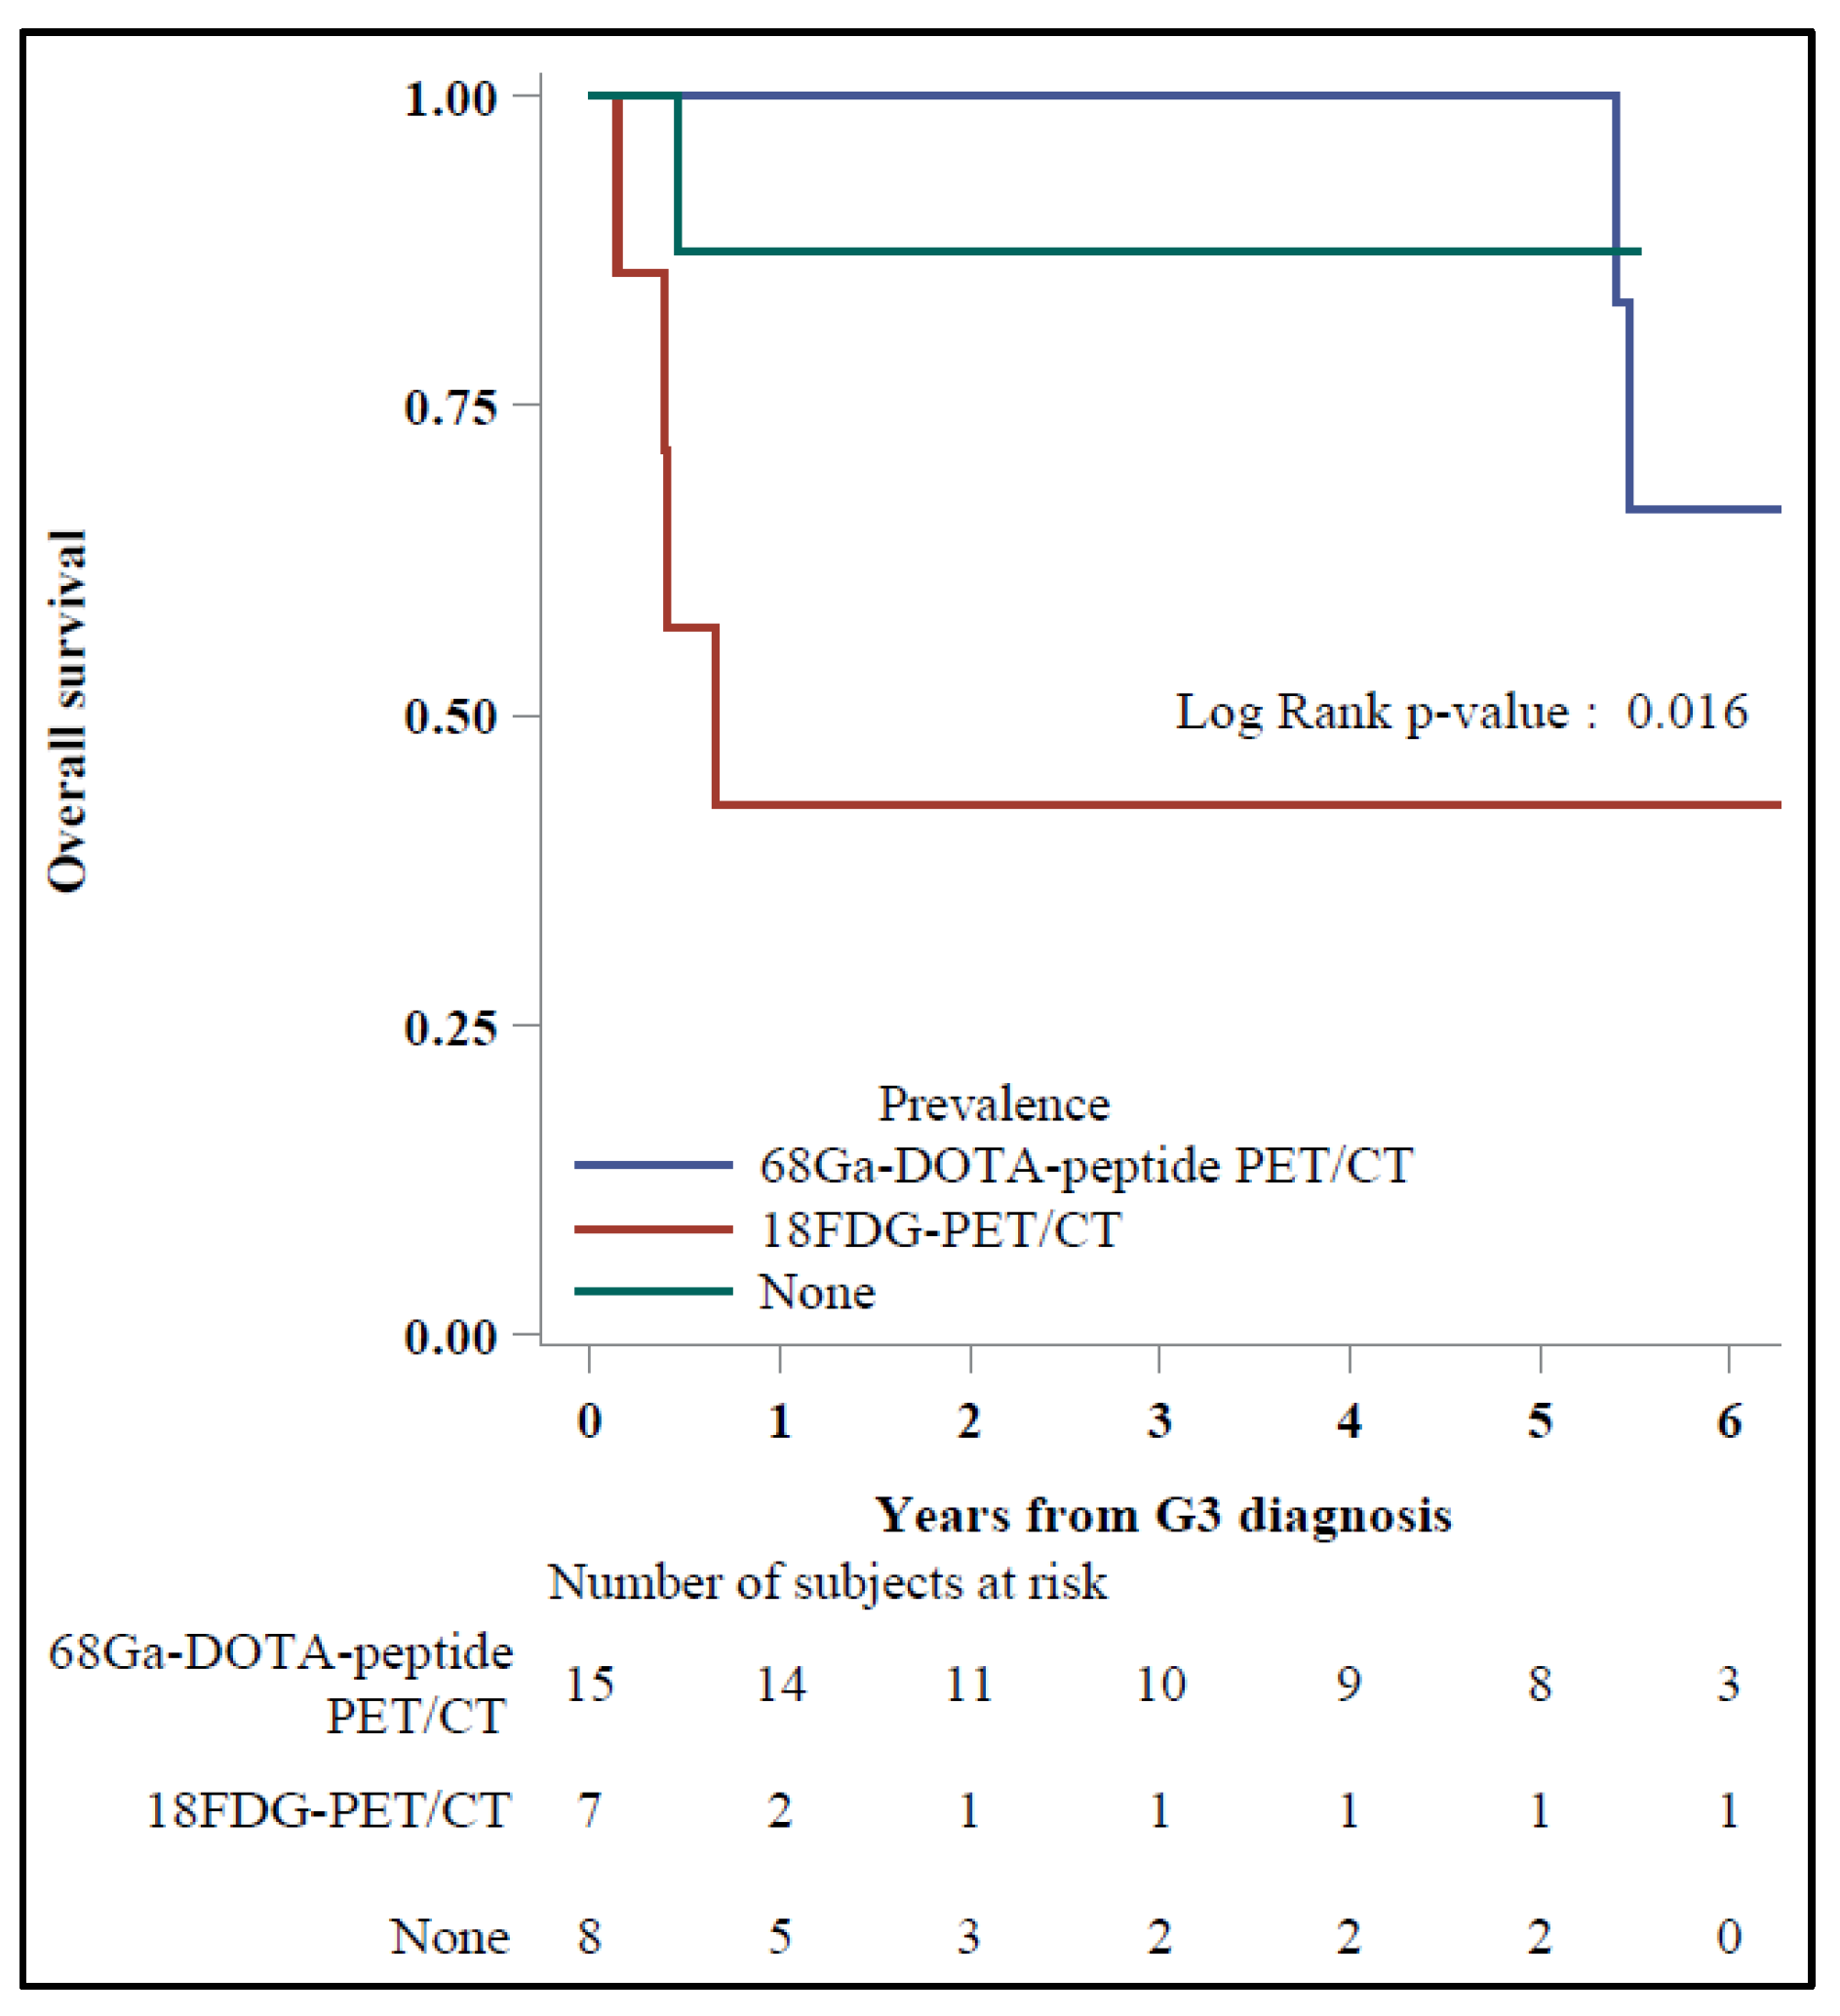
3. Results
4. Discussion
5. Conclusions
Author Contributions
Funding
Institutional Review Board Statement
Informed Consent Statement
Data Availability Statement
Acknowledgments
Conflicts of Interest
References
- Oronsky, B.; Ma, P.C.; Morgensztern, D.; Carter, C.A. Nothing But NET: A Review of Neuroendocrine Tumors and Carcinomas. Neoplasia 2017, 19, 991–1002. [Google Scholar] [CrossRef] [PubMed]
- Man, D.; Wu, J.; Shen, Z.; Zhu, X. Prognosis of patients with neuroendocrine tumor: A SEER database analysis. Cancer Manag. Res. 2018, 10, 5629–5638. [Google Scholar] [CrossRef] [PubMed]
- Lloyd, R.V.; Kloppel, G.J.R. WHO Classification of Tumours of Endocrine Organs (World Health Organization Classification of Tumors), 4th ed.; IARC Press: Lyon, France, 2017. [Google Scholar]
- Nagtegaal, I.; Klimstra, D.; Paradis, V.; Rugge, M.; Schirmacher, P.; Washington, M. Digestive System Tumours, WHO Classification of Tumours, 5th ed.; IARC Press: Lion, France, 2019. [Google Scholar]
- Pellat, A.; Coriat, R. Well Differentiated Grade 3 Neuroendocrine Tumors of the Digestive Tract: A Narrative Review. J. Clin. Med. 2020, 9, 1677. [Google Scholar] [CrossRef] [PubMed]
- Laffi, A.; Spada, F.; Bagnardi, V.; Frassoni, S.; Pisa, E.; Rubino, M.; Barberis, M.; Fazio, N. Gastroenteropancreatic grade 3 neuroendocrine tumors: A single entity or a heterogeneous group? A retrospective analysis. J. Endocrinol. Inv. 2021. [Google Scholar] [CrossRef] [PubMed]
- Krenning, E.P.; Valkema, R.; Kooij, P.P.; Breeman, W.A.; Bakker, W.H.; deHerder, W.W.; vanEijck, C.H.; Kwekkeboom, D.K.; deJong, M.; Pauwels, S. Scintigraphy and radionuclide therapy with [indium-111-labelled-diethyl triamine penta-acetic acid-D-Phe1]-octreotide. Ital. J. Gastroenterol. Hepatol. 1999, 31 (Suppl. S2), S219–S223. [Google Scholar] [PubMed]
- Meignan, M.; Gallamini, A.; Meignan, M.; Gallamini, A.; Haioun, C. Report on the First International Workshop on Interim-PET-Scan in Lymphoma. Leuk. Lymphoma 2009, 50, 1257–1260. [Google Scholar] [CrossRef] [PubMed]
- Binderup, T.; Knigge, U.; Loft, A.; Federspiel, B.; Kjaer, A. 18F-fluorodeoxyglucose positron emission tomography predicts survival of patients with neuroendocrine tumors. Clin. Cancer Res. 2010, 16, 978–985. [Google Scholar] [CrossRef] [PubMed]
- Ambrosini, V.; Campana, D.; Polverari, G.; Peterle, C.; Diodato, S.; Ricci, C.; Allegri, V.; Casadei, R.; Tomassetti, P.; Fanti, S. Prognostic Value of 68Ga-DOTANOC PET/CT SUVmax in Patients with Neuroendocrine Tumors of the Pancreas. J. Nucl. Med. 2015, 56, 1843–1848. [Google Scholar] [CrossRef] [PubMed]
- Panagiotidis, E.; Alshammari, A.; Michopoulou, S.; Skoura, E.; Naik, K.; Maragkoudakis, E.; Mohmaduvesh, M.; Al-Harbi, M.; Belda, M.; Caplin, M.E.; et al. Comparison of the Impact of 68Ga-DOTATATE and 18F-FDG PET/CT on Clinical Management in Patients with Neuroendocrine Tumors. J. Nucl. Med. 2017, 58, 91–96. [Google Scholar] [CrossRef] [PubMed]
- Carideo, L.; Prosperi, D.; Panzuto, F.; Magi, L.; Pratesi, M.S.; Rinzivillo, M.; Annibale, B.; Signore, A. Role of Combined [(68)Ga]Ga-DOTA-SST Analogues and [(18)F]FDG PET/CT in the Management of GEP-NENs: A Systematic Review. J. Clin. Med. 2019, 8, 1032. [Google Scholar] [CrossRef] [PubMed]
- Zhang, P.; Yu, J.; Li, J.; Shen, L.; Li, N.; Zhu, H.; Zhai, S.; Zhang, Y.; Yang, Z.; Lu, M. Clinical and Prognostic Value of PET/CT Imaging with Combination of (68)Ga-DOTATATE and (18)F-FDG in Gastroenteropancreatic Neuroendocrine Neoplasms. Contrast Media Mol. Imaging 2018, 2018, 2340389. [Google Scholar] [CrossRef] [PubMed]
- Chan, D.L.; Pavlakis, N.; Schembri, G.P.; Bernard, E.J.; Hsiao, E.; Hayes, A.; Barnes, T.; Diakos, C.; Khasraw, M.; Smara, J.; et al. Dual Somatostatin Receptor/FDG PET/CT Imaging in Metastatic Neuroendocrine Tumours: Proposal for a Novel Grading Scheme with Prognostic Significance. Theranostics 2017, 7, 1149–1158. [Google Scholar] [CrossRef]
- Sharma, P.; Naswa, N.; Kc, S.S.; Alvarado, L.A.; Dwivedi, A.K.; Yadav, Y.; Kumar, R.; Ammini, A.C.; Bal, C. Comparison of the prognostic values of 68Ga-DOTANOC PET/CT and 18F-FDG PET/CT in patients with well-differentiated neuroendocrine tumor. Eur. J. Nucl. Med. Mol. Imaging 2014, 41, 2194–2202. [Google Scholar] [CrossRef] [PubMed]
- Virgolini, I.; Gabriel, M.; Kroiss, A.; von Guggenberg, E.; Prommegger, R.; Warwitz, B.; Nilica, B.; Roig, I.G.; Rodrigues, M.; Uprimny, C.; et al. Current knowledge on the sensitivity of the (68)Ga-somatostatin receptor positron emission tomography and the SUVmax reference range for management of pancreatic neuroendocrine tumours. Eur. J. Nucl. Med. Mol. Imaging 2016, 43, 2072–2083. [Google Scholar] [CrossRef] [PubMed][Green Version]
- Milione, M.; Maisonneuve, P.; Spada, F.; Pellegrinelli, A.; Spaggiari, P.; Albarello, L.; Pisa, E.; Barberis, M.; Vanoli, A.; Vuzzoni, R.; et al. The Clinicopathologic Heterogeneity of Grade 3 Gastroenteropancreatic Neuroendocrine Neoplasms: Morphological Differentiation and Proliferation Identify Different Prognostic Categories. Neuroendocrinology 2017, 104, 85–93. [Google Scholar] [CrossRef] [PubMed]
- Thapa, P.; Ranade, R.; Ostwal, V.; Shrikhande, S.V.; Goel, M.; Basu, S. Performance of 177Lu-DOTATATE-based peptide receptor radionuclide therapy in metastatic gastroenteropancreatic neuroendocrine tumor: A multiparametric response evaluation correlating with primary tumor site, tumor proliferation index, and dual tracer imaging characteristics. Nucl. Med. Commun. 2016, 37, 1030–1037. [Google Scholar] [PubMed]
- Ostwal, V.; Basu, S.; Bhargava, P.; Shah, M.; Parghane, R.V.; Srinivas, S. Capecitabine-Temozolomide (CAPTEM) in advanced Grade 2 and grade 3 Neuroendocrine neoplasms (NENs)-benefits of chemotherapy in NENs with significant 18FDG uptake. Neuroendocrinology 2020. [Google Scholar] [CrossRef]
- Hamberg, L.M.; Hunter, G.J.; Alpert, N.M.; Choi, N.C.; Babich, J.W.; Fischmanh, A.J. The dose uptake ratio as an index of glucose metabolism: Useful parameter or oversimplification? J. Nucl. Med. 1994, 35, 1308–1312. [Google Scholar] [PubMed]
- Zhang, Q.; Gao, X.; Wei, G.; Qiu, C.; Qu, H.; Zhou, X. Prognostic Value of MTV, SUVmax and the T/N Ratio of PET/CT in Patients with Glioma: A Systematic Review and Meta-Analysis. J. Cancer 2019, 10, 1707–1716. [Google Scholar] [CrossRef] [PubMed]


| Variable | Level | NET G3 | p-Value | Overall (N = 30) | |
|---|---|---|---|---|---|
| Upfront (N = 22) | Late (N = 8) | ||||
| Age (y), N (%) | <50 | 7 (32) | 2 (25) | 1.00 | 9 (30) |
| 50+ | 15 (68) | 6 (75) | 21 (70) | ||
| Median (min–max) | 55 (34–70) | 56 (44–61) | 0.85 | 56 (34–70) | |
| Sex, N (%) | F | 7 (32) | 6 (75) | 0.049 | 13 (43) |
| M | 15 (68) | 2 (25) | 17 (57) | ||
| Primary site of disease, N (%) | Pancreas | 13 (59) | 7 (88) | 0.85 | 20 (67) |
| Ileum | 3 (14) | 0 (0) | 3 (10) | ||
| Rectum | 2 (9) | 0 (0) | 2 (7) | ||
| Stomach | 2 (9) | 1 (13) | 3 (10) | ||
| Unknown-primary | 2 (9) | 0 (0) | 2 (7) | ||
| Ki-67, N (%) | ≤30 | 10 (45) | 6 (75) | 0.23 | 16 (53) |
| >30 | 12 (55) | 2 (25) | 14 (47) | ||
| Median (min–max) | 33 (21–70) | 30 (23–45) | 0.34 | 30 (21–70) | |
| Functioning, N (%) | No | 18 (82) | 7 (88) | 1.00 | 25 (83) |
| Yes | 4 (18) | 1 (13) | 5 (17) | ||
| 68Ga-DOTA-TOC PET/CT, N (%) | Negative | 2 (9) | 0 (0) | 1.00 | 2 (7) |
| Positive and inhomogeneous | 4 (18) | 1 (13) | 5 (17) | ||
| Positive and homogeneous | 16 (73) | 7 (88) | 23 (77) | ||
| 18F-FDG-PET/CT, N (%) | Negative | 5 (23) | 0 (0) | 0.47 | 5 (17) |
| Positive and inhomogeneous | 7 (32) | 4 (50) | 11 (37) | ||
| Positive and homogeneous | 10 (45) | 4 (50) | 14 (47) | ||
| Concordance Ga-FDG, N (%) | <75% | 16 (73) | 5 (63) | 0.67 | 21 (70) |
| ≥75% | 6 (27) | 3 (38) | 9 (30) | ||
| Prevalence, N (%) | 68Ga-DOTA-peptide PET/CT | 11 (50) | 4 (50) | 0.76 | 15 (50) |
| 18FDG-PET/CT | 6 (27) | 1 (13) | 7 (23) | ||
| None | 5 (23) | 3 (38) | 8 (27) | ||
| T non-T, N (%) | <4 | 9 (53) | 4 (50) | 1.00 | 13 (52) |
| ≥4 | 8 (47) | 4 (50) | 12 (48) | ||
| Median (min–max) | 4.0 (1.8–8.9) | 5.4 (1.6–13.0) | 0.68 | 4.0 (1.6–13.0) | |
Publisher’s Note: MDPI stays neutral with regard to jurisdictional claims in published maps and institutional affiliations. |
© 2021 by the authors. Licensee MDPI, Basel, Switzerland. This article is an open access article distributed under the terms and conditions of the Creative Commons Attribution (CC BY) license (https://creativecommons.org/licenses/by/4.0/).
Share and Cite
Laffi, A.; Colandrea, M.; Buonsanti, G.; Frassoni, S.; Bagnardi, V.; Spada, F.; Pisa, E.; Barberis, M.; Rubino, M.; Grana, C.M.; et al. A Retrospective Analysis of the Correlation between Functional Imaging and Clinical Outcomes in Grade 3 Neuroendocrine Tumors (NETs G3). Diagnostics 2021, 11, 2401. https://doi.org/10.3390/diagnostics11122401
Laffi A, Colandrea M, Buonsanti G, Frassoni S, Bagnardi V, Spada F, Pisa E, Barberis M, Rubino M, Grana CM, et al. A Retrospective Analysis of the Correlation between Functional Imaging and Clinical Outcomes in Grade 3 Neuroendocrine Tumors (NETs G3). Diagnostics. 2021; 11(12):2401. https://doi.org/10.3390/diagnostics11122401
Chicago/Turabian StyleLaffi, Alice, Marzia Colandrea, Giuseppe Buonsanti, Samuele Frassoni, Vincenzo Bagnardi, Francesca Spada, Eleonora Pisa, Massimo Barberis, Manila Rubino, Chiara Maria Grana, and et al. 2021. "A Retrospective Analysis of the Correlation between Functional Imaging and Clinical Outcomes in Grade 3 Neuroendocrine Tumors (NETs G3)" Diagnostics 11, no. 12: 2401. https://doi.org/10.3390/diagnostics11122401
APA StyleLaffi, A., Colandrea, M., Buonsanti, G., Frassoni, S., Bagnardi, V., Spada, F., Pisa, E., Barberis, M., Rubino, M., Grana, C. M., Ceci, F., & Fazio, N. (2021). A Retrospective Analysis of the Correlation between Functional Imaging and Clinical Outcomes in Grade 3 Neuroendocrine Tumors (NETs G3). Diagnostics, 11(12), 2401. https://doi.org/10.3390/diagnostics11122401