Automated CT Lung Density Analysis of Viral Pneumonia and Healthy Lungs Using Deep Learning-Based Segmentation, Histograms and HU Thresholds
Abstract
:1. Introduction
2. Materials and Methods
2.1. Study Population
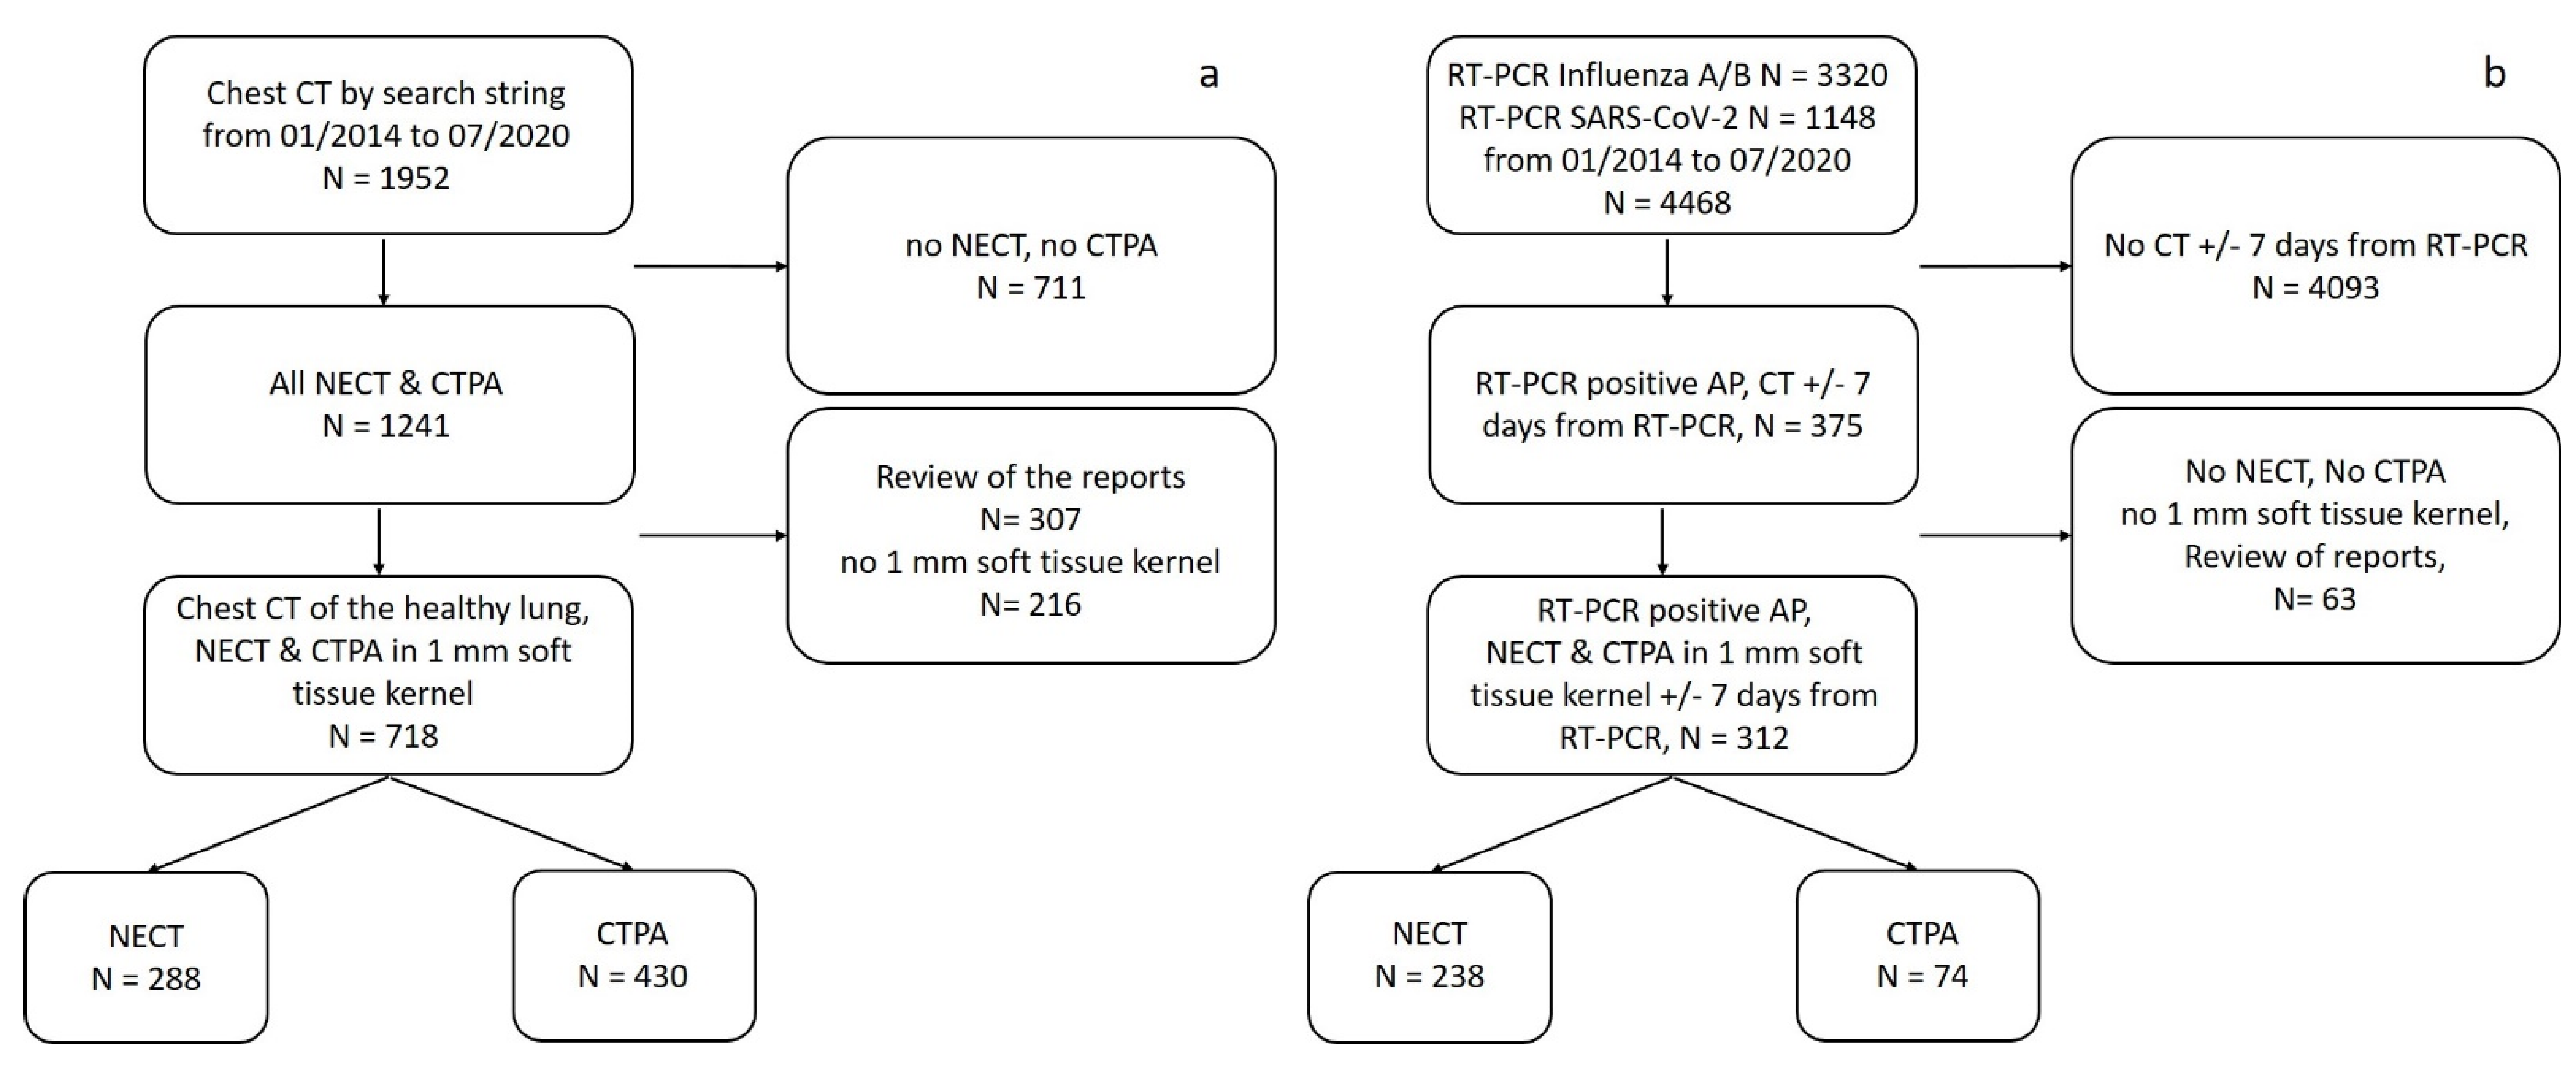
2.1.1. Healthy Lung Group
2.1.2. Atypical Pneumonia Group
2.2. CT Imaging
2.3. Lung Segmentation Algorithm
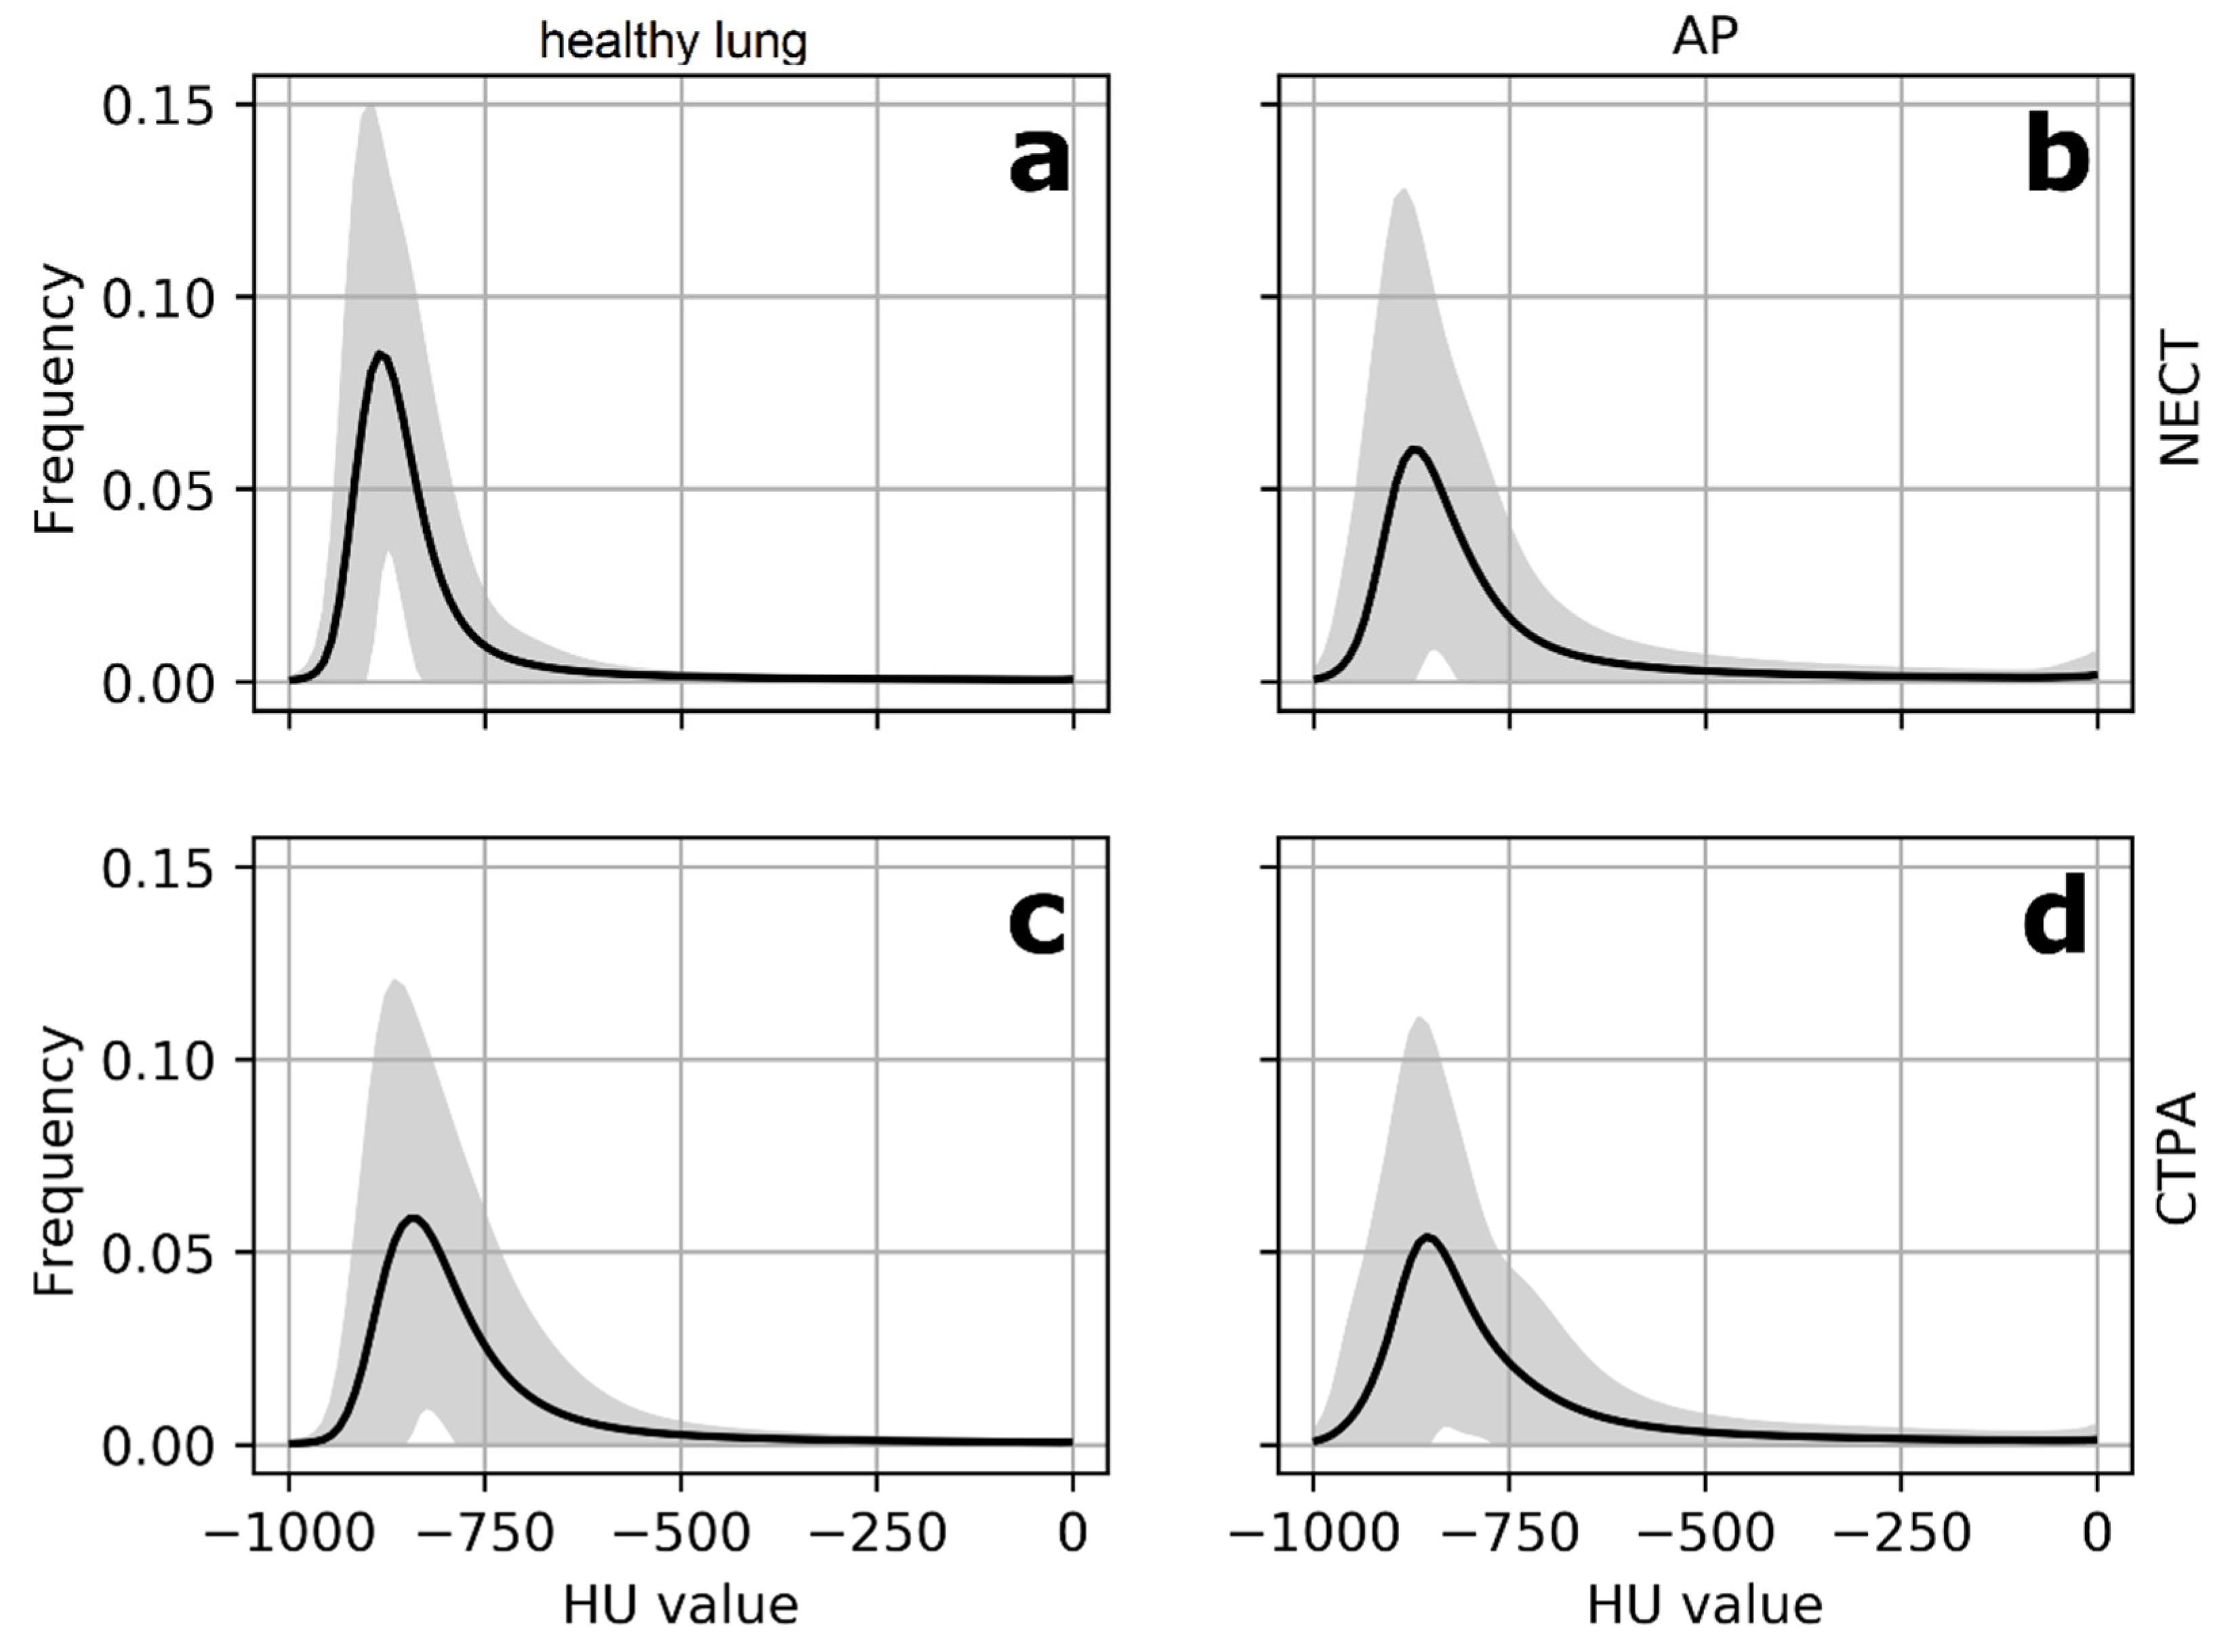
2.4. Histogram Analysis
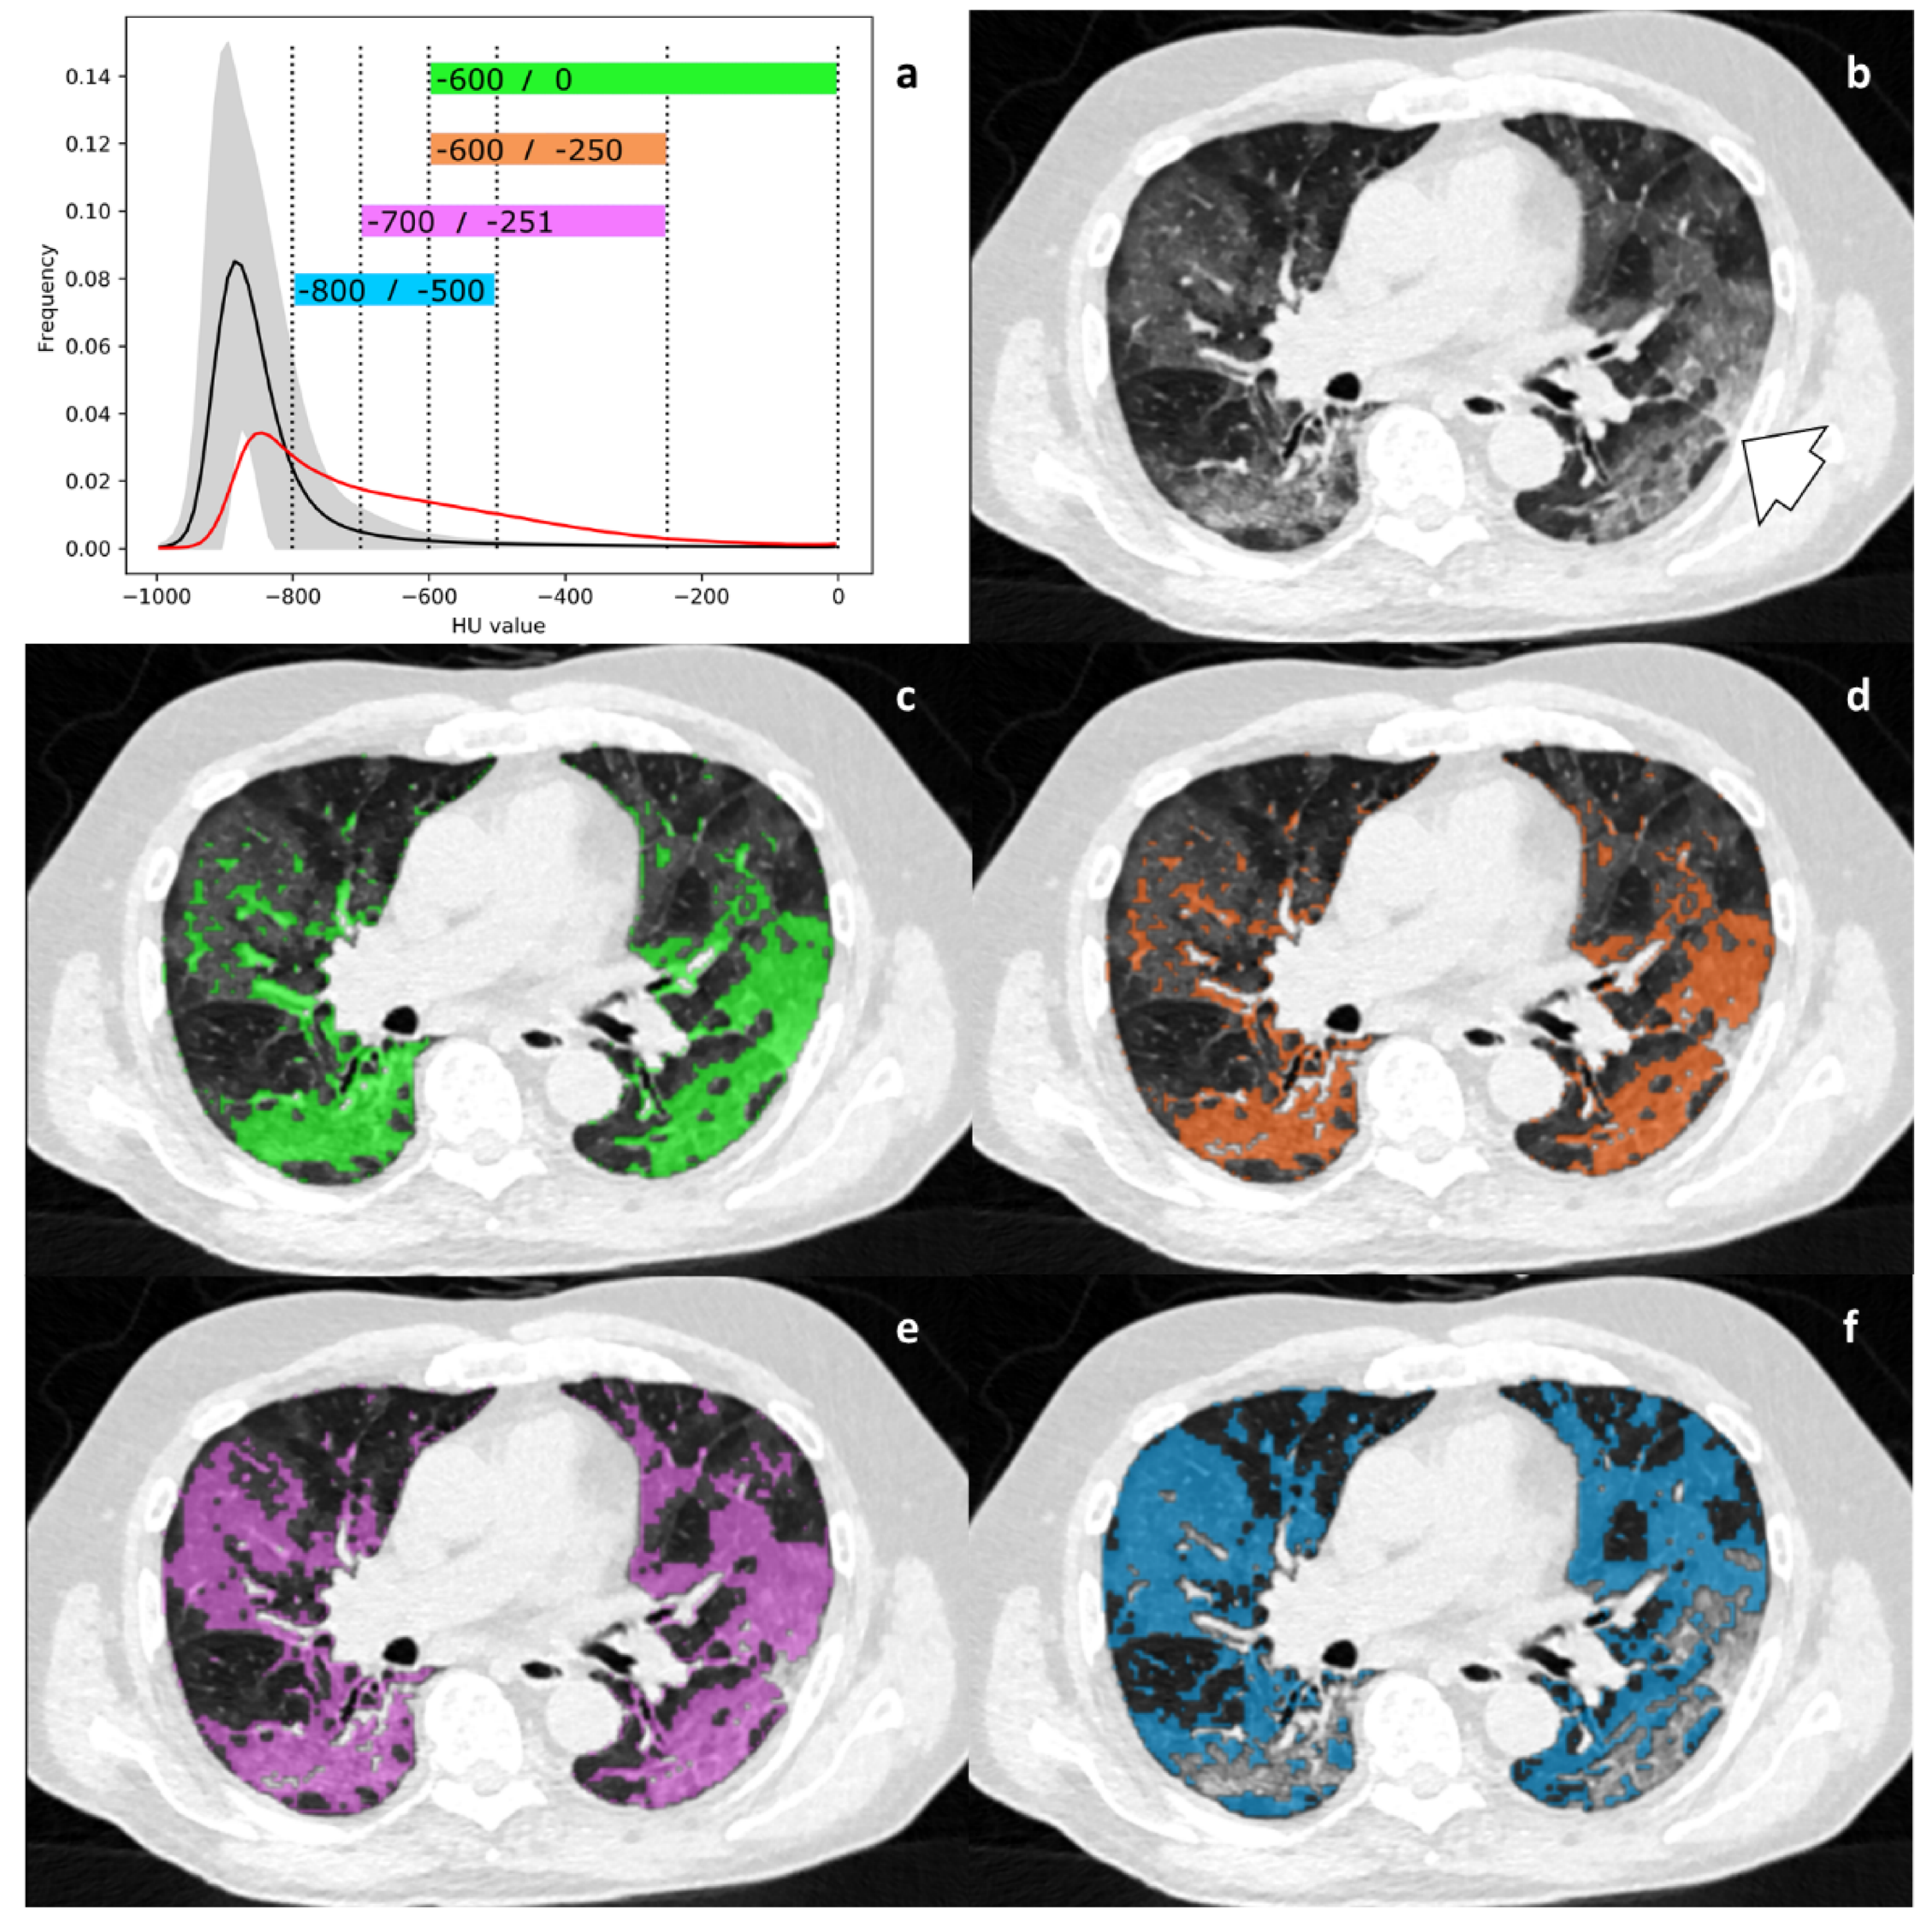
2.5. HU Threshold Analysis
2.6. Statistical Analysis
2.6.1. General Information
2.6.2. Differences in Imaging Biomarkers between Healthy Lungs and AP
2.6.3. Correlation of Imaging Biomarkers with CRP and Clinical Severity in the AP Group
3. Results
3.1. Patient Characteristics
3.2. Discrimination of Healthy Lungs andAtypical Pneumonia: NECT and CTPA
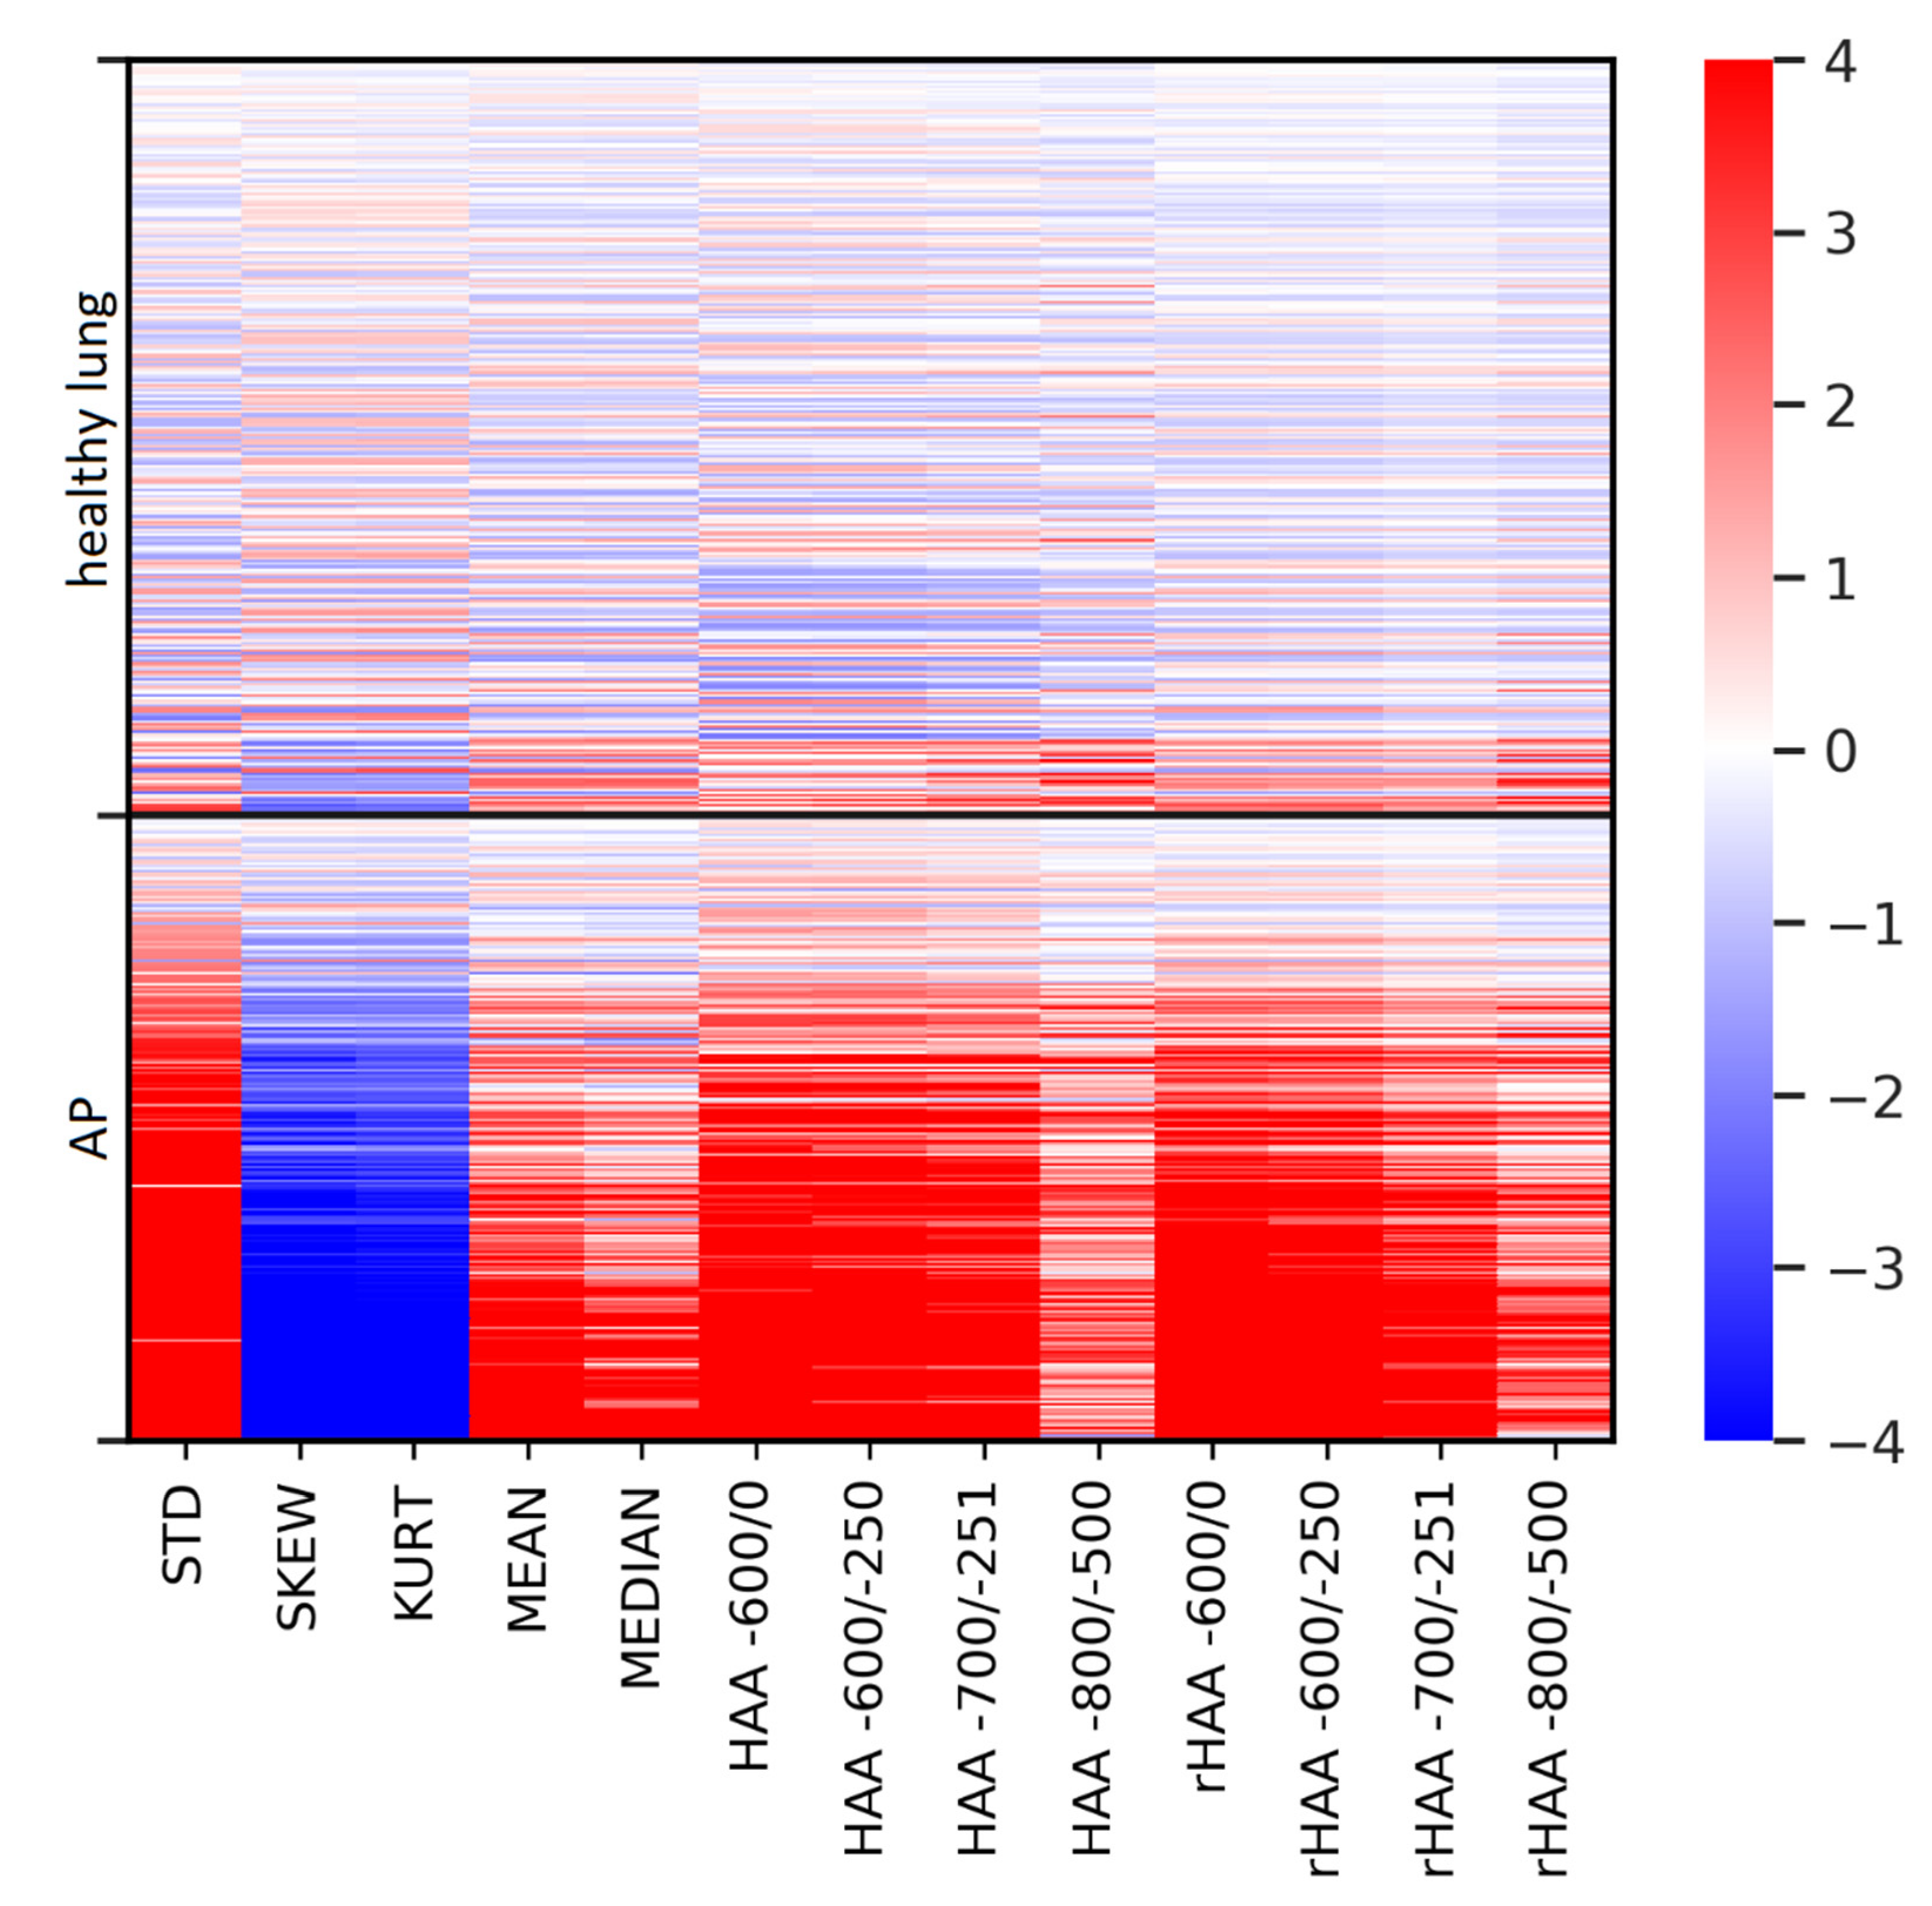
3.3. Differences in Imaging Biomarkers between Healthy Lung and AP Group
3.4. Correlation of Parameters with CRP and the Clinical Severity Scale in the AP Group
4. Discussion
5. Conclusions
Supplementary Materials
Author Contributions
Funding
Institutional Review Board Statement
Informed Consent Statement
Data Availability Statement
Acknowledgments
Conflicts of Interest
Abbreviations
| AP | Atypical Pneumonia |
| CI | Confidence Interval |
| COVID-19 | Corona Virus Disease 2019 |
| CRP | C-Reactive Protein |
| CTPA | CT Pulmonary Angiogram |
| GGO | Ground Glass Opacity |
| HAA | High Attenuation Area (absolute) |
| HU | Hounsfield Unit |
| IRB | Institutional Review Board |
| KURT | Kurtosis |
| MEAN | Mean Lung Attenuation |
| MEDIAN | Median Lung Attenuation |
| MIC | Mutual Information Classifier |
| ML | Machine Learning |
| NECT | Non-Enhanced Computed Tomography |
| PACS | Picture Archiving and Communication System |
| rHAA | High Attenuation Area (relative) |
| RT-PCR | Reverse Transcription Polymerase Chain Reaction |
| SARS-CoV-2 | Severe Acute Respiratory Syndrome Coronavirus 2 |
| SD | Standard Deviation |
| SKEW | Skewness |
| STD | Histogram Standard Deviation |
| WHO | World Health Organization |
References
- Chassagnon, G.; Vakalopoulou, M.; Paragios, N.; Revel, M.P. Artificial intelligence applications for thoracic imaging. Eur. J. Radiol. 2020, 123, 108774. [Google Scholar] [CrossRef] [PubMed] [Green Version]
- Chaganti, S.; Grenier, P.; Balachandran, A.; Chabin, G.; Cohen, S.; Flohr, T.; Georgescu, B.; Grbic, S.; Liu, S.; Mellot, F.; et al. Automated Quantification of CT Patterns Associated with COVID-19 from Chest CT. Radiol. Artif. Intell. 2020, 2, e200048. [Google Scholar] [CrossRef]
- Sun, D.; Li, X.; Guo, D.; Wu, L.; Chen, T.; Fang, Z.; Chen, L.; Zeng, W.; Yang, R. CT quantitative analysis and its relationship with clinical features for assessing the severity of patients with COVID-19. Korean J. Radiol. 2020, 21, 859–868. [Google Scholar] [CrossRef] [PubMed]
- Li, K.; Fang, Y.; Li, W.; Pan, C.; Qin, P.; Zhong, Y.; Liu, X.; Huang, M.; Liao, Y.; Li, S. CT image visual quantitative evaluation and clinical classification of coronavirus disease (COVID-19). Eur. Radiol. 2020, 30, 4407–4416. [Google Scholar] [CrossRef] [Green Version]
- Zheng, Y.; Xiao, A.; Yu, X.; Zhao, Y.; Lu, Y.; Li, X.; Mei, N.; She, D.; Wang, D.; Geng, D.; et al. Development and validation of a prognostic nomogram based on clinical and ct features for adverse outcome prediction in patients with covid-19. Korean J. Radiol. 2020, 21, 1007–1017. [Google Scholar] [CrossRef] [PubMed]
- Yin, X.; Min, X.; Nan, Y.; Feng, Z.; Li, B.; Cai, W.; Xi, X.; Wang, L. Assessment of the severity of coronavirus disease: Quantitative computed tomography parameters versus semiquantitative visual score. Korean J. Radiol. 2020, 21, 998–1006. [Google Scholar] [CrossRef]
- Park, B.; Park, J.; Lim, J.K.; Shin, K.M.; Lee, J.; Seo, H.; Lee, Y.H.; Heo, J.; Lee, W.K.; Kim, J.Y.; et al. Prognostic implication of volumetric quantitative ct analysis in patients with covid-19: A multicenter study in Daegu, Korea. Korean J. Radiol. 2020, 21, 1256–1264. [Google Scholar] [CrossRef] [PubMed]
- Hoang-Thi, T.N.; Revel, M.P.; Burgel, P.R.; Bassinet, L.; Honoré, I.; Hua-Huy, T.; Martin, C.; Maitre, B.; Chassagnon, G. Automated computed tomographic scoring of lung disease in adults with primary ciliary dyskinesia. BMC Pulm. Med. 2018, 18, 194. [Google Scholar] [CrossRef] [Green Version]
- Leonardi, A.; Scipione, R.; Alfieri, G.; Petrillo, R.; Dolciami, M.; Ciccarelli, F.; Perotti, S.; Cartocci, G.; Scala, A.; Imperiale, C.; et al. Role of computed tomography in predicting critical disease in patients with covid-19 pneumonia: A retrospective study using a semiautomatic quantitative method. Eur. J. Radiol. 2020, 130, 109202. [Google Scholar] [CrossRef] [PubMed]
- Lanza, E.; Muglia, R.; Bolengo, I.; Santonocito, O.G.; Lisi, C.; Angelotti, G.; Morandini, P.; Savevski, V.; Politi, L.S.; Balzarini, L. Quantitative chest CT analysis in COVID-19 to predict the need for oxygenation support and intubation. Eur. Radiol. 2020, 30, 6770–6778. [Google Scholar] [CrossRef] [PubMed]
- Anastasopoulos, C.; Weikert, T.; Yang, S.; Abdulkadir, A.; Schmülling, L.; Bühler, C.; Paciolla, F.; Sexauer, R.; Cyriac, J.; Nesic, I.; et al. Development and clinical implementation of tailored image analysis tools for COVID-19 in the midst of the pandemic: The synergetic effect of an open, clinically embedded software development platform and machine learning. Eur. J. Radiol. 2020, 131, 109233. [Google Scholar] [CrossRef]
- Hofmanninger, J.; Prayer, F.; Pan, J.; Röhrich, S.; Prosch, H.; Langs, G. Automatic lung segmentation in routine imaging is primarily a data diversity problem, not a methodology problem. Eur. Radiol. Exp. 2020, 4, 1–13. [Google Scholar] [CrossRef]
- Fischer, A.M.; Varga-Szemes, A.; Martin, S.S.; Sperl, J.I.; Sahbaee, P.; Neumann, D.; Gawlitza, J.; Henzler, T.; Johnson, C.M.; Nance, J.W.; et al. Artificial Intelligence-based Fully Automated Per Lobe Segmentation and Emphysema-quantification Based on Chest Computed Tomography Compared With Global Initiative for Chronic Obstructive Lung Disease Severity of Smokers. J. Thorac. Imaging 2020, 35, S28–S34. [Google Scholar] [CrossRef]
- Reiazi, R.; Abbas, E.; Famiyeh, P.; Rezaie, A.; Kwan, J.Y.Y.; Patel, T.; Bratman, S.V.; Tadic, T.; Liu, F.-F.; Haibe-Kains, B. The impact of the variation of imaging factors on the robustness of Computed Tomography Radiomic Features: A review. Biol. Med. 2020, in press. [Google Scholar] [CrossRef]
- Obert, M.; Kampschulte, M.; Limburg, R.; Barańczuk, S.; Krombach, G.A. Quantitative computed tomography applied to interstitial lung diseases. Eur. J. Radiol. 2018, 100, 99–107. [Google Scholar] [CrossRef]
- Ash, S.Y.; Harmouche, R.; Vallejo, D.L.L.; Villalba, J.A.; Ostridge, K.; Gunville, R.; Come, C.E.; Onieva Onieva, J.; Ross, J.C.; Hunninghake, G.M.; et al. Densitometric and local histogram based analysis of computed tomography images in patients with idiopathic pulmonary fibrosis. Respir. Res. 2017, 18, 45. [Google Scholar] [CrossRef] [Green Version]
- Sumikawa, H.; Johkoh, T.; Yamamoto, S.; Yanagawa, M.; Inoue, A.; Honda, O.; Yoshida, S.; Tomiyama, N.; Nakamura, H. Computed tomography values calculation and volume histogram analysis for various computed tomographic patterns of diffuse lung diseases. J. Comput. Assist. Tomogr. 2009, 33, 731–738. [Google Scholar] [CrossRef]
- Best, A.C.; Lynch, A.M.; Bozic, C.M.; Miller, D.; Grunwald, G.K.; Lynch, D.A. Quantitative CT indexes in idiopathic pulmonary fibrosis: Relationship with physiologic impairment. Radiology 2003, 228, 407–414. [Google Scholar] [CrossRef]
- Loeh, B.; Brylski, L.T.; von der Beck, D.; Seeger, W.; Krauss, E.; Bonniaud, P.; Crestani, B.; Vancheri, C.; Wells, A.U.; Markart, P.; et al. Lung CT Densitometry in Idiopathic Pulmonary Fibrosis for the Prediction of Natural Course, Severity, and Mortality. Chest 2019, 155, 972–981. [Google Scholar] [CrossRef] [PubMed]
- Lederer, D.J.; Enright, P.L.; Kawut, S.M.; Hoffman, E.A.; Hunninghake, G.; Van Beek, E.J.R.; Austin, J.H.M.; Jiang, R.; Lovasi, G.S.; Barr, R.G. Cigarette smoking is associated with subclinical parenchymal lung disease: The Multi-Ethnic Study of Atherosclerosis (MESA)-lung study. Am. J. Respir. Crit. Care Med. 2009, 180, 407–414. [Google Scholar] [CrossRef] [Green Version]
- Sumikawa, H.; Johkoh, T.; Yamamoto, S.; Oota, M.; Ueguchi, T.; Ogata, Y.; Matsumoto, M.; Fujita, Y.; Natsag, J.; Inoue, A.; et al. Volume histogram analysis for lung thin-section computed tomography: Differentiation between usual interstitial pneumonia and nonspecific interstitial pneumonia. J. Comput. Assist. Tomogr. 2007, 31, 936–942. [Google Scholar] [CrossRef]
- Yabuuchi, H.; Matsuo, Y.; Tsukamoto, H.; Horiuchi, T.; Sunami, S.; Kamitani, T.; Jinnouchi, M.; Nagao, M.; Akashi, K.; Honda, H. Evaluation of the extent of ground-glass opacity on high-resolution CT in patients with interstitial pneumonia associated with systemic sclerosis: Comparison between quantitative and qualitative analysis. Clin. Radiol. 2014, 69, 758–764. [Google Scholar] [CrossRef]
- Wang, Z.; Gu, S.; Leader, J.K.; Kundu, S.; Tedrow, J.R.; Sciurba, F.C.; Gur, D.; Siegfried, J.M.; Pu, J. Optimal threshold in CT quantification of emphysema. Eur. Radiol. 2013, 23, 975–984. [Google Scholar] [CrossRef] [Green Version]
- Sullivan, C.J.; Colin Jordan, M. Diagnosis of viral pneumonia. Semin. Respir. Infect. 1988, 3, 148–161. [Google Scholar]
- Franquet, T. Imaging of pulmonary viral pneumonia. Radiology 2011, 260, 18–39. [Google Scholar] [CrossRef]
- Koo, H.J.; Lim, S.; Choe, J.; Choi, S.H.; Sung, H.; Do, K.H. Radiographic and CT features of viral pneumonia. Radiographics 2018, 38, 719–739. [Google Scholar] [CrossRef] [Green Version]
- Bai, H.X.; Hsieh, B.; Xiong, Z.; Halsey, K.; Choi, J.W.; Tran, T.M.L.; Pan, I.; Shi, L.B.; Wang, D.C.; Mei, J.; et al. Performance of radiologists in differentiating COVID-19 from viral pneumonia on chest CT. Radiology 2020, 296, 200823. [Google Scholar] [CrossRef]
- Duzgun, S.A.; Durhan, G.; Demirkazik, F.B.; Akpinar, M.G.; Ariyurek, O.M. COVID-19 pneumonia: The great radiological mimicker. Insights Imaging 2020, 11, 118. [Google Scholar] [CrossRef] [PubMed]
- Lin, L.; Fu, G.; Chen, S.; Tao, J.; Qian, A.; Yang, Y.; Wang, M. CT Manifestations of Coronavirus Disease (COVID-19) Pneumonia and Influenza Virus Pneumonia: A Comparative Study. Am. J. Roentgenol. 2020, 216, 1–9. [Google Scholar] [CrossRef]
- Salehi, S.; Abedi, A.; Balakrishnan, S.; Gholamrezanezhad, A. Coronavirus Disease 2019 (COVID-19): A Systematic Review of Imaging Findings in 919 Patients. Am. J. Roentgenol. 2020, 215, 87–93. [Google Scholar] [CrossRef]
- Jin, Y.H.; Cai, L.; Cheng, Z.S.; Cheng, H.; Deng, T.; Fan, Y.P.; Fang, C.; Huang, D.; Huang, L.Q.; Huang, Q.; et al. A rapid advice guideline for the diagnosis and treatment of 2019 novel coronavirus (2019-nCoV) infected pneumonia (standard version). Mil. Med. Res. 2020, 7, 4. [Google Scholar] [CrossRef] [Green Version]
- Gabay, C.; Kushner, I. Acute-phase proteins and other systemic responses to inflammation. N. Engl. J. Med. 1999, 340, 448–454. [Google Scholar] [CrossRef] [PubMed]
- Wan, S.; Li, M.; Ye, Z.; Yang, C.; Cai, Q.; Duan, S.; Song, B. CT Manifestations and Clinical Characteristics of 1115 Patients with Coronavirus Disease 2019 (COVID-19): A Systematic Review and Meta-analysis. Acad. Radiol. 2020, 27, 910–921. [Google Scholar] [CrossRef] [PubMed]
- Liu, Z.; Jin, C.; Wu, C.C.; Liang, T.; Zhao, H.; Wang, Y.; Wang, Z.; Li, F.; Zhou, J.; Cai, S.; et al. Association between initial chest CT or clinical features and clinical course in patients with coronavirus disease 2019 Pneumonia. Korean J. Radiol. 2020, 21, 736–745. [Google Scholar] [CrossRef]
- Zhang, R.; Ouyang, H.; Fu, L.; Wang, S.; Han, J.; Huang, K.; Jia, M.; Song, Q.; Fu, Z. CT features of SARS-CoV-2 pneumonia according to clinical presentation: A retrospective analysis of 120 consecutive patients from Wuhan city. Eur. Radiol. 2020, 30, 4417–4426. [Google Scholar] [CrossRef] [PubMed] [Green Version]
- Liu, S.; Pan, C. Differentiating diagnosis of COVID-19 or influenza in patients based on laboratory data during flu season. EClinicalMedicine 2020, 26, 100511. [Google Scholar] [CrossRef] [PubMed]
- Qu, J.; Chang, L.K.; Tang, X.; Du, Y.; Yang, X.; Liu, X.; Han, P.; Xue, Y. Clinical characteristics of COVID-19 and its comparison with influenza pneumonia. Acta Clin. Belg. 2020, 75, 348–356. [Google Scholar] [CrossRef] [PubMed]
- Shen, C.; Tan, M.; Song, X.; Zhang, G.; Liang, J.; Yu, H.; Wang, C. Comparative Analysis of Early-Stage Clinical Features Between COVID-19 and Influenza A H1N1 Virus Pneumonia. Front. Public Health. 2020, 8, 206. [Google Scholar] [CrossRef]
- Zhao, W.; Zhong, Z.; Xie, X.; Yu, Q.; Liu, J. Relation Between Chest CT Findings and Clinical Conditions of Coronavirus Disease (COVID-19) Pneumonia: A Multicenter Study. Am. J. Roentgenol. 2020, 214, 1072–1077. [Google Scholar] [CrossRef] [PubMed]
- Newell, J.D.; Tschirren, J.; Peterson, S.; Beinlich, M.; Sieren, J. Quantitative CT of Interstitial Lung Disease. Semin. Roentgenol. 2019, 54, 73–79. [Google Scholar] [CrossRef] [PubMed]
- Armstrong, S.M.; Darwish, I.; Lee, W.L. Endothelial activation and dysfunction in the pathogenesis of influenza A virus infection. Virulence 2013, 4, 537. [Google Scholar] [CrossRef] [PubMed] [Green Version]
- Cattaneo, M.; Bertinato, E.M.; Birocchi, S.; Brizio, C.; Malavolta, D.; Manzoni, M.; Muscarella, G.; Orlandi, M. Pulmonary embolism or pulmonary thrombosis in COVID-19? Is the recommendation to use high-dose heparin for thromboprophylaxis justified? Thromb. Haemost. 2020, 120, 1230–1232. [Google Scholar] [CrossRef]
- Grillet, F.; Behr, J.; Calame, P.; Aubry, S.; Delabrousse, E. Acute Pulmonary Embolism Associated with COVID-19 Pneumonia Detected with Pulmonary CT Angiography. Radiology 2020, 296, E186–E188. [Google Scholar] [CrossRef] [PubMed] [Green Version]
- World Health Organization WHO R&D Blueprint. Novel Coronavirus COVID-19 Therapeutic Trial Synopsis; World Health Organization: Geneva, Switzerland, 2020; pp. 1–9. [Google Scholar]
- Virtanen, P.; Gommers, R.; Oliphant, T.E.; Haberland, M.; Reddy, T.; Cournapeau, D.; Burovski, E.; Peterson, P.; Weckesser, W.; Bright, J.; et al. SciPy 1.0: Fundamental algorithms for scientific computing in Python. Nat. Methods 2020, 17, 261–272. [Google Scholar] [CrossRef] [PubMed] [Green Version]
- Gattinoni, L.; Caironi, P.; Pelosi, P.; Goodman, L.R. What has computed tomography taught us about the acute respiratory distress syndrome? Am. J. Respir. Crit. Care Med. 2001, 164, 1701–1711. [Google Scholar] [CrossRef] [Green Version]
- Li, M.; Lei, P.; Zeng, B.; Li, Z.; Yu, P.; Fan, B.; Wang, C.; Li, Z.; Zhou, J.; Hu, S.; et al. Coronavirus Disease (COVID-19): Spectrum of CT Findings and Temporal Progression of the Disease. Acad. Radiol. 2020, 27, 603–608. [Google Scholar] [CrossRef] [Green Version]
- McKinney, W. Data Structures for Statistical Computing in Python. In Proceedings of the 9th Python in Science Conference, Austin, TX, USA, 28 June–3 July 2010; pp. 56–61. [Google Scholar]
- Pedregosa, F. Scikit-learn: Machine learning in python. J. Mach. Learn. Res. 2011, 12, 2825–2830. [Google Scholar]
- Hunter, J.D. Matplotlib: A 2D graphics environment. Comput. Sci. Eng. 2007, 9, 90–95. [Google Scholar] [CrossRef]
- Qalieh, M.W.; Botvinnik, O.; O’Kane, D.; Paul, H.; Lukauskas, S.; Gemperline, D.C.; Augspurger, T.; Halchenko, Y.; Cole, J.B.; Warmenhoven, J.; et al. mwaskom/seaborn: v0.8.1 (September 2017). Zenodo 2017. Available online: https://zenodo.org/record/883859#.XwOHPyhKg2w. (accessed on 11 November 2020).
- Wolf, I.; Vetter, M.; Wegner, I.; Böttger, T.; Nolden, M.; Schöbinger, M.; Hastenteufel, M.; Kunert, T.; Meinzer, H.P. The medical imaging interaction toolkit. Med. Image Anal. 2005, 9, 594–604. [Google Scholar] [CrossRef]
- Kraskov, A.; Stögbauer, H.; Grassberger, P. Estimating mutual information. Phys. Rev. E 2004, 69, 16. [Google Scholar] [CrossRef] [Green Version]
- Ross, B.C. Mutual information between discrete and continuous data sets. PLoS ONE 2014, 9, e87357. [Google Scholar] [CrossRef]
- Mascalchi, M.; Camiciottoli, G.; Diciotti, S. Lung densitometry: Why, how and when. J. Thorac. Dis. 2017, 9, 3319–3345. [Google Scholar] [CrossRef] [PubMed] [Green Version]
- Colombi, D.; Bodini, F.C.; Petrini, M.; Maffi, G.; Morelli, N.; Milanese, G.; Silva, M.; Sverzellati, N.; Michieletti, E. Well-aerated Lung on Admitting Chest CT to Predict Adverse Outcome in COVID-19 Pneumonia. Radiology 2020, 296, E86–E96. [Google Scholar] [CrossRef] [PubMed] [Green Version]


| Total | NECT | CTPA | |||||
|---|---|---|---|---|---|---|---|
| Healthy Lung | AP | p | Healthy Lung | AP | p | ||
| n | 1030 | 288 | 238 | 430 | 74 | ||
| Sex [F/M, F%] | 524/506, 50.9% | 117/171, 40.6% | 84/154, 35.3% | 0.245 | 283/147, 65.8% | 40/34, 54.1% | 0.069 |
| Age [years/SD] | 54.2/18.9 | 50.2/17.0 | 60.1/17.2 | <0.001 | 51.6/19.9 | 66.0/16.0 | <0.001 |
| NECT | CTPA | |||||||||
|---|---|---|---|---|---|---|---|---|---|---|
| Healthy Lung | AP | p | Healthy Lung | AP | p | |||||
| Mean | SD | Mean | SD | Mean | SD | Mean | SD | |||
| STD | 128.50 | 6.51 | 170.16 | 39.09 | <0.001 | 134.43 | 10.39 | 160.90 | 32.23 | <0.001 |
| SKEW | 3.50 | 0.35 | 2.36 | 0.90 | <0.001 | 2.85 | 0.50 | 2.33 | 0.70 | <0.001 |
| KURT | 14.29 | 2.83 | 6.70 | 4.93 | <0.001 | 9.76 | 3.26 | 6.45 | 3.76 | <0.001 |
| MEAN | −828.00 | 28.54 | −751.69 | 89.79 | <0.001 | −770.49 | 48.99 | −750.68 | 76.14 | 0.185 |
| MEDIAN | −863.64 | 27.00 | −807.24 | 91.90 | <0.001 | −808.73 | 47.77 | −801.84 | 67.74 | 0.842 |
| Lung Volume | 4973.00 | 1212.19 | 4302.19 | 1363.27 | <0.001 | 4238.08 | 1185.40 | 4390.15 | 1322.73 | 0.400 |
| HAA −600/0 | 266.37 | 49.43 | 574.18 | 468.63 | <0.001 | 349.82 | 101.22 | 547.60 | 318.80 | <0.001 |
| HAA −600/−250 | 197.94 | 38.06 | 401.22 | 236.25 | <0.001 | 278.10 | 89.04 | 416.63 | 231.34 | <0.001 |
| HAA −700/−251 | 347.83 | 79.54 | 674.60 | 336.70 | <0.001 | 572.42 | 250.36 | 753.26 | 368.96 | <0.001 |
| HAA −800/−500 | 721.20 | 302.14 | 1148.24 | 473.73 | <0.001 | 1457.43 | 601.75 | 1412.97 | 539.84 | 0.655 |
| rHAA −600/0 | 5.57 | 1.48 | 9.12 | 4.78 | <0.001 | 15.01 | 11.93 | 14.03 | 10.03 | <0.001 |
| rHAA −600/−250 | 4.15 | 1.22 | 7.31 | 4.22 | <0.001 | 10.63 | 7.74 | 10.66 | 7.33 | <0.001 |
| rHAA −700/−251 | 7.39 | 3.29 | 15.48 | 11.04 | <0.001 | 17.95 | 11.92 | 19.60 | 13.53 | 0.002 |
| rHAA −800/−500 | 15.74 | 9.42 | 38.57 | 21.18 | <0.001 | 30.16 | 16.50 | 35.70 | 18.30 | 0.465 |
| Parameter | MIC |
|---|---|
| STD | 0.374 |
| rHAA −600/0 | 0.346 |
| HAA −600/−250 | 0.325 |
| SKEW | 0.311 |
| HAA −600/0 | 0.307 |
| KURT | 0.307 |
| rHAA −600/−250 | 0.295 |
| HAA −700/−251 | 0.272 |
| rHAA −700/−251 | 0.257 |
| MEAN | 0.195 |
| MEDIAN | 0.168 |
| rHAA −800/−500 | 0.163 |
| HAA −800/−500 | 0.155 |
| Lung volume | 0.059 |
Publisher’s Note: MDPI stays neutral with regard to jurisdictional claims in published maps and institutional affiliations. |
© 2021 by the authors. Licensee MDPI, Basel, Switzerland. This article is an open access article distributed under the terms and conditions of the Creative Commons Attribution (CC BY) license (https://creativecommons.org/licenses/by/4.0/).
Share and Cite
Romanov, A.; Bach, M.; Yang, S.; Franzeck, F.C.; Sommer, G.; Anastasopoulos, C.; Bremerich, J.; Stieltjes, B.; Weikert, T.; Sauter, A.W. Automated CT Lung Density Analysis of Viral Pneumonia and Healthy Lungs Using Deep Learning-Based Segmentation, Histograms and HU Thresholds. Diagnostics 2021, 11, 738. https://doi.org/10.3390/diagnostics11050738
Romanov A, Bach M, Yang S, Franzeck FC, Sommer G, Anastasopoulos C, Bremerich J, Stieltjes B, Weikert T, Sauter AW. Automated CT Lung Density Analysis of Viral Pneumonia and Healthy Lungs Using Deep Learning-Based Segmentation, Histograms and HU Thresholds. Diagnostics. 2021; 11(5):738. https://doi.org/10.3390/diagnostics11050738
Chicago/Turabian StyleRomanov, Andrej, Michael Bach, Shan Yang, Fabian C. Franzeck, Gregor Sommer, Constantin Anastasopoulos, Jens Bremerich, Bram Stieltjes, Thomas Weikert, and Alexander Walter Sauter. 2021. "Automated CT Lung Density Analysis of Viral Pneumonia and Healthy Lungs Using Deep Learning-Based Segmentation, Histograms and HU Thresholds" Diagnostics 11, no. 5: 738. https://doi.org/10.3390/diagnostics11050738
APA StyleRomanov, A., Bach, M., Yang, S., Franzeck, F. C., Sommer, G., Anastasopoulos, C., Bremerich, J., Stieltjes, B., Weikert, T., & Sauter, A. W. (2021). Automated CT Lung Density Analysis of Viral Pneumonia and Healthy Lungs Using Deep Learning-Based Segmentation, Histograms and HU Thresholds. Diagnostics, 11(5), 738. https://doi.org/10.3390/diagnostics11050738


