1. Introduction
Bacteria from
Mycoplasma,
Acholeplasma, and
Ureaplasma genera are common contaminants of cell cultures, including the most frequently appearing:
M. arginini,
M. hyorhinis,
M. orale,
M. salivarium,
M. fermentans,
M. hominis,
A. laidlawii, as well as others occasionally found in cell cultures:
U. urealyticum,
M. pneumoniae, and
M. pirum [
1,
2,
3]. Several possible causes of these contamination in cell cultures have been previously described, such as bacterial residues in primary cultures, culture media, fetal bovine serum, or no use of aseptic principles by laboratory staff. Cross-contaminations between infected cultures can happen during running multiple cell cultures simultaneously or using contaminated laboratory equipment such as pipettes, laminar flow cabinets, and CO
2 incubators [
4,
5,
6].
The majority of
Mycoplasma,
Acholeplasma, and
Ureaplasma sp. are a part of normal human or animal bacterial microflora; however, some of these bacterial species sometimes are responsible for developing acute or chronic infections with an opportunistic character [
7,
8,
9]. The
Mycoplasma and
Ureaplasma genera from the
Mycoplasmatales order and the
Acholeplasma genus from the
Acholeplasmatales order represent the
Mollicutes class [
10]. These bacteria differ from the other bacterial microorganisms by the cell wall absence and the reduced genome size. The smallest genome size that was found in
M. genitalium with 577–590 kilobase pairs (kb) [
11,
12] in contrast to
Escherichia coli genomes ranging between 4.5 and 5.5 megabase pair (Mbp) [
13]. The size of these bacteria cells (0.15–0.3 µm) do not allow to detect it by indirect microscopic observation. Therefore fluorescent DNA staining with 4′,6-diamidino-2-phenylindole (DAPI), or Hoechst dyes are usually used. DAPI staining enables a quick but unspecific detection using a fluorescent microscope with an excitation wavelength of approximately 355 ± 5 nm and an emission wavelength of 455 ± 5 nm [
14].
Mollicutes contamination is observed then in a microscope as shining points localized in the cytoplasm or at the cell’s edge [
7].
Apart from the methods mentioned above, several other types of methods were applied in detection of these bacteria, including microbial cultures using selective broth or agar media, and also nucleic acid hybridization with a probe specific for the evaluation of mycoplasma’s rRNA [
4], immunofluorescence assays with particular monoclonal antibody dyes for the first step of
Mycoplasma,
Ureaplasma, and
Acholeplasma species identification [
15], enzyme-linked immunosorbent assay (ELISA) for the detection of
Mycoplasma species-specific antigen [
16] or PCR base techniques for detection of species or genus specific nucleic acid fragments [
6,
7,
17].
Currently, PCR is the most popular and accessible molecular biology technique. Since 1985 [
18], it has been developed to displace other techniques in diagnostics of different diseases. Now the use of PCR for detection and identification of
Mycoplasma,
Acholeplasma, and
Ureaplasma sp. in cell cultures or in other clinical samples is considered as more valuable than the use of microbial growth cultures. It is related primarily with higher percentage of detection and discriminatory power [
17,
19], significantly shorter time of obtained results [
8], and lower costs in contrast to microbial culture methods. A quantitative PCR-based method which employ primers detecting DNA sequences from
U. parvum and
U. urealyticum (
gap gene) and from
M. genitalium and
U. hominis (
ureC gene) has recently been reported in a study conducted on clinical samples, including tissue (chorionic villi) and blood samples from pregnant females [
20]. Additionally a highly sensitive multiplexed qPCR configured with digital microfluidic platform for the detection of DNA
M. pneumoniae and other microorganisms in discrete droplet format designated for liquid samples has also been reported [
21]. Among PCR technique types applied for
Mycoplasma,
Acholeplasma and
Ureaplasma detection in cell cultures, a real-time PCR was shown as superior with the sensitivity, specificity, accuracy, predictive value of positive and negative results [
17].
Nowadays, loop-mediated isothermal amplification (LAMP) assay is a novel DNA amplification technique that uses 4–6 primers to recognize specific regions on the target DNA. It is possible to detect a few up to 10
9 copies of target region DNA in less than an hour. Although the first it was described in 2000 by Notomi et al. [
22] an application of this assay for detection of
Mycoplasma sp. contamination in cell cultures was described by Soheily et al. a few years ago [
23]. The developed LAMP assay detected some
Mycoplasma species and differed from other PCR assays by isothermal conditions of reaction and possible other type of detection with naked eye inspection or in the Loopamp real-time turbidimeter.
Development of reliable PCR methods is especially needed for microbial quality control of cell cultures as well as for contamination evaluation of other types of biological samples caused by difficult microorganisms. That methods can be also a part of infection diagnostics after additional validation.
Our study aimed to develop a sensitive and specific assay for routine detection and identification of Mycoplasma, Acholeplasma, and Ureaplasma selected species during a part of microbial quality control of mammalian cell cultures according to pharmacopeial requirements.
2. Materials and Methods
2.1. Cell Lines Cultivation and Positive Controls
We examined in this study eighty one samples of seventeenth different cell lines deposited in the National Medicines Institute for
Mycoplasma,
Acholeplasma, and
Ureaplasma contamination using Test-1 and Test-2. Following cell lines were included, as: human epithelial cells from cancer lung (A549,
n = 1), human epithelial cells (WISH,
n = 3), human cervical carcinoma (KBV,
n = 4), human osteosarcoma cells (MG63,
n = 9), mouse fibroblasts (L929,
n = 19), human epithelial adenocarcinoma cells (HeLa,
n = 14), human melanoma cells (ME18,
n = 2; MER,
n = 2), human B lymphoid cells (GM13509,
n = 7; GM1446,
n = 6), human promyelocytic leukemia cells (HL-60,
n = 4), normal human osteoblasts (hFOB 1.19,
n = 3), breast cancer cell line (MCF-7,
n = 1), human fibroblasts (GM21756,
n = 1; BJ,
n = 2), mouse T lymphocytes (TK-1,
n = 2), and bovine kidney cells (MDBK,
n = 1). ME18 and MER cells, that were acquired from the National Medicines Institute archival collection [
24]. HeLa, L929, hFOB 1.19, HL-60, TK-1, WISH, A549, MDBK, and MCF-7 were purchased from the ATCC collection (USA), MG63 from the EACACC collection (UK), KBV1 from the DSMZ collection (Germany), GM03651, GM21756, GM1446; GM13509 from the Coriell Institute collection (USA). All adherent cells cultured in growth medium composed of Eagle’s Minimum Essential Medium (EMEM) supplemented with 10% FBS and 1% antibiotics solution (penicillin, streptomycin, amphotericin B). B-lymphoid cells cultured in RPMI medium, 15% fetal bovine serum (FBS), and 1% antibiotics solution. Cell culture media and supplements were purchased from Lonza (Walkersville, MD, USA). Growth conditions included 37 °C and a humidified atmosphere of air containing 5% CO
2.
As positive controls, we used in this study genomic DNA (gDNA) standards of aimed species at concentration of 0.05 ng per reaction. All DNA templates we purchased from Minerva Biolabs GmbH (Germany) (
Table S1). The other DNA templates were derived from standard strains purchased from the National Collection of Type Cultures (NCTC) and the Culture Collection of Public Health England (
Table S1). The initial concentration of all gDNA standards was 0.1 ng/µL. All templates were suspended in 10 mM Tris buffer, pH 8.4 at a concentration of 0.1 ng/mL, and stored at −20 °C. A certificate of analysis confirmed the quantity of each DNA samples.
2.2. Primer Design, In Silico Specificity Determination
We performed the first search for a specific DNA region occurring only in selected species according to this study’s aim using BioEdit software [
25]. The analysis included 16S-23S Internal Transcribed Spacer (ITS) region,
16S rRNA,
23S rRNA, and other genes across mentioned above
Mycoplasma,
Acholeplasma, and
Ureaplasma species to select DNA fragment typical for all selected species of interest (
Table S2). Three different specific DNA fragments were chosen, and three primer pairs, including M1, M2, M3 forward (Fw), and reverse (Rv) were designed for genetic in silico identification using Beacon Designer software (BDS) (Premier Biosoft Int., v. 7.91), according to the general primer requirements [
26,
27]. For amplicon sequences analysis in silico, the primary local alignment search tool (BLAST) from the browser (
http://www.ncbi.nlm.nih.gov/BLAST/ (accessed on 12 May 2021) was used. We compared the target sequences with those found in the GenBank sequence database provided by NCBI matching to all available bacterial genomes, humans, bovine, mice, and rats.
Validation of Test-1 and Test-2 included applicability, specificity, sensitivity, precision, accuracy, and robustness, according to available requirements [
26,
27,
28,
29,
30]. Finally, microbial growth culture tests were performed only with DNA derived from MG63 cells to verify DAPI and qPCR results.
2.3. Primer Concentrations and Thermal Profile Optimization
Several combinations of forward—Fw (5′→3) and reverse—Rv (3′→5′) primer concentrations including 100, 150, 200, 300 nM were used with 10.0 μL KAPA SYBR FAST qPCR Master Mix (2×), ROX Low option (Kapa Biosystems, Boston, MA, USA), and 1.0 μL of template gDNA input containing 0.05 ng per reaction. Negative control (PCR-grade water) was added to each combination of primer concentrations. The final volume of a single qPCR reaction was achieved by adding PCR water up to a final volume of 20.0 μL.
The study was performed using the MxPro 3005P QPCR System (Agilent Technologies, Santa Clara, CA, USA). Thermal profile optimization for three primer pairs selected for Test-1 with sequences presented in
Table S2 was performed in different experimental variants that varied in annealing temperature selected from the range of 60–65 °C. In Test-1, optimal M1, M2, and M3 primer pairs concentrations were combined with 0.05 ng (
M. orale,
M. hyorhinis, and
M. genitalium) DNA standards per single reaction, respectively (
Supplementary Table S1; Supplementary Figure S1). In Test-2, all primer pairs presented in
Table S3 at the optimal concentration were combined with appropriate 0.05 ng DNA templates for thermal profile optimization.
2.4. qPCR Efficiency and Linearity Evaluation
The efficiency of the qPCRs used in Test-1 and Test-2 was evaluated based on DNA standard curves obtained for serial dilutions of DNA standards (
Supplementary Table S1). Each
Mycoplasma/Acholeplasma/Ureaplasma sp. DNA standards were diluted in five steps by ten-fold serial template dilutions to give the ranges presented in
Table 1 and
Table 2. DNA standards expressed in ng were next converted into number of copies (c) by MxPro software. The molecular weight required for unit conversion was obtained using Polynucleotide Molecular Weight Calculator presented on the website
http://scienceprimer.com/nucleotide-molecular-weight-calculator (accessed on 12 May 2021).
M. orale DNA standard concentration was only initially expressed in cn/mL. It was additionally diluted in five steps by ten-fold serial template dilution to give the ranges between 2.50 × 10
5 ÷ 2.5 × 10
0 c in Test-1 (
Table 1) and 5.0 × 10
5 ÷ 5.0 × 10
0 c in Test-2 (
Table 2). The efficiency (E) was calculated based on the formula generated by the MxPro 3005P software after plotting standard curves for each tested primer pair (MxPro software v.4.10, Agilent Technologies, Santa Clara, CA, USA).
The E values of qPCR were evaluated individually for gDNA standards of 10 selected species belonged to Mollicutes and additionally for the M. orale c standard. Each dilution was performed in triplicate. The experiments were repeated at least three times for each DNA standard. During PCR efficiency evaluation, two parameters were simultaneously determined, including R square (RSq or R2) and slope values, reflecting linearity and inclination of the standard curve. The characteristic details of the standard curves were described by a curve equation that expressed the relationship between the Ct value and the appropriate amount of DNA from the dilution series.
2.5. Test-1 and Test-2 Analytical Specificity Evaluation
Analytical specificity for Test-1 was performed for M1, M2, and M3 primer pairs with their optimal concentrations presented in
Table 1 using optimal thermal profile (shown above) and 0.05 ng each of analyzed three gDNA. The comparison between triplex qPCR with all primers M1, M2, and M3 Fw and Rv in one tube (Test-1 v.1) and three single qPCRs (Test-1 v.2) with one of each pair of primers respectively were made to specificity analysis of received qPCR products. For comparison, specificity between Test-1 v.1 and -v.2
M. hominis and M1,
M. fermentans and M2,
M. pneumoniae and M3 were used. T (
Supplementary Figure S2) evaluate of Test-2 analytical specificity, ten specific qPCR reactions were performed in duplicate with gDNA 0.05 ng templates of
M. arginini,
M. orale,
M. hyorhinis,
M. fermentans,
M. genitalium,
M. hominis, M. pneumoniae,
M. salivarium,
A. laidlawii, and
U. urealyticum with each pair of primers, containing sequences presented in
Table S3 with concentrations shown in
Table 2. Both Test-1 and -2 specificity examinations were repeated twice. The specificity of received qPCR products was analyzed using melting curve results. Specific pick with a maximum of melting temperature (Tm) received for individual pair of primers confirmed each PCR’s specificity.
To verify M1, M2, and M3 primer pairs cross-reactivity, the next experiment was performed using 1.0 ng gDNA per reaction from a phylogenetically closely related bacterial species. The analysis included Enterococcus faecalis, Lactobacillus fermenti, and then non-related bacterial species such as Salmonella enteritidis, Candida albicans, C. tropicalis, Saccharomyces cerevisiae, and also with 10.0 ng DNA per reactions of mammal species: Mus musculus (ATCC) and Homo sapiens (Coriell Institute for Medical Research, Camden, NJ, USA).
2.6. Analytical Sensitivity—Limit of Detection (LOD) and Limit of Quantification (LOQ)
We defined the LOD values for Test-1 and Test-2 based on the standard curves performed with DNA of representative species from tested
Mycoplasma, Acholeplasma, and
Ureaplasma sp. LOD values expressed the lowest detectable cn value obtained for 95% of all (true positive) replicates test positive with acceptable accuracy and precision [
30].
We defined the LOQ as the lowest number of copies of isolated DNA, which allowed for the reliable quantification of a specific amplicon, with acceptable accuracy and precision for 95% of all (true positive) replicates test positive sufficient accuracy and precision. [
30].
2.7. Test-1 Precision and Robustness Determination
Measurements for precision determination made across at least three independent run in triplicate. Precision was determined by relative standard deviation (RSD) calculation using the formula RSD = S/X; S—standard deviation; X—mean value and calculated for within-run (RSDw) and between-run precision (RSDb) determination, based on the
Ct value differences obtained for all specific amplicons in Test-1 (
Supplementary Tables S4 and S5).
DNA extracted from the B-lymphoid cell line GM1447 used as a template was diluted 2-fold in a five-step serial dilution to give a final concentration range of 1.2 × 10
0 ÷ 7.5 × 10
−2 ng/mL (
Supplementary Table S4). Next each dilution was spiked with
M. orale DNA serially diluted to a range between 2.5 × 10
5 ÷ 2.5 × 10
0 c/mL and combined with M1, and between 2.25 × 10
5 ÷ 2.25 × 10
0 c/mL with M2 primers at the optimal concentration. In the case of M3 primers, master mix samples were additionally spiked with
U. urealyticum DNA serially diluted to a range between 5.0 × 10
4 ÷ 5.0 × 10
0 c/mL. In this analysis qPCR efficiency and specificity for M1 M2 and M3 were evaluated (
Supplementary Table S5).
The robustness (R) of Test-1 we evaluated by assessing the influence of plastic tube types on the level of detection of a known amount of DNA, expressed by the results of a precision evaluation. The effect of plastic tube type on assay sensitivity was defined as an average
Ct value and calculated for qPCRs performed in plastic tubes obtained from each of the three qPCR tube manufacturers (
Supplementary Table S6).
2.8. Diagnostic Sensitivity, Specificity and Accuracy Evaluation Using PromoKine qPCR Test Kit I/RT, Variant C
Thirty DNA samples isolated from different cell lines were tested by commercial PromoKine qPCR Test Kit I/RT Variant C according to the manual manufacturers (PK-CA91-3025C). 500 μL of cell culture supernatant was transferred into sterile DNA-free reaction tube and incubated at 95 °C for 5 min, then centrifugated at 10,000× g for 25 s. Finally 2 μL of the extract was used as a template for qPCR that was performed using manual instructions and MxPro 3005P QPCR System with appropriate settings.
To obtain diagnostic sensitivity and specificity 30 DNA samples derived from selected cell cultures (
Table 3) were additionally analyzed by both Test-1, Test-2 described in this study and commercial PromoKine qPCR Test Kit I/RT, Variant C. We compared qualitative results obtained by both tests PromoKine qPCR Test Kit I/RT and Test-1 for the diagnostic sensitivity and specificity evaluation according to Kralik et al. [
30].
The tests’ accuracy showed the level agreement of qualitative results obtained in both methods for the same tested cell samples. All obtained results achieved for M1, M2, and M3 tested primer pairs of Test-1 and obtained in Test-2 were compared with the results obtained with commercial PromoKine qPCR Test Kit I/RT, Variant C that was used in this study as a referenced method. Defining accuracy, we considered four primary categories applicable in binary classification tests (recommended for qualitative detection). We analyzed thirty samples by Test-1 and Test-2, calculating their concordance with the reference method according to the formula recommended by Kralik et al. [
30].
2.9. DAPI Test and Mycoplasma Culture on Agar
Human osteosarcoma cells (MG63) and mouse fibroblasts cells (L929) were detached using a 0.5 g/L trypsin 1:250 and 0.2 g/L Versen (EDTA) solution (Lonza, Walkersville, MD, USA) and immediately separated into single cells by pipetting. Next, the growth medium with FBS added (1:1 ratio) to stop trypsin activity. The received cellular suspension was centrifuged for 3 min at 500 RPM. The cell sediment rinsed with Dulbecco’s Phosphate-Buffered Saline (DPBS) with calcium and magnesium, and after centrifugation, the pellet was suspended in a working solution of 1 μg/mL DAPI (AppliChem Gmbh, Darmstadt, Germany Germany) in methanol and incubated at 37 °C for 10 min. Cells were rinsed with DPBS and examined under an inverted Nikon microscope (Nikon Instruments Europe BV, Amstelveen, The Netherlands) using a DAPI filter (emission at: 435–485 nm and excitation: 340–380 nm wavelength) at 400× magnification.
We have mentioned above, MG63 and L929 72 h old cells with the same cell number concentration and cell dilution ranges, staring from 1 × 10⁴ number of cells/mL (1×) to inoculate Mycoplasma Agar Base supplemented with mycoplasma selective supplement-G (MABG) (Oxoid Ltd., Hampshire, England) to test mycoplasma growth. Then, 1 mL of undiluted (1×), 10−1 (10×) and 10−2 (100×) diluted cell suspension were added into MABG plates in two independent repeats. Agar plates incubated at 37 °C in 5% CO2 and evaluated after 1 and 2 weeks. MABG was prepared according to the manufacturer’s instructions. Evaluation of bacterial growth was performed after one and two weeks periods under direct detection using manual magnifier (~20× magnification) and inverted microscope using 400× microscope (Olympus, Hamburg, Germany) magnification.
4. Discussion
Detection of cell culture contaminations caused by bacteria belonging to
Mycoplasma sp.,
Acholeplasma sp., and
Ureaplasma sp. that are common in human-environment requires careful detection and analysis, especially with using of qPCR methods [
10]. To obtain reliable results only validated methods should be used. Several variants of qPCR techniques have been described so far for the investigation of cell culture contamination caused by
Mollicutes [
1,
10,
11,
31].
Our study presents newly developed PCR assay to detect DNA of selected species from members of Mycoplasma, Acholeplasma, and Ureaplasma groups in the samples of cell cultures using a two-steps strategy with SYBR Green I.
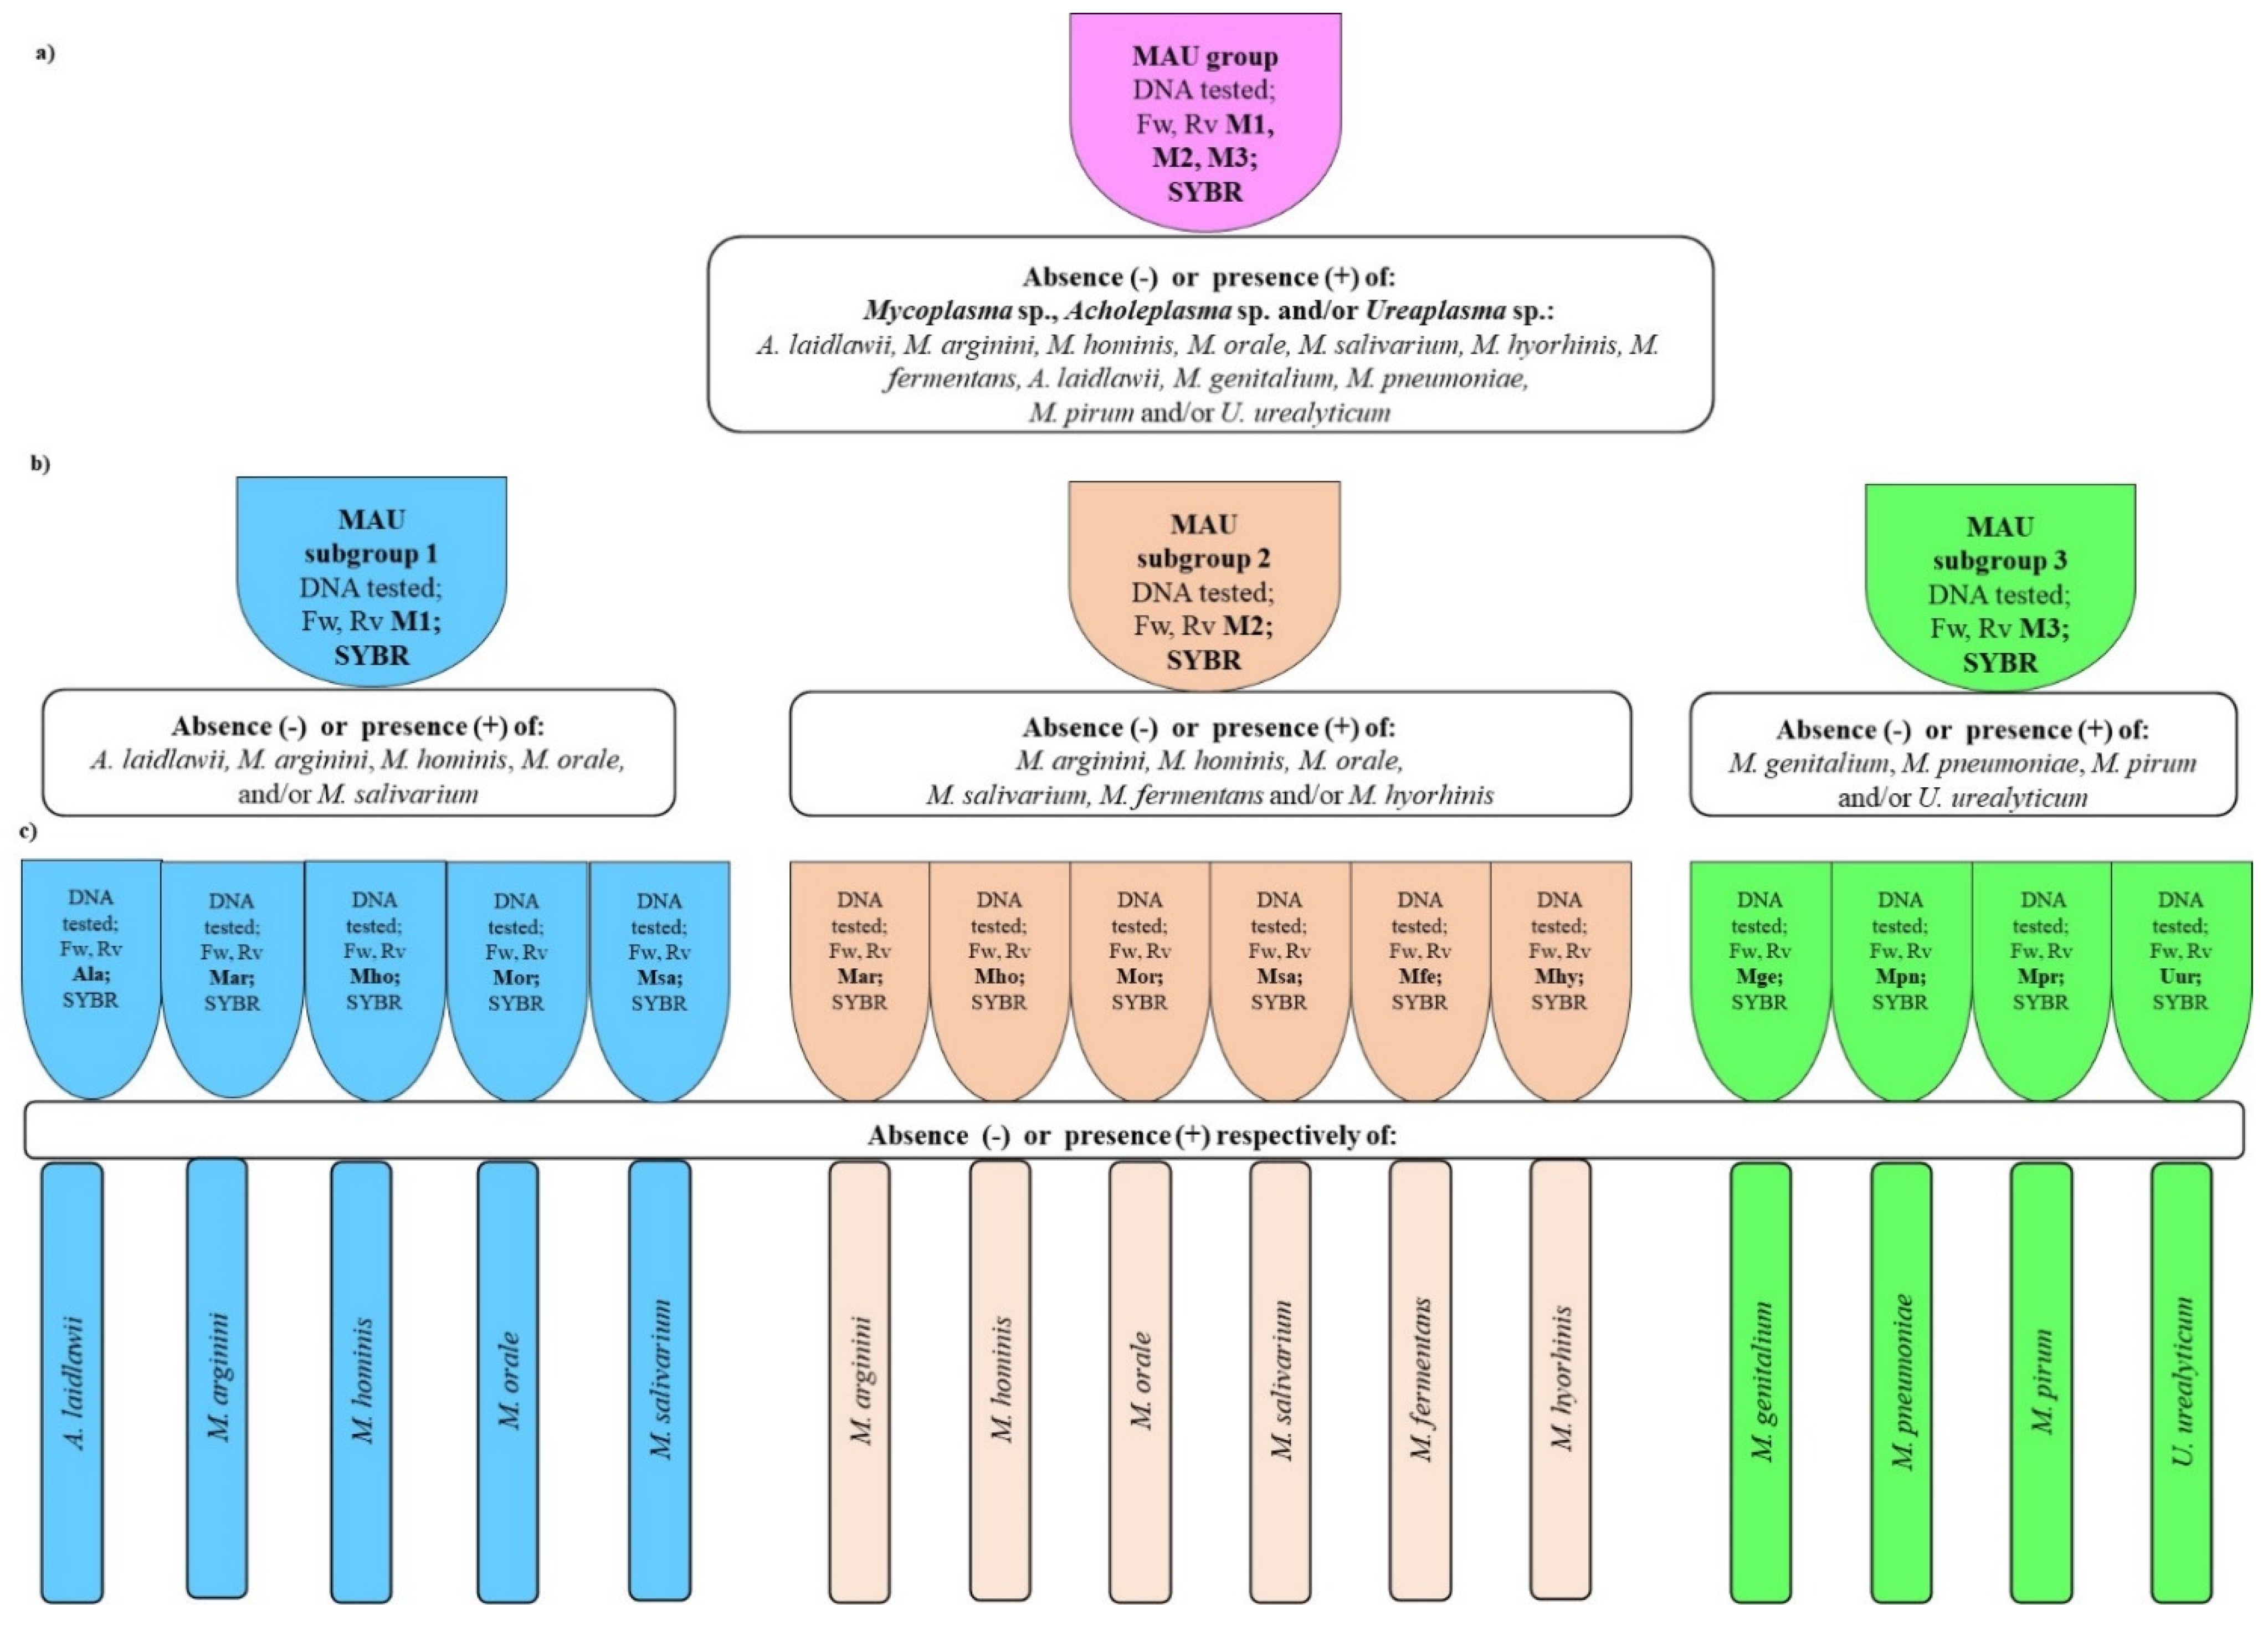
The first step provides screening of examined bacteria with Test-1 from members of
Mycoplasma,
Acholeplasma, and
Ureaplasma groups in screening Test-1 by triplex qPCR (Test-1 v.1) or in three single qPCR (Test-1 v.2). The next step, Test-2, relies on species identification using primers choice based on the Test-1 results (
Scheme 1). Application of Test-1 variants is optional and depends on the final goal.
Proposed way of analysis reduces the time and costs of cell cultures microbial QC and facilitates testing because of applied commonly used fluorochrome type.
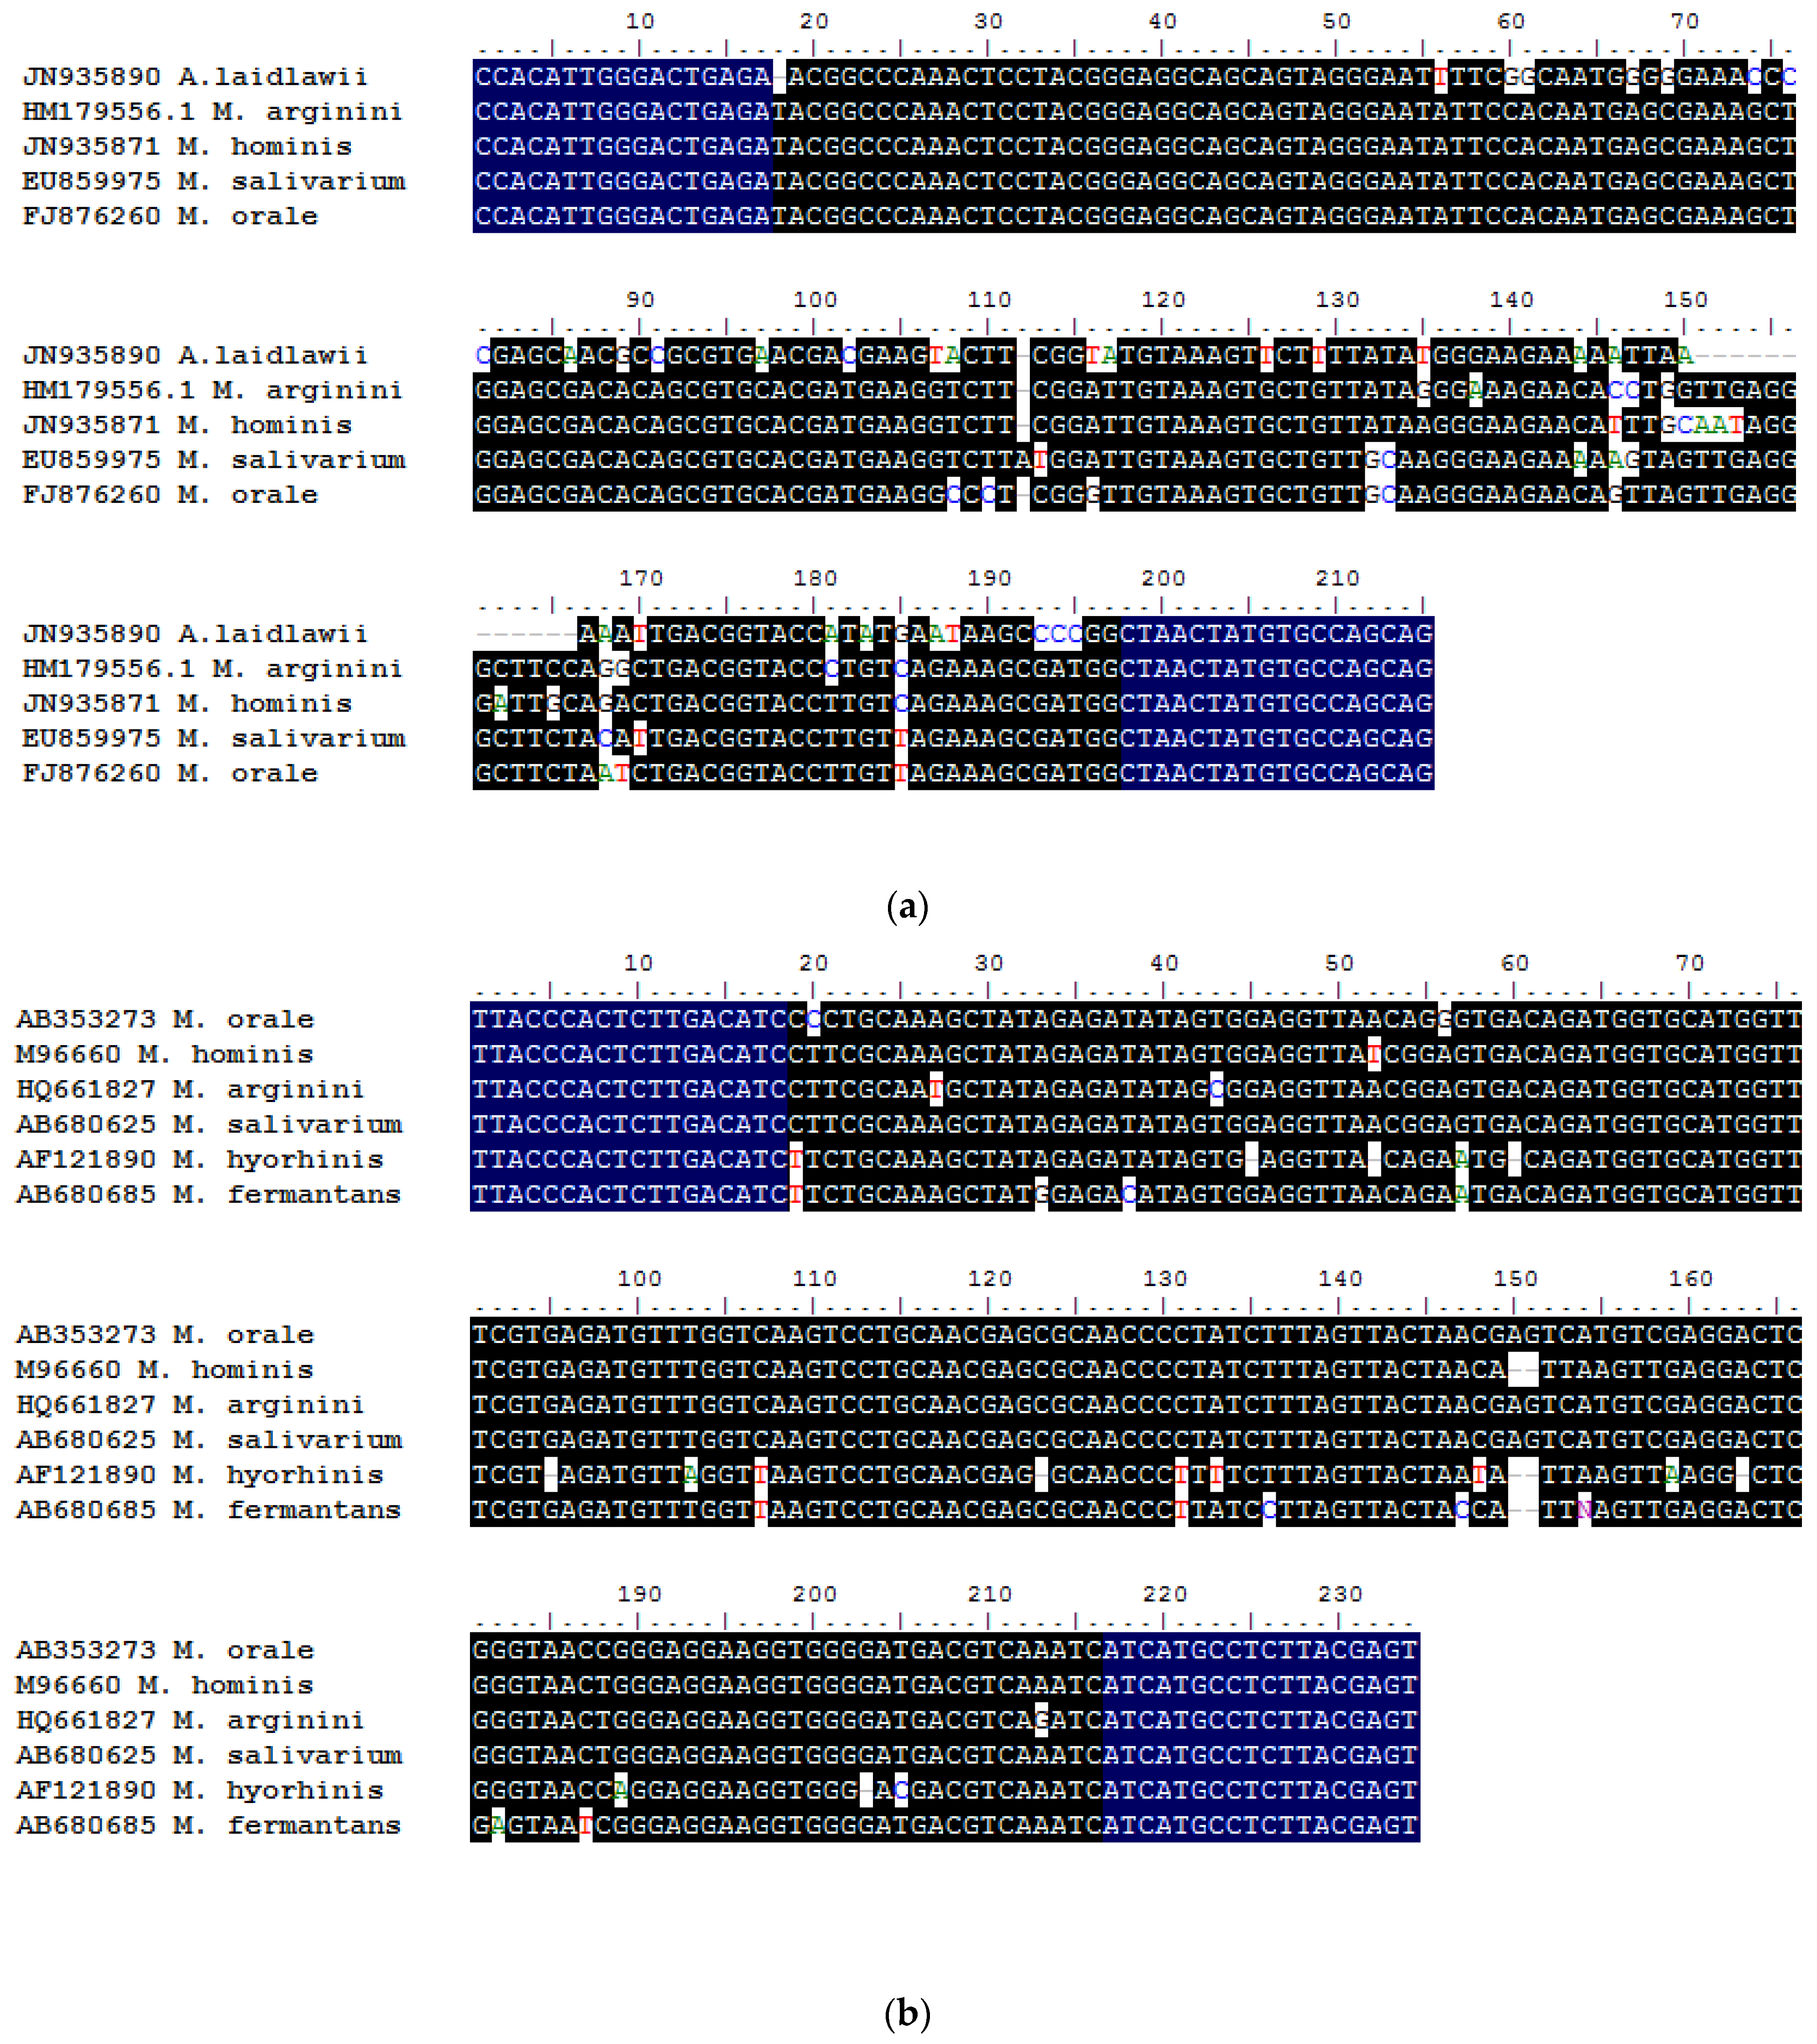
The specificity of Test-1 has been shown initially in silico level by DNA sequence fragments identification that are characteristic only for selected species belonged to
Mollicutes. The NCBI BLAST database and BioEdit software analyzes showed full sequence compatibility only for fragments where primers associate during annealing. The remaining parts of sequences were various and characteristic to each selected species (
Figure 1a–c). The Beacon Designer software used for primer designing facilitated selecting the best primer pairs with the multi-parameter characteristics presented in
Table S2. A low level of ΔG values of hairpins and dimers decreased the formation of non-specific products during PCR. The in silico results initially performed in this study showed several amplicon sequences from the selected targets with sequence fragments specific only for the selected species to avoid cross reactivity. However, in Test-1 we used commonly chosen genes [
3,
10,
32], including
16S–23S ITS,
16S rRNA,
23S RNA genes (
Table S2) but in this study we designed three unique (Fw and Rv) M1, M2, M3 pair of primers for screening detection of 11 selected species belonged to the
Mycoplasma sp.,
Ureaplasma sp., and
Acholeplasma sp. with SYBR Green. In the case of specific amplicon detection in Test-1, characterized by Tm values demonstrated in
Table S3 the next step, species identification, is possible using Test-2 with the use qPCR with species-specific primers selected from either M1, M2, or M3 group (
Scheme 1a–c). Apart from species identification, Test-2 additionally confirmed Test-1 species selected from
Mycoplasma,
Ureaplasma, and
Acholeplasma sp. Higher primer concentrations used in Test-1 in comparison to Test-2 were related with the higher annealing temperature needed to increase the specificity of Test-1. It was essential to ensure a sufficient sensitivity level of Test-1 as a screening test while simultaneously providing the highest possible specificity. There was no detected cross-reactivity with DNA of closely related of bacterial species and DNA derived from different mammal cultures (
Figure 2 and
Figure S2). Frequent quality control of cell cultures is essential for the reliability of results obtained in cell culture experiments performed in vitro.
Analytical sensitivity of Test-1 amounted below 1 fg/mL (10
−9 and 10
−10 ng
Table 1) of genomic DNA of tested species that means was slightly more sensitive than the other method described by Kazemiha et al. (with LOD about 3 fg/mL) [
17]. The slight difference in the sensitivity of Test-1 was only seen for
A. laidlawii and could be related to the formation of two specific qPCR fragments with different sizes (
Table 1). Specificity and relative accuracy calculated for developed Test-1 and Test-2 showed full concordance with the commercial test used in this study as a comparison test for all tested gDNA.
According to pharmacopeial requirements in the range of Mycoplasma/Ureaplasma/Acholeplasma sp. for mammal cell cultures our new developed assay in time saving enabled microbial QC and species identification.
The QC results obtained in this study concerned 17 types of tested cell lines (
Figure 5) and showed contaminations caused by two mycoplasma’s species
M. arginini and
M. hyorhinis in eight of them. All positive in qPCR cell cultures presented discreet phenotypic changes and were undetectable by DAPI test. Therefore application other than unspecific tests for QC is advisable. Identification of
M. arginini and
M. hyorhinis in tested cells in our study may indicate for animal’s origin of detected contamination. In turn of the confirmation contamination caused by two the same bacterial species found in eight different types of cell lines may additionally indicate for the intra-laboratory spread. This two-steps assay seems to be more useful, than other without possibility of species identification. The knowledge of mycoplasma’s species or resistance pattern is required for the choice of optimal antibiotic treatment [
33] especially in the case of infected cultures. However contaminated cell cultures should be discarded but special treatment can save of unique cell cultures. The knowledge about the
Mycoplasma species can help in the choice of rationale antibiotic therapy. The advantage of screening tests is considerably lowering the costs and shortening the time of testing. The disadvantage of the screening methods is the lack of identification of bacterial species among contaminated cell cultures and related with that limit of information about of antibiotic choice for treatment.
Our study showed contamination of the old cell culture collection by two species,
M. arginini and
M. hyorhinis. Similarly, Kazemiha V.M. et al. in 2019 showed that 35% of tested cell lines were contaminated at least two
Mycoplasma sp. (19%) and three (16%) [
34]. They also showed differences under drug resistance among several
Mycoplasma sp.
Cell cultures contamination caused by typical microbials can be easily noticed by direct cloudiness observation in a growth medium or microscope. In such situation immediate removal of contaminated cultures and all environments disinfection should be performed. In contrast to typical microbial infections,
Mycoplasma,
Acholeplasma, and
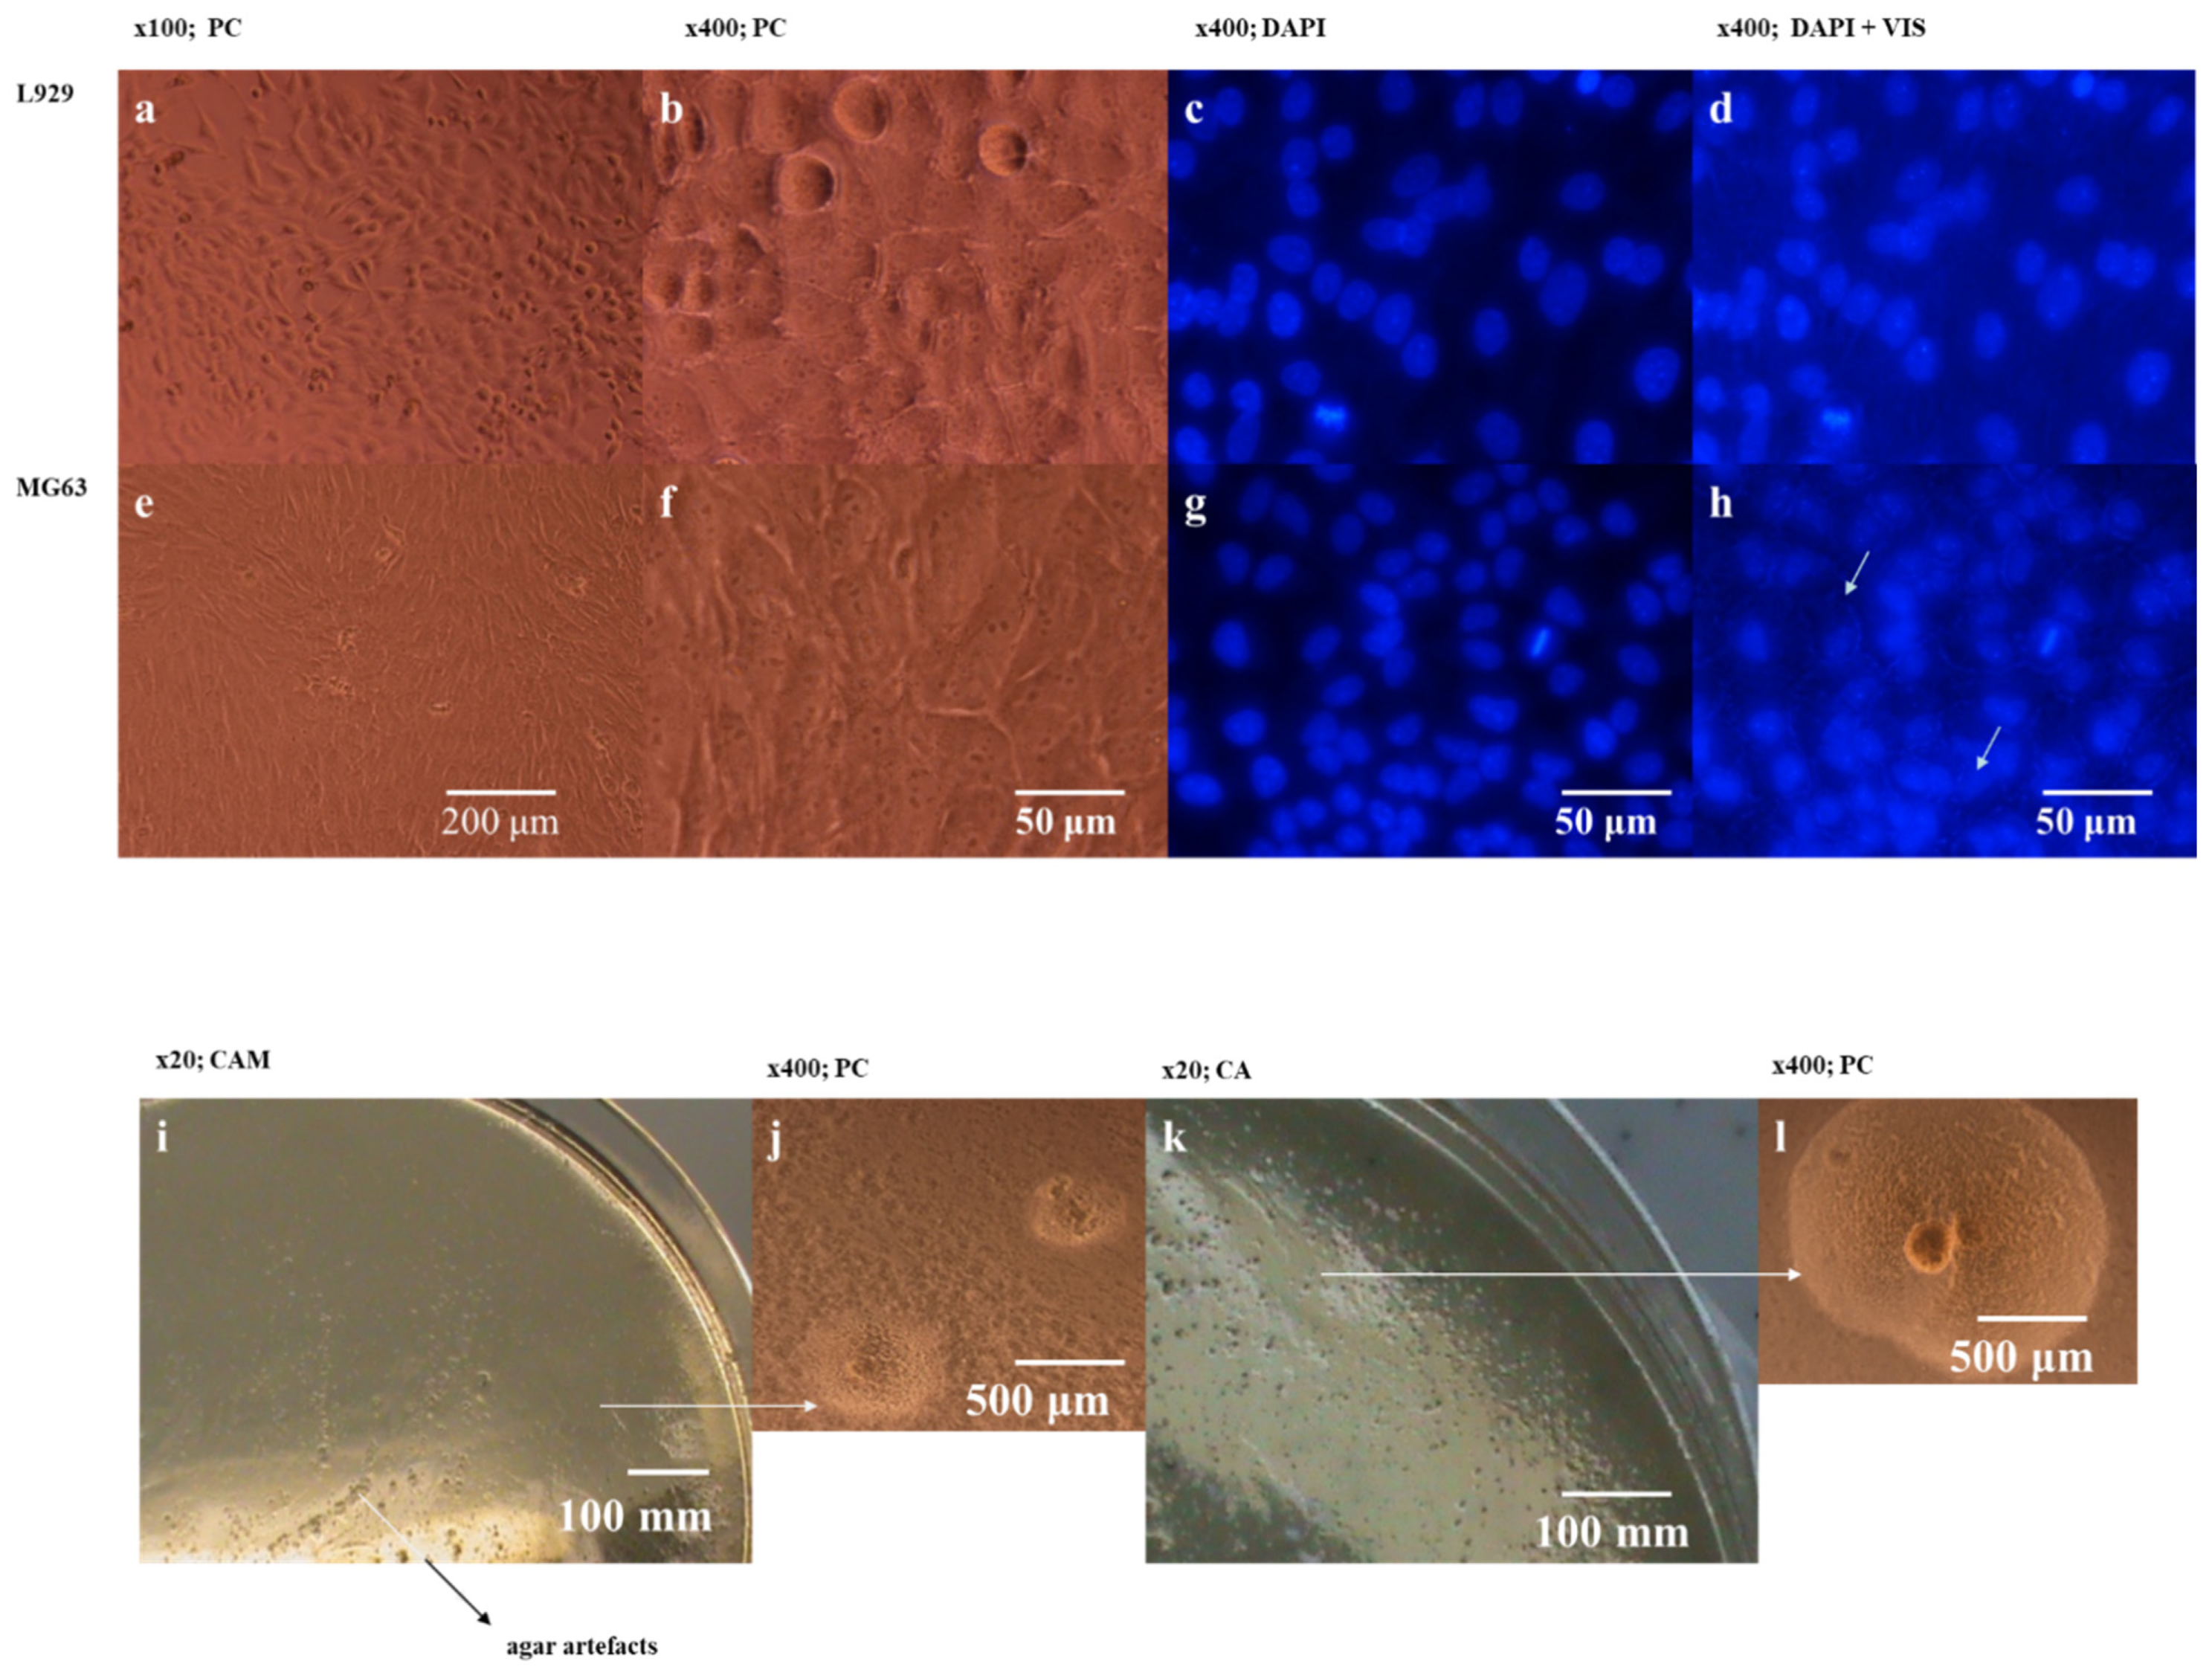
Ureaplasma sp. infections may be unnoticeable. This study shows an example of contamination evaluation difficulties with no cellular changes in MG63 cell cultures (
Figure 4a,b). Discreet changes were visible upon microscopic evaluation only in MG63 cells after DAPI staining but only in extra visible light. Bacterial colonies found on the MABG agar with phenotypic
Mycoplasma features allowed to verify inconsistent results obtained for this cell line in DAPI and qPCR. Test-1 with M1 and M2 primers was positive only for MG63 cells, but Test-2 identified
M. arginini only in MG63 cells and no
Mycoplasma/Acholeplasma/Ureaplasma sp. traces such as shown in L929 cells. We detected on agar with characteristic for
Mycoplasma sp. growth (
Figure 4i–k) and under an inverted microscope (
Figure 4j–l) at 400× magnification.
Summarizing, the choice of qPCR variant used during diagnostic process mainly depends on the aim of study, the type of biological specimen, type of fluorochrome used for amplicon detection, availability of special equipment, the spectrum of validated parameters, and the costs of examination [
30]. Commercially available validated tests usually have limited application and are designed for the insufficient types of specimens or qPCR platforms, or have no efficient validation, allowing their use for a broad spectrum of applications [
29]. The application of commercially available methods requires revalidation of some parameters, including accessible equipment, reagents with a fluorochrome and plastic tubes or other factors.
5. Conclusions
A newly developed qPCR assay with SybrGreen I presented in this study composed with two tests (Test-1 and Test-2) can be used for mammalian cell cultures QC according to pharmacopeial requirements in order to detect contamination caused by selected Mycoplasma, Acholeplasma and Ureaplasma species, including M. arginini, M. orale, M. hyorhinis, M. fermentans, M. genitalium, M. hominis, M. pneumoniae, M. salivarium, M. pirum, A. laidlawii, and U. urealyticum.
Based on our results Test-1, screening test allows to detect all specified species in one tube (Test-1 v.1) or in three tubes (Test-1 v.2) and identify mentioned microorganisms to the Mycoplasma, Acholeplasma or/and Ureaplasma three groups. The second, Test-2 is composed with single specific qPCR and to identify each mentioned above species. Application of Test-1 v.2 enables the reduction of single qPCR number to perform in Test-2.
Both, Test-1 and Test-2 present comparable LOD level and can be used separately or in combination depending of the need.
Based on our findings the proposed way of QC of mammalian cell cultures is competitive to the other qPCR assays performed based on of molecular probes by a lower costs and higher stability of reagents.


 ,
, 


