Article

Diagnostic Performance of a Contrast-Enhanced Ultra-Low-Dose High-Pitch CT Protocol with Reduced Scan Range for Detection of Pulmonary Embolisms

1
Department of Diagnostic and Interventional Radiology, Eberhard-Karls University, 72076 Tuebingen, Germany
2
Department of Neuroradiology, Johannes Gutenberg University, 55101 Mainz, Germany
*
Author to whom correspondence should be addressed.
Diagnostics 2021, 11(7), 1251; https://doi.org/10.3390/diagnostics11071251
Submission received: 9 June 2021 / Revised: 5 July 2021 / Accepted: 8 July 2021 / Published: 13 July 2021
(This article belongs to the Special Issue Radiation Dose and Image Quality in CT Imaging)

Abstract

:
(1) Background: To evaluate the diagnostic performance of a simulated ultra-low-dose (ULD), high-pitch computed tomography pulmonary angiography (CTPA) protocol with low tube current (mAs) and reduced scan range for detection of pulmonary embolisms (PE). (2) Methods: We retrospectively included 130 consecutive patients (64 ± 16 years, 69 female) who underwent clinically indicated high-pitch CTPA examination for suspected acute PE on a 3rd generation dual-source CT scanner (SOMATOM FORCE, Siemens Healthineers, Forchheim, Germany). ULD datasets with a realistic simulation of 25% mAs, reduced scan range (aortic arch—basal pericardium), and Advanced Modeled Iterative Reconstruction (ADMIRE®, Siemens Healthineers, Forchheim, Germany) strength 5 were created. The effective radiation dose (ED) of both datasets (standard and ULD) was estimated using a dedicated dosimetry software solution. Subjective image quality and diagnostic confidence were evaluated independently by three reviewers using a 5-point Likert scale. Objective image quality was compared using noise measurements. For assessment of diagnostic accuracy, patients and pulmonary vessels were reviewed binarily for affection by PE, using standard CTPA protocol datasets as the reference standard. Percentual affection of pulmonary vessels by PE was computed for disease severity (modified Qanadli score). (3) Results: Mean ED in ULD protocol was 0.7 ± 0.3 mSv (16% of standard protocol: 4.3 ± 1.7 mSv, p < 0.001, r > 0.5). Comparing ULD to standard protocol, subjective image quality and diagnostic confidence were comparably good (p = 0.486, r > 0.5) and image noise was significantly lower in ULD (p < 0.001, r > 0.5). A total of 42 patients (32.2%) were affected by PE. ULD protocol had a segment-based false-negative rate of only 0.1%. Sensitivity for detection of any PE was 98.9% (95% CI, 97.2–99.7%), specificity was 100% (95% CI, 99.8–100%), and overall accuracy was 99.9% (95% CI, 98.6–100%). Diagnoses correlated strongly between ULD and standard protocol (Chi-square (1) = 42, p < 0.001) with a decrease in disease severity of only 0.48% (T = 1.667, p = 0.103). (4) Conclusions: Compared to a standard CTPA protocol, the proposed ULD protocol proved reliable in detecting and ruling out acute PE with good levels of image quality and diagnostic confidence, as well as significantly lower image noise, at 0.7 ± 0.3 mSv (84% dose reduction).

1. Introduction

Pulmonary artery embolisms (PE) are a common diagnosis and avertible cause of death in hospitalized patients [1]. Because of wide availability and the capability to quickly and reliably rule out this potentially deadly disease, computed tomography pulmonary angiography (CTPA) is the diagnostic method of choice [2]. While clinical capabilities have continually risen in the last decades, there has been an alarming rise in the incidence of PE as well [3]. The rising incidence of PE is indivisibly connected with an equally growing need for CTPA examinations, leading to increased patient exposure to radiation doses [4]. Multiple studies have voiced concern about this fact in the last decades, as its potentially harmful consequences are difficult to predict [5,6]. Managing radiation exposition according to the As Low As Reasonably Achievable (ALARA) principle has hence become a constant goal in clinical routine and radiological research. Radiation dose is, however, closely linked to image quality and image noise. Reducing radiation dose is, therefore, not an easy task, as it might severely limit diagnostic accuracy [7,8]. Solving this dilemma becomes especially important in younger patients and in pregnant women, where CTPA may result in elevated radiation exposure of the mammary glands [9,10]. In light of this background, there have been numerous approaches to reducing radiation doses in CT, particularly in CTPA. Apart from modulation of tube current (mAs) and reducing peak tube voltage (kVp), the introduction of the latest generation CT scanners and the resurgence of iterative reconstruction (IR) techniques have significantly contributed towards radiation exposure reductions in CTPA, enabling mean radiation doses below 2 mSv [11]. In addition, approaches using the reduction of the scan range in the z-axis have shown promising results in abdominopelvic CT and CTPA [12,13]. While these individual methods are proven to reduce radiation doses in CT significantly, to our knowledge, there have not been any attempts to evaluate the feasibility of a CTPA protocol that combines all of these approaches. Therefore, the scope of our study was to evaluate the effects of a retrospectively simulated ultra-low-dose (ULD) CTPA protocol at 25% radiation dose with reduced scan range, high-pitch scan mode, and iterative reconstruction techniques on diagnostic accuracy, image quality, and diagnostic confidence, as compared to a standard CTPA protocol.

2. Materials and Methods

2.1. Population

Retrospective collection of clinically indicated CTPA for suspected acute pulmonary embolisms for this study was approved by the institutional review board with a waiver for the need for informed consent. We included 130 consecutive patients (19–94 years, 69 female) who underwent clinically indicated CTPA for suspected PE from August to October 2019. No patients were excluded. To form a comprehensive image of our population, we collected biometric details such as sex, date of birth, the patients’ age, and BMI at the examination. Figure 1 is a flowchart of patient enrollment and the study workflow.

2.2. Image Acquisition and Reconstruction Parameters

All CT exams were acquired on the same 3rd generation dual-source CT Scanner (SOMATOM FORCE, Siemens Healthineers, Forchheim, Germany). For image acquisition, we used the proprietary single-energy high-pitch mode (“flash mode”) with attenuation-based tube current modulation (CARE Dose4D, reference mAs 180) and automatic tube voltage selection (80–120 kV, reference kV 110) matrix size set to 512 and field of view set to 50 cm. Collimation was 0.6 × 192 mm, pitch factor 2.8, and gantry rotation time 0.25 s. Depending on individual body weight, CTPA was automatically performed with 50–60 ml contrast medium (Imeron 400, Bracco, Milan, Italy), applied through an antecubital vein catheter. We used a dual syringe injector with a chaser of 40 ml saline, each at a flow rate of 3.5 mL/s (CT Stellant, Medrad, Indianola, PA, USA). Bolus tracking was used to ensure optimal contrast enhancement of the pulmonary arteries by placing a region of interest (ROI) with a trigger threshold of 200 Hounsfield units (HU) in the pulmonary trunk. Delay was 5 s. To avoid quality differences due to varying electronic noise levels, image reconstruction and low dose simulations were conducted solely using the proprietary reconstruction Software ReconCT (version 14.2.0.40998, Siemens Healthineers, Forchheim, Germany). We used a medium-hard kernel (Bv40d) with a slice thickness and increment of 1 mm in axial, coronal, and sagittal orientation. In accordance with our hospital’s standard CTPA protocol, we employed Advanced Modeled Iterative Reconstruction (ADMIRE®, Siemens Healthineers, Forchheim, Germany) strength3 for standard protocol reconstructions. For ULD protocol reconstructions, we performed a tube current simulation by reducing the mAs to 25% and employed a high level of iterative reconstruction (ADMIRE strength 5), as this combination showed promising results in other studies [11]. In the same step, we additionally simulated a limited scan range from the top of the aortic arch to the basal pericardium.

2.3. Radiation Dose

We collected the tube voltage (kV), the CT dose index (CTDIvol) and the dose length product (DLP) from the study protocol for every patient. To determine the effective radiation dose, we used a dedicated dosimetry software (Radimetrics ver. 2.9, Bayer Medical Care, Leverkusen, Germany) that also allows for the estimation of the effective radiation dose (ED) at 25% mAs, with a reduced scan range.

2.4. Analysis of Subjective Image Quality

Three radiologists (3–6 years experience in chest radiology) independently performed the subjective analysis of image quality blinded to the examinations’ clinical background information. All images were initially displayed in a soft tissue window (center 50 HU, width 350 HU), but individual adjustments were allowed for the reading. Assessment of subjective image quality and diagnostic confidence was performed according to the criteria listed in the chapter “Chest, general” of the European Guidelines on Quality Criteria in Computed Tomography [14], using an equidistant 5-point Likert scale (5 = very good, 4 = good, 3 = average, 2 = below average, 1 = poor).

2.5. Analysis of Objective Image Quality

We used image noise as a marker for objective image quality. We defined noise as the standard deviation of HU taken from homogenous regions of interest (ROI) with a size of ≥2 cm2 placed in the paraspinal muscles. Noise measurements were performed by each reviewer in the process of subjective image quality reading. We measured noise bilaterally in 5 consecutive slices and averaged all results for a mean overall noise value.

2.6. Diagnostic Accuracy and Disease Severity

For diagnostic accuracy and assessment of disease severity, we used a modified Qanadli score [15]: each reader evaluated the images for the presence/absence of PE in the ten segmental vessels bilaterally and assigned a binary grade (0 = no PE, 1 = PE). Findings positive for PE ranged from partial intraluminal filling defects to complete arterial occlusions, proximal PE were counted as positive findings for all downstream segments. Figure 2 shows modified Qanadli score points (white numbers) for PE at the respective locations. Findings not covered by the given scan range in the ULD protocol were counted as false-negatives.
Vessel segments (black numbers) are defined in Table 1. Pulmonary lobes are abbreviated as follows: right upper lobe = RUL, right middle lobe = RML, right lower lobe = RLL, left upper lobe = LUL, left lower lobe = LLL.
We calculated the overall percentual affection of segmental vessels by PE as an indicator of severity. For reference standard, the original datasets were evaluated by a senior radiologist with eight years of experience in synopsis with the clinical reports.

2.7. Statistical Analysis

IBM® SPSS® Statistics Version 27 for Windows (Armonk, NY, USA) was used for statistical analysis. Data distribution was tested using the Shapiro–Wilk test. Normally distributed variables were expressed as mean ± standard deviation, non-normally distributed variables as median, and interquartile range (IQR). Normally distributed variables were analyzed using Student’s paired t-test, non-normally distributed variables with Wilcoxon’s paired t-test. A p-value ≤ 0.05 indicated statistical significance. We computed Pearson’s correlation (r) to measure effect size and defined r-values from 0.1 to 0.3 as indicative for a small, from 0.3 to 0.5 for a medium, and ≥0.5 for a large effect size. To measure inter-rater agreement, we used an intraclass correlation coefficient (ICC) [16]. ICC values of 0–0.2 were considered as slight, 0.21–0.4 as fair, 0.41–0.6 as moderate, 0.61–0.8 as substantial, and 0.81–1.00 as almost perfect levels of agreement. For patient-based diagnostic accuracy, we performed crosstabulations to calculate sensitivity and specificity with 95% confidence intervals. We computed the positive and negative likelihood ratio, positive and negative predictive value, as well as accuracy. We furthermore added a segment-based accuracy analysis via bootstrapping the pulmonary vessels to account for the clustered nature of the data. Pearson’s Chi-Square tests for the contingency of PE diagnosis on a vessel segment-based level ensued with Bonferroni correction to counteract Type I error increase in multiple comparisons. Cramer’s V was used as a symmetric measure with values > 0.3, indicating a strong correlation.

3. Results

3.1. Patient Population, Scan Range, and Radiation Dose

We included 130 patients (61 male, 69 female) in our study. Prevalence of PE was 32% (n = 42). A total of 88 patients (68%) showed other findings that were deemed causative for acute thoracic symptoms. Table 2 gives an overview of the patient characteristics and the radiation dose.
The mean ED of the standard protocol was 4.3 ± 1.7 mSv. For the ULD protocol, mean ED was 0.7 ± 0.3 mSv, resembling 16% of the initial radiation dose (p < 0.001). For visualization of scan ranges, see Figure 3.
The mean scan range of the standard protocol was 29.2 ± 4.1 cm. In the ULD protocol, the mean scan range was reduced to 18.3 ± 2.7 cm, which amounted to 63% of the original length.

3.2. Analysis of Subjective Image Quality

Image quality was rated very good (5; IQR 4–5) for the standard protocol and good (4; IQR 3–5) for the ULD protocol. Diagnostic confidence was very good (5; IQR 4–5) in the standard protocol and good (4; IQR 4–5) for the ULD protocol. Figure 4 is a graph of the data of subjective image quality analysis.
There were no significant differences between the ratings of image quality (p = 0.486) and diagnostic confidence (p = 0.28) with effect size indicating a strong effect (r > 0.5) in both groups. For further details, see Table 3.

3.3. Analysis of Objective Image Quality

For objective image quality, we analyzed image noise. Figure 5 is a graph of the comparison of image noise.
Image noise was 16.3 ± 2. 9 HU in the standard protocol. In the ULD protocol, noise was significantly lower (p < 0.001, r > 0.5) at 12.3 ± 3.0 HU.

3.4. Diagnostic Accuracy and Severity

3.4.1. Patient-Based Accuracy

We had 42 cases of PE in our 130 patients, 39 of which were classified correctly in the ULD protocol. Scan range reduction led to 3 false-negative findings and 0 false-positive classification of PE by all three readers (ICC = 1). Patient-based sensitivity of the ULD protocol was 92.9% (95% CI, 80.5–98.5%) and Specificity 100% (95% CI, 95.9–100%). The positive predictive value was 100%, the negative predictive value 96.7% (95% CI, 90.8–99.9%). The overall accuracy (probability that a patient is classified correctly) of the ULD protocol was 97.7% (95% CI, 93.4–99.5%). See Table 4 for further details.

3.4.2. Segment-Based Accuracy

In our population, 359 out of 2600 segmental vessels were affected by PE (13.7% prevalence). Of those, a total of 355 vessels were classified correctly in the ULD protocol (98.9%). Scan range reduction led to four false-negative findings (0.1%) and no false-positive classifications of PE by all three readers (ICC = 1). Segment-based sensitivity in the ULD protocol was 98.9% (95% CI 97.2–99.7%) and specificity 100% (95% CI, 99.8–100%). As in patient-based analysis, positive predictive value was 100%. The negative predictive value 99.8% (95% CI, 97.5–99.9%). The ULD protocol allowed for overall segment-based accuracy (probability that a segment is correctly classified as affected by PE) of 99.9% (95% CI, 98.6–100%). See Table 5 for further details.
Chi-square tests with Bonferroni-corrected significance levels showed a strong correlation between the segment-based classifications of PE in standard protocol and ULD protocol (Chi-square (1) = 42, p < 0.001, Fisher’s exact test p < 0.001; Cramer’s V ≥ 0.906, p < 0.001). See Appendix A, Table A1 for further details.

3.4.3. Disease Severity

With a maximum of 20 awardable points, standard protocol yielded a mean modified Qanadli score of 8.55 ± 6.271 points vs. ULD protocol with 8.45 ± 6.283 points. Mean severity (the percentage of affected vessels) was 42.74% ± 31.356 in standard protocol and 42.26% ± 31.434 in ULD protocol. Pearson’s correlation showed a strong coherency (r = 0.998, p < 0.001) between the modified Qanadli score measurements, as well as severity in both protocols. Student’s t-test for paired samples showed no significant differences (T = 1.667, p = 0.103) between the modified Qanadli score measurements and consecutively the severity in both protocols. Figure 6 illustrates diagnostic accuracy for PE in our population with example images from three patients for both protocols. Greyed out arrows mark false-negative findings.

4. Discussion

This study aimed to evaluate the diagnostic performance of a contrast-enhanced ULD high-pitch CTPA protocol with a reduced scan range for detection of pulmonary embolisms. We included 130 consecutive patients with CTPA flash mode scans at a 3rd generation CT scanner. For the standard protocol (100% mAs, ADMIRE 3, full scan range), the mean effective radiation dose was 4.3 ± 1.7 mSv compared to 0.7 ± 0.3 mSv in the ULD protocol (25% mAs, ADMIRE 5, reduced scan range), a decrease of 84% (p < 0.001, r > 0.5).
The possibilities of radiation dose reduction in CTPA for suspected PE have been explored in some studies before. Concerning mAs reduction, Sauter et al. reported excellent levels of diagnostic accuracy of PE in combination with iterative reconstruction at effective radiation doses as low as 0.9 mSv [17]. For scan range reduction, Atalay et al. identified a possible decrease to 53% coverage in their distribution-based study regarding scan length optimization at equal levels of diagnostic accuracy [13]. If applied to our dataset, this method would result in a radiation dose target of 2.3 mSv. The proposed ULD protocol combines these approaches, yielding the possibility of a tremendous reduction in effective radiation dose down to 16% (0.7 ± 0.3 mSv).
Image quality and diagnostic confidence were good in the proposed ULD protocol without any significant differences compared to the ratings of the standard protocol. These results are accordant to multiple studies that have shown high levels of subjective image quality and diagnostic confidence when using low dose approaches combined with iterative reconstruction algorithms [17,18,19]. In agreement with our study, Sauter et al. reported good levels of subjective image quality and diagnostic confidence down to 25% radiation dose with a target of 0.9 mSv [17]. At 0.7 ± 0.3 mSv, the proposed protocol is capable of reducing radiation dose even further. We found image noise to be significantly lower in the proposed ULD protocol than in the standard protocol., a fact most certainly due to the higher iterative reconstruction strength used for the ULD protocol. This is following previous results that have reported a continuous decrease of image noise with higher levels of model-based iterative reconstruction, ADMIRE in particular [20].
At a disease prevalence of 32.2%, the proposed ULD protocol yielded excellent values for sensitivity, specificity, and overall accuracy for ruling out pulmonary embolisms on a patient-based level, as well as on a segment-based level. We further measured a strong consistency between the segment-based classifications of PE in both protocols, attesting to the high reliability of the proposed ULD protocol. Furthermore, there was a strong coherency between the measurements of the modified Qanadli score and the severity in both protocols. Regarding diagnostic accuracy of PE in combination with scan range reduction, multiple studies have shown only minimal distribution of PE in the apical vessel segments above the aortic arch or the lower segments below the base of the heart [21,22]. This is particularly interesting, as there is still discussion about the clinical significance of such emboli, especially if weighed against the individual risks of anticoagulation [23,24,25,26,27]. Although the modified Qanadli score and the severity measurements were expectedly lower in the proposed ULD protocol, the decrease of 0.1 points in Qanadli score and 0.48% in severity weren’t statistically significant. Therefore, this protocol may be beneficial for patients by reducing unnecessary radiation exposure.

5. Limitations

Our study has several limitations. Firstly, we chose a retrospective study design with simulated radiation dose reduction to minimize unwanted radiation dose application, whereas a prospective study design might have further limited biases and might have allowed to draw conclusions on clinical decision-making. Secondly, this study only investigated the diagnostic performance and accuracy of the ULD protocol regarding PE. As we had several patients with other, or even no findings that were causative of acute thoracic symptoms, a systematic review of the proposed ULD protocol concerning such cases, therefore, needs to remain the scope of future studies. Thirdly, we need to mention that this study was performed using a high-end 3rd generation CT scanner (SOMATOM Force) with iterative reconstructions, which is not available at every clinical site. Our results might, therefore, not necessarily be transformable to other setups, or older scanner generations.

6. Conclusions

Compared to a standard CTPA protocol, the proposed ULD protocol proves reliable in detecting and ruling out acute PE with good levels of image quality and diagnostic confidence, as well as significantly lower image noise, at 0.7 ± 0.3 mSv (84% dose reduction).

Author Contributions

Conceptualization, A.E.O. and S.A.; methodology, A.S.B., A.E.O. and S.A.; validation, S.A.; formal analysis, A.S.B.; investigation, A.S.B.; resources, K.N.; data curation, M.T.W., S.A.; writing—original draft preparation, A.S.B.; writing—review and editing, M.T.W., F.P., C.P.A., K.N., A.E.O. and S.A.; visualization, A.S.B.; supervision, S.A.; project administration, A.E.O. and S.A. All authors have read and agreed to the published version of the manuscript.

Funding

This research received no external funding. We acknowledge support by Open Access Publishing Fund of University of Tübingen.

Institutional Review Board Statement

The study was conducted according to the guidelines of the Declaration of Helsinki and approved by the Institutional Review Board of the University of Tuebingen (735/2018BO2, 31 March 2021).

Informed Consent Statement

Patient consent was waived due to the retrospective nature of this study.

Data Availability Statement

Data sharing not applicable.

Conflicts of Interest

The authors declare no conflict of interest.

Appendix A

Table A1. Segment-based crosstabulation, Chi-square tests, and symmetric measures.
Standard Protocol * ULD Protocol CrosstabulationChi-Square TestsSymmetric Measures
SegmentCount% within Standard
ULDTotalULDTotalPearson Chi-SquareFisher’s Exact TestNominal Cramer’s V
1010ValuedfAsymptotic Significance (2-sided)Exact Significance (2-sided)Approximate SignificanceValue
01 RUL anterior segmentStandard120020100.0%0.0%100.0%42.00010.0000.0000.0001.000
0022220.0%100.0%100.0%
02 RUL apical segmentStandard120020100.0%0.0%100.0%42.00010.0000.0000.0001.000
0022220.0%100.0%100.0%
03 RUL posterior segmentStandard119019100.0%0.0%100.0%42.00010.0000.0000.0001.000
0023230.0%100.0%100.0%
04 RML apical segmentStandard122022100.0%0.0%100.0%42.00010.0000.0000.0001.000
0020200.0%100.0%100.0%
05 RML basal segmentStandard122022100.0%0.0%100.0%42.00010.0000.0000.0001.000
0020200.0%100.0%100.0%
06 RLL lateral basal segmentStandard121021100.0%0.0%100.0%42.00010.0000.0000.0001.000
0021210.0%100.0%100.0%
07 RLL anterior basal segmentStandard118018100.0%0.0%100.0%42.00010.0000.0000.0001.000
0024240.0%100.0%100.0%
08 RLL medial basal segmentStandard120020100.0%0.0%100.0%42.00010.0000.0000.0001.000
0022220.0%100.0%100.0%
09 RLL posterior basal segmentStandard126026100.0%0.0%100.0%42.00010.0000.0000.0001.000
0016160.0%100.0%100.0%
10 RLL superior segmentStandard119019100.0%0.0%100.0%42.00010.0000.0000.0001.000
0023230.0%100.0%100.0%
11 LUL anterior segmentStandard113013100.0%0.0%100.0%42.00010.0000.0000.0001.000
0029290.0%100.0%100.0%
12 LUL anterior apical segmentStandard113013100.0%0.0%100.0%42.00010.0000.0000.0001.000
0029290.0%100.0%100.0%
13 LUL apical posterior segmentStandard11621888.9%11.1%100.0%34.46210.0000.0000.0000.906
0024240.0%100.0%100.0%(95% CI 0.751–1.000)
14 LUL apical lingula segmentStandard112012100.0%0.0%100.0%42.00010.0000.0000.0001.000
0030300.0%100.0%100.0%
15 LUL basal lingula segmentStandard112012100.0%0.0%100.0%42.00010.0000.0000.0001.000
0030300.0%100.0%100.0%
16 LLL lateral segmentStandard116016100.0%0.0%100.0%42.00010.0000.0000.0001.000
0026260.0%100.0%100.0%
17 LLL anteromedial segmentStandard115015100.0%0.0%100.0%42.00010.0000.0000.0001.000
0027270.0%100.0%100.0%
18 LLL posteromedial segmentStandard12112295.5%4.5%100.0%38.18210.0000.0000.0000.953
0020200.0%100.0%100.0%(95% CI 0.904–1.000)
19 LLL posterolateral segmentStandard12112295.5%4.5%100.0%38.18210.0000.0000.0000.953
0020200.0%100.0%100.0%(95% CI 0.898–1.000)
20 LLL superior segmentStandard1909100.0%0.0%100.0%42.00010.0000.0000.0001.000
0033330.0%100.0%100.0%

References

  1. Belohlavek, J.; Dytrych, V.; Linhart, A. Pulmonary embolism, part I: Epidemiology, risk factors and risk stratification, pathophysiology, clinical presentation, diagnosis and nonthrombotic pulmonary embolism. Exp. Clin. Cardiol. 2013, 18, 129–138. [Google Scholar]
  2. Kurcz, J.; Garcarek, J.; Guziński, M.; Czarnecka, A.; Sąsiadek, M.J. Multislice computed tomography angiography as an imaging modality of choice in patients with suspicion of pulmonary embolism-own experiences and modern imaging techniques. Adv. Clin. Exp. Med. 2013, 22, 705–713. [Google Scholar] [PubMed]
  3. DeMonaco, N.A.; Dang, Q.; Kapoor, W.N.; Ragni, M.V. Pulmonary embolism incidence is increasing with use of spiral computed tomography. Am. J. Med. 2008, 121, 611–617. [Google Scholar] [CrossRef] [PubMed] [Green Version]
  4. Takahashi, E.A.; Yoon, H.C. Four-year cumulative radiation exposure in patients undergoing computed tomography angiography for suspected pulmonary embolism. Radiol. Res. Pract. 2013, 2013, 482403. [Google Scholar] [CrossRef]
  5. Brenner, D.J.; Hall, E.J. Computed Tomography—An Increasing Source of Radiation Exposure. N. Engl. J. Med. 2007, 357, 2277–2284. [Google Scholar] [CrossRef] [PubMed] [Green Version]
  6. Berrington de González, A.; Mahesh, M.; Kim, K.-P.; Bhargavan, M.; Lewis, R.; Mettler, F.; Land, C. Projected Cancer Risks From Computed Tomographic Scans Performed in the United States in 2007. Arch. Intern. Med. 2009, 169, 2071–2077. [Google Scholar] [CrossRef] [PubMed]
  7. Afat, S.; Brockmann, C.; Nikoubashman, O.; Muller, M.; Thierfelder, K.M.; Brockmann, M.A.; Nikolaou, K.; Wiesmann, M.; Kim, J.H.; Othman, A.E. Diagnostic Accuracy of Simulated Low-Dose Perfusion CT to Detect Cerebral Perfusion Impairment after Aneurysmal Subarachnoid Hemorrhage: A Retrospective Analysis. Radiology 2018, 287, 643–650. [Google Scholar] [CrossRef] [PubMed] [Green Version]
  8. Othman, A.E.; Bongers, M.N.; Zinsser, D.; Schabel, C.; Wichmann, J.L.; Arshid, R.; Notohamiprodjo, M.; Nikolaou, K.; Bamberg, F. Evaluation of reduced-dose CT for acute non-traumatic abdominal pain: Evaluation of diagnostic accuracy in comparison to standard-dose CT. Acta Radiol. 2018, 59, 4–12. [Google Scholar] [CrossRef] [Green Version]
  9. Evans, S.H.; Davis, R.; Cooke, J.; Anderson, W. A comparison of radiation doses to the breast in computed tomographic chest examinations for two scanning protocols. Clin. Radiol. 1989, 40, 45–46. [Google Scholar] [CrossRef]
  10. Parker, L. Does radiation associated with diagnostic CT scans in children and young people increase their subsequent risk of developing cancer? Arch. Dis. Child. Educ. Pract. 2013, 98, 239. [Google Scholar] [CrossRef]
  11. Winkelmann, M.T.; Walter, S.S.; Stock, E.; Brendlin, A.; Kolb, M.; Othman, A.E.; Afat, S. Effects of radiation dose reduction on diagnostic performance of 3rd generation Dual Source CT pulmonary angiography. Eur. J. Radiol. 2021, 134, 109426. [Google Scholar] [CrossRef]
  12. Atalay, M.K.; Walle, N.L.; Egglin, T.K. Prevalence and nature of excluded findings at reduced scan length CT angiography for pulmonary embolism. J. Cardiovasc. Comput. 2011, 5, 325–332. [Google Scholar] [CrossRef] [PubMed]
  13. Atalay, M.K.; Walle, N.L.; Grand, D.J.; Mayo-Smith, W.W.; Cronan, J.J.; Egglin, T.K. Scan length optimization for pulmonary embolism at CT angiography: Analysis based on the three-dimensional spatial distribution of 370 emboli in 100 patients. Clin. Radiol. 2011, 66, 405–411. [Google Scholar] [CrossRef] [PubMed]
  14. Menzel, H.-G.; Schibilla, H.; Teunen, D. European Guidelines on Quality Criteria for Computed Tomography, EUR 16260. Available online: http://www.drs.dk/guidelines/ct/quality/htmlindex.htm (accessed on 1 February 2021).
  15. Qanadli, S.D.; El Hajjam, M.; Vieillard-Baron, A.; Joseph, T.; Mesurolle, B.; Oliva, V.L.; Barré, O.; Bruckert, F.; Dubourg, O.; Lacombe, P. New CT Index to Quantify Arterial Obstruction in Pulmonary Embolism. Am. J. Roentgenol. 2001, 176, 1415–1420. [Google Scholar] [CrossRef]
  16. Bobak, C.A.; Barr, P.J.; O’Malley, A.J. Estimation of an inter-rater intra-class correlation coefficient that overcomes common assumption violations in the assessment of health measurement scales. BMC Med. Res. Methodol. 2018, 18, 93. [Google Scholar] [CrossRef] [PubMed]
  17. Sauter, A.; Koehler, T.; Fingerle, A.A.; Brendel, B.; Richter, V.; Rasper, M.; Rummeny, E.J.; Noel, P.B.; Munzel, D. Ultra Low Dose CT Pulmonary Angiography with Iterative Reconstruction. PLoS ONE 2016, 11, e0162716. [Google Scholar] [CrossRef] [Green Version]
  18. Laqmani, A.; Regier, M.; Veldhoen, S.; Backhaus, A.; Wassenberg, F.; Sehner, S.; Groth, M.; Nagel, H.-D.; Adam, G.; Henes, F.O. Improved image quality and low radiation dose with hybrid iterative reconstruction with 80 kV CT pulmonary angiography. Eur. J. Radiol. 2014, 83, 1962–1969. [Google Scholar] [CrossRef]
  19. Kaul, D.; Grupp, U.; Kahn, J.; Ghadjar, P.; Wiener, E.; Hamm, B.; Streitparth, F. Reducing radiation dose in the diagnosis of pulmonary embolism using adaptive statistical iterative reconstruction and lower tube potential in computed tomography. Eur. Radiol. 2014, 24, 2685–2691. [Google Scholar] [CrossRef] [PubMed]
  20. Gordic, S.; Desbiolles, L.; Stolzmann, P.; Gantner, L.; Leschka, S.; Husarik, D.B.; Alkadhi, H. Advanced modelled iterative reconstruction for abdominal CT: Qualitative and quantitative evaluation. Clin. Radiol. 2014, 69, e497–e504. [Google Scholar] [CrossRef]
  21. Uehara, M.; Tanabe, N.; Funabashi, N.; Takaoka, H.; Ikari, J.; Toyama, S.; Shimizu, H.; Hoshino, S.; Sugiura, T.; Saito, M. Detailed distribution of acute pulmonary thromboemboli: Direct evidence for reduction of acquisition length and radiation dose for triple rule-out CT angiography. Int. J. Cardiol. 2011, 147, 234–238. [Google Scholar] [CrossRef]
  22. Kallen, J.A.; Coughlin, B.F.; O’Loughlin, M.T.; Stein, B. Reduced Z-axis coverage multidetector CT angiography for suspected acute pulmonary embolism could decrease dose and maintain diagnostic accuracy. Emerg. Radiol. 2010, 17, 31. [Google Scholar] [CrossRef]
  23. Remy-Jardin, M.; Pistolesi, M.; Goodman, L.R.; Gefter, W.B.; Gottschalk, A.; Mayo, J.R.; Sostman, H.D. Management of suspected acute pulmonary embolism in the era of CT angiography: A statement from the Fleischner Society. Radiology 2007, 245, 315–329. [Google Scholar] [CrossRef] [PubMed]
  24. Prologo, J.D.; Gilkeson, R.C.; Diaz, M.; Cummings, M. The effect of single-detector CT versus MDCT on clinical outcomes in patients with suspected acute pulmonary embolism and negative results on CT pulmonary angiography. Am. J. Roentgenol. 2005, 184, 1231–1235. [Google Scholar] [CrossRef] [PubMed]
  25. Koo, S.; Kucher, N.; Nguyen, P.L.; Fanikos, J.; Marks, P.W.; Goldhaber, S.Z. The effect of excessive anticoagulation on mortality and morbidity in hospitalized patients with anticoagulant-related major hemorrhage. Arch. Intern. Med. 2004, 164, 1557–1560. [Google Scholar] [CrossRef] [Green Version]
  26. Suh, J.M.; Cronan, J.J.; Healey, T.T. Dots are not clots: The over-diagnosis and over-treatment of PE. Emerg. Radiol. 2010, 17, 347–352. [Google Scholar] [CrossRef] [PubMed]
  27. Oden, A.; Fahlen, M. Oral anticoagulation and risk of death: A medical record linkage study. Br. Med. J. 2002, 325, 1073–1075. [Google Scholar] [CrossRef] [Green Version]
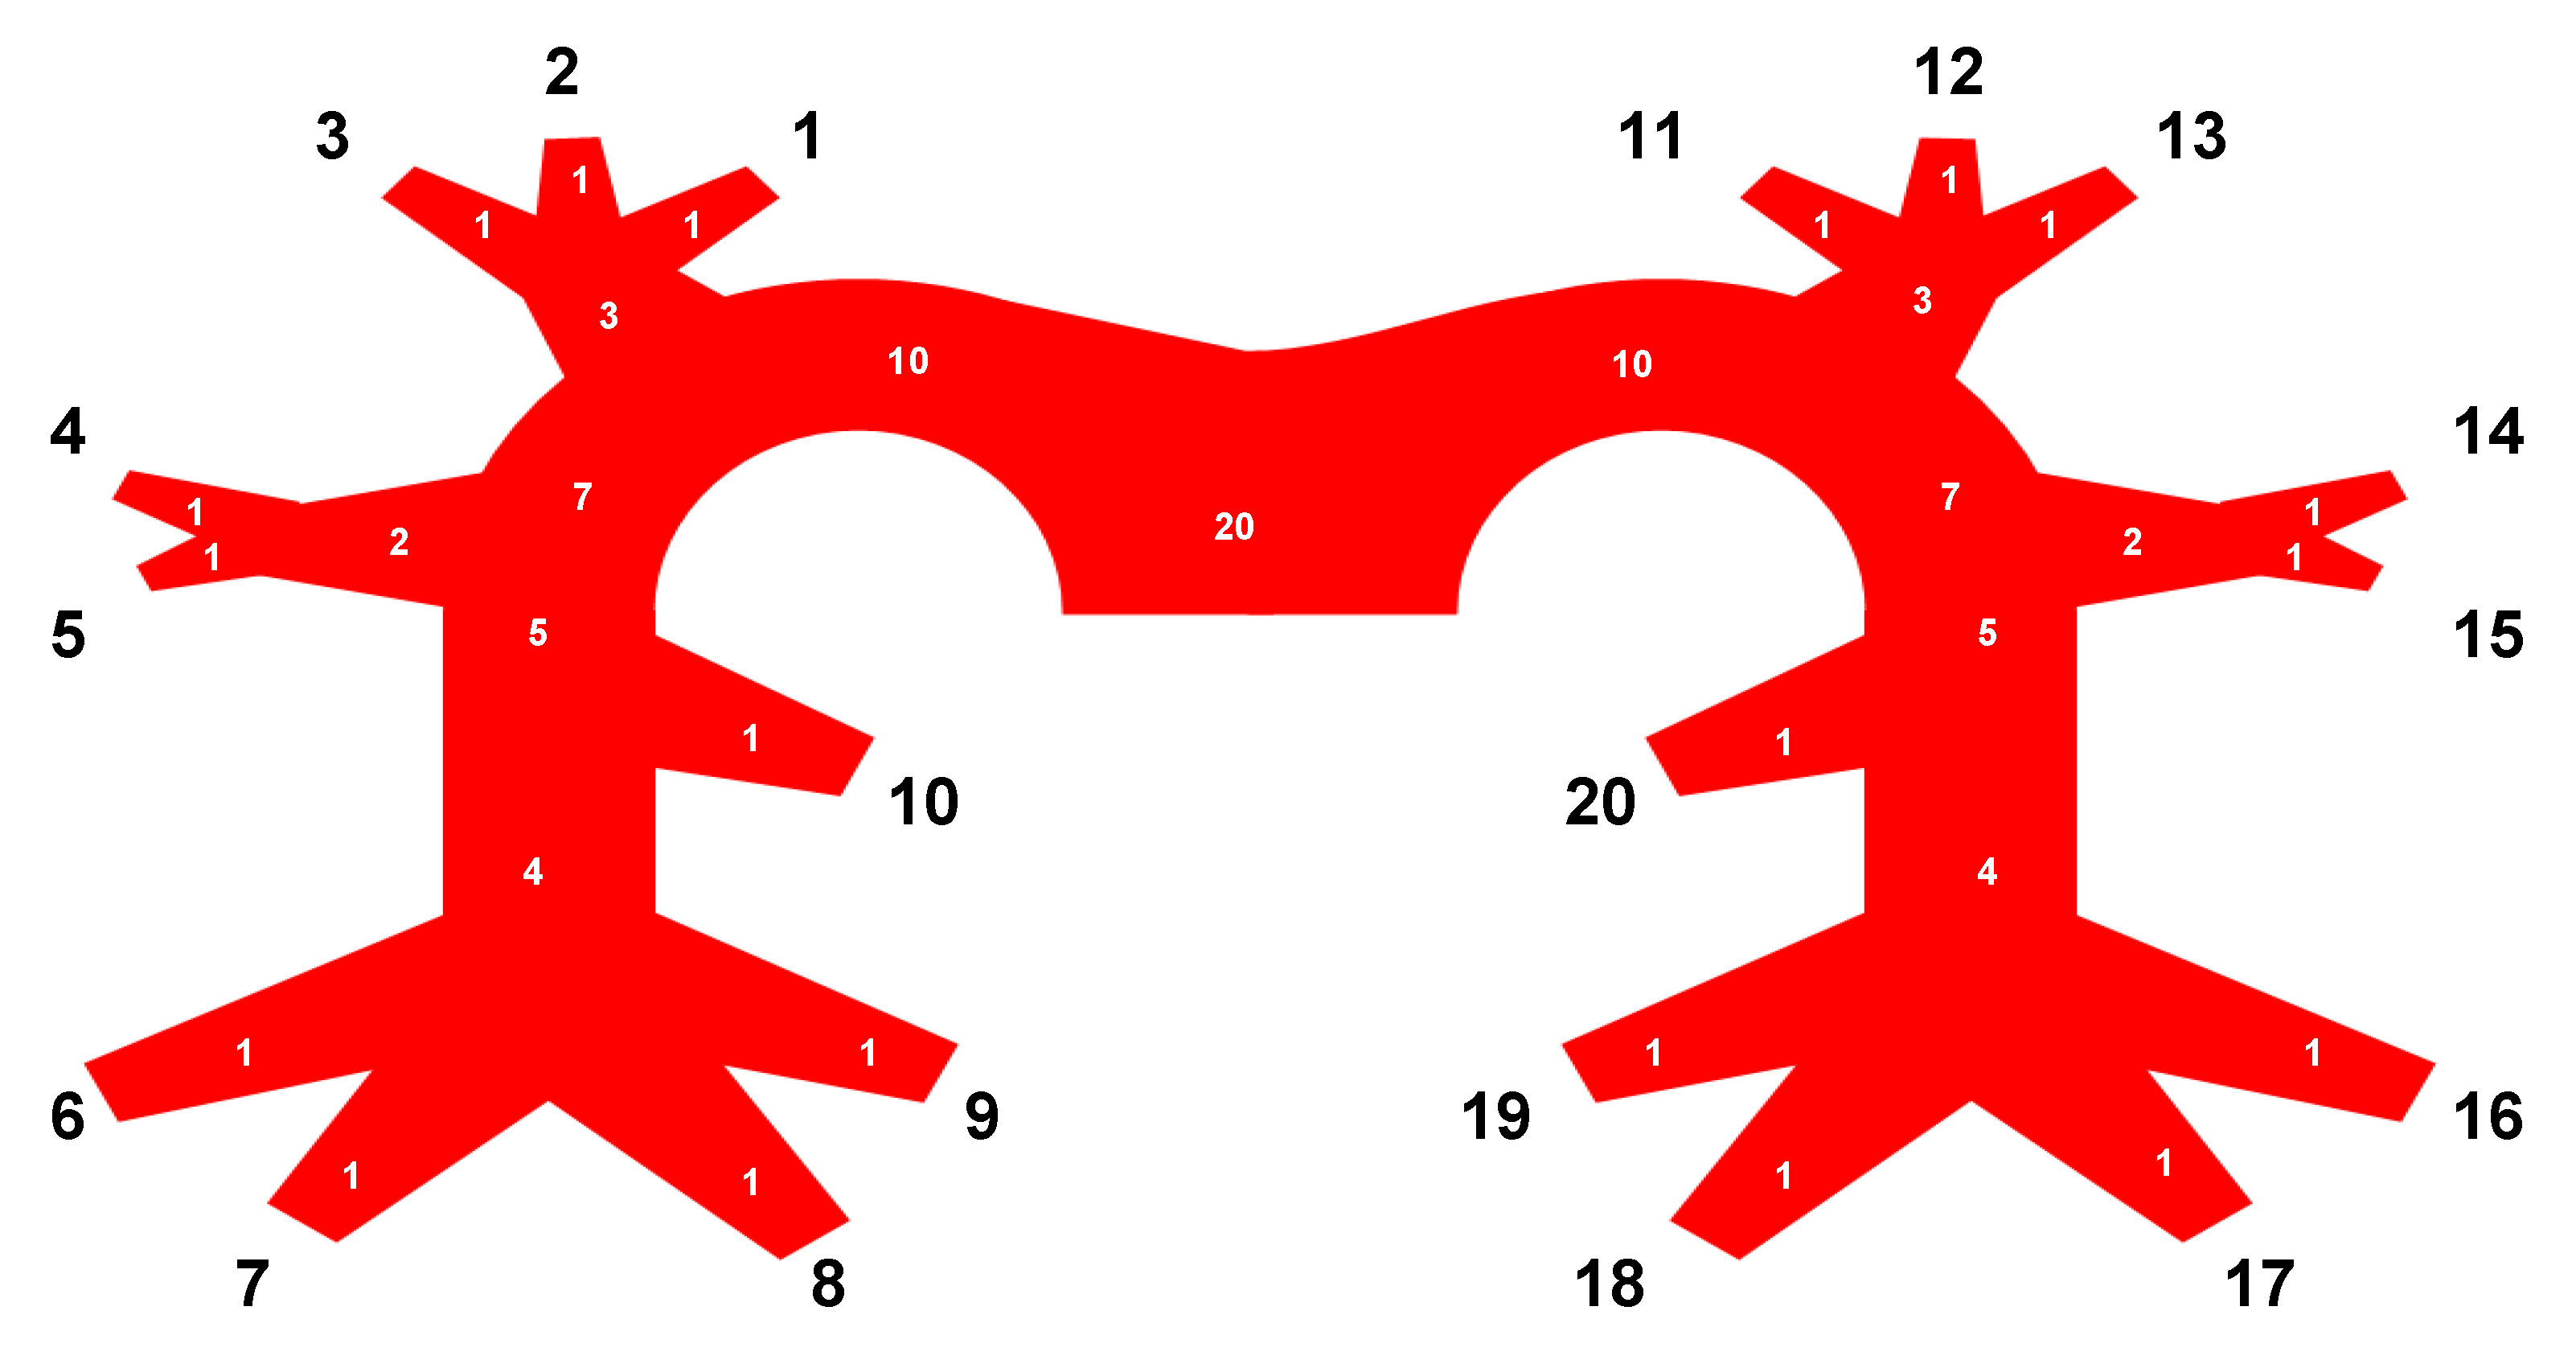
Figure 1. Patient enrollment and study workflow.
Diagnostics 11 01251 g001
Figure 2. Pulmonary tree with vessel segments (black numbers) and modified Qanadli score points (white numbers) [15].
Diagnostics 11 01251 g002
Figure 3. Visualization of scan lengths in full and reduced range protocol.
Diagnostics 11 01251 g003
Figure 4. Comparison of image quality and diagnostic confidence.
Diagnostics 11 01251 g004
Figure 5. Image Noise.
Diagnostics 11 01251 g005
Figure 6. Diagnostic accuracy for PE in standard protocol vs. ULD protocol.
Diagnostics 11 01251 g006
Table 1. Definitions of pulmonary vessel segments.
#LobeVessel Segment#LobeVessel Segment
1RULAnterior segment11LULAnterior segment
2RULApical segment12LULAnterior apical segment
3RULPosterior segment13LULApical posterior segment
4RMLApical segment14LULApical lingula segment
5RMLBasal segment15LULBasal lingula segment
6RLLLateral basal segment16LLLLateral segment
7RLLAnterior basal segment17LLLAnteromedial segment
8RLLMedial basal segment18LLLPosteromedial segment
9RLLPosterior basal segment19LLLPosterolateral segment
10RLLSuperior segment20LLLSuperior segment
Table 2. Patient characteristics and radiation dose.
ParameterMaleFemaleTotal
Patient population
Absolute (n)6169130
Reconstructions (n)122138260
Mean age (y)65 ± 1663 ± 1864 ± 16
Mean BMI27.7 ± 2.427.6 ± 1.727.7 ± 2.1
Contrast medium (mL)62 ± 2154 ± 2058 ± 20
Scan range
Mean scan range in standard protocol (cm)29.7 ± 4.128.7 ± 4.129.2 ± 4.1
Mean scan range in ULD protocol (cm)18.7 ± 2.717.9 ± 2.718.3 ± 2.7
Diagnosis (n)
Pulmonary embolism202242
Other findings causative of acute thoracic symptoms
Pleural effusion222446
Pulmonary xongestion14923
Pulmonary infiltrate7310
Pneumothorax426
No causative findings123
kV108 (80–120)104 (80–120)106 (80–120)
mAs197190193
mAs ref180180180
CTDI6.93 ± 2.767.07 ± 3.57 ± 3.17
DLP (mGy)243.4 ± 96.31236.26 ± 91.86239.61 ± 95.82
Mean effective radiation dose (ED)
Standard protocol (100% mAs, ADMIRE 3, full scan range)4.0 ± 1.64.6 ± 1.84.3 ± 1.7
ULD protocol (25% mAs, ADMIRE 5, reduced scan range)0.7 ± 0.30.8 ± 0.30.7 ± 0.3
Table 3. Ratings of image quality and diagnostic confidence.
ProtocolEDRatingICCICC: 95% CIStandard vs. ULD
(mSv)MedianIQRAv. MeasureLower BoundUpper Boundpr
Image qualityStandard4.3 ± 1.75450.9710.9610.9790.486>0.5
ULD0.7 ± 0.34350.9670.9560.976
Diagnostic ConfidenceStandard4.3 ± 1.75450.9790.9550.9750.28>0.5
ULD0.7 ± 0.34450.9530.9370.965
Table 4. ULD—Patient-Based Sensitivity and Specificity.
ProtocolED ValueICC: 95% CI
(mSv)Patient-Based AnalysisLower BoundUpper Bound
ULD0.7 ± 0.3Sensitivity92.9%80.598.5
Specificity100%95.9100
Positive likelihood ratio
Negative likelihood ratio0.100.2
Disease prevalence32.3%24.441.1
Positive predictive value100%
Negative predictive value96.7%90.898.9
Accuracy97.7%93.499.5
Table 5. ULD—segment-based sensitivity and specificity.
ProtocolED ValueICC: 95% CI
(mSv)Segment-Based AnalysisLower BoundUpper Bound
ULD0.7 ± 0.3Sensitivity98.9%97.299.7
Specificity100%99.8100
Positive likelihood ratio
Negative likelihood ratio0.0100.3
Disease prevalence13.81%12.515.2
Positive predictive value100%
Negative predictive value99.8%99.599.9
Accuracy99.9%98.6100
Publisher’s Note: MDPI stays neutral with regard to jurisdictional claims in published maps and institutional affiliations.

