
Automated Adenoid Hypertrophy Assessment with Lateral Cephalometry in Children Based on Artificial Intelligence

 ,
, 
 and
and
Abstract
:1. Introduction
2. Materials and Methods
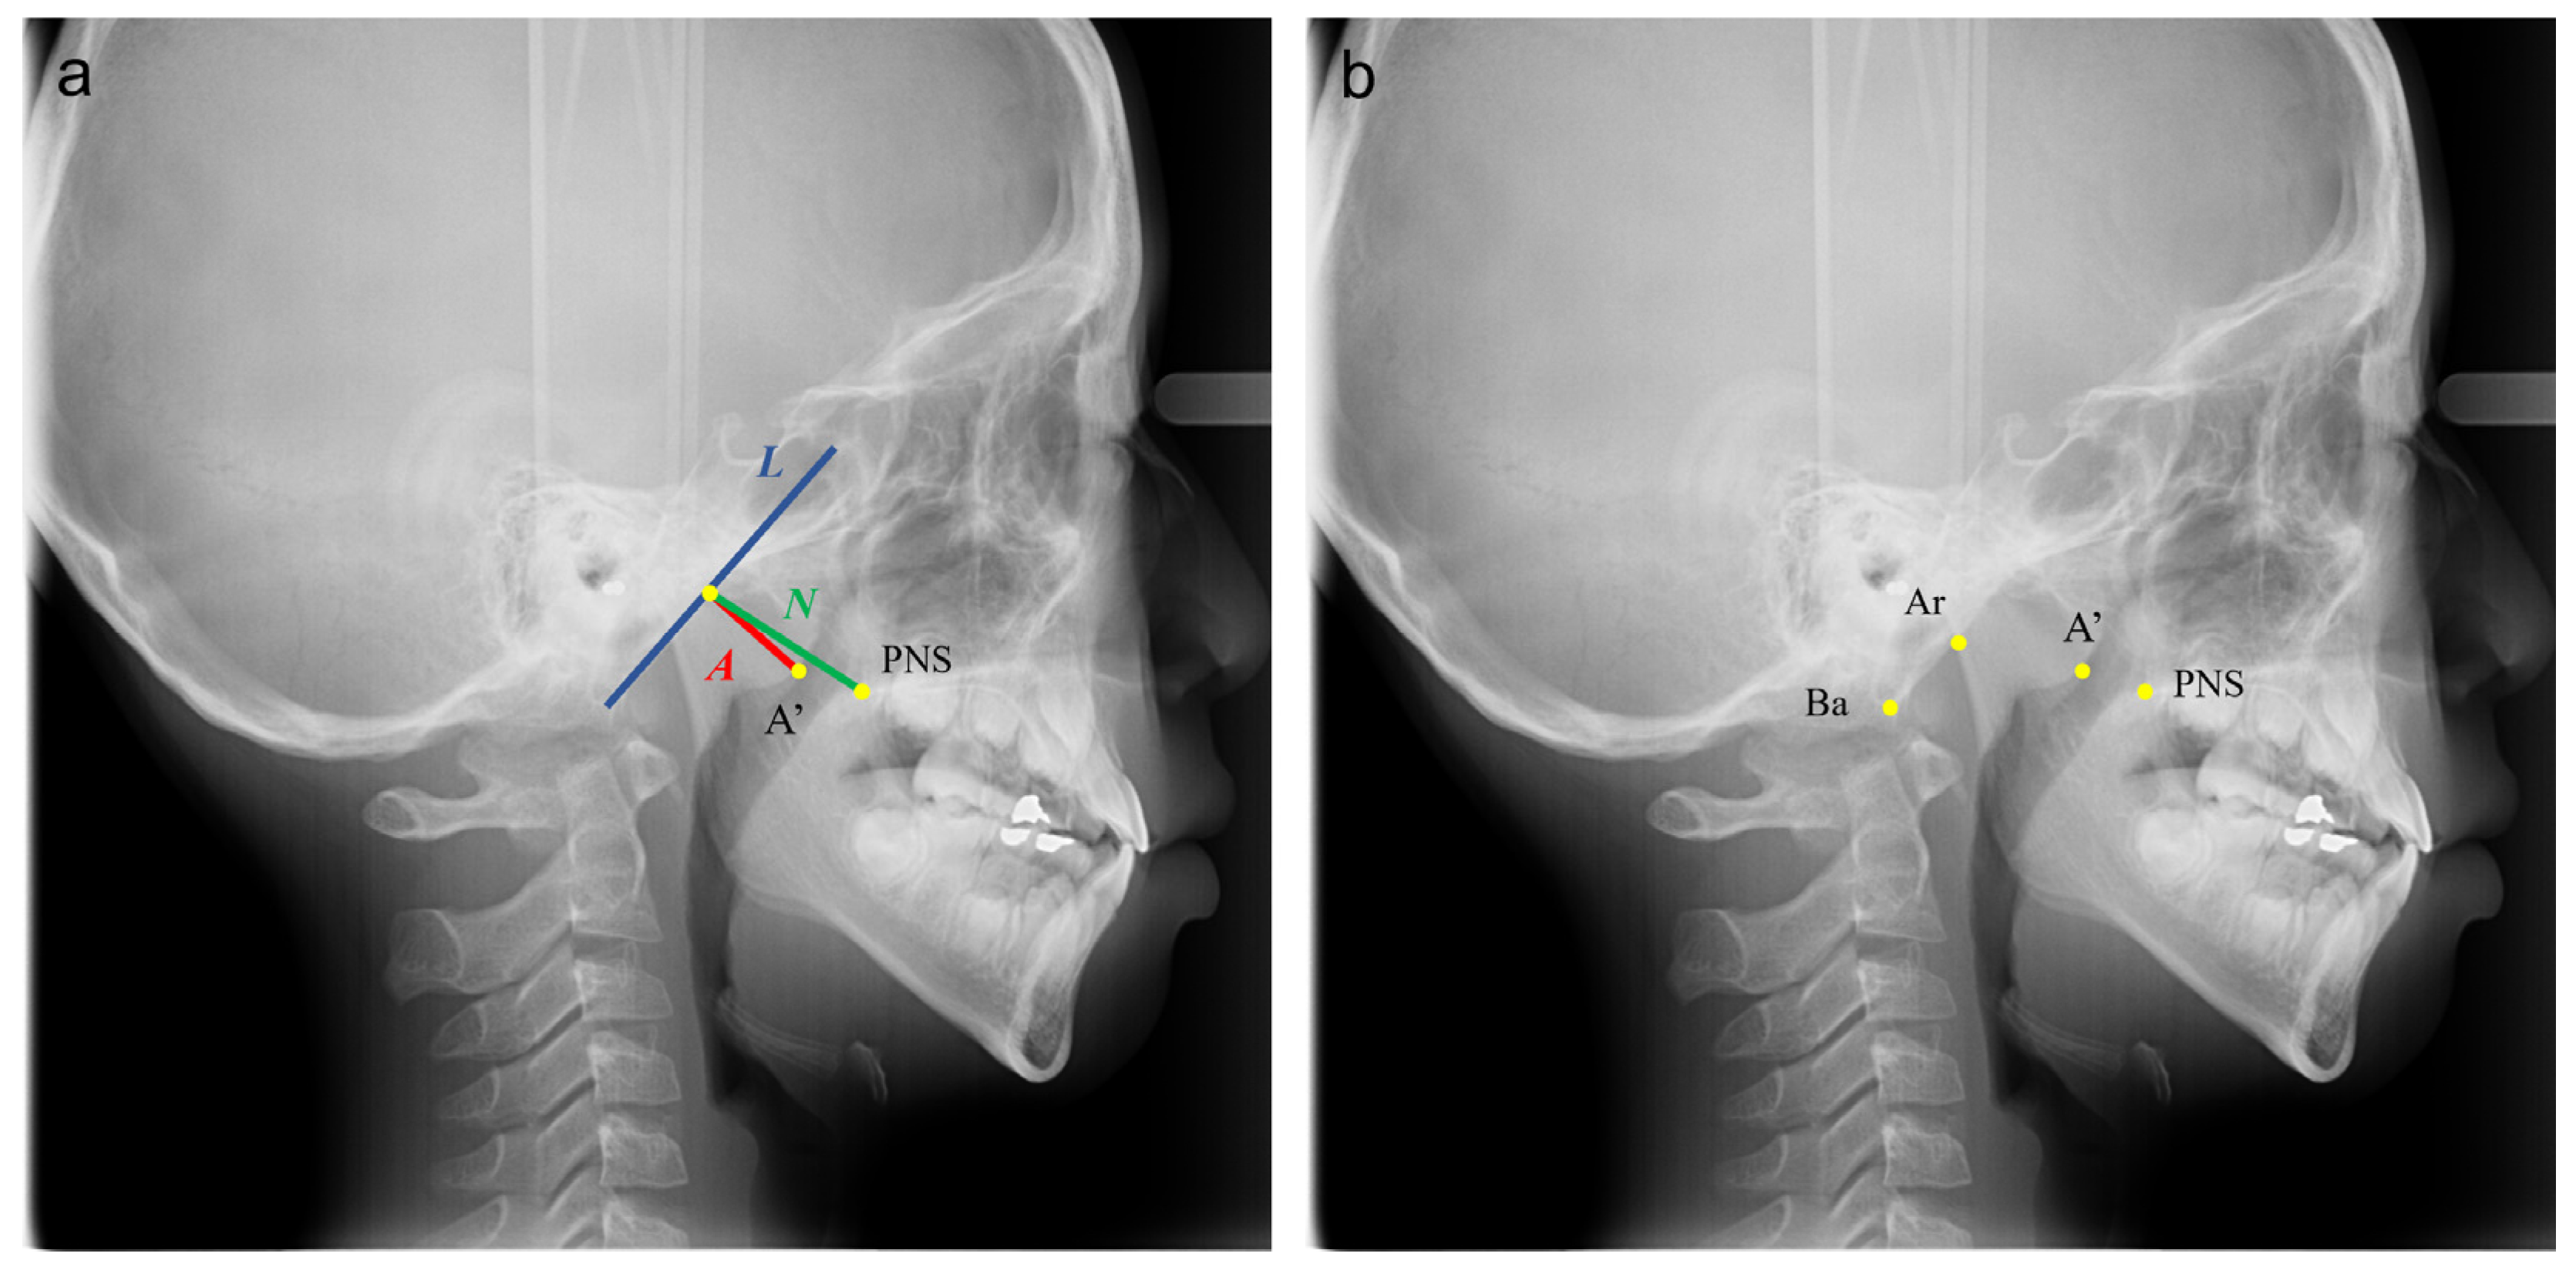
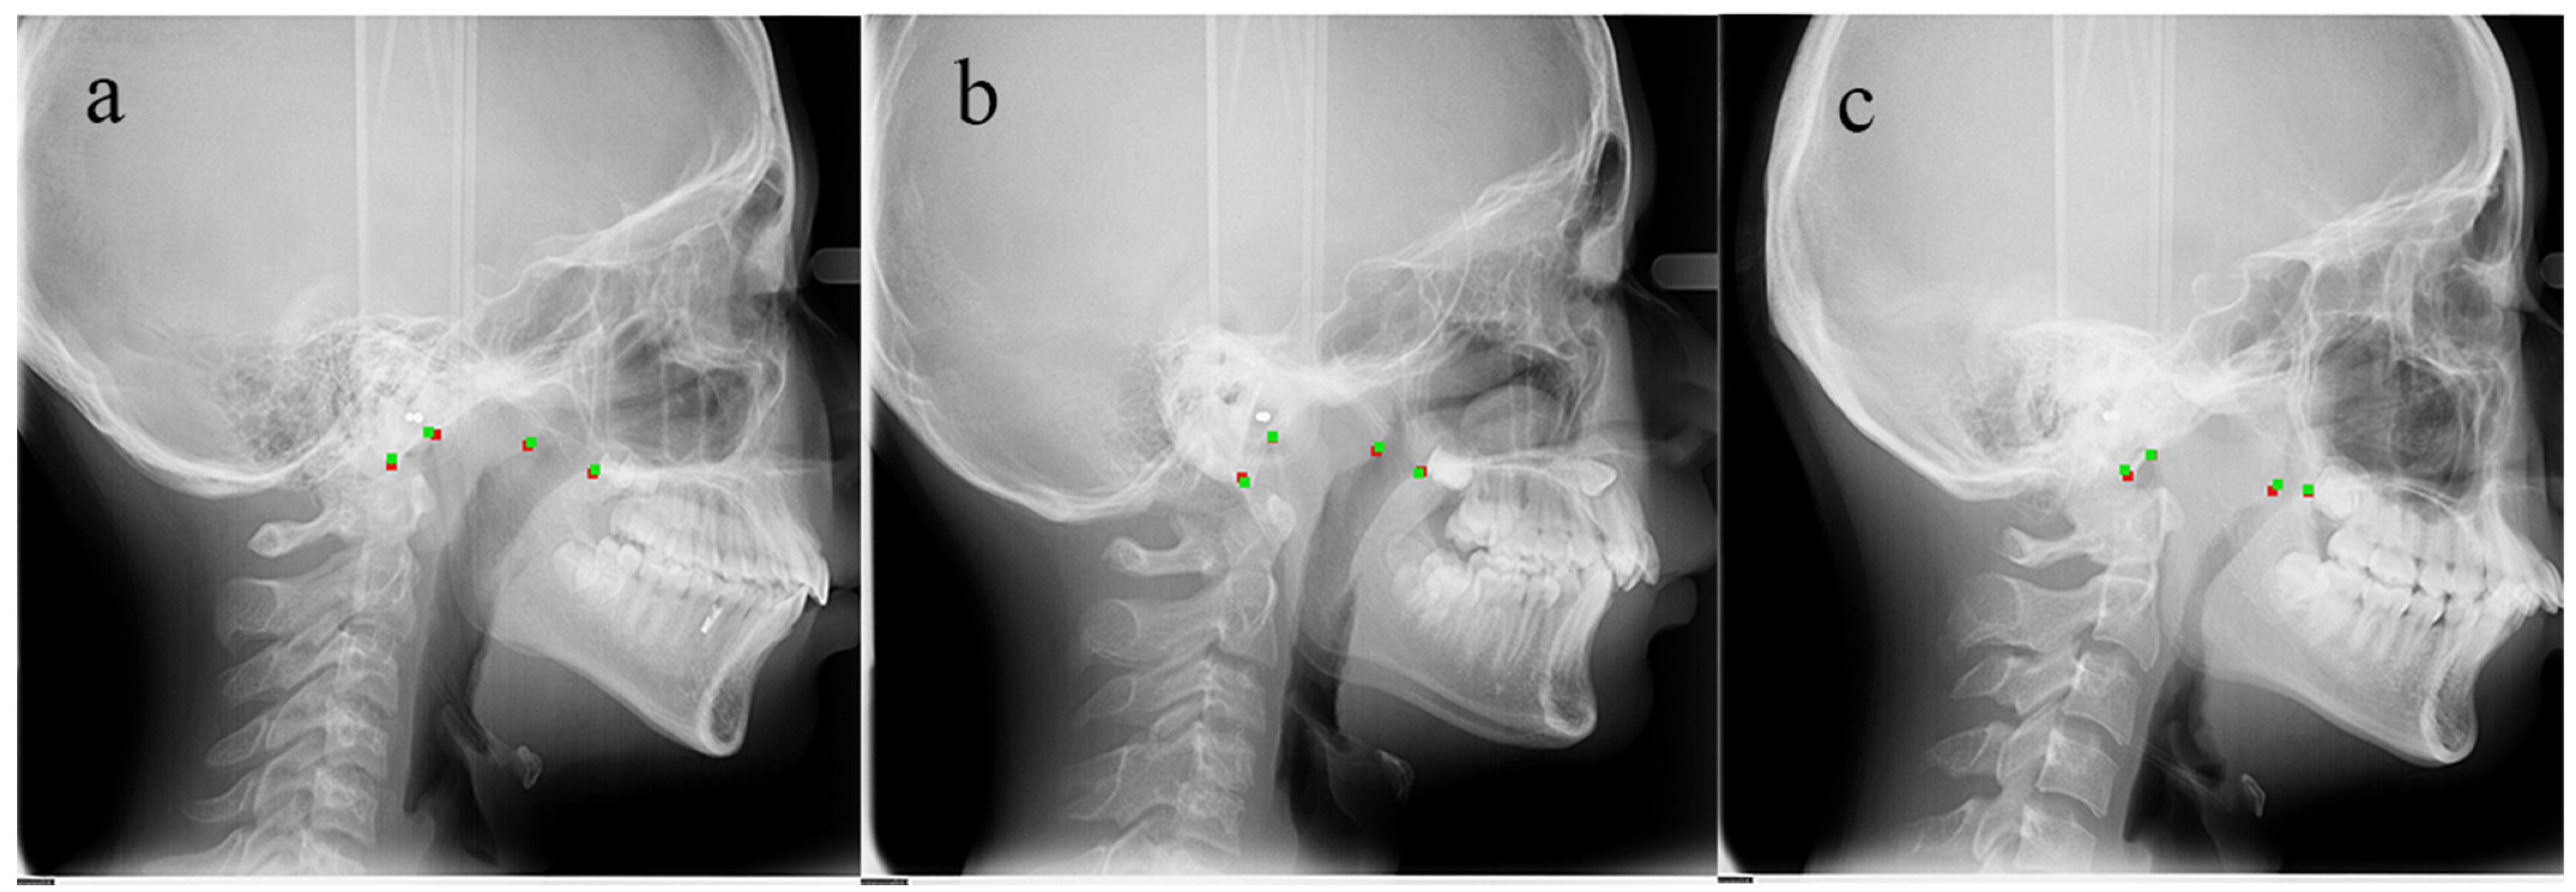
2.1. Samples and Identification of Landmarks
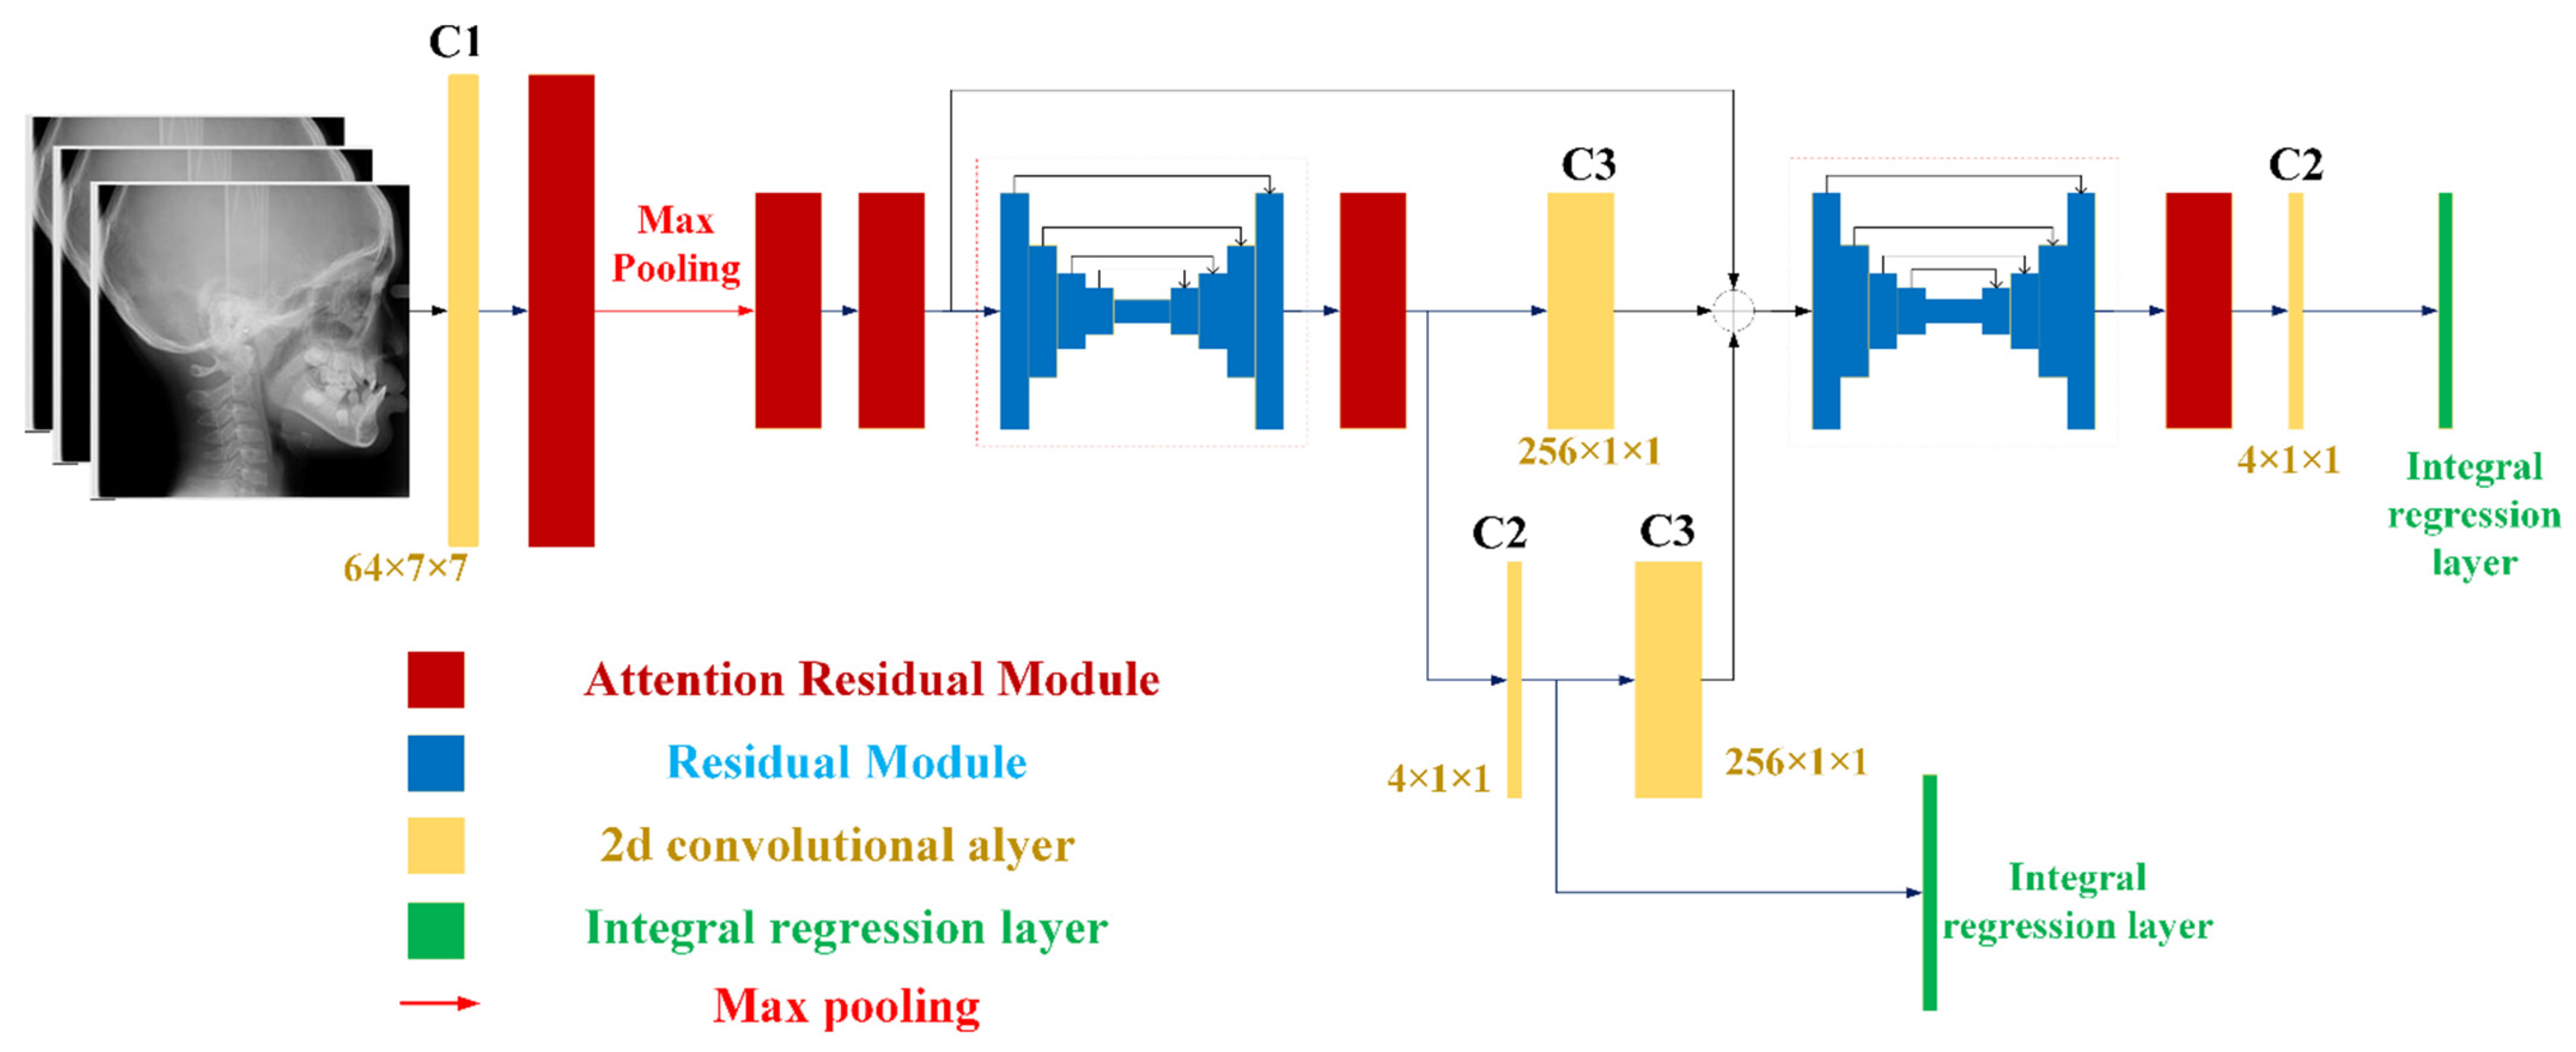
2.2. Model Architecture and Losses
2.3. Training Details
2.4. Statistical Analysis and Evaluation
3. Results
4. Discussion
5. Conclusions
Supplementary Materials
Author Contributions
Funding
Institutional Review Board Statement
Informed Consent Statement
Data Availability Statement
Conflicts of Interest
References
- Pereira, L.; Monyror, J.; Almeida, F.; Almeida, F.R.; Guerra, E.N.S.; Flores-Mir, C.; Pachêco-Pereira, C. Prevalence of adenoid hypertrophy: A systematic review and meta-analysis. Sleep Med. Rev. 2018, 38, 101–112. [Google Scholar] [CrossRef]
- Marcus, C.L.; Brooks, L.J.; Draper, K.A.; Gozal, D.; Halbower, A.C.; Jones, J.; Schechter, M.S.; Sheldon, S.H.; Spruyt, K.; Ward, S.D.; et al. Diagnosis and Management of Childhood Obstructive Sleep Apnea Syndrome. Pediatrics 2012, 130, 576–584. [Google Scholar] [CrossRef] [Green Version]
- Macari, A.T.; Haddad, R.V. The case for environmental etiology of malocclusion in modern civilizations—Airway morphology and facial growth. Semin. Orthod. 2016, 22, 223–233. [Google Scholar] [CrossRef]
- Zhao, T.; Ngan, P.; Hua, F.; Zheng, J.; Zhou, S.; Zhang, M.; Xiong, H.; He, H. Impact of pediatric obstructive sleep apnea on the development of Class II hyperdivergent patients receiving orthodontic treatment. Angle Orthod. 2018, 88, 560–566. [Google Scholar] [CrossRef] [Green Version]
- Farber, J.M.; Schechter, M.S.; Marcus, C.L. Clinical practice guideline: Diagnosis and management of childhood obstructive sleep apnea syndrome. Pediatrics 2002, 110, 1255–1257. [Google Scholar] [CrossRef]
- Hodges, E.; Marcus, C.L.; Kim, J.Y.; Xanthopoulos, M.; Shults, J.; Giordani, B.; Beebe, D.W.; Rosen, C.L.; Chervin, R.D.; Mitchell, R.B.; et al. Depressive symptomatology in school-aged children with obstructive sleep apnea syndrome: Incidence, demographic factors, and changes following a randomized controlled trial of adenotonsillectomy. Sleep 2018, 41, 1–8. [Google Scholar] [CrossRef]
- Esteller, E.; Villatoro, J.C.; Agüero, A.; Lopez, R.; Matiñó, E.; Argemi, J.; Girabent-Farrés, M. Obstructive sleep apnea syndrome and growth failure. Int. J. Pediatric Otorhinolaryngol. 2018, 108, 214–218. [Google Scholar] [CrossRef] [PubMed]
- Horiuchi, F.; Oka, Y.; Komori, K.; Tokui, Y.; Matsumoto, T.; Kawabe, K.; Ueno, S.-I. Effects of Adenotonsillectomy on Neurocognitive Function in Pediatric Obstructive Sleep Apnea Syndrome. Case Rep. Psychiatry 2014, 2014, 520215. [Google Scholar] [CrossRef] [PubMed] [Green Version]
- Fagundes, N.C.F.; Flores-Mir, C. Pediatric obstructive sleep apnea—Dental professionals can play a crucial role. Pediatr. Pulmonol. 2021. online ahead of print. [Google Scholar] [CrossRef]
- Brambilla, I.; Pusateri, A.; Pagella, F.; Caimmi, D.; Caimmi, S.; Licari, A.; Barberi, S.; Castellazzi, A.; Marseglia, G.L. Adenoids in children: Advances in immunology, diagnosis, and surgery. Clin. Anat. 2014, 27, 346–352. [Google Scholar] [CrossRef]
- Moideen, S.P.; Mytheenkunju, R.; Nair, A.G.; Mogarnad, M.; Afroze, M.K.H. Role of Adenoid-Nasopharyngeal Ratio in Assessing Adenoid Hypertrophy. Indian J. Otolaryngol. Head Neck Surg. 2019, 71, 469–473. [Google Scholar] [CrossRef] [PubMed]
- Soldatova, L.; Otero, H.J.; Saul, D.A.; Barrera, C.; Elden, L. Lateral Neck Radiography in Preoperative Evaluation of Adenoid Hypertrophy. Ann. Otol. Rhinol. Laryngol. 2019, 129, 482–488. [Google Scholar] [CrossRef] [PubMed]
- Duan, H.; Xia, L.; He, W.; Lin, Y.; Lu, Z.; Lan, Q. Accuracy of lateral cephalogram for diagnosis of adenoid hypertrophy and posterior upper airway obstruction: A meta-analysis. Int. J. Pediatr. Otorhinolaryngol. 2019, 119, 1–9. [Google Scholar] [CrossRef]
- Fujioka, M.; Young, L.W.; Girdany, B.R. Radiographic evaluation of adenoidal size in children: Adenoidal-nasopharyngeal ratio. Am. J. Roentgenol. 1979, 133, 401–404. [Google Scholar] [CrossRef] [PubMed]
- Schwendicke, F.; Samek, W.; Krois, J. Artificial Intelligence in Dentistry: Chances and Challenges. J. Dent. Res. 2020, 99, 769–774. [Google Scholar] [CrossRef]
- Yim, J.; Ju, J.; Jung, H.; Kim, J. Image Classification Using Convolutional Neural Networks With Multi-stage Feature. Adv. Intell. Syst. Comput. 2015, 587–594. [Google Scholar] [CrossRef]
- Torosdagli, N.; Liberton, D.K.; Verma, P.; Sincan, M.; Lee, J.S.; Bagci, U. Deep Geodesic Learning for Segmentation and Anatomical Landmarking. IEEE Trans. Med. Imaging 2018, 38, 919–931. [Google Scholar] [CrossRef] [PubMed]
- Yu, H.; Cho, S.; Kim, M.; Kim, W.; Kim, J.; Choi, J. Automated Skeletal Classification with Lateral Cephalometry Based on Artificial Intelligence. J. Dent. Res. 2020, 99, 249–256. [Google Scholar] [CrossRef]
- Kunz, F.; Stellzig-Eisenhauer, A.; Zeman, F.; Boldt, J. Artificial intelligence in orthodontics. J. Orofac. Orthop. Fortschr. Kieferorthopädie 2019, 81, 52–68. [Google Scholar] [CrossRef]
- Hwang, H.-W.; Park, J.-H.; Moon, J.-H.; Yu, Y.; Kim, H.; Her, S.-B.; Srinivasan, G.; Aljanabi, M.N.A.; Donatelli, R.E.; Lee, S.-J. Automated Identification of Cephalometric Landmarks: Part 2- Might It Be Better Than human? Angle Orthod. 2020, 90, 69–76. [Google Scholar] [CrossRef] [PubMed] [Green Version]
- Shen, Y.; Li, X.; Liang, X.; Xu, H.; Li, C.; Yu, Y.; Qiu, B. A deep-learning-based approach for adenoid hypertrophy diagnosis. Med. Phys. 2020, 47, 2171–2181. [Google Scholar] [CrossRef] [PubMed]
- Shorten, C.; Khoshgoftaar, T.M. A survey on Image Data Augmentation for Deep Learning. J. Big Data 2019, 6, 60. [Google Scholar] [CrossRef]
- Woo, S.; Park, J.; Lee, J.-Y. CBAM: Convolutional Block Attention Module. In Proceedings of the Computer Vision, Munich, Germany, 8–14 September 2018; Springer: Cham, Switzerland; pp. 3–19. [Google Scholar] [CrossRef] [Green Version]
- Ling, H.; Wu, J.; Huang, J.; Chen, J.; Li, P. Attention-based convolutional neural network for deep face recognition. Multimed. Tools Appl. 2019, 79, 5595–5616. [Google Scholar] [CrossRef]
- Newell, A.; Yang, K.; Deng, J. Stacked hourglass networks for human pose estimation. In European Conference on Computer Vision; Springer: Cham, Switzerland, 2016; Volume 9912, pp. 483–499. [Google Scholar] [CrossRef] [Green Version]
- Sun, X.; Xiao, B.; Wei, F.; Liang, S.; Wei, Y. Integral Human Pose Regression. In Proceedings of the Computer Vision, Munich, Germany, 8–14 September 2018; Springer: Cham, Switzerland; pp. 536–553. [Google Scholar] [CrossRef] [Green Version]
- Gülehre, A.; Bengio, Y. Knowledge matters: Importance of prior information for optimization. J. Mach. Learn. Res. 2013, 17, 226–257. [Google Scholar]
- Sun, D.; Yao, A.; Zhou, A.; Zhao, H. Deeply-Supervised Knowledge Synergy. In Proceedings of the 2019 IEEE/CVF Conference on Computer Vision and Pattern Recognition (CVPR), Long Beach, CA, USA, 15–20 June 2019; pp. 6990–6999. [Google Scholar]
- Katyal, V.; Pamula, Y.; Martin, A.J.; Daynes, C.N.; Kennedy, J.D.; Sampson, W.J. Craniofacial and upper airway morphology in pediatric sleep-disordered breathing: Systematic review and meta-analysis. Am. J. Orthod. Dentofac. Orthop. 2013, 143, 20–30.e3. [Google Scholar] [CrossRef]
- Flores-Mir, C.; Korayem, M.; Heo, G.; Witmans, M.; Major, M.P.; Major, P.W. Craniofacial morphological characteristics in children with obstructive sleep apnea syndrome. J. Am. Dent. Assoc. 2013, 144, 269–277. [Google Scholar] [CrossRef] [PubMed]
- Gungor, A.Y.; Turkkahraman, H. Effects of Airway Problems on Maxillary Growth: A Review. Eur. J. Dent. 2009, 3, 250–254. [Google Scholar] [CrossRef] [Green Version]
- Pirilä-Parkkinen, K.; Löppönen, H.; Nieminen, P.; Tolonen, U.; Pirttiniemi, P. Cephalometric evaluation of children with nocturnal sleep-disordered breathing. Eur. J. Orthod. 2010, 32, 662–671. [Google Scholar] [CrossRef] [Green Version]
- Major, M.P.; Flores-Mir, C.; Major, P.W. Assessment of lateral cephalometric diagnosis of adenoid hypertrophy and posterior upper airway obstruction: A systematic review. Am. J. Orthod. Dentofac. Orthop. 2006, 130, 700–708. [Google Scholar] [CrossRef]
- Abtahi, S.; Witmans, M.; Alsufyani, N.A.; Major, M.P.; Major, P.W. Pediatric sleep-disordered breathing in the orthodontic population: Prevalence of positive risk and associations. Am. J. Orthod. Dentofac. Orthop. 2020, 157, 466–473.e1. [Google Scholar] [CrossRef]
- Behrents, R.G.; Shelgikar, A.V.; Conley, R.S.; Flores-Mir, C.; Hans, M.; Levine, M.; McNamara, J.A.; Palomo, J.M.; Pliska, B.; Stockstill, J.W.; et al. Obstructive sleep apnea and orthodontics: An American Association of Orthodontists White Paper. Am. J. Orthod. Dentofac. Orthop. 2019, 156, 13–28.e1. [Google Scholar] [CrossRef] [Green Version]
- Liu, J.; Li, S.; Cai, Y.; Lan, D.; Lu, Y.; Liao, W.; Ying, S.; Zhao, Z. Automated Radiographic Evaluation of Adenoid Hypertrophy Based on VGG-Lite. J. Dent. Res. 2021, 29. [Google Scholar] [CrossRef]
- Feng, X.; Li, G.; Qu, Z.; Liu, L.; Nässtrom, K.; Shi, X.-Q. Comparative analysis of upper airway volume with lateral cephalograms and cone-beam computed tomography. Am. J. Orthod. Dentofac. Orthop. 2015, 147, 197–204. [Google Scholar] [CrossRef] [PubMed]
- Schwendicke, F.; Singh, T.; Lee, J.-H.; Gaudin, R.; Chaurasia, A.; Wiegand, T.; Uribe, S.; Krois, J. Artificial intelligence in dental research: Checklist for authors, reviewers, readers. J. Dent. 2021, 107, 103610. [Google Scholar] [CrossRef]
- Grogger, P.; Sacher, C.; Weber, S.; Millesi, G.; Seemann, R. Identification of ‘Point A’ as the prevalent source of error in cephalometric analysis of lateral radiographs. Int. J. Oral Maxillofac. Surg. 2018, 47, 1322–1329. [Google Scholar] [CrossRef] [PubMed]


| Name | C1 | C2 | C3 | C4 | C5 | C6 | C7 |
|---|---|---|---|---|---|---|---|
| Output channels | 64 | 4 | 256 | 128 | 128 | 16 | 1 |
| Kernel size | 7 × 7 | 1 × 1 | 1 × 1 | 1 × 1 | 3 × 3 | 1 × 1 | 7 × 7 |
| Stride | 2 | 1 | 1 | 1 | 1 | 1 | 1 |
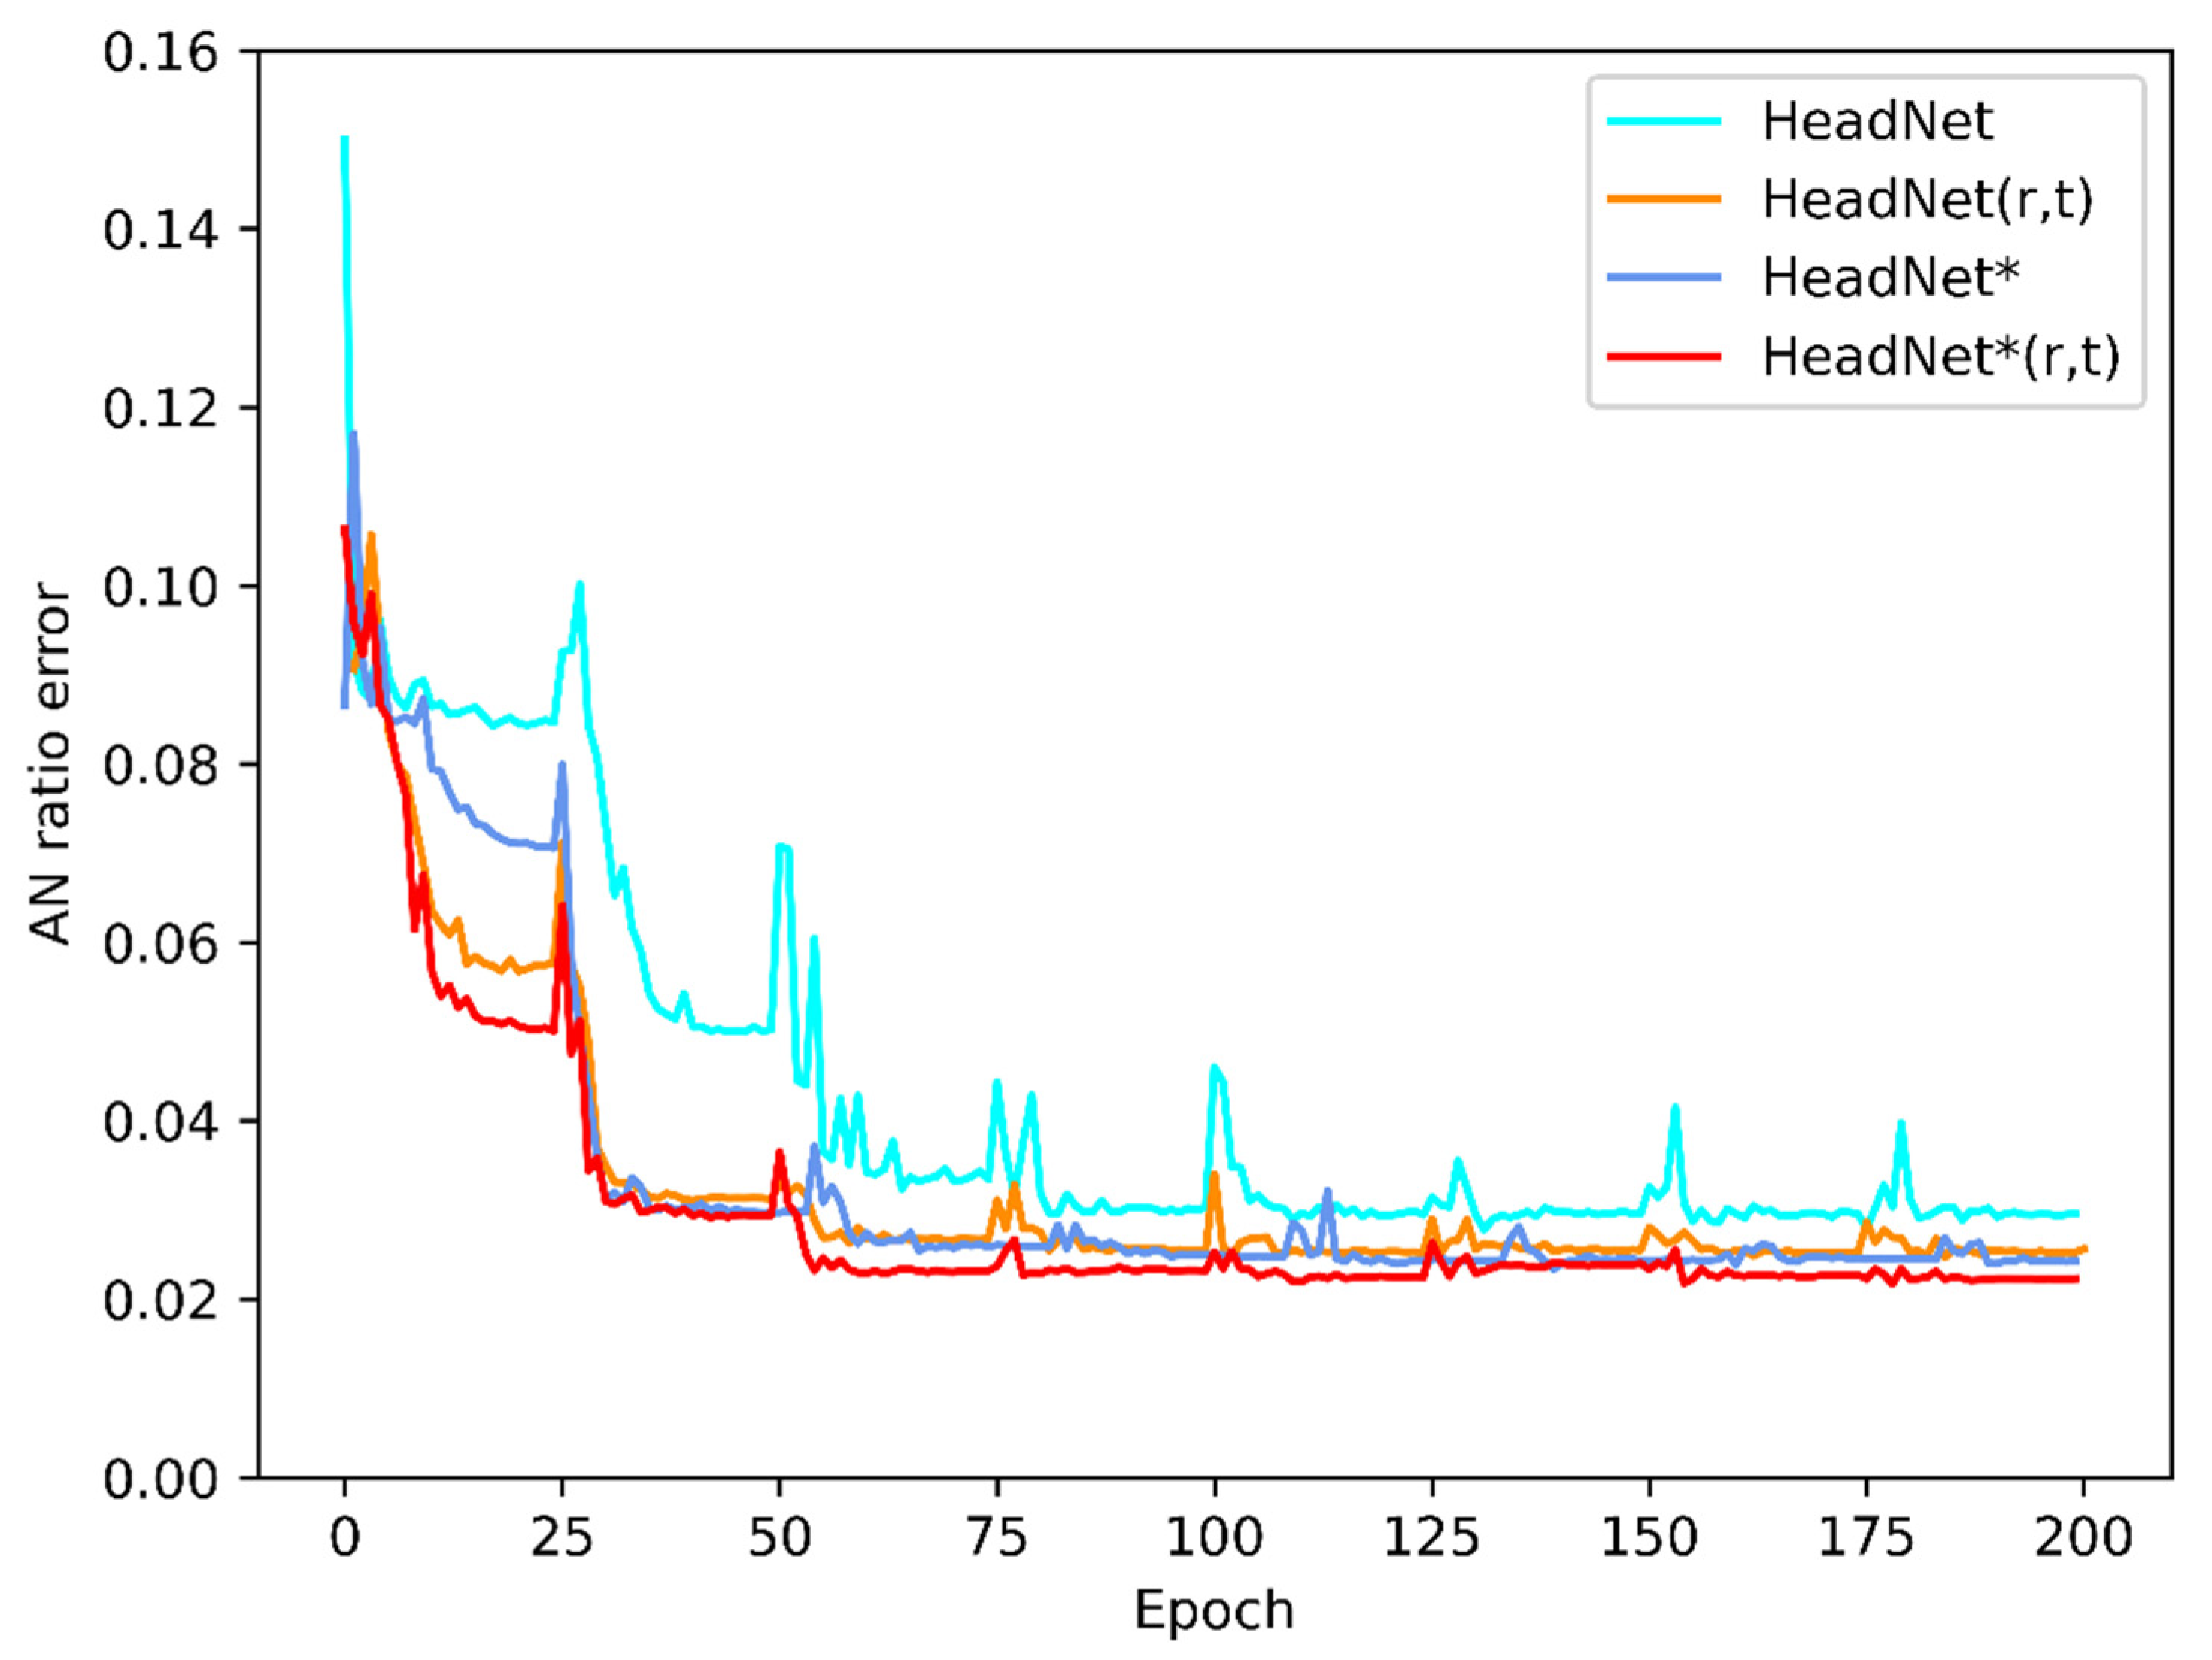
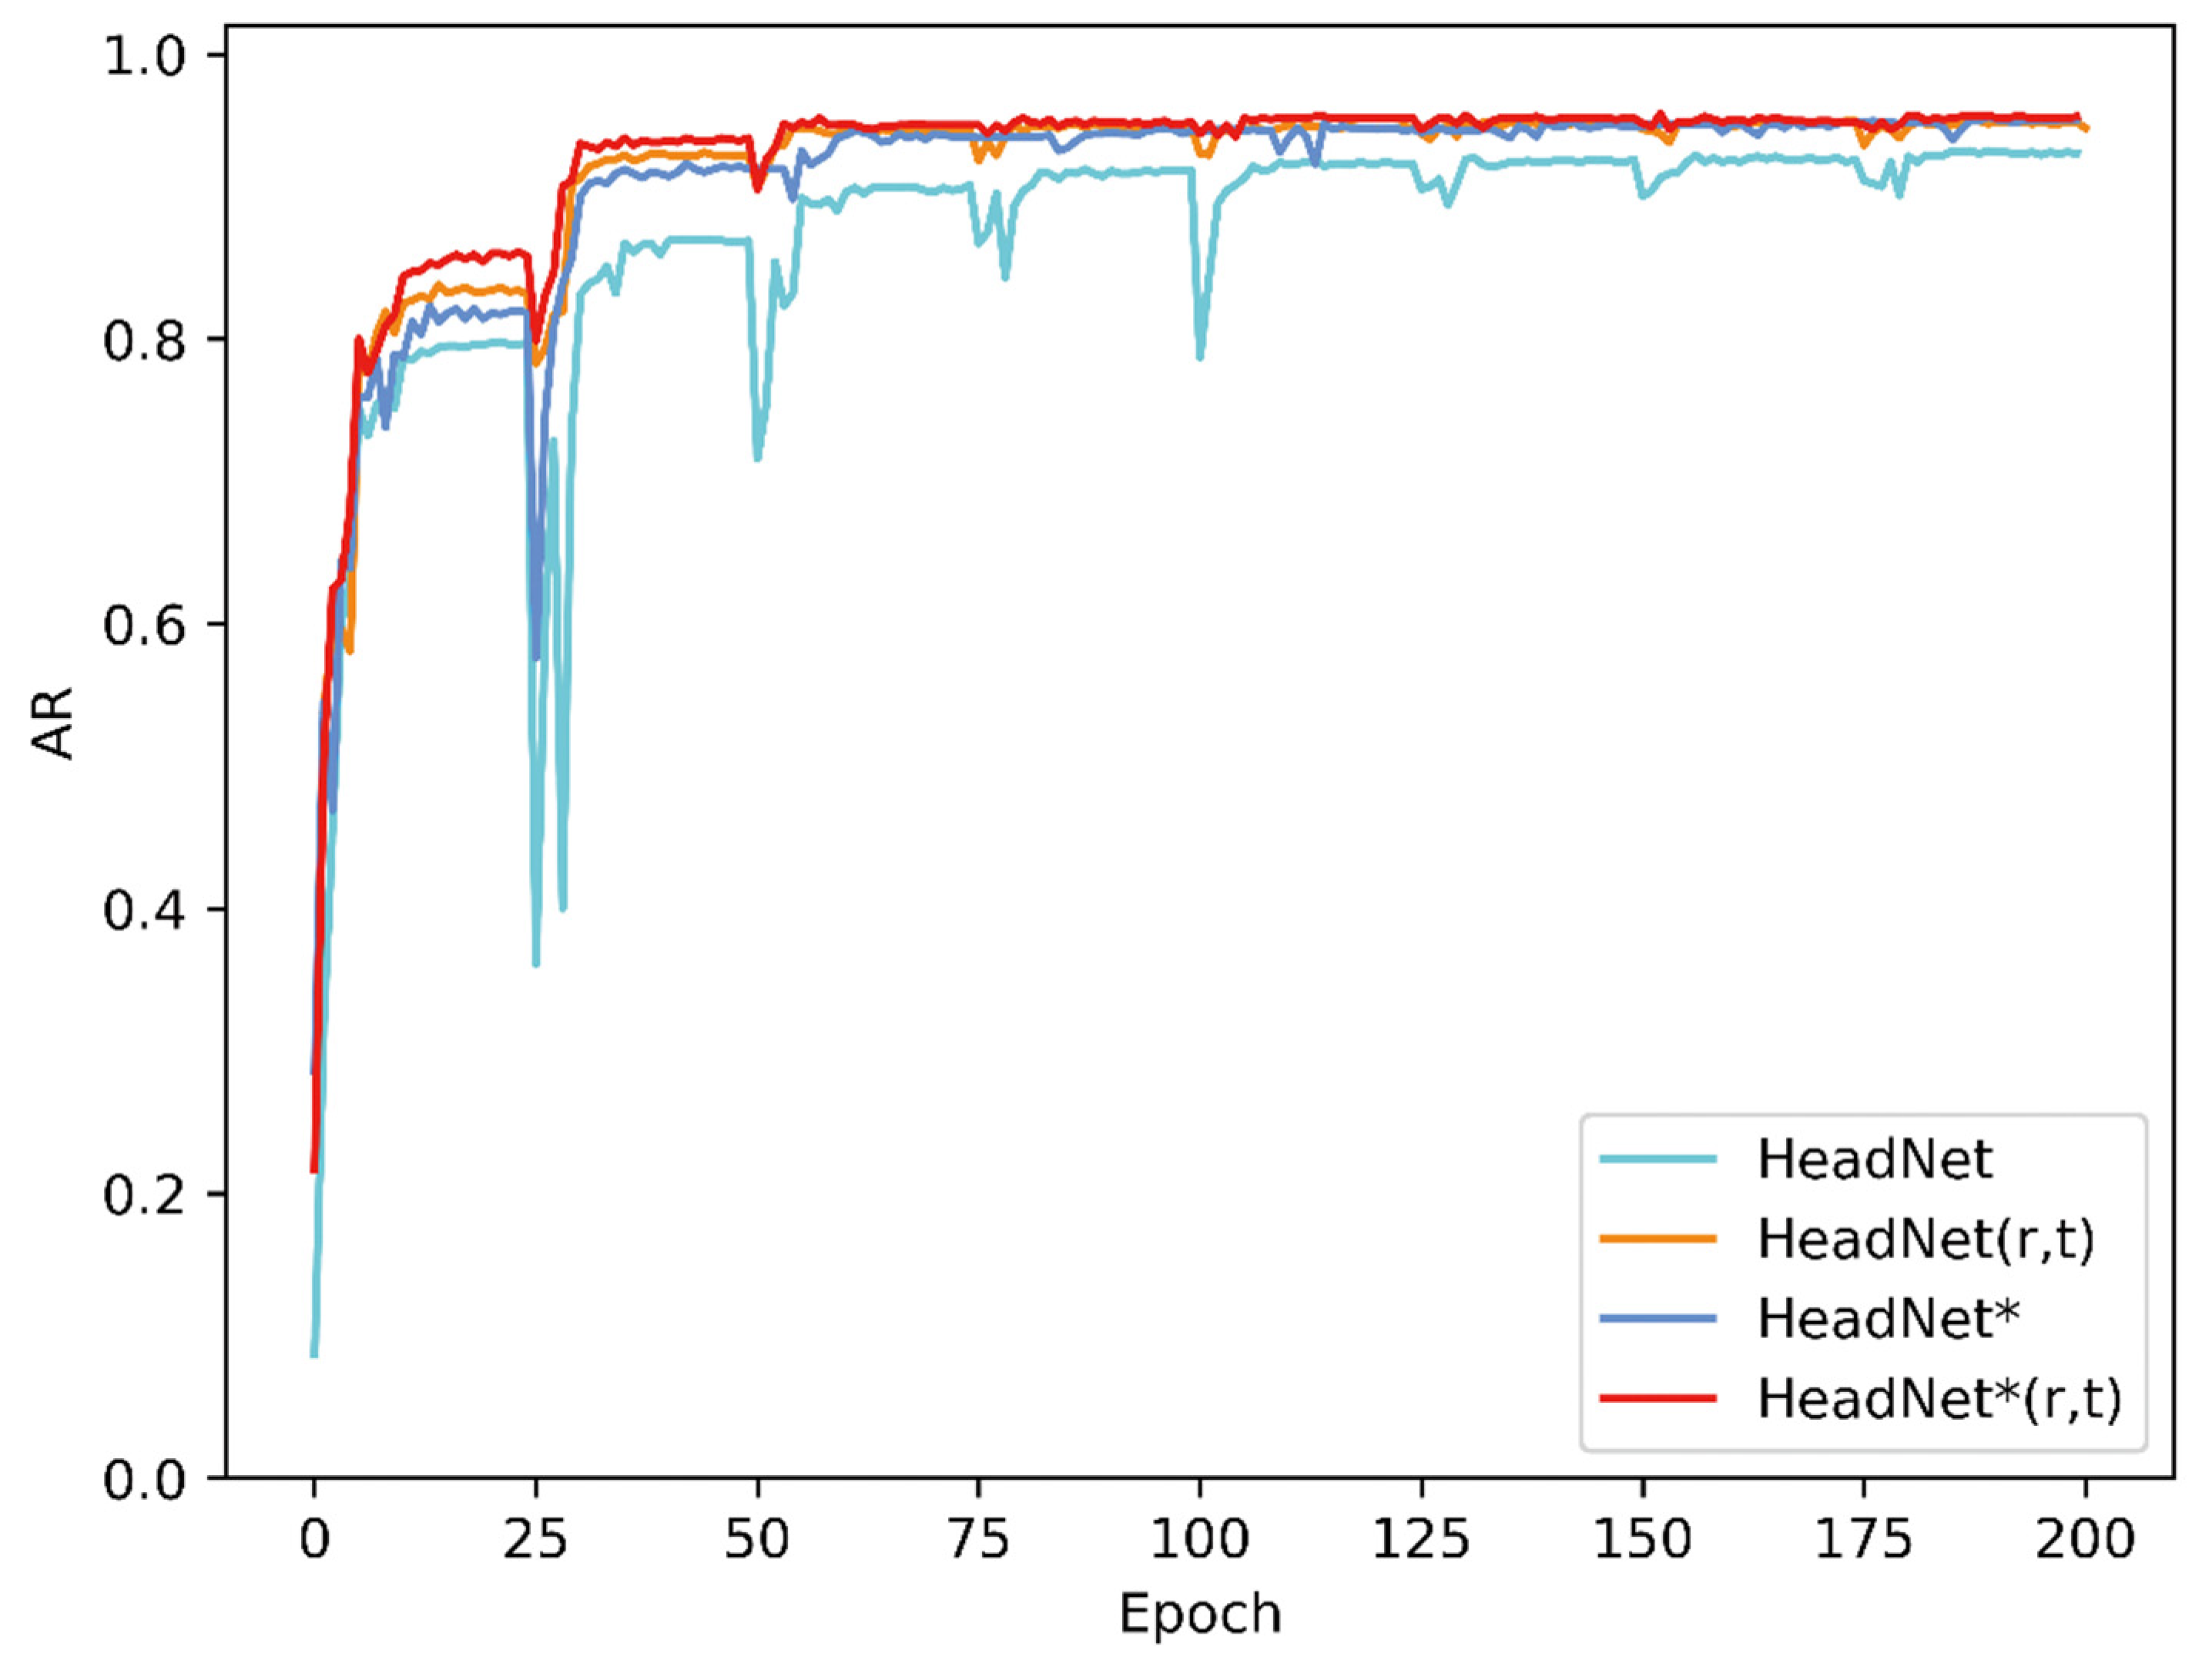
| Method | AP | F1-Score | A/N Error |
|---|---|---|---|
| HeadNet | 0.876 | 0.896 | 0.031 |
| HeadNet (r, t) | 0.910 | 0.928 | 0.027 |
| HeadNet * | 0.904 | 0.923 | 0.027 |
| HeadNet * (r, t) | 0.919 | 0.936 | 0.025 |
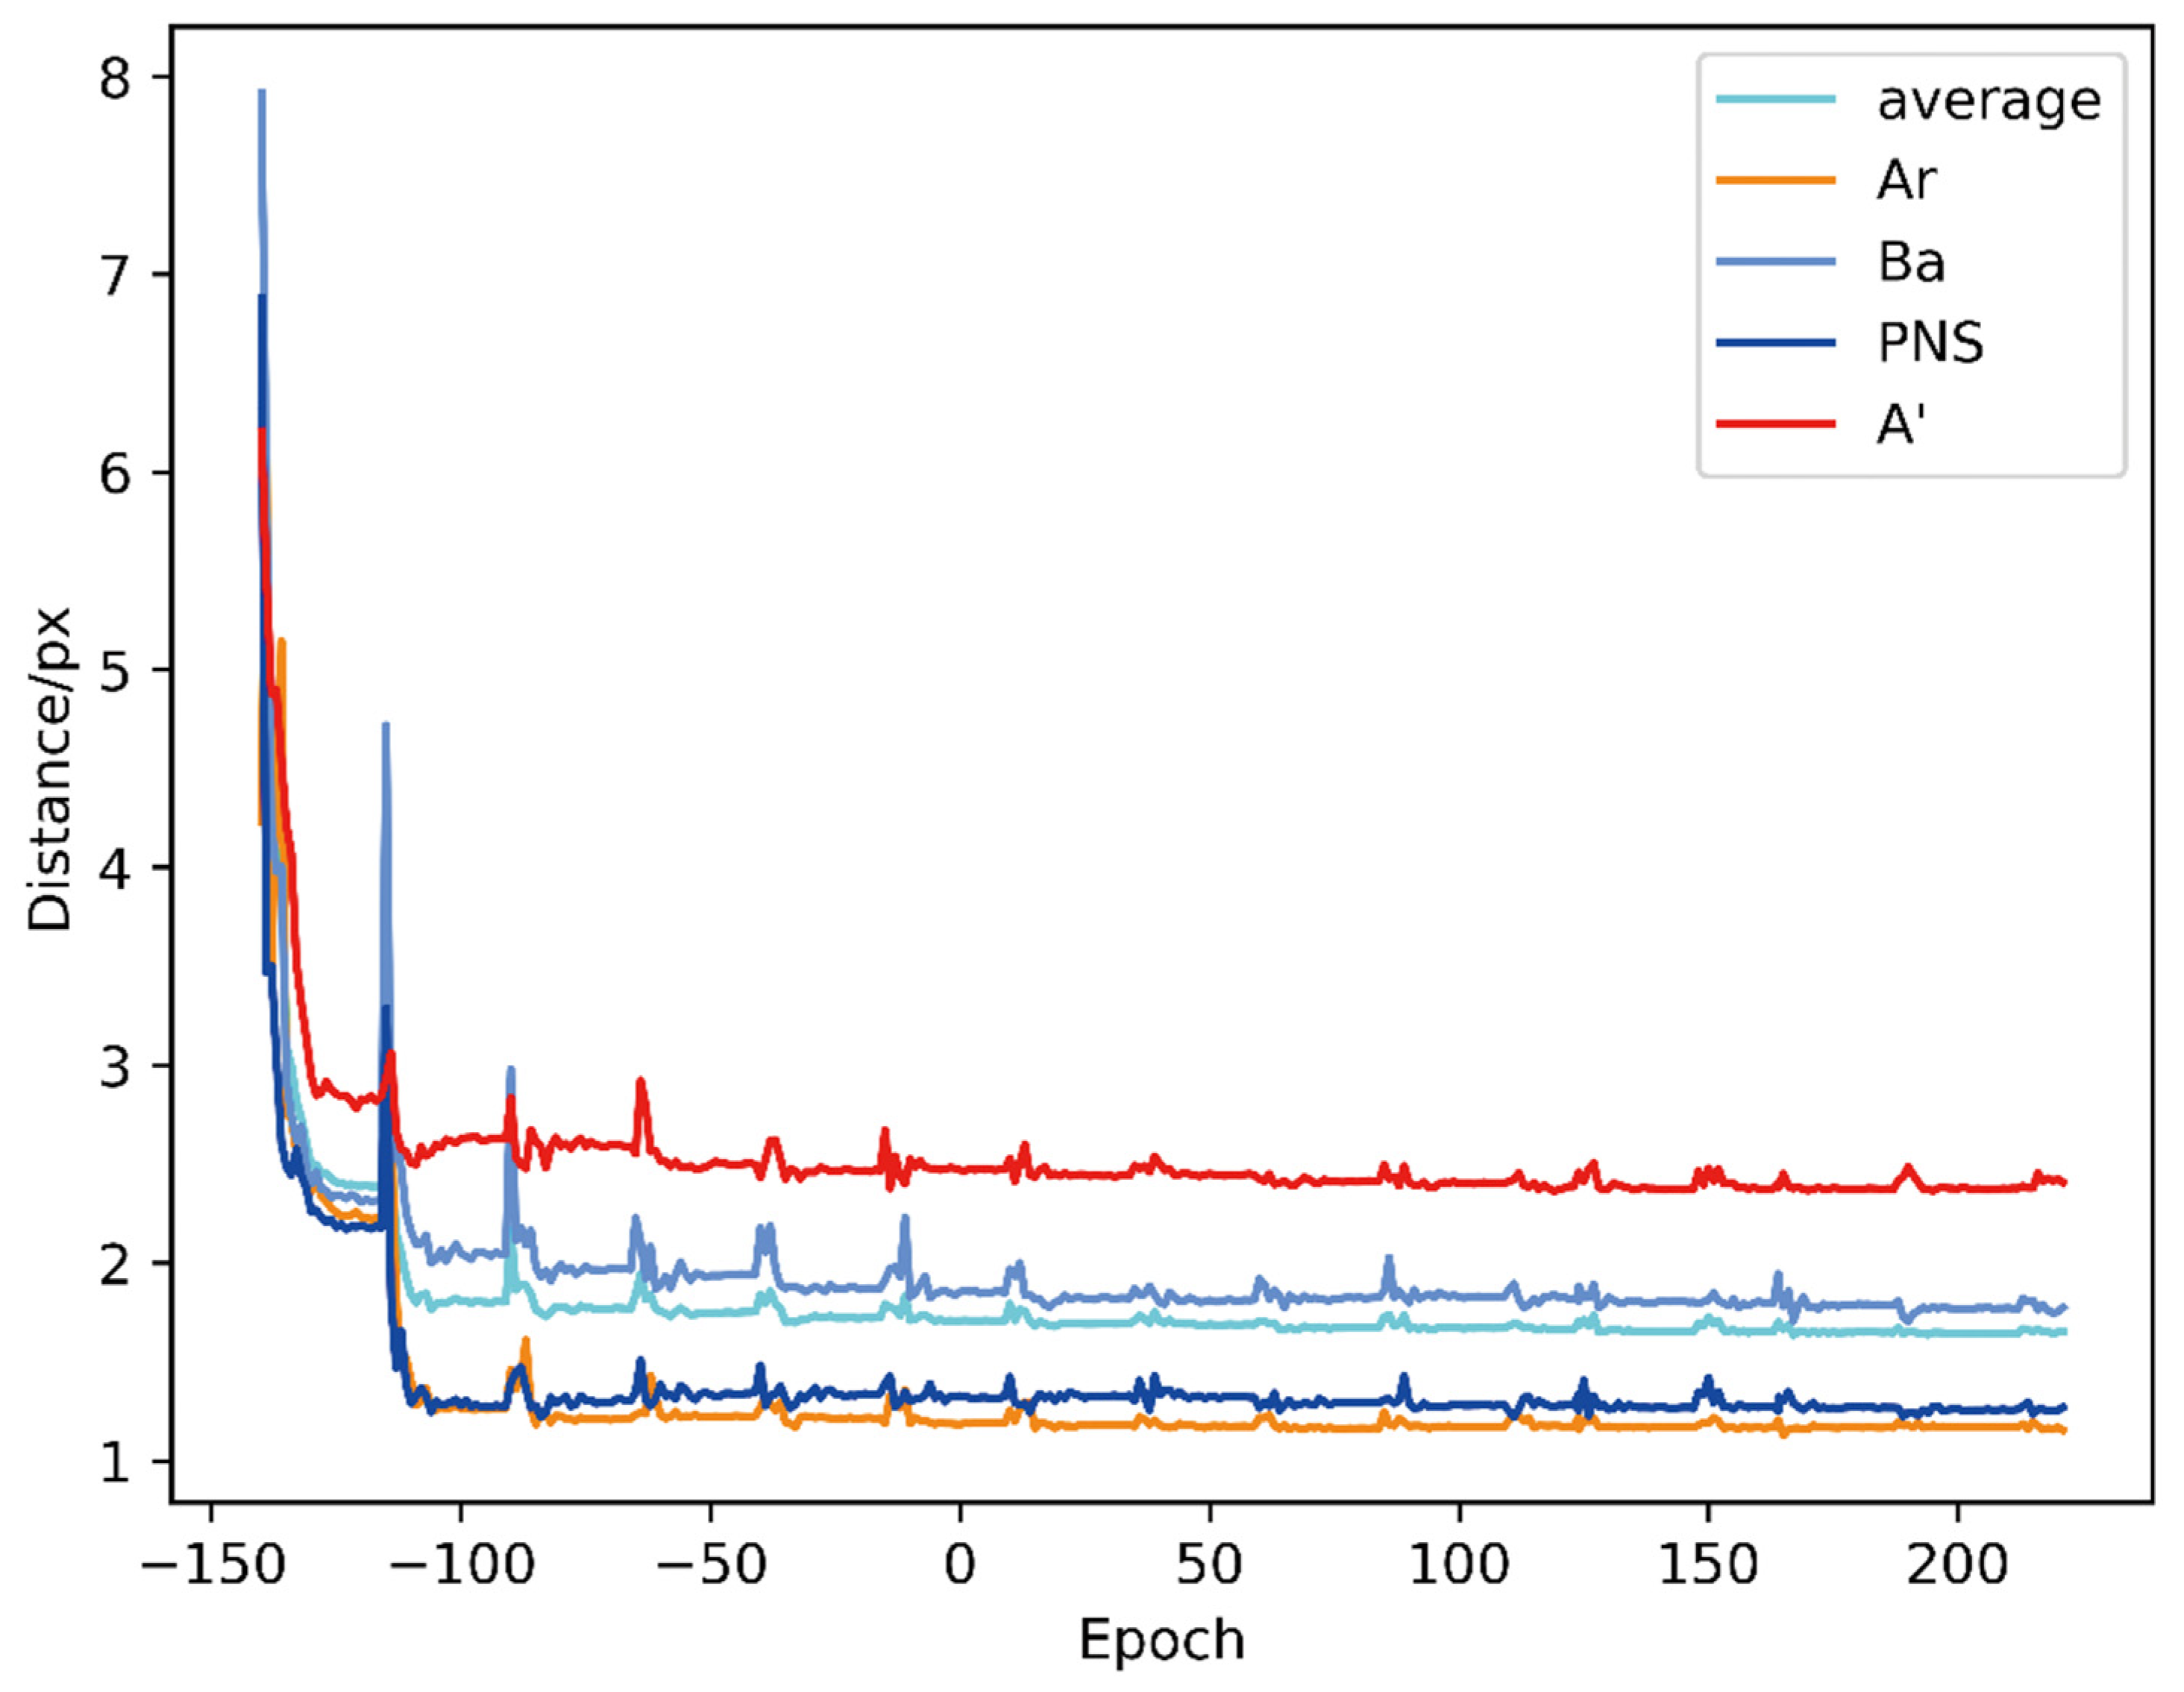
| Method | Ar | Ba | PNS | A’ | Average |
|---|---|---|---|---|---|
| HeadNet | 1.723 | 1.961 | 1.326 | 2.570 | 1.895 |
| HeadNet (r, t) | 1.285 | 1.899 | 1.275 | 2.575 | 1.758 |
| HeadNet * | 1.276 | 1.813 | 1.307 | 2.416 | 1.703 |
| HeadNet * (r, t) | 1.188 | 1.744 | 1.275 | 2.372 | 1.651 |
Publisher’s Note: MDPI stays neutral with regard to jurisdictional claims in published maps and institutional affiliations. |
© 2021 by the authors. Licensee MDPI, Basel, Switzerland. This article is an open access article distributed under the terms and conditions of the Creative Commons Attribution (CC BY) license (https://creativecommons.org/licenses/by/4.0/).
Share and Cite
Zhao, T.; Zhou, J.; Yan, J.; Cao, L.; Cao, Y.; Hua, F.; He, H. Automated Adenoid Hypertrophy Assessment with Lateral Cephalometry in Children Based on Artificial Intelligence. Diagnostics 2021, 11, 1386. https://doi.org/10.3390/diagnostics11081386
Zhao T, Zhou J, Yan J, Cao L, Cao Y, Hua F, He H. Automated Adenoid Hypertrophy Assessment with Lateral Cephalometry in Children Based on Artificial Intelligence. Diagnostics. 2021; 11(8):1386. https://doi.org/10.3390/diagnostics11081386
Chicago/Turabian StyleZhao, Tingting, Jiawei Zhou, Jiarong Yan, Lingyun Cao, Yi Cao, Fang Hua, and Hong He. 2021. "Automated Adenoid Hypertrophy Assessment with Lateral Cephalometry in Children Based on Artificial Intelligence" Diagnostics 11, no. 8: 1386. https://doi.org/10.3390/diagnostics11081386