
The Assessment of Subregions in the Frontal Lobe May Be Feasible in the Differential Diagnosis of Progressive Supranuclear Palsy—Parkinsonism Predominant (PSP-P) and Multiple System Atrophy (MSA)

 , , ,
, , ,
Abstract
:1. Introduction
2. Methods
2.1. Material
2.2. SPECT
2.3. Statistical Analysis
3. Results
4. Discussion
Author Contributions
Funding
Institutional Review Board Statement
Informed Consent Statement
Data Availability Statement
Conflicts of Interest
References
- Guasp, M.; Molina-Porcel, L.; Painous, C.; Caballol, N.; Camara, A.; Perez-Soriano, A.; Sánchez-Gómez, A.; Garrido, A.; Muñoz, E.; Marti, M.J.; et al. Association of PSP phenotypes with survival: A brain-bank study. Park. Relat. Disord. 2021, 84, 77–81. [Google Scholar] [CrossRef] [PubMed]
- Mahale, R.R.; Krishnan, S.; Divya, K.P.; Jisha, V.T.; Kishore, A. Subtypes of PSP and Prognosis: A Retrospective Analysis. Ann. Indian Acad. Neurol. 2021, 24, 56–62. [Google Scholar] [CrossRef] [PubMed]
- Yamawaki, T. Diagnosis of MSA-P and PSP-P in Early Stage. Brain Nerve 2020, 72, 331–343. (In Japanese) [Google Scholar] [CrossRef] [PubMed]
- Alster, P.; Migda, B.; Madetko, N.; Duszyńska-Wąs, K.; Drzewińska, A.; Charzyńska, I.; Starczyński, M.; Szepelska, A.; Królicki, L.; Friedman, A. The Role of Frontal Assessment Battery and Frontal Lobe Single-Photon Emission Computed Tomography in the Differential Diagnosis of Progressive Supranuclear Palsy Variants and Corticobasal Syndrome-A Pilot Study. Front. Neurol. 2021, 12, 630153. [Google Scholar] [CrossRef] [PubMed]
- Madetko, N.; Alster, P.; Kutyłowski, M.; Migda, B.; Nieciecki, M.; Koziorowski, D.; Królicki, L. Is MRPI 2.0 More Useful than MRPI and M/P Ratio in Differential Diagnosis of PSP-P with Other Atypical Parkinsonisms? J. Clin. Med. 2022, 11, 2701. [Google Scholar] [CrossRef] [PubMed]
- Alster, P.; Nieciecki, M.; Migda, B.; Kutyłowski, M.; Madetko, N.; Duszyńska-Wąs, K.; Charzyńska, I.; Koziorowski, D.; Królicki, L.; Friedman, A. The Strengths and Obstacles in the Differential Diagnosis of Progressive Supranuclear Palsy-Parkinsonism Predominant (PSP-P) and Multiple System Atrophy (MSA) Using Magnetic Resonance Imaging (MRI) and Perfusion Single Photon Emission Computed Tomography (SPECT). Diagnostics 2022, 12, 385. [Google Scholar] [CrossRef] [PubMed]
- Quattrone, A.; Bianco, M.G.; Antonini, A.; Vaillancourt, D.E.; Seppi, K.; Ceravolo, R.; Strafella, A.P.; Tedeschi, G.; Tessitore, A.; Cilia, R.; et al. Development and Validation of Automated Magnetic Resonance Parkinsonism Index 2.0 to Distinguish Progressive Supranuclear Palsy-Parkinsonism From Parkinson’s Disease. Mov. Disord. 2022, 37, 1272–1281. [Google Scholar] [CrossRef] [PubMed]
- Quattrone, A.; Morelli, M.; Quattrone, A.; Vescio, B.; Nigro, S.; Arabia, G.; Nisticò, R.; Novellino, F.; Salsone, M.; Arcuri, P.; et al. Magnetic Resonance Parkinsonism Index for evaluating disease progression rate in progressive supranuclear palsy: A longitudinal 2-year study. Park. Relat. Disord. 2020, 72, 1–6. [Google Scholar] [CrossRef] [PubMed]
- Quattrone, A.; Morelli, M.; Nigro, S.; Quattrone, A.; Vescio, B.; Arabia, G.; Nicoletti, G.; Nisticò, R.; Salsone, M.; Novellino, F.; et al. A new MR imaging index for differentiation of progressive supranuclear palsy-parkinsonism from Parkinson’s disease. Park. Relat. Disord. 2018, 54, 3–8. [Google Scholar] [CrossRef] [PubMed]
- Scotton, W.J.; Bocchetta, M.; Todd, E.; Cash, D.M.; Oxtoby, N.; VandeVrede, L.; Heuer, H. PROSPECT Consortium, 4RTNI Consortium, Alexander DC, Rowe JB, Morris HR, Boxer A, Rohrer JD, Wijeratne PA. A data-driven model of brain volume changes in progressive supranuclear palsy. Brain Commun. 2022, 4, fcac098. [Google Scholar] [CrossRef] [PubMed]
- Tomše, P.; Rebec, E.; Studen, A.; Perovnik, M.; Rus, T.; Ležaić, L.; Tang, C.C.; Eidelberg, D.; Trošt, M. Abnormal metabolic covariance patterns associated with multiple system atrophy and progressive supranuclear palsy. Phys. Med. 2022, 98, 131–138. [Google Scholar] [CrossRef] [PubMed]
- Zhao, P.; Zhang, B.; Gao, S.; Li, X. Clinical, MRI and 18F-FDG-PET/CT analysis of progressive supranuclear palsy. J. Clin. Neurosci. 2020, 80, 318–323. [Google Scholar] [CrossRef] [PubMed]
- Sintini, I.; Kaufman, K.; Botha, H.; Martin, P.R.; Loushin, S.R.; Senjem, M.L.; Reid, R.I.; Schwarz, C.G.; Jack, C.R., Jr.; Lowe, V.J.; et al. Neuroimaging correlates of gait abnormalities in progressive supranuclear palsy. Neuroimage Clin. 2021, 32, 102850. [Google Scholar] [CrossRef] [PubMed]
- Schofield, E.C.; Hodges, J.R.; Macdonald, V.; Cordato, N.J.; Kril, J.J.; Halliday, G.M. Cortical atrophy differentiates Richardson’s syndrome from the parkinsonian form of progressive supranuclear palsy. Mov. Disord. 2011, 26, 256–263. [Google Scholar] [CrossRef] [PubMed]
- Parthimos, T.P.; Schulpis, K.H. The Progressive Supranuclear Palsy: Past and Present Aspects. Clin. Gerontol. 2020, 43, 155–180. [Google Scholar] [CrossRef] [PubMed]
- Horta-Barba, A.; Pagonabarraga, J.; Martínez-Horta, S.; Busteed, L.; Pascual-Sedano, B.; Illán-Gala, I.; Marin-Lahoz, J.; Aracil-Bolaños, I.; Pérez-Pérez, J.; Sampedro, F.; et al. Cognitive and behavioral profile of progressive supranuclear palsy and its phenotypes. J. Neurol. 2021, 268, 3400–3408. [Google Scholar] [CrossRef] [PubMed]
- Höglinger, G.U.; Respondek, G.; Stamelou, M.; Kurz, C.; Josephs, K.A.; Lang, A.E.; Mollenhauer, B.; Müller, U.; Nilsson, C.; Whitwell, J.L.; et al. Movement Disorder Society-endorsed PSP Study Group. Clinical diagnosis of progressive supranuclear palsy: The movement disorder society criteria. Mov. Disord. 2017, 32, 853–864. [Google Scholar] [CrossRef] [PubMed]
- Gilman, S.; Wenning, G.K.; Low, P.A.; Brooks, D.J.; Mathias, C.J.; Trojanowski, J.Q.; Wood, N.W.; Colosimo, C.; Dürr, A.; Fowler, C.J.; et al. Second consensus statement on the diagnosis of multiple system atrophy. Neurology 2008, 71, 670–676. [Google Scholar] [CrossRef] [PubMed]
- Beliveau, V.; Müller, C.; Steiger, R.; Gizewski, E.R.; Poewe, W.; Seppi, K.; Scherfler, C. Characterization and diagnostic potential of R2* in early-stage progressive supranuclear palsy variants. Park. Relat. Disord. 2022, 101, 43–48. [Google Scholar] [CrossRef] [PubMed]
- Alster, P.; Madetko, N.; Koziorowski, D.; Friedman, A. Progressive Supranuclear Palsy-Parkinsonism Predominant (PSP-P)-A Clinical Challenge at the Boundaries of PSP and Parkinson’s Disease (PD). Front. Neurol. 2020, 11, 180. [Google Scholar] [CrossRef] [PubMed]


| Total N = 35 | MSA-P (N = 21) | PSP-P (N = 14) | p | ||||||||||
|---|---|---|---|---|---|---|---|---|---|---|---|---|---|
| Median | Lower Quartile | Upper Quartile | Quartile Range | Median | Lower Quartile | Upper Quartile | Quartile Range | Median | Lower Quartile | Upper Quartile | Quartile Range | ||
| INFERIOR FRONTAL OPERCULAR L | −0.5 | −2.4 | 0.8 | 3.2 | 0.0 | −0.5 | 1.4 | 1.9 | −2.4 | −3.5 | −1.2 | 2.3 | 0.0038 |
| INFERIOR FRONTAL OPERCULAR R | 0.5 | −2.8 | 2.3 | 5.1 | 1.4 | 0.2 | 2.7 | 2.5 | −2.4 | −3.4 | 0.3 | 3.7 | 0.0047 |
| INFERIOR FRONTAL ORBITAL L | −0.9 | −2.7 | 0.2 | 2.9 | −0.4 | −2.2 | 0.5 | 2.7 | −2.3 | −3.3 | −0.3 | 3.0 | 0.0617 |
| INFERIOR FRONTAL ORBITAL R | −0.1 | −1.7 | 0.9 | 2.6 | 0.6 | −1.1 | 1.5 | 2.6 | −1.4 | −2.5 | −0.1 | 2.4 | 0.0529 |
| INFERIOR FRONTAL TRIANGULAR L | −0.8 | −2.8 | 1.4 | 4.2 | 0.2 | −1.0 | 1.4 | 2.4 | −2.7 | −3.7 | −0.8 | 2.9 | 0.0184 |
| INFERIOR FRONTAL TRIANGULAR R | 0.6 | −2.5 | 2.8 | 5.3 | 1.6 | 0.1 | 3.0 | 2.9 | −2.1 | −3.7 | 1.9 | 5.6 | 0.0384 |
| MIDDLE FRONTAL GYRUS L | −0.5 | −1.4 | 1.3 | 2.7 | 0.1 | −0.8 | 1.7 | 2.5 | −0.8 | −2.7 | 1.2 | 3.9 | 0.1524 |
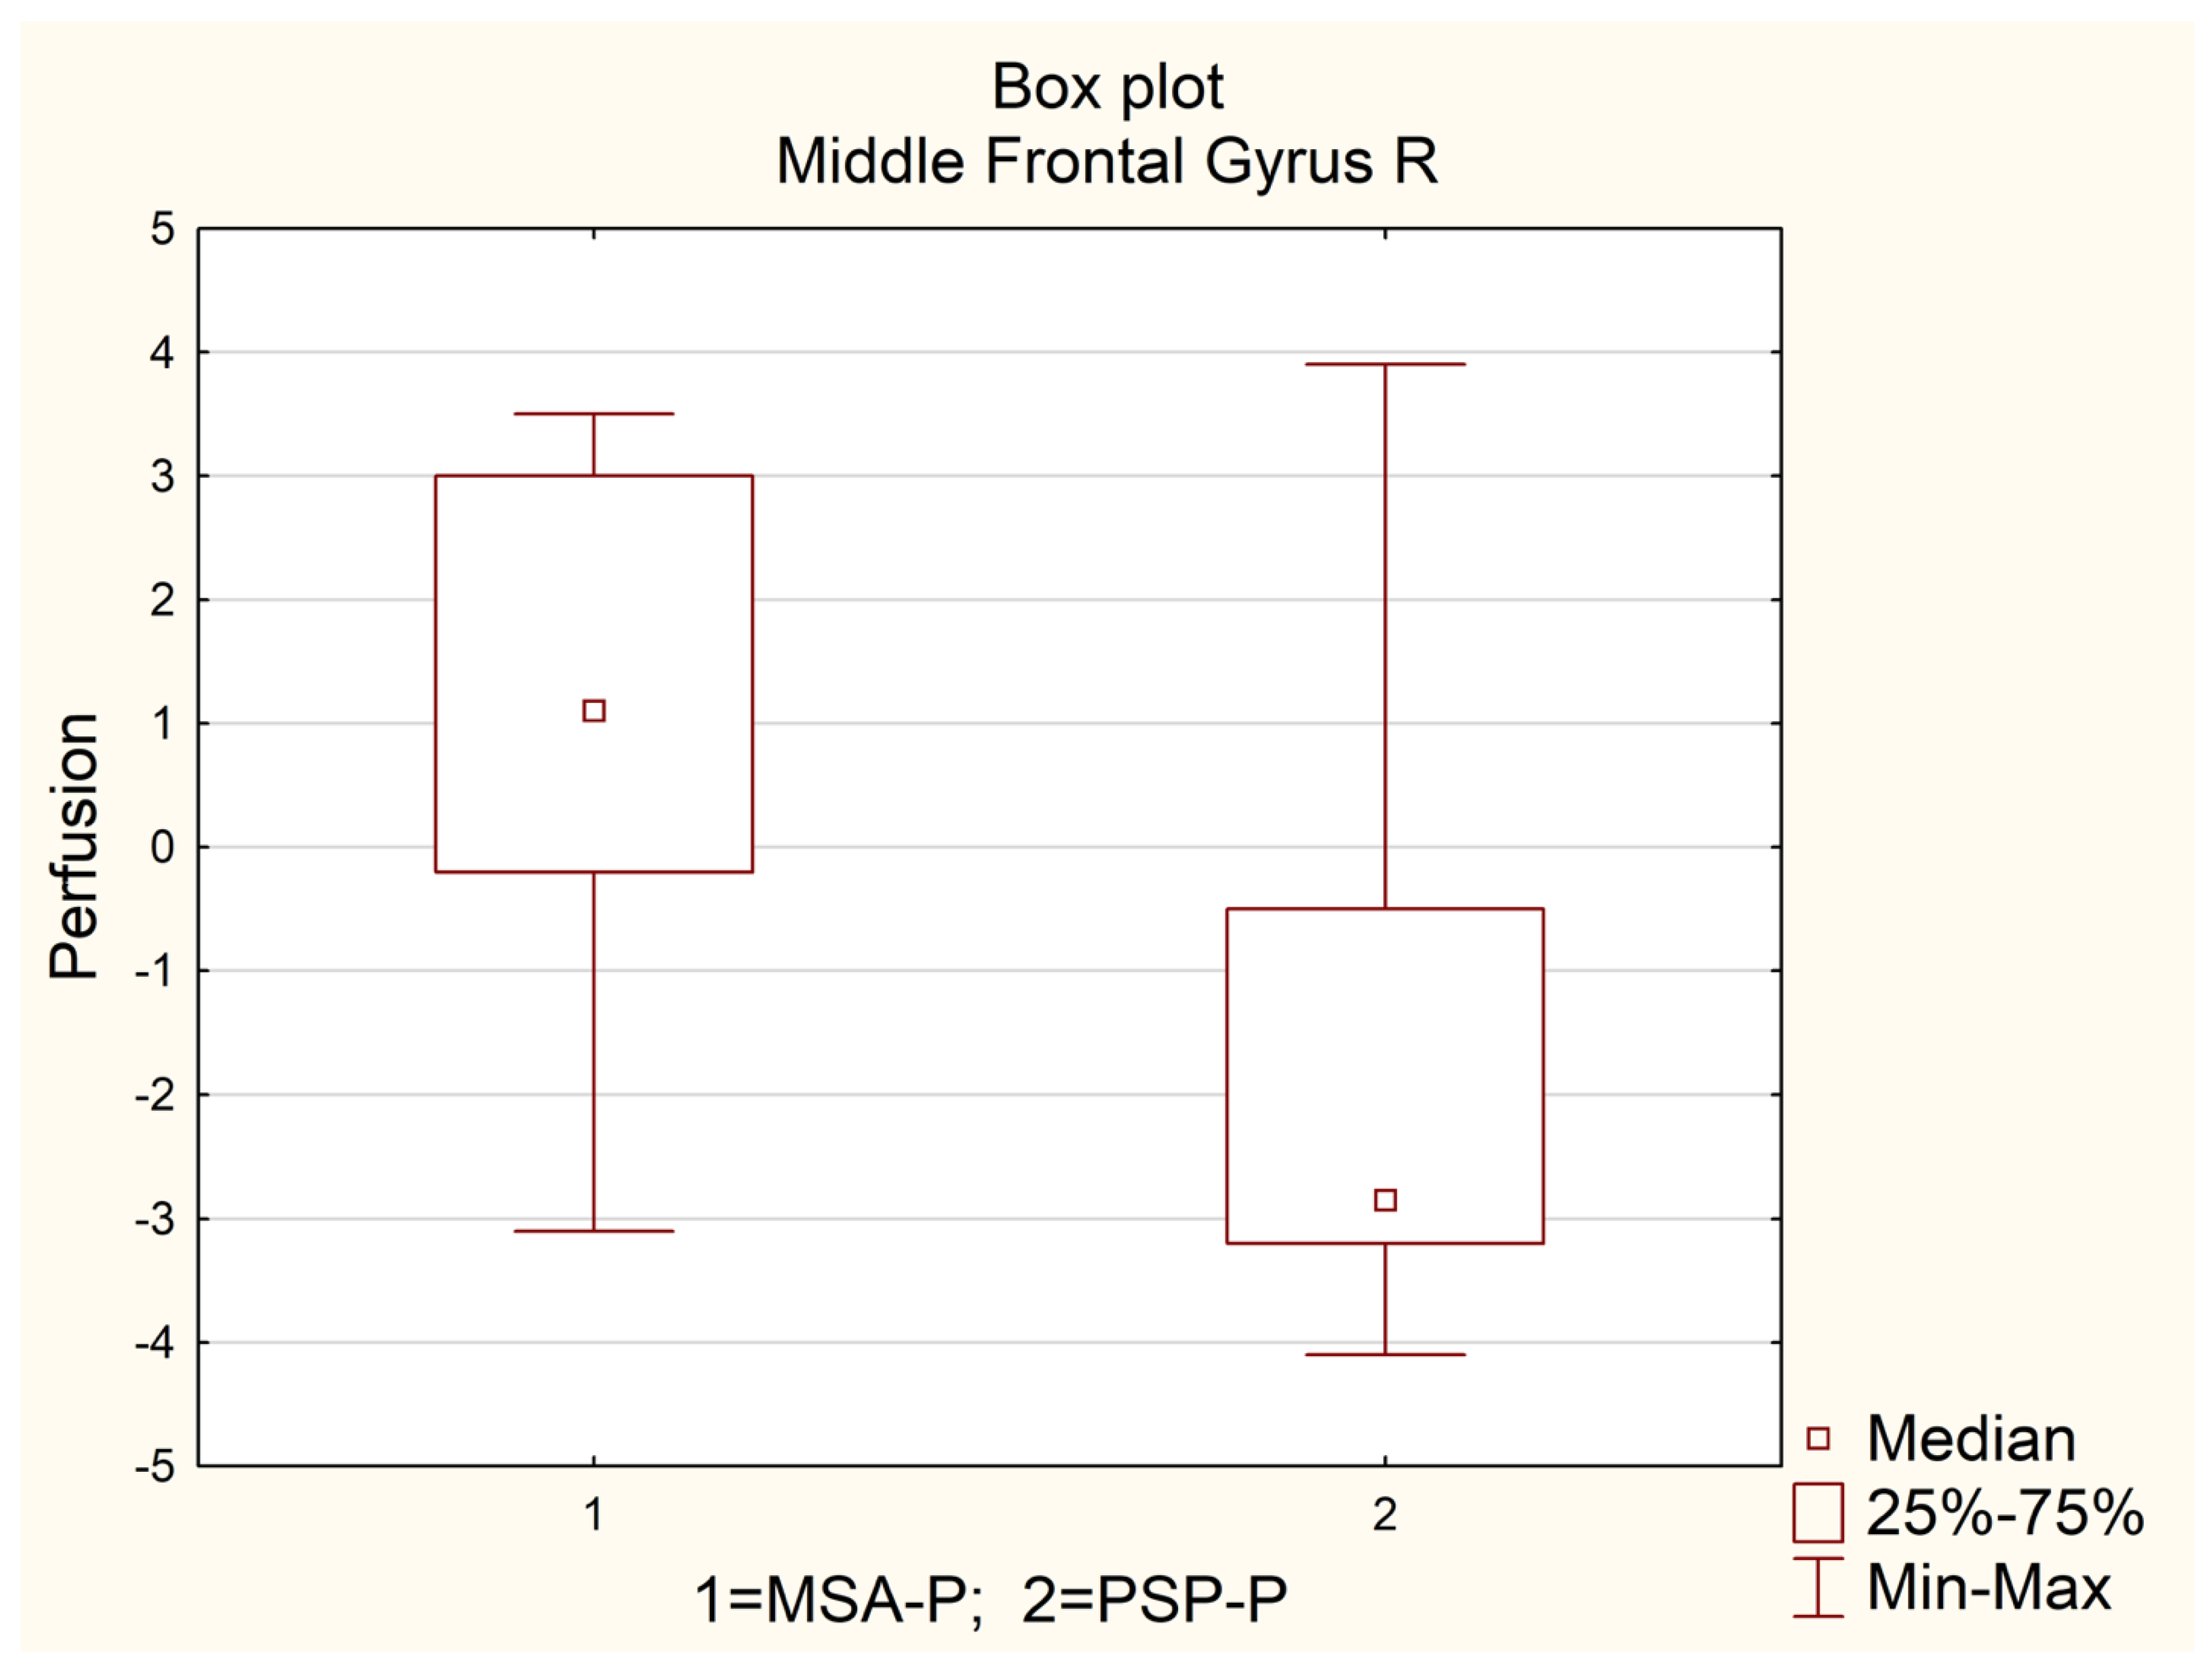
| MIDDLE FRONTAL GYRUS R | 0.0 | −2.9 | 1.6 | 4.5 | 1.1 | −0.2 | 3.0 | 3.2 | −2.9 | −3.2 | −0.5 | 2.7 | 0.0013 |
| MIDDLE FRONTAL GYRUS ORBITAL PART L | −0.8 | −2.7 | 0.1 | 2.8 | −0.4 | −1.5 | 0.1 | 1.6 | −1.3 | −3.4 | −0.1 | 3.3 | 0.2386 |
| MIDDLE FRONTAL GYRUS ORBITAL R | −1.7 | −3.0 | −0.4 | 2.6 | −1.4 | −2.5 | −0.7 | 1.8 | −2.3 | −3.3 | −0.2 | 3.1 | 0.5333 |
| PRECENTRAL GYRUS L | −0.5 | −1.3 | 0.5 | 1.8 | −0.2 | −1.3 | 1.2 | 2.5 | −0.8 | −1.2 | −0.1 | 1.1 | 0.2523 |
| PRECENTRAL GYRUS R | 0.6 | −0.7 | 1.7 | 2.4 | 1.0 | 0.4 | 2.0 | 1.6 | −0.2 | −1.3 | 0.6 | 1.9 | 0.0211 |
| SUPERIOR FRONTAL GYRUS DORSOLATERAL L | −0.1 | −1.3 | 1.5 | 2.8 | −0.1 | −0.8 | 1.5 | 2.3 | −1.0 | −2.0 | 1.0 | 3.0 | 0.2966 |
| SUPERIOR FRONTAL GYRUS DORSOLATERAL R | 0.0 | −1.1 | 1.0 | 2.1 | 0.3 | −0.1 | 1.2 | 1.3 | −1.1 | −2.3 | 0.5 | 2.8 | 0.0220 |
| SUPERIOR FRONTAL GYRUS MEDIAL L | 0.4 | −0.6 | 1.0 | 1.6 | 0.6 | −0.2 | 1.3 | 1.5 | −0.7 | −1.7 | 0.6 | 2.3 | 0.0182 |
| SUPERIOR FRONTAL GYRUS MEDIAL R | 0.2 | −1.5 | 1.3 | 2.8 | 0.3 | 0.2 | 1.3 | 1.1 | −1.5 | −2.6 | 0.0 | 2.6 | 0.0116 |
| SUPERIOR FRONTAL MEDIAL ORBITAL L | 0.1 | −1.5 | 1.4 | 2.9 | 0.9 | −0.5 | 1.7 | 2.2 | −0.8 | −2.9 | 0.4 | 3.3 | 0.0489 |
| SUPERIOR FRONTAL MEDIAL ORBITAL R | 0.2 | −1.8 | 1.1 | 2.9 | 0.7 | −0.7 | 1.2 | 1.9 | −1.3 | −2.6 | 0.6 | 3.2 | 0.0529 |
| SUPERIOR FRONTAL GYRUS ORBITAL L | −0.1 | −1.9 | 0.8 | 2.7 | 0.0 | −1.0 | 0.8 | 1.8 | −0.3 | −1.9 | 0.3 | 2.2 | 0.3905 |
| SUPERIOR FRONTAL GYRUS ORBITAL R | −1.0 | −2.2 | 0.1 | 2.3 | −0.8 | −1.5 | 0.3 | 1.8 | −1.6 | −2.7 | 0.0 | 2.7 | 0.2067 |
Publisher’s Note: MDPI stays neutral with regard to jurisdictional claims in published maps and institutional affiliations. |
© 2022 by the authors. Licensee MDPI, Basel, Switzerland. This article is an open access article distributed under the terms and conditions of the Creative Commons Attribution (CC BY) license (https://creativecommons.org/licenses/by/4.0/).
Share and Cite
Alster, P.; Madetko-Alster, N.; Migda, B.; Nieciecki, M.; Koziorowski, D.; Królicki, L. The Assessment of Subregions in the Frontal Lobe May Be Feasible in the Differential Diagnosis of Progressive Supranuclear Palsy—Parkinsonism Predominant (PSP-P) and Multiple System Atrophy (MSA). Diagnostics 2022, 12, 2421. https://doi.org/10.3390/diagnostics12102421
Alster P, Madetko-Alster N, Migda B, Nieciecki M, Koziorowski D, Królicki L. The Assessment of Subregions in the Frontal Lobe May Be Feasible in the Differential Diagnosis of Progressive Supranuclear Palsy—Parkinsonism Predominant (PSP-P) and Multiple System Atrophy (MSA). Diagnostics. 2022; 12(10):2421. https://doi.org/10.3390/diagnostics12102421
Chicago/Turabian StyleAlster, Piotr, Natalia Madetko-Alster, Bartosz Migda, Michał Nieciecki, Dariusz Koziorowski, and Leszek Królicki. 2022. "The Assessment of Subregions in the Frontal Lobe May Be Feasible in the Differential Diagnosis of Progressive Supranuclear Palsy—Parkinsonism Predominant (PSP-P) and Multiple System Atrophy (MSA)" Diagnostics 12, no. 10: 2421. https://doi.org/10.3390/diagnostics12102421
APA StyleAlster, P., Madetko-Alster, N., Migda, B., Nieciecki, M., Koziorowski, D., & Królicki, L. (2022). The Assessment of Subregions in the Frontal Lobe May Be Feasible in the Differential Diagnosis of Progressive Supranuclear Palsy—Parkinsonism Predominant (PSP-P) and Multiple System Atrophy (MSA). Diagnostics, 12(10), 2421. https://doi.org/10.3390/diagnostics12102421