Article

Impact of Photon Counting Detector CT Derived Virtual Monoenergetic Images on the Diagnosis of Pulmonary Embolism

by
Tetyana Yalynska
,
Malgorzata Polacin
,
Thomas Frauenfelder
and
Katharina Martini
*
Diagnostic and Interventional Radiology, University Hospital Zurich, University of Zurich, 8091 Zurich, Switzerland
*
Author to whom correspondence should be addressed.
Diagnostics 2022, 12(11), 2715; https://doi.org/10.3390/diagnostics12112715
Submission received: 11 October 2022 / Revised: 1 November 2022 / Accepted: 3 November 2022 / Published: 7 November 2022
(This article belongs to the Special Issue Imaging of Pulmonary Vascular Disease)

Abstract

:
Purpose: To assess the impact of virtual-monoenergetic-image (VMI) energies on the diagnosis of pulmonary embolism (PE) in photon-counting-detector computed-tomography (PCD-CT). Methods: Eighty patients (median age 60.4 years) with suspected PE were retrospectively included. Scans were performed on PCD-CT in the multi-energy mode at 120 kV. VMIs from 40–70 keV in 10 keV intervals were reconstructed. CT-attenuation was measured in the pulmonary trunk and the main branches of the pulmonary artery. Signal-to-noise (SNR) ratio was calculated. Two radiologists evaluated subjective-image-quality (noise, vessel-attenuation and sharpness; five-point-Likert-scale, non-diagnostic–excellent), the presence of hardening artefacts and presence/visibility of PE. Results: Signal was highest at the lowest evaluated VMI (40 keV; 1053.50 HU); image noise was lowest at the highest VMI (70 keV; 15.60 HU). Highest SNR was achieved at the lowest VMI (p < 0.05). Inter-reader-agreement for subjective analysis was fair to excellent (k = 0.373–1.000; p < 0.001). Scores for vessel-attenuation and sharpness were highest at 40 keV (both:5, range 4/3–5; k = 1.000); scores for image-noise were highest at 70 keV (4, range 3–5). The highest number of hardening artifacts were reported at 40 keV (n = 22; 28%). PE-visualization was rated best at 50 keV (4.7; range 4–5) and decreased with increasing VMI-energy (r = −0.558; p < 0.001). Conclusions: While SNR was best at 40 keV, subjective PE visibility was rated highest at 50 keV, potentially owing to the lower image noise and hardening artefacts.

1. Introduction

Pulmonary embolism (PE) is defined as an occlusion of the pulmonary arteries by thromboembolic material [1,2,3,4,5,6]. It is a potentially life-threatening condition which frequently results in death [1,2,3,4,5,6]. PE contributes to one of the most common in-hospital complications, causing widespread morbidity and mortality [1,7]. Accurate and timely diagnosis of PE is crucial for appropriate treatment and ultimately, for improvement of the patients’ outcome [7]. Multi-detector computed tomography (CT) has demonstrated high diagnostic accuracy in the diagnosis of PE, hence becoming the modality of choice for patients with suspected PE [1,2,3,4,5,6,7,8,9,10]. The quality of the images during routine clinical use of CT angiography (CTPA) is dependent on several factors including bolus timing, breathing-related effects, iodine delivery rate (iodine contrast agent concentration and injection flow-rate) and low cardiac output [1,8,11]. Such technical and patient-dependent factors can lead to suboptimal image quality and undermine the PE diagnosis [4,11].
A new and rapidly developing generation of CT scanners significantly improves and expands the diagnostic possibilities of the method [9,10,12]. Photon-counting detector CT (PCD-CT) can provide energy-resolved CT data at very high spatial resolution, with significantly decreased electronic noise, as well as radiation dose reduction [12,13,14]. This new technology can help to overcome the major limitations of conventional CT detectors, such as limited spatial resolution and electronic noise [15,16,17,18]. Together, the multi-energy data acquisition and the reconstruction of virtual monoenergetic images (VMI) at varying energies allow for the adjustment of the level of energy to provide the optimal combination of signal and image noise [16,19,20,21] for the diagnosis in question. Further, VMI allows for the creation of virtual low keV datasets, with which the attenuation of the iodine contrast and signal-to-noise ratio can be optimized for the evaluation of vascular structures. Using VMI has already been beneficial for improving image quality and visualization of vascular structures in PCD-CT [4,5,21,22,23].
There are studies which evaluate the impact of different VMI for the diagnosis of PE on dual-energy CT (DECT) [4,5]. However, there is a lack of literature addressing the use of VMI for the evaluation of PE in PCD-CT.
This study aimed to fill this gap by investigating the impact of VMI at different VMI energies in the diagnosis of PE.

2. Materials and Methods

2.1. Patient Cohort

This retrospective study was approved by the local ethics committee (approval number 2019-01676). Written informed consent was obtained from all patients. Consecutive patients who were referred to our institution for ruling out PE and obtained a dedicated contrast enhanced thoracic CT angiography between March 2021 and June 2022 on a first-generation dual-source PCD-CT were retrospectively included. Diagnosis of PE was indicated on the direct visualization of hypoattenuating filling defects in the enhancing lumen of the pulmonary artery [2]. Of the initially included patients, all with a diagnosis of PE were added to the final study cohort. Additionally, we added 45 consecutive patients without PE. The residual patients without PE were dismissed.

2.2. Image Acquisition

PCD-CT scans were performed on a first-generation dual-source CT scanner with “Quantum technology” (NAEOTOM Alpha, Siemens). This scanner is equipped with a photon-counting detector (PCD) (QuantaMax detector, Siemens). All scans were performed in the multi- energy (QuantumPlus) mode at 120 kVp at an image Quality (IQ) level of 60 after application of an intravenous (IV) iodinated contrast agent.
A double-syringe power injector (CT Exprés, Bracco, Lausanne, Switzerland) applied IV contrast via an antecubital vein. 80 mL of IV contrast (iopromide, Ultravist, 300 mg J/mL, Bayer HealthCare, Leverkusen, Germany) was followed by 50 mL saline bolus, both at a flow rate of 4 mL/s. Bolus tracking was performed with a threshold of 100 HU (at 100 kVp) in the main pulmonary artery, with a trigger delay of 10 s.

2.3. Post Processing

All images were reconstructed in the axial plane with a soft tissue convolution kernel (Br36) at a slice thickness of 2 mm and an increment of 1.6 mm at different VMI energies, ranging from 40 to 70 keV with a stepwise increment of 10 keV and multi-energetic images containing all energy spectra (SPP).

2.4. Objective Image Quality Evaluation

One reader blinded for the reconstructed VMI energy measured the CT attenuation by placing circular regions of interest (ROIs) in the pulmonary trunk and the main branches of the pulmonary artery. For each anatomical structure, an area with the largest possible ROI diameter was chosen. ROIs were only placed in positions were no image artifacts or filling defects of the pulmonary arteries were present. Image noise was defined as the standard deviation of air attenuation in the trachea just above the bifurcation. Signal- to-noise ratio (SNR) was calculated as follows:
S N R = H U P u l m o n a r y   a r t e r y N o i s e

2.5. Subjective Image Quality Evaluation

Subjective image quality evaluation was performed by two independent readers (TY, with 16 years, and MP, with 9 years of experience in thoracic imaging) blinded for the reconstructed VMI energy. Readers had to score subjective image noise, vessel attenuation and vessel sharpness on a 5-point Likert scale (1 = non-diagnostic, 2 = poor, 3 = moderate, 4 = good, 5 = excellent). Readers further had to state if hardening artefacts due to contrast agent were present (yes/no).

2.6. Detection of Pulmonary Embolism

The same two blinded readers had to evaluate if pulmonary embolism was present (yes/no) and if present, to score the visibility of PE (1 = non-diagnostic, 2 = poor, 3 = moderate, 4 = good, 5 = excellent). Readers were allowed to change window levels.

2.7. Statistical Analysis

All data distribution was initially checked visually (histograms, boxplots, quantile-quantile plots) and then quantitatively (Shapiro-Wilk tests) for normal distribution. Quantitative variables were expressed as median and ranges with a 95% CI. Cohen’s κ was used to assess inter-reader agreement. The following scale was used for the indication of the level of agreement by k-results: slight agreement, 0.01–0.20; fair agreement, 0.21–0.40; moderate agreement, 0.41–0.60; good agreement, 0.61–0.80; excellent agreement, 0.81–0.99) [24]. A 2-sided pairwise comparison was used to compare median variables. Bonferroni correction was used to correct for multiple tests. A two-sided p–value below 0.05 was considered to indicate statistical significance. Statistical analyses were conducted using commercially available software (IBM SPSS Statistics, release 21.0; SPSS, Chicago, IL, USA).

3. Results

3.1. Patient Population

From March 2021 to June 2022, in total three hundred fourteen patients underwent imaging on a PCD-CT with the suspicion of PE. In our study we included all patients with the diagnosis of PE (n = 35, 11.1%) (Table 1) and 45 consecutive patients with unremarkable pulmonary arteries in order to obtain homogeneous groups. The final study cohort constituted eighty patients (median age: 60.4 years; range: 19.5–90 years; 28 women). The two groups did not show statistically significant differences based on gender and age (p > 0.05).

3.2. Objective Image Quality Evaluation

Overall, pulmonary artery attenuation, image noise and SNR did not have a statistically significant difference for patients with and without PE (p > 0.05). The lowest values for pulmonary artery attenuation and image noise were achieved at the highest evaluated VMI energy (70 keV), while the highest values for SNR were achieved at the lowest evaluated VMI energy (40 keV). Values for image noise and SNR can be found in Figure 1 and Table 2.
The pairwise comparison of SNR at different keV indicated a statistically significant difference between all combinations of VMI energies (p = 0.044–0.000) (Table 3); the closest values were SNR 60/70 (p = 0.044). The pairwise comparison for noise values at different keV had a statistically significant difference between 40/50 keV, 50/60 keV, 60/50 keV, 60/70 keV (p < 0.001) (Table 3).
Signal and noise decreased with higher VMI energies (p < 0.001), while SNR had a negative correlation with increasing VMI energies (r = −0.635; p < 0.001).

3.3. Subjective Image Quality Evaluation

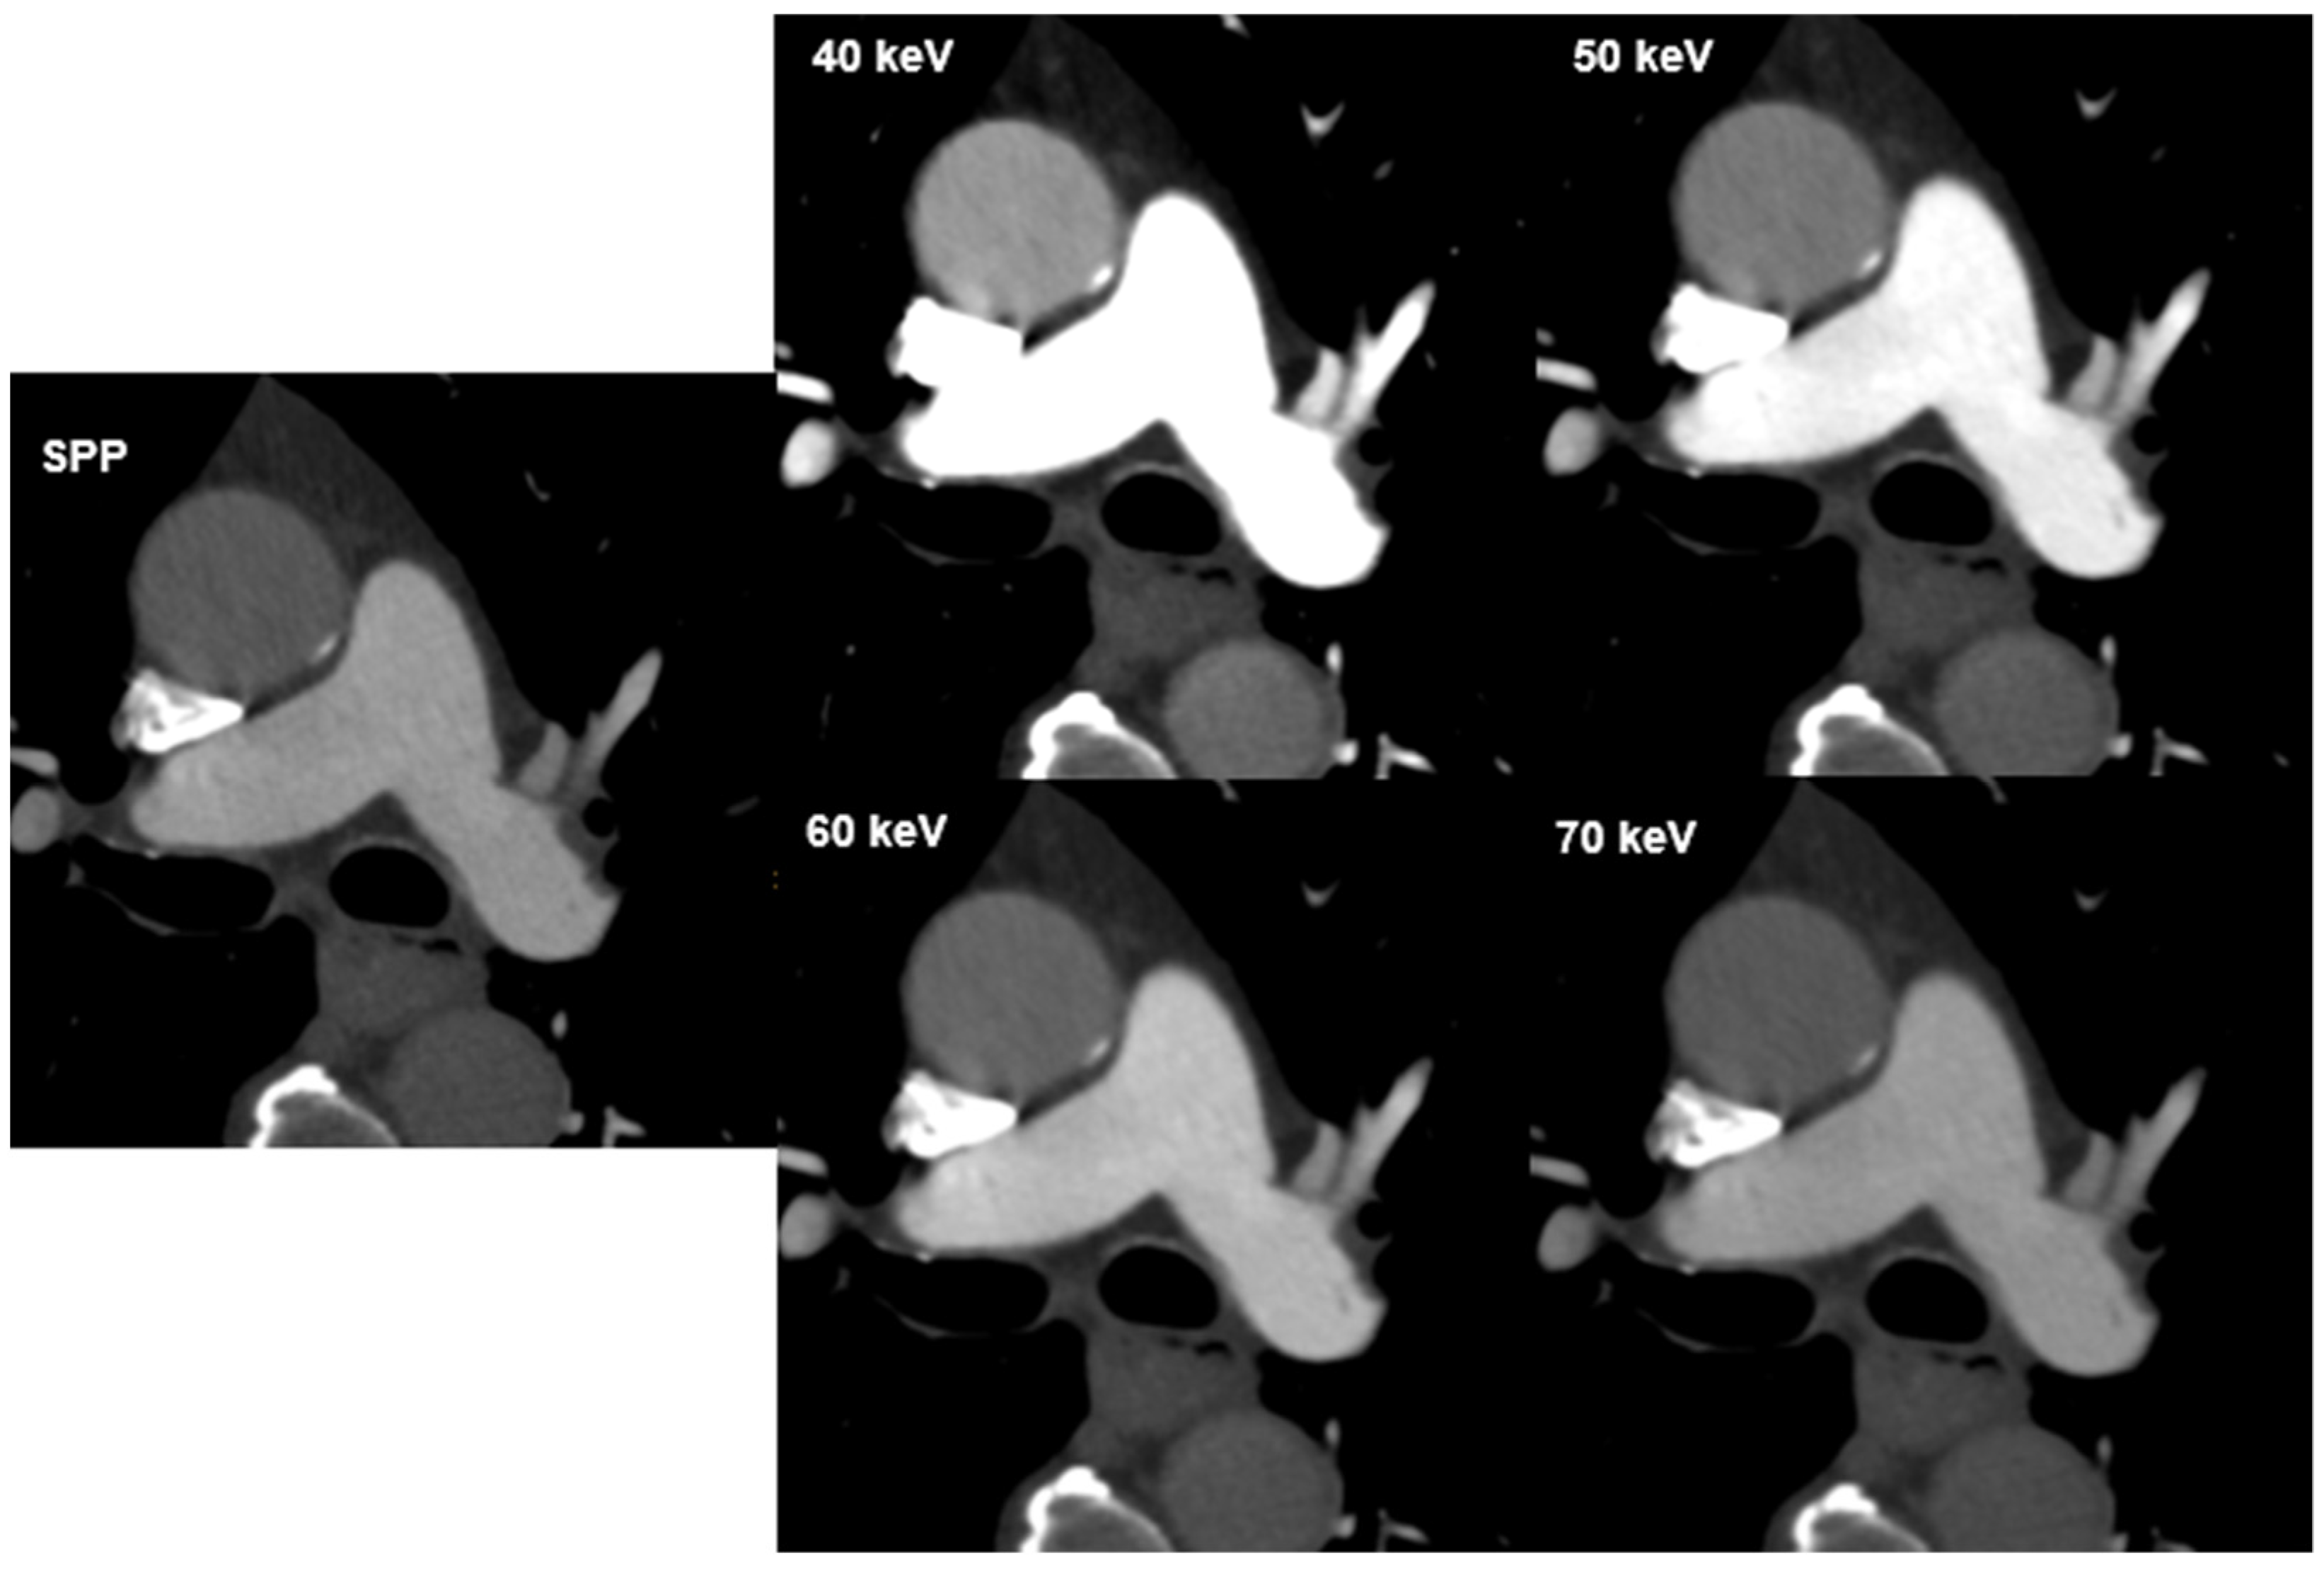
Overall, inter-reader agreement for subjective image quality was moderate to excellent (Table 4). Excellent agreement was reached in the evaluation of vessel attenuation on VMIs 40–70 keV (k = 0.857–1.000) with total consensus for VMI 40 keV and 50 keV (k = 1.000) and good agreement was reached in the evaluation of vessel sharpness (k = 0.717–0.830). The agreement in image noise evaluation on VMI 40 keV was moderate (k = 0.584), good agreement was achieved for VMIs 50–70 keV (k = 0.644–0.682). Vessel attenuation and vessel sharpness were rated best at 40 keV (both mean 5; range 3–5), while image noise was rated best at 70 keV (mean, 4.6; range 3–5). Subjective scores in the assessment of image noise had positive correlation with VMI energies (r = 0.231, p < 0.001), while there was a negative correlation between VMI energies and vessel attenuation and sharpness (r = −0.557 and r = −0.280; p < 0.001). Hardening artefacts were mainly reported at 40 keV (n = 22; 27.5, followed by 50 keV with n = 10 (12.5%) and 60 keV with n = 1 (1.3%). No hardening artefacts were reported at 70 keV. The visual difference in image quality with regard to image noise and signal is illustrated in Figure 2.

3.4. Detection of Pulmonary Embolism

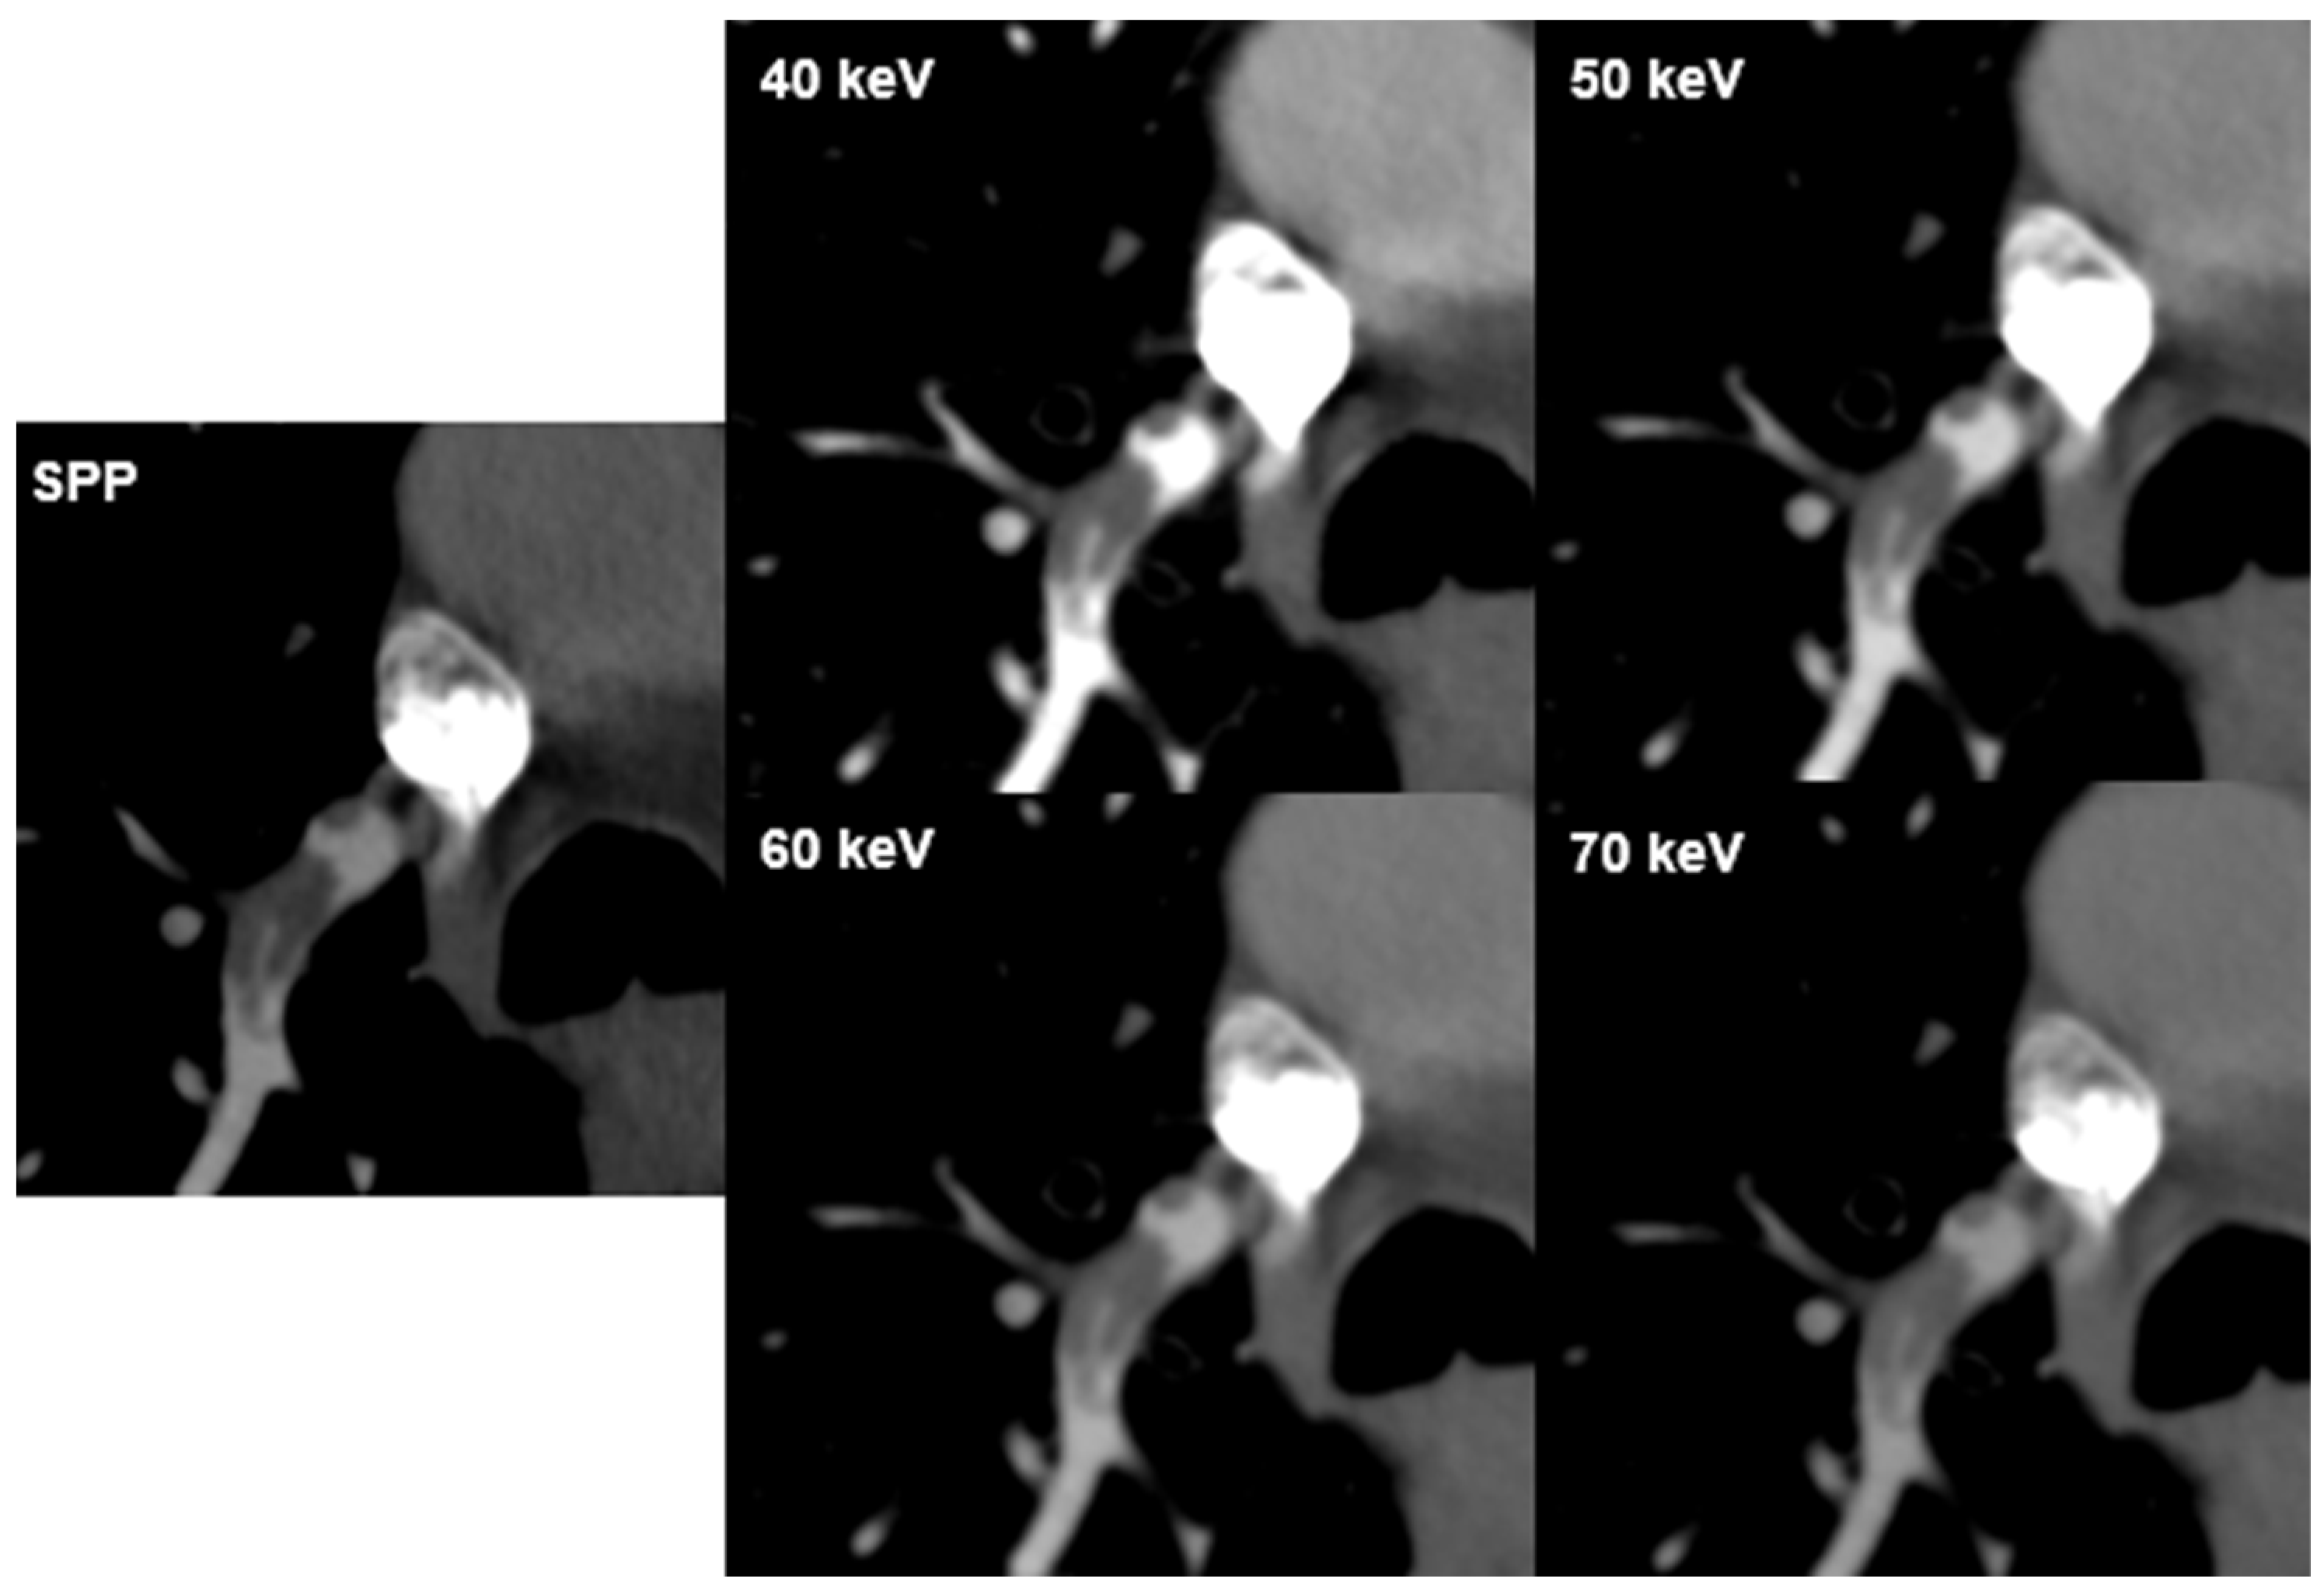
Inter-reader agreement for PE visualization was fair to good (k = 0.373–0.612, p < 0.001) with good concurrence for VMI 50 keV (k = 0.612). Diagnostic confidence for the visualization of PE was rated lowest at 70 keV for both readers (mean 3.7; range 2–5 and 3.5; range 2–4; respectively). There was a negative correlation between PE visualization and VMI energies for both readers (r = −0.538 and r = −0.578, p < 0.001; respectively) (Figure 3).

4. Discussion

Current publications spotlight many benefits of the PCD-CT in comparison with previous generations of CT; they provide a higher contrast-to-noise ratio, lower radiation dose and the possibility to reconstruct VMI energies [12,13,15,16,17,19,25,26,27,28]. Our study assessed the impact of different VMI energies in the diagnosis of PE with PCD-CT. While the use of low-energy VMI energies is improving, vessel attenuation in the aorta has already been widely evaluated [25]; however, the impact of VMI in PCD-CT on the evaluation of the pulmonary artery and PE has not yet been evaluated. The value of VMI in DECT datasets for improving the quality of CT pulmonary angiography (CTPA) examinations has been described in the literature over the recent six to eight years [1,3,4,5,8,9,21,22,23,29,30]. Albrecht et al. summarized CTPA techniques current at the time of publication, advanced postprocessing application to enhance image quality, and discussed the appropriate use of CT for acute PE detection [9]. Hong et al. in a review article reported that DECT is useful for detecting PE, although DECT is not regarded as routine diagnostic procedure in the evaluation of PE according to current guidelines [2].
In our study, the lowest values for pulmonary artery attenuation and image noise were achieved at the highest evaluated VMI energy (70 keV). The highest values for pulmonary artery attenuation, image noise and SNR were seen at the lowest evaluated VMI energy (40 keV). Our data are consistent with the predicted outcome for the imaging technology of VMI and similar to data from Bae et al. [30].
VMI yields results similar to single energy X-ray beams; the images are attained through linear combination of basis pair images; for example, low and high energy images can be combined at various proportions [10]. There is a relationship between the VMI energy and the amount of signal and image noise produced. It is known that VMI at 70 keV is considered to provide equivalent CT attenuation values of a conventional 120 kVp multi-energetic image, with similar attenuation values [10]. Therefore, as the VMI energy increases (>70 keV), the signal of contrast decreases, leading to lower image signal and noise. The opposite is true when the VMI energy is decreased (<70 keV). Our lowest evaluated VMI energy of 40 keV came closest to the K-edge value of iodine and resulted in the highest CT attenuation [10,20,22].
While in this study, vessel attenuation was rated best at the lowest-evaluated VMI energy (40 keV), PE visualization was rated best at VMI 50 keV. This might be owing to the higher image noise and number of hardening artefacts at 40 keV compared to 50 keV. Additionally, hardening artefacts from surrounding contrast agents might influence PE visibility. Rajiah et al. published a review of the technique and applications of multi-energy CT in an evaluation of pulmonary vasculature and concluded that VMI images at low energies are utilized to enhance vascular contrast, while VMI images at high energies allow for the reduction of image noise [10]. Our results are also in line with studies that evaluated different CTPA protocols in DECT, reporting that the optimal VMI energy in cases of incidentally detected PE are between 40 keV and 55 keV [31]. Dane et al. determined the optimal image energy for pulmonary artery evaluation on DECT and found that mean SNR and subjective image quality evaluation were highest at 40–50 keV [8]. Another study demonstrated that VMI 40 keV showed the highest detectability of PE and vessel attenuation in DECT [32]. In line with our study, Albrecht et al. found that the most suitable image energy for the evaluation of pulmonary arteries and diagnosis of PE in DECT is 50 keV due to contrast optimization with respect to CT attenuation and noise [23].
Different studies have found substantially increased image noise for VMI at 40 and 50 keV [33,34,35]. The authors noted that VMI 70 keV were subjectively preferred [33,34,35]. Similarly, in our study the subjective assessment of image noise was best at VMI energy 70 keV.
Another important point, if PE detection is clinical, is in the assessment of probability scores such as the Geneva or Wells score. Probability scores give information on the likelihood of a PE in a certain patient, and therefore the need if PE evaluation with CT is needed or not [36].
Our study has the following limitations: First, the study was limited to 80 patients (35 patients with PE) and the objective assessment of only three objective values (image noise, pulmonary artery attenuation and SNR) in the soft tissue kernel. Second, we did not evaluate the diagnostic accuracy of PE detection, but both readers had absolute agreement on the presence on PE. Third, subjective image quality analysis was only performed by two readers. Fourth, in PCD-CT the user has to choose from a set of different IQ levels. Each IQ level uses different mAs settings to obtain comparable image quality throughout patients regardless of patient size/Body Mass Index etc. The different mAs value chosen individually by the scanner might also influence CT attenuation.

5. Conclusions

While SNR was best at 40 keV, subjective PE visibility was rated highest at 50 keV potentially owing to the lower image noise and lower number of hardening artifacts.

Author Contributions

Conceptualization, K.M.; methodology, K.M. and T.Y.; software, K.M. and T.Y.; validation, K.M., T.Y. and T.F.; formal analysis, T.Y. and M.P.; investigation, T.Y.; resources, K.M. and T.F.; data curation, T.Y.; writing—original draft preparation, T.Y.; writing—review and editing, all authors.; visualization, T.Y. and K.M.; supervision, K.M.; project administration, K.M.; funding acquisition, K.M. and M.P. All authors have read and agreed to the published version of the manuscript.

Funding

K.M. and T.F. received funding from the Iten Kohaut Foundation (Switzerland). M.P. is financially supported by the Promedica Foundation (Chur, Switzerland).

Institutional Review Board Statement

The study was approved by the ethical committee Zurich (ID 2019-01676, March 22019).

Informed Consent Statement

Written informed consent for publication was obtained from participating patients.

Data Availability Statement

Data are available upon request.

Conflicts of Interest

The authors declare no conflict of interest.

References

  1. Leithner, D.; Wichmann, J.L.; Vogl, T.J.; Trommer, J.; Martin, S.S.; Scholtz, J.-E.; Bodelle, B.; de Cecco, C.N.; Duguay, T.; Nance, J.W., Jr.; et al. Virtual monoenergetic imaging and iodine perfusion maps improve diagnostic accuracy of dual-energy computed tomography pulmonary angiography with suboptimal contrast attenuation. Investig. Radiol. 2017, 52, 659–665. [Google Scholar] [CrossRef] [PubMed]
  2. Hong, Y.J.; Shim, J.; Lee, S.M.; Im, D.J.; Hur, J. Dual-energy CT for pulmonary embolism: Current and evolving clinical applications. Korean J. Radiol. 2021, 22, 1555–1568. [Google Scholar] [CrossRef] [PubMed]
  3. Moore, A.J.E.; Wachsmann, J.; Chamarthy, M.R.; Panjikaran, L.; Tanabe, Y.; Rajiah, P. Imaging of acute pulmonary embolism: An update. Cardiovasc. Diagn Ther. 2018, 8, 225–243. [Google Scholar] [CrossRef]
  4. Meier, A.; Wurnig, M.; Desbiolles, L.; Leschka, S.; Frauenfelder, T.; Alkadhi, H. Advanced virtual monoenergetic images: Improving the contrast of dual-energy CT pulmonary angiography. Clin. Radiol. 2015, 70, 1244–1251. [Google Scholar] [CrossRef]
  5. Monti, C.B.; Zanardo, M.; Cozzi, A.; Schiaffino, S.; Spagnolo, P.; Secchi, F.; De Cecco, C.N.; Sardanelli, F. Dual-energy CT performance in acute pulmonary embolism: A meta-analysis. Eur. Radiol. 2021, 31, 6248–6258. [Google Scholar] [CrossRef]
  6. Abdellatif, W.; Ebada, M.A.; Alkanj, S.; Negida, A.; Murray, N.; Khosa, F.; Nicolaou, S. Diagnostic accuracy of dual-energy CT in detection of acute pulmonary embolism: A Systematic Review and Meta-Analysis. Can. Assoc. Radiol. J. 2020, 72, 285–292. [Google Scholar] [CrossRef] [Green Version]
  7. Rawat, K.S.; Buxi, T.B.S.; Sudarsan, H.; Yadav, A.; Ghuman, S.S. Current role of multi-detector computed tomography (MDCT) in diagnosis of pulmonary embolism. Curr. Radiol. Rep. 2014, 2, 68. [Google Scholar] [CrossRef] [Green Version]
  8. Dane, B.; Patel, H.; O’Donnell, T.; Girvin, F.; Brusca-Augello, G.; Alpert, J.B.; Niu, B.; Attia, M.; Babb, J.; Ko, J.P. Image quality on dual-energy CTPA virtual monoenergetic images: Quantitative and qualitative assessment. Acad. Radiol. 2018, 25, 1075–1086. [Google Scholar] [CrossRef]
  9. Albrecht, M.H.; Bickford, M.W.; Nance, J.W., Jr.; Zhang, L.; De Cecco, C.N.; Wichmann, J.L.; Vogl, T.J.; Schoepf, U.J. State-of-the-Art pulmonary CT angiography for acute pulmonary embolism. AJR 2017, 208, 495–504. [Google Scholar] [CrossRef]
  10. Rajiah, P.; Tanabe, Y.; Partovi, S.; Moore, A. State of the art: Utility of multi-energy CT in the evaluation of pulmonary vasculature. Int. J. Cardiovasc. Imaging 2019, 35, 1509–1524. [Google Scholar] [CrossRef]
  11. Ghandour, A.; Sher, A.; Rassouli, N.; Dhanantwari, A.; Rajiah, P. Evaluation of virtual monoenergetic images on pulmonary vasculature using the dual-layer detector-based spectral computed tomography. J. Comput. Assist. Tomogr. 2018, 42, 858–865. [Google Scholar] [CrossRef] [PubMed]
  12. Alkadhi, H.; Euler, A. The Future of Computed Tomography Personalized, Functional, and Precise. Investig. Radiol. 2020, 55, 545–555. [Google Scholar] [CrossRef] [PubMed]
  13. Rajendran, K.; Petersilka, M.; Henning, A.; Shanblatt, E.R.; Schmidt, B.; Flohr, T.G.; Ferrero, A.; Baffour, F.; Diehn, F.E.; Yu, L.; et al. First Clinical Photon-counting Detector CT System: Technical Evaluation. Radiology 2022, 303, 130–138. [Google Scholar] [CrossRef] [PubMed]
  14. Yu, Z.; Leng, S.; Jorgensen, S.M.; Li, Z.; Gutjahr, R.; Chen, B.; Halaweish, A.F.; Kappler, S.; Yu, L.; Ritman, E.L.; et al. Evaluation of conventional imaging performance in a research CT system with a photon-counting detector array. Phys. Med. Biol. 2016, 61, 1572–1595. [Google Scholar] [CrossRef] [Green Version]
  15. Flohr, T.; Ulzheimer, S.; Petersilka, M.; Schmidt, B. Basic principles and clinical potential of photon-counting detector CT. Chin. J. Acad. Radiol. 2020, 3, 19–34. [Google Scholar] [CrossRef] [Green Version]
  16. Rapp, J.B.; Biko, D.M.; White, A.M.; Ramirez-Suarez, K.I.; Otero, H.J. Spectral imaging in the pediatric chest: Past, present and future. Pediatr. Radiol. 2022, 52, 1910–1920. [Google Scholar] [CrossRef]
  17. Farhadi, F.; Rajagopal, J.R.; Nikpanah, M.; Sahbaee, P.; Malayeri, A.A.; Pritchard, W.F.; Samei, E.; Jones, E.C.; Chen, M.Y. Review of Technical Advancements and Clinical Applications of Photon-counting Computed Tomography in Imaging of the Thorax. J. Thorac. Imaging 2021, 36, 84–94. [Google Scholar] [CrossRef]
  18. Leng, S.; Rajendran, K.; Gong, H.; Zhou, W.; Halaweish, A.F.; Henning, A.; Kappler, S.; Baer, M.; Fletcher, J.G.; McCollough, C.H. 150 Micron Spatial Resolution using Photon Counting Detector CT Technology: Technical Performance and First Patient Images. Investig. Radiol. 2018, 53, 655–662. [Google Scholar] [CrossRef]
  19. Booij, R.; van der Werf, N.R.; Dijkshoorn, M.L.; van der Lugt, A.; van Straten, M. Assessment of iodine contrast-to-noise ratio in virtual monoenergetic images reconstructed from dual-source energy-integrating CT and photon-counting CT data. Diagnostics 2022, 12, 1467. [Google Scholar] [CrossRef]
  20. Grant, K.L.; Flohr, T.G.; Krauss, B.; Sedlmair, M.; Thomas, C.; Schmidt, B. Assessment of an advanced image-based technique to calculate virtual monoenergetic computed tomographic images from a dual-energy examination to improve contrast-to-noise ratio in examinations using iodinated contrast media. Investig. Radiol. 2014, 49, 586–592. [Google Scholar] [CrossRef]
  21. Zeng, Y.; Geng, D.; Zhang, J. Noise-optimized virtual monoenergetic imaging technology of the third-generation dual-source computed tomography and its clinical applications. Quant. Imaging Med. Surg. 2021, 11, 4627–4643. [Google Scholar] [CrossRef] [PubMed]
  22. D’Angelo, T.; Cicero, G.; Mazziotti, S.; Ascenti, G.; Albrecht, M.H.; Martin, S.S.; Othman, A.E.; Vogl, T.J.; Wichmann, J.L. Dual energy computed tomography virtual monoenergetic imaging: Technique and clinical applications. Br. J. Radiol. 2019, 92, 20180546. [Google Scholar] [CrossRef] [PubMed]
  23. Albrecht, M.H.; Vogl, T.J.; Martin, S.S.; Nance, J.W.; Duguay, T.M.; Wichmann, J.L.; De Cecco, C.N.; Varga-Szemes, A.; van Assen, M.; Tesche, C.; et al. Review of clinical applications for virtual monoenergetic dual-energy CT. Radiology 2019, 293, 260–271. [Google Scholar] [CrossRef] [PubMed]
  24. Landis, J.R.; Koch, G.G. The measurement of observer agreement for categorical data. Biometrics 1977, 33, 159–174. [Google Scholar] [CrossRef] [Green Version]
  25. Euler, A.; Higashigaito, K.; Mergen, V.; Sartoretti, T.; Zanini, B.; Schmidt, B.; Flohr, T.G.; Ulzheimer, S.; Eberhard, M.; Alkadhi, H. High-Pitch Photon-Counting Detector Computed Tomography Angiography of the Aorta Intraindividual Comparison to Energy-Integrating Detector Computed Tomography at Equal Radiation Dose. Investig. Radiol. 2022, 57, 115–121. [Google Scholar] [CrossRef]
  26. Leng, S.; Zhou, W.; Yu, Z.; Halaweish, A.; Krauss, B.; Schmidt, B.; Yu, L.; Kappler, S.; McCollough, C. Spectral performance of a whole body research photon counting detector CT: Quantitative accuracy in derived image sets. Phys. Med. Biol. 2017, 62, 7216–7232. [Google Scholar] [CrossRef] [Green Version]
  27. Leng, S.; Bruesewitz, M.; Tao, S.; Rajendran, K.; Halaweish, A.F.; Campeau, N.G.; Fletcher, J.G.; McCollough, C.H. Photon-counting Detector CT: System Design and Clinical Applications of an Emerging Technology. RadioGraphics 2019, 39, 729–743. [Google Scholar] [CrossRef]
  28. Si-Mohamed, S.A.; Miailhes, J.; Rodesch, P.-A.; Boccalini, S.; Lacombe, H.; Leitman, V. Spectral Photon-Counting CT Technology in Chest Imaging. J. Clin. Med. 2021, 10, 5757. [Google Scholar] [CrossRef]
  29. Apfaltrer, P.; Sudarski, S.; Schneider, D.; Nance, J.W., Jr.; Haubenreisser, H.; Fink, C.; Schoenberg, S.O.; Henzler, T. Value of monoenergetic low-kV dual energy CT datasets for improved image quality of CT pulmonary angiography. Eur. J. Radiol. 2014, 83, 322–328. [Google Scholar] [CrossRef]
  30. Bae, K.; Jeon, K.N.; Cho, S.B.; Park, S.E.; Moon, J.I.; Baek, H.J.; Choi, B.H. Improved Opacification of a Suboptimally Enhanced Pulmonary Artery in Chest CT: Experience Using a Dual-Layer Detector Spectral CT. AJR 2018, 210, 734–741. [Google Scholar] [CrossRef]
  31. Weiss, J.; Notohamiprodjo, M.; Bongers, M.; Schabel, C.; Mangold, S.; Nikolaou, K.; Bamberg, F.; Othman, A.E. Effect of Noise-Optimized Monoenergetic Postprocessing on Diagnostic Accuracy for Detecting Incidental Pulmonary Embolism in Portal-Venous Phase Dual-Energy Computed Tomography. Investig. Radiol. 2017, 52, 142–147. [Google Scholar] [CrossRef] [PubMed]
  32. Weiss, J.; Notohamiprodjo, M.; Bongers, M.; Schabel, C.; Mangold, S.; Nikolaou, K.; Bamberg, F.; Othman, A.E. Noise-optimized monoenergetic post-processing improves visualization of incidental pulmonary embolism in cancer patients undergoing single-pass dual-energy computed tomography. Radiol. Med. 2017, 122, 280–287. [Google Scholar] [CrossRef] [PubMed]
  33. Albrecht, M.H.; Trommer, J.; Wichmann, J.L.; Scholtz, J.-E.; Martin, S.S.; Lehnert, T.; Vogl, T.J.; Bodelle, B. Comprehensive Comparison of Virtual Monoenergetic and Linearly Blended Reconstruction Techniques in Third-Generation Dual-Source Dual-Energy Computed Tomography Angiography of the Thorax and Abdomen. Investig. Radiol. 2016, 51, 582–590. [Google Scholar] [CrossRef] [PubMed]
  34. Jungblut, L.; Kronenberg, D.; Mergen, V.; Higashigaito, K.; Schmidt, B.; Euler, A.; Alkadhi, H.; Frauenfelder, T.; Martini, K. Impact of Contrast Enhancement and Virtual Monoenergetic Image Energy Levels on Emphysema Quantification Experience with Photon-Counting Detector Computed Tomography. Investig. Radiol. 2022, 57, 359–365. [Google Scholar] [CrossRef]
  35. Albrecht, M.H.; Trommer, J.; Wichmann, J.L.; Scholtz, J.-E.; Martin, S.S.; Lehnert, T.; Vogl, T.J.; Bodelle, B. First Performance Evaluation of an Artificial Intelligence-Based Computer-Aided Detection System for Pulmonary Nodule Evaluation in Dual-Source Photon-Counting Detector CT at Different Low-Dose Levels. Investig. Radiol. 2022, 57, 108–114. [Google Scholar]
  36. Stals, M.A.M.; Takada, T.; Kraaijpoel, N.; van Es, N.; Büller, H.R.; Courtney, D.M.; Freund, Y.; Galipienzo, J.; Le Gal, G.; Ghanima, W.; et al. Safety and Efficiency of Diagnostic Strategies for Ruling Out Pulmonary Embolism in Clinically Relevant Patient Subgroups: A Systematic Review and Individual-Patient Data Meta-analysis. Ann. Intern. Med. 2022, 175, 244–255. [Google Scholar] [CrossRef]
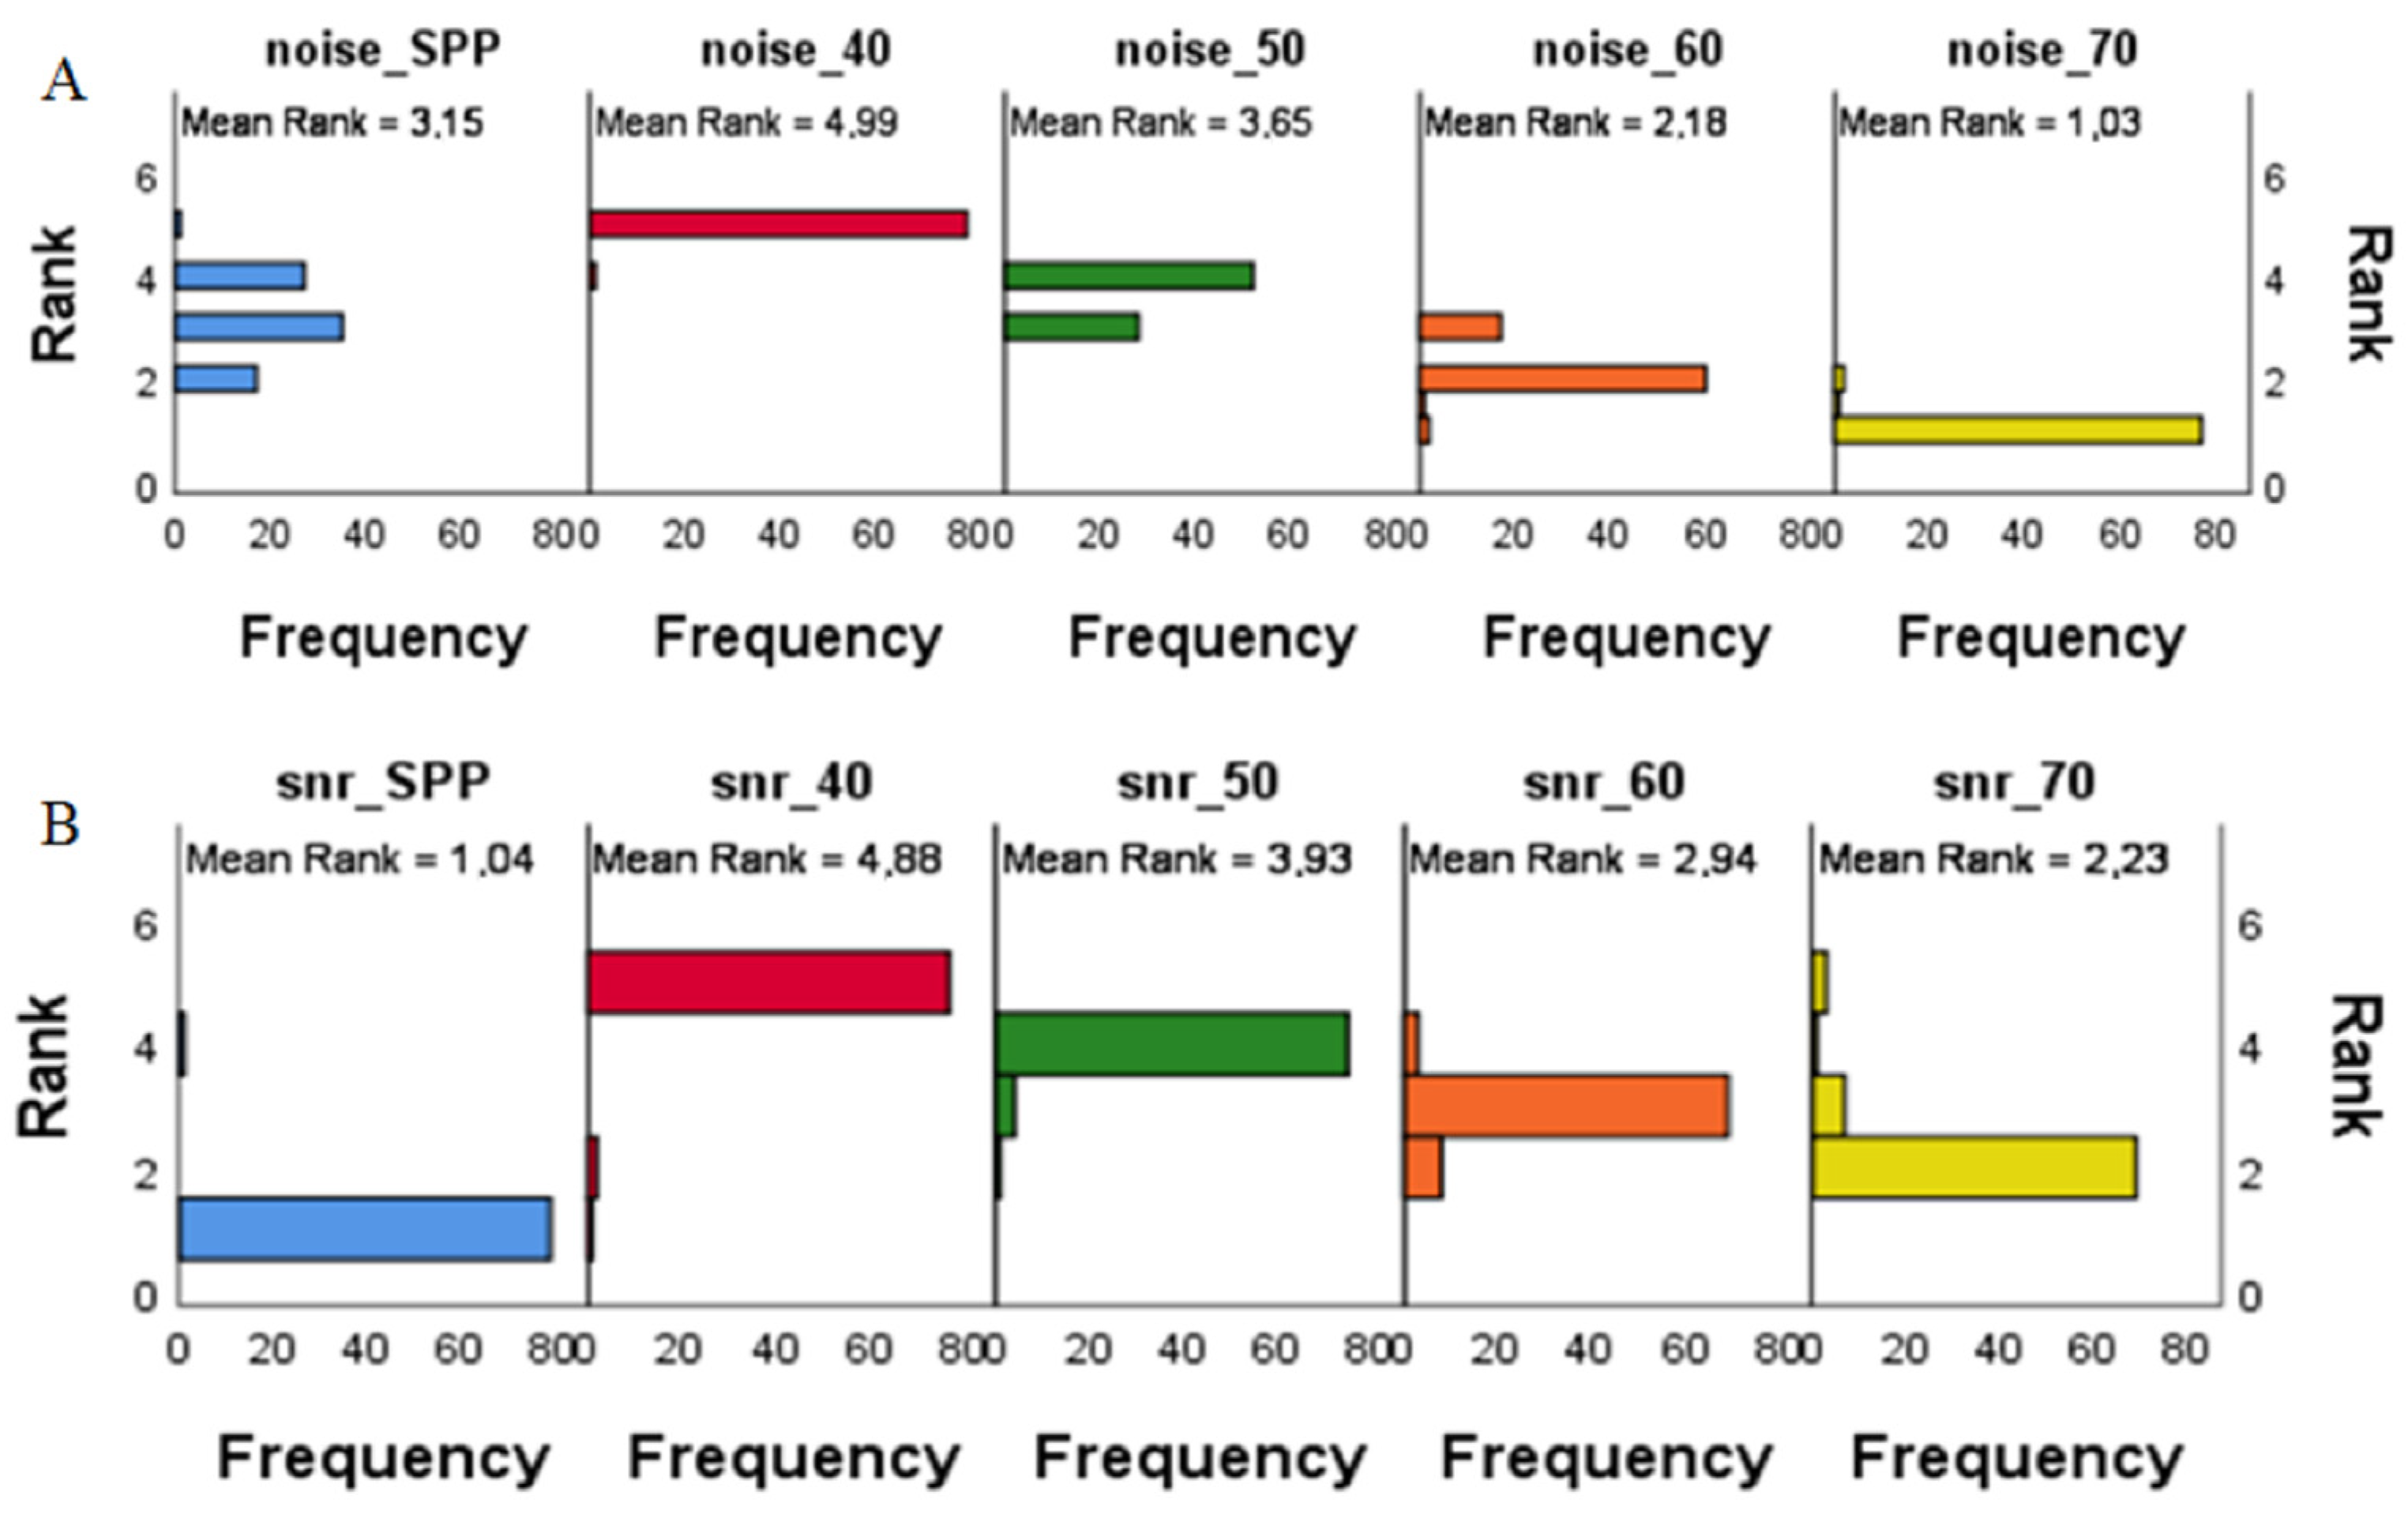
Figure 1. Bar plots of the frequency of variance by ranks for image noise (A) and Signal-to-Noise ratio (SNR) (B) at different virtual monoenergetic image (VMI) energies. The lowest ranks for image noise were achieved at the highest evaluated VMI energy (70 keV); (A) the highest ranks for SNR were achieved at the lowest evaluated VMI energy (40 keV); (B) SPP—multi-energy image with all energy spectra.
Diagnostics 12 02715 g001
Figure 2. CT images of a 72-year-old male patient at different virtual monoenergetic image (VMI) energies and the multi-energy reconstruction, including all energy spectra (SPP). The visual difference in image quality. Attenuation in the pulmonary artery and aorta depends on the image energy and decreases with increasing VMI energy.
Diagnostics 12 02715 g002
Figure 3. PE visualization. CT images of a 73-year-old male patient with pulmonary embolism (PE) in a branch of the right pulmonary artery in the lower lobe at different virtual monoenergetic image (VMI) energies and the multi-energy reconstruction, including all energy spectra (SPP). Attenuation in the pulmonary artery depends on the image energy. PE is best seen at 40 keV and 50 keV.
Diagnostics 12 02715 g003
Table 1. Distribution of pulmonary embolism in study cohort.
PEn (%)
Central2 (5.7)
Lobar18 (51.4)
Segmental19 (54.3)
Subsegmental23 (65.7)
Unilateral18 (51.4)
Bilateral17 (48.6)
Pulmonary embolism (PE), number of cases (n). In patients where PE distribution involves more locations (from center to periphery), each location was counted separately.
Table 2. Objective image quality indices at different virtual monoenergetic image (VMI) energies (keV).
Imaging ParameterSPP40 keV50 keV60 keV70 keV
Image noise
median CI95%
[range]
20.85
[19.5–21.80]
27.25
[25.80–29.85]
21.70
[20.60–22.70]
17.65
[17.25–19.00]
15.60
[14.30–16.45]
Signal
median
CI95%
[range]
358.83
[340.67–393.66]
1053.50
[976.01–1146.33]
703.16
[655.36–748.00]
488.33
[459.67–536.33]
358.83
[341.00–394.65]
SNR
median
CI95%
[range]
17.78
[14.29–20.13]
37.56
[32.48–40.48]
33.18
[27.83–35.08]
28.06
[23.60–30.78]
23.61
[19.84–27.04]
Values are given as Median CI95% [low-high range]; Signal-to-noise ratio (SNR); multienergy reconstruction including all energy spectra (SPP).
Table 3. Pairwise Comparisons of median SNR and image noise at different VMI energies.
SNRpaImage Noisepa
40/500.00140/500.000
50/600.00150/600.000
60/700.04460/700.000
40/700.00040/700.000
50/700.00050/700.000
40/600.00040/600.000
The significance level is 0.05. Signal to noise ratio (SNR). a Bonferroni correction was performed for multiple tests.
Table 4. Subjective analysis result. Qualitative image assessment of image noise, vessel attenuation, vessel sharpness and PE visualization at different VMI energies with a five-point Likert scale.
Imaging Parameter VMI Energies, keVR1
(Mean, Range)
R2
(Mean, Range)
Cohen’s Kappa (k)pn
Image noise 404.1 [3–5]4.1 [3–5]0.5840.00080
504.2 [3–5]4.3 [3–5]0.6810.00080
604.4 [3–5]4.4 [3–5]0.6440.00080
704.6 [3–5]4.6 [3–5]0.6820.00080
SPP4.8 [3–5]4.6 [3–5]0.6440.00080
Vessel attenuation 405.0 [4–5]5.0 [4–5]1.0000.00080
504.9 [4–5]4.9 [4–5]1.0000.00080
604.5 [3–5]4.5 [3–5]0.9770.00080
704.2 [3–5]4.1 [3–5]0.8990.00080
SPP4.0 [3–5]4.1 [3–5]0.5930.00080
Vessel sharpness404.7 [3–5]4.8 [4–5]07170.00080
504.5 [3–5]4.7 [4–5]0.7940.00080
604.3 [4–5]4.7 [4–5]0.8300.00080
704.2 [3–5]4.6 [3–5]0.7830.00080
SPP4.2 [3–5]4.3 [3–5]0.7830.00080
PE visualization 404.5 [3–5]4.4 [3–5]0.5150.00135
504.7 [4–5]4.7 [4–5]0.6120.00035
604.1 [3–5]3.8 [3–5]0.3920.00135
703.7 [2–5]3.5 [2–4]0.3730.00135
SPP3.8 [2–5]3.4 [2–4]0.3730.00080
The data is presented as mean (interquartile range) for Reader 1 (R1) and Reader 2 (R2), respectively. (p—the significance level < 0.05.) VMI—virtual monoenergetic images; PE—pulmonary embolism, multi-energy reconstruction including all energy spectra (SPP).
Publisher’s Note: MDPI stays neutral with regard to jurisdictional claims in published maps and institutional affiliations.