
Ultrasonography Assessment Based on Muscle Thickness and Echo Intensity in Post-Polio Patients
 , and
, and
Abstract
:1. Introduction
2. Materials and Methods
2.1. Experimental Subjects
2.2. Anthropometric Measurements
2.3. Muscle Strength
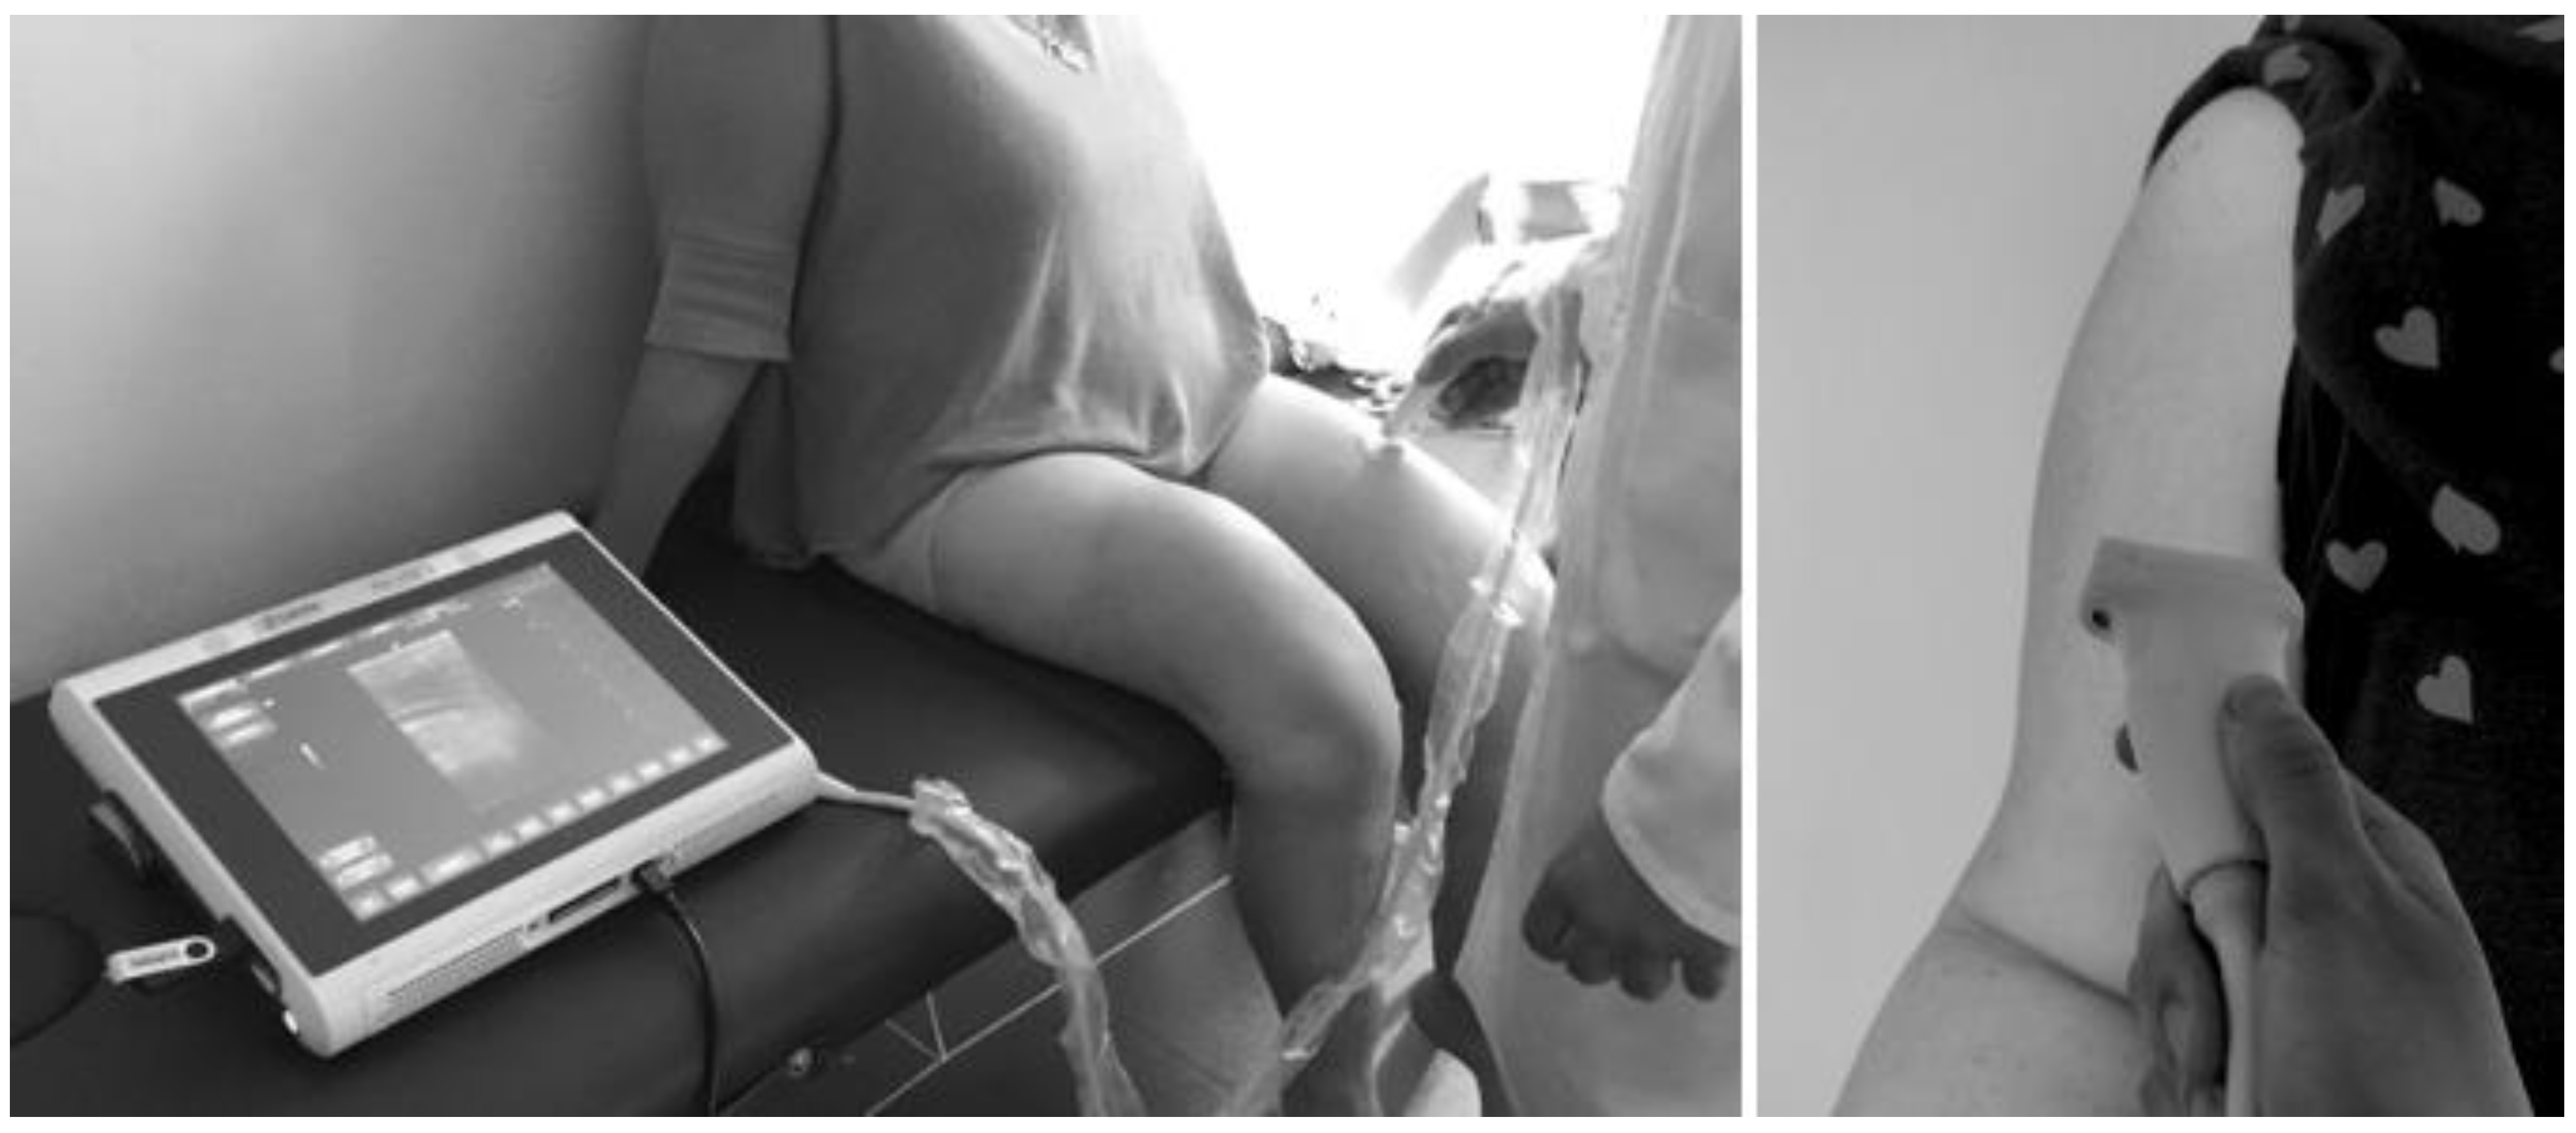
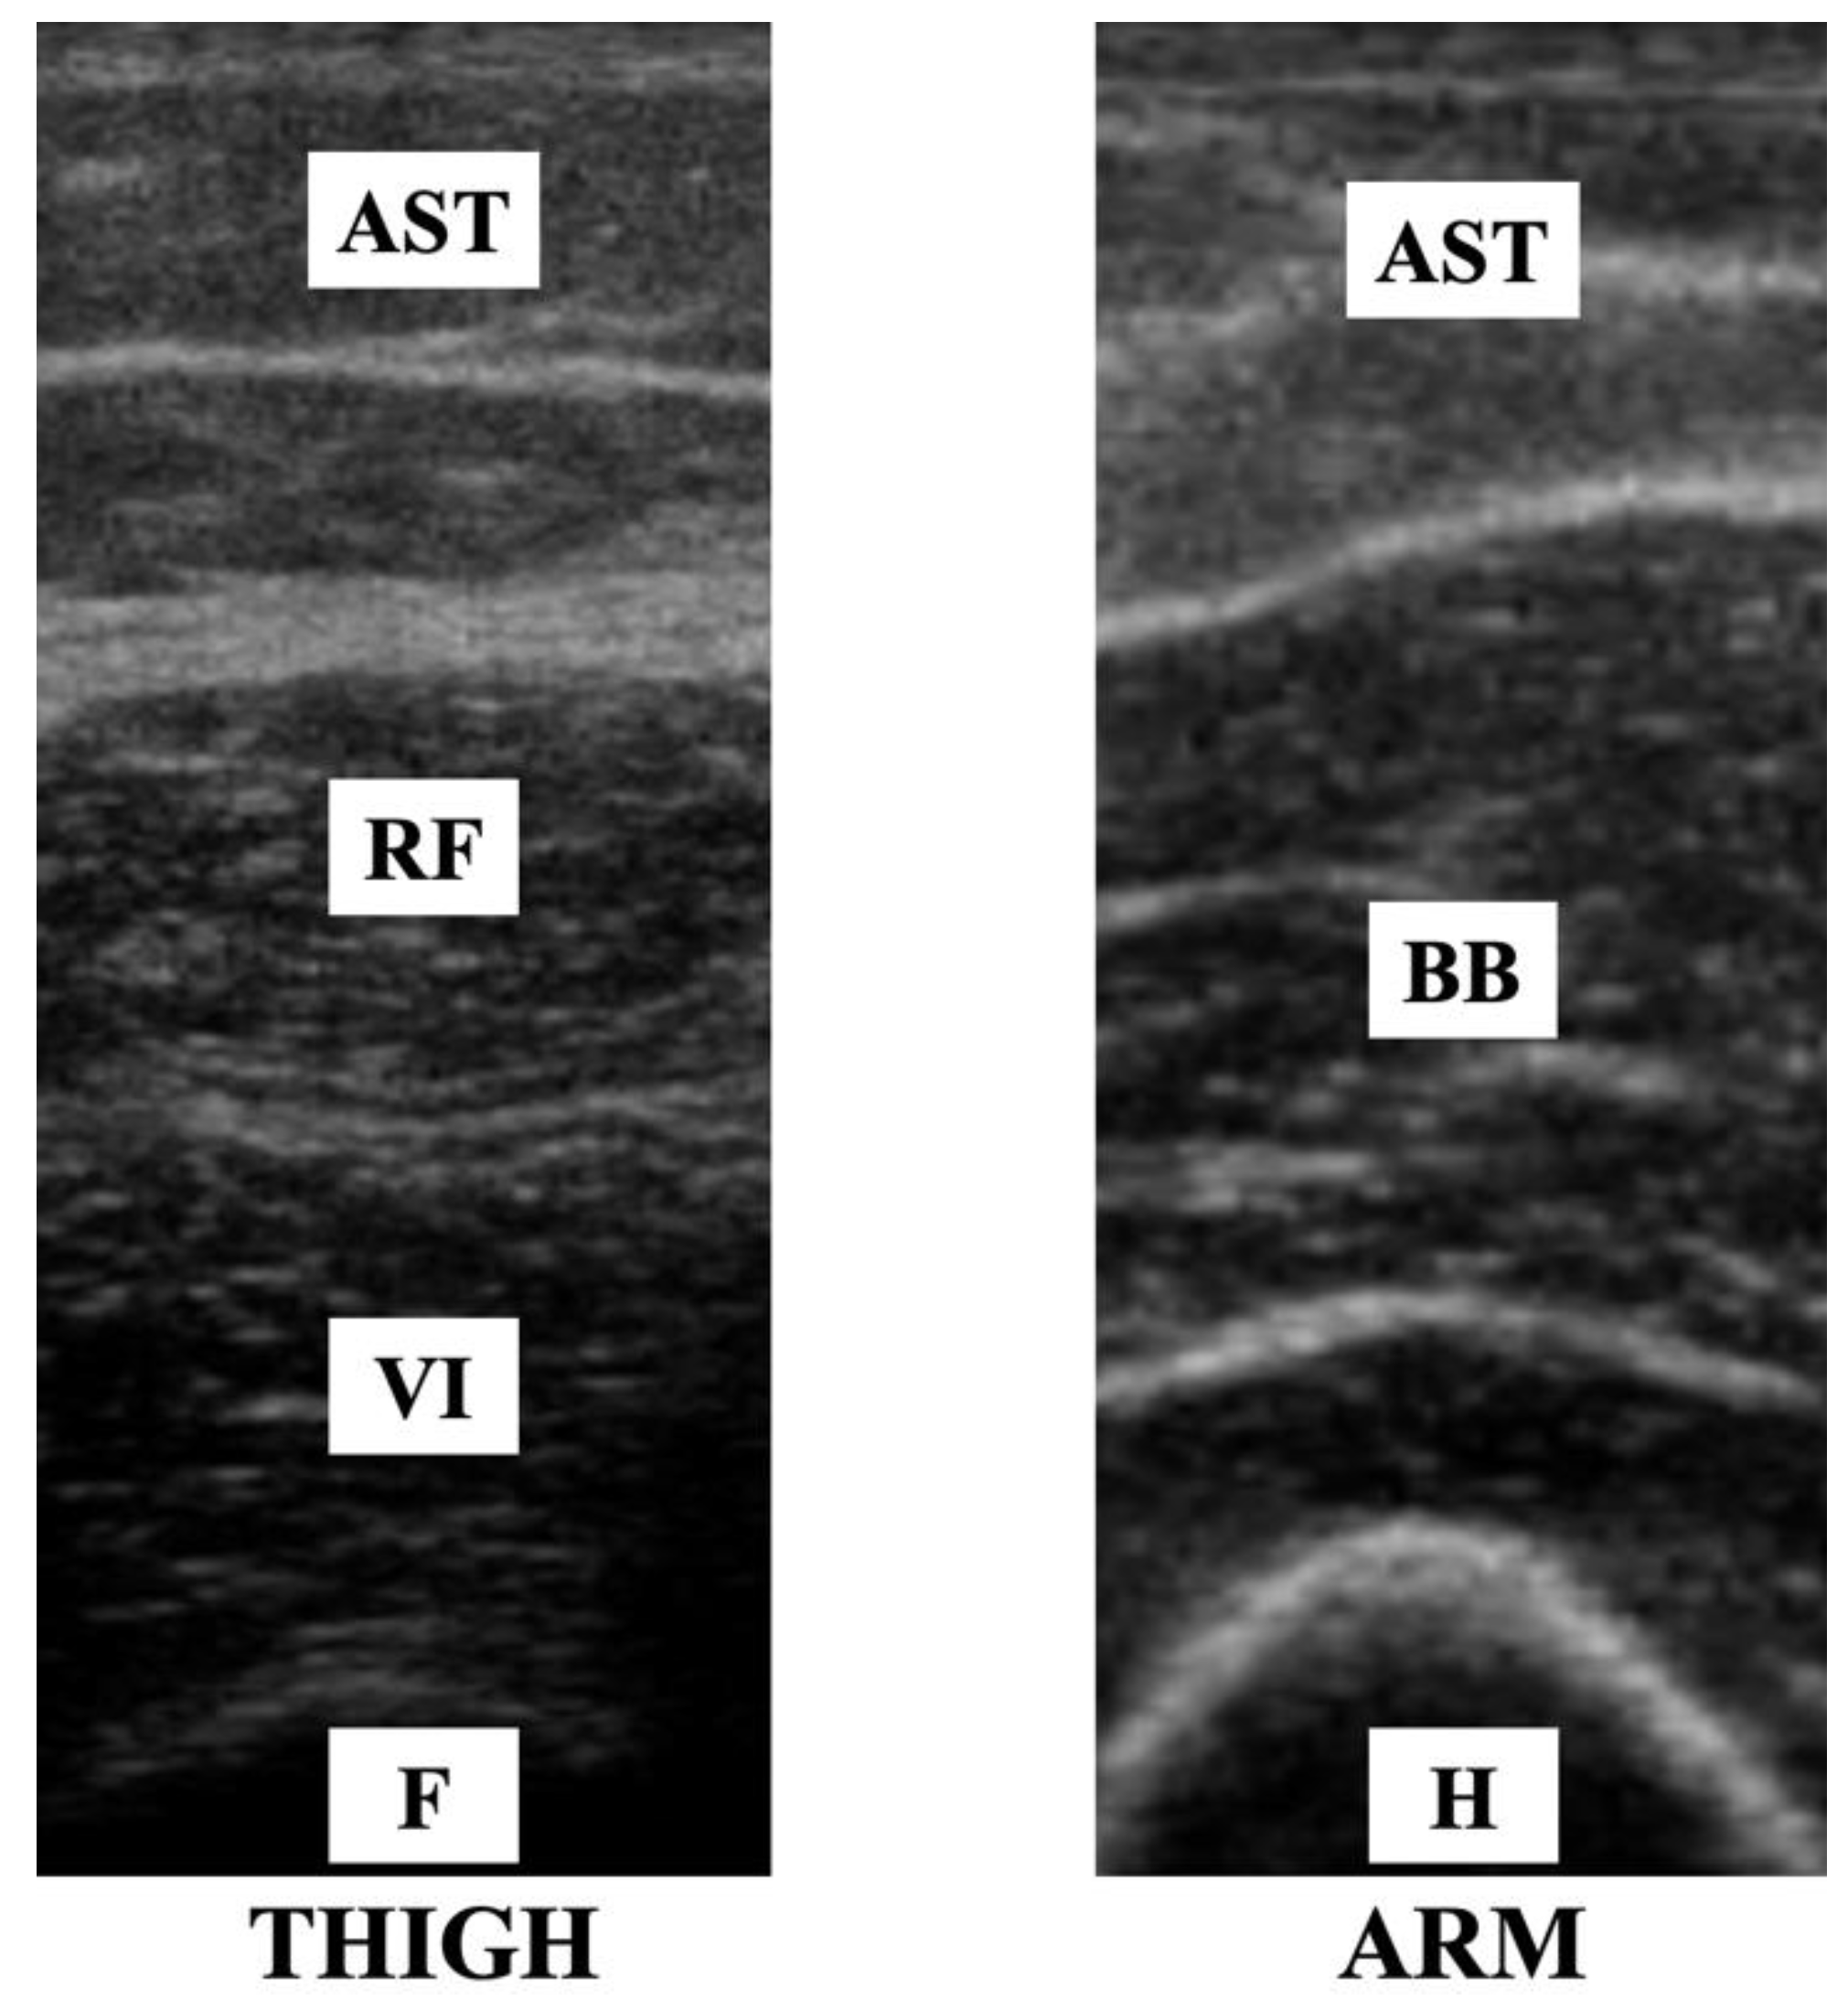
2.4. Muscle Thickness and Echo Intensity
2.5. Statistical Analysis
3. Results
4. Discussion
5. Conclusions
Author Contributions
Funding
Institutional Review Board Statement
Informed Consent Statement
Data Availability Statement
Acknowledgments
Conflicts of Interest
References
- Lopez-Leon, S.; Wegman-Ostrosky, T.; Perelman, C.; Sepulveda, R.; Rebolledo, P.A.; Cuapio, A.; Villapol, S. More than 50 Long-Term Effects of COVID-19: A Systematic Review and Meta-Analysis. Sci. Rep. 2021, 11, 16144. [Google Scholar] [CrossRef] [PubMed]
- Rodríguez Ledo, P.; Armenteros del Olmo, L.; Rodríguez Rodríguez, E.; Gómez Acebo, F. Descripción de los 201 síntomas de la afectación multiorgánica producida en los pacientes afectados por la COVID-19 persistente. Med. Gen. Fam. 2021, 10, 60–68. [Google Scholar] [CrossRef]
- Huang, C.; Huang, L.; Wang, Y.; Li, X.; Ren, L.; Gu, X.; Kang, L.; Guo, L.; Liu, M.; Zhou, X.; et al. 6-month consequences of COVID-19 in patients discharged from hospital: A cohort study. Lancet 2021, 397, 220–232. [Google Scholar] [CrossRef]
- Cousins, S. Accounting for polio survivors in the post-polio world. Lancet 2017, 389, 1503–1504. [Google Scholar] [CrossRef]
- Dalakas, M.C. The post-polio syndrome as an evolved clinical entity. Definition and clinical description. Ann. N. Y. Acad. Sci. 1995, 753, 68–80. [Google Scholar] [CrossRef]
- Laffont, I.; Julia, M.; Tiffreau, V.; Yelnik, A.; Herisson, C.; Pelissier, J. Aging and sequelae of poliomyelitis. Ann. Phys. Rehabil. Med. 2010, 53, 24–33. [Google Scholar] [CrossRef] [Green Version]
- Lo, J.K.; Robinson, L.R. Postpolio syndrome and the late effects of poliomyelitis. Part 1. pathogenesis. biomechanical considerations. diagnosis. and investigations. Muscle Nerve 2018, 58, 751–759. [Google Scholar] [CrossRef]
- March of Dimes. Identifying Best Practices in Diagnosis and Care. From: International Conference on Post-Polio Syndrome [Internet]. Warm Springs. GA; 2000. Available online: http://www.polioplace.org/sites/default/files/files/MOD-Identifying.pdf (accessed on 14 August 2019).
- Cashman, N.R.; Maselli, R.; Wollmann, R.L.; Roos, R.; Simon, R.; Antel, J.P. Late denervation in patients with antecedent paralytic poliomyelitis. N. Engl. J. Med. 1987, 317, 7–12. [Google Scholar] [CrossRef]
- Nelson, K.R. Creatine kinase and fibrillation potentials in patients with late sequelae of polio. Muscle Nerve 1990, 13, 722–725. [Google Scholar] [CrossRef]
- Peach, P.E. Overwork weakness with evidence of muscle damage in a patient with residual paralysis from polio. Arch. Phys. Med. Rehabil. 1990, 71, 248–250. [Google Scholar]
- Trojan, D.A.; Gendron, D.; Cashman, N.R. Electrophysiology and electrodiagnosis of the post-polio motor unit. Orthopedics 1991, 14, 1353–1361. [Google Scholar] [CrossRef] [PubMed]
- van Alfen, N.; Gijsbertse, K.; de Korte, C.L. How useful is muscle ultrasound in the diagnostic workup of neuromuscular diseases? Curr. Opin. Neurol. 2018, 31, 568–574. [Google Scholar] [CrossRef] [PubMed]
- Chang, K.-V.; Wu, W.-T.; Huang, K.-C.; Jan, W.H.; Han, D.-S. Limb muscle quality and quantity in elderly adults with dynapenia but not sarcopenia: An ultrasound imaging study. Exp. Gerontol. 2018, 108, 54–61. [Google Scholar] [CrossRef] [PubMed]
- Tay, M.R.J.; Kong, K.H. Ultrasound Measurements of Rectus Femoris and Locomotor Outcomes in Patients with Spinal Cord Injury. Life 2022, 12, 1073. [Google Scholar] [CrossRef]
- Bickerstaffe, A.; Beelen, A.; Zwarts, M.J.; Nollet, F.; van Dijk, J.P. Quantitative muscle ultrasound and quadriceps strength in patients with post-polio syndrome. Muscle Nerve 2015, 51, 24–29. [Google Scholar] [CrossRef]
- Ross, S.E.; Guskiewicz, K.M.; Yu, B. Single-leg jump-landing stabilization times in subjects with functionally unstable ankles. J. Athl. Train. 2005, 40, 298–304. [Google Scholar]
- Bandinelli, S.; Benvenuti, E.; Del Lungo, I.; Baccini, M.; Benvenuti, F.; Di Iorio, A.; Ferrucci, L. Measuring muscular strength of the lower limbs by hand-held dynamometer: A standard protocol. Aging 1999, 11, 287–293. [Google Scholar] [CrossRef]
- Arts, I.M.P.; Pillen, S.; Schelhaas, H.J.; Overeem, S.; Zwarts, M.J. Normal values for quantitative muscle ultrasonography in adults. Muscle Nerve 2010, 41, 32–41. [Google Scholar] [CrossRef]
- Caresio, C.; Molinari, F.; Emanuel, G.; Minetto, M.A. Muscle echo intensity: Reliability and conditioning factors. Clin. Physiol. Funct. Imaging 2015, 35, 393–403. [Google Scholar] [CrossRef]
- Pahor, M.; Manini, T.; Cesari, M. Sarcopenia: Clinical evaluation. biological markers and other evaluation tools. J. Nutr. Health Aging 2009, 13, 724–728. [Google Scholar] [CrossRef] [Green Version]
- Arts, I.M.; van Rooij, F.G.; Overeem, S.; Pillen, S.; Janssen, H.M.; Schelhaas, H.J.; Zwarts, M.J. Quantitative muscle ultrasonography in amyotrophic lateral sclerosis. Ultrasound Med. Biol. 2008, 34, 354–361. [Google Scholar] [CrossRef] [PubMed]
- Ríos-Díaz, J.; Del Baño-Aledo, M.E.; Tembl-Ferrairó, J.I.; Chumillas, M.J.; Vázquez-Costa, J.F.; Martínez-Payá, J.J. Quantitative neuromuscular ultrasound analysis as biomarkers in amyotrophic lateral sclerosis. Eur. Radiol. 2019, 29, 4266–4275. [Google Scholar] [CrossRef] [PubMed]
- Zaidman, C.M.; Wu, J.S.; Kapur, K.; Pasternak, A.; Madabusi, L.; Yim, S.; Pacheck, A.; Szelag, H.; Harrington, T.; Darras, B.T.; et al. Quantitative muscle ultrasound detects disease progression in Duchenne muscular dystrophy. Ann. Neurol. 2017, 81, 633–640. [Google Scholar] [CrossRef] [PubMed] [Green Version]
- Verbeek, R.J.; Sentner, C.P.; Smit GP, A.; Maurits, N.M.; Derks, T.G.; van der Hoeven, J.H.; Sival, D.A. Muscle Ultrasound in Patients with Glycogen Storage Disease Types I and III. Ultrasound Med. Biol. 2016, 42, 133–142. [Google Scholar] [CrossRef]
- Wu, J.S.; Darras, B.T.; Rutkove, S.B. Assessing spinal muscular atrophy with quantitative ultrasound. Neurology 2010, 75, 526–531. [Google Scholar] [CrossRef]
- Pillen, S.; Tak, R.O.; Zwarts, M.J.; Lammens, M.M.; Verrijp, K.N.; Arts, I.M.; van der Laak, J.A.; Hoogerbrugge, P.M.; van Engelen, B.G.; Verrips, A. Skeletal muscle ultrasound: Correlation between fibrous tissue and echo intensity. Ultrasound. Med. Biol. 2009, 35, 443–446. [Google Scholar] [CrossRef]
- Arts, I.M.; Schelhaas, H.J.; Verrijp, K.C.; Zwarts, M.J.; Overeem, S.; van der Laak, J.A.; Lammens, M.M.; Pillen, S. Intramuscular fibrous tissue determines muscle echo intensity in amyotrophic lateral sclerosis. Muscle Nerve 2012, 45, 449–450. [Google Scholar] [CrossRef]
- Chi-Fishman, G.; Hicks, J.E.; Cintas, H.M.; Sonies, B.C.; Gerber, L.H. Ultrasound imaging distinguishes between normal and weak muscle. Arch. Phys. Med. Rehabil. 2004, 85, 980–986. [Google Scholar] [CrossRef]
- Heckmatt, J.Z.; Leeman, S.; Dubowitz, V. Ultrasound imaging in the diagnosis of muscle disease. J. Pediatr. 1982, 101, 656–660. [Google Scholar] [CrossRef]
- Mayans, D.; Cartwright, M.S.; Walker, F.O. Neuromuscular ultrasonography: Quantifying muscle and nerve measurements. Phys. Med. Rehabil. Clin. N. Am. 2012, 23, 133–148. [Google Scholar] [CrossRef] [Green Version]
- Reimers, K.; Reimers, C.D.; Wagner, S.; Paetzke, I.; Pongratz, D.E. Skeletal muscle sonography: A correlative study of echogenicity and morphology. J. Ultrasound Med. Off. J. Am. Inst. Ultrasound Med. 1993, 12, 73–77. [Google Scholar] [CrossRef] [PubMed]
- Li Hi Shing, S.; Chipika, R.H.; Finegan, E.; Murray, D.; Hardiman, O.; Bede, P. Post-polio Syndrome: More Than Just a Lower Motor Neuron Disease. Front. Neurol. 2019, 10, 773. [Google Scholar] [CrossRef] [PubMed]
- Wildwing, T.; Holt, N. The neurological symptoms of COVID-19: A systematic overview of systematic reviews. comparison with other neurological conditions and implications for healthcare services. Ther. Adv. Chronic Dis. 2021, 12, 2040622320976979. [Google Scholar] [CrossRef] [PubMed]


| Cases | Controls | p | |
|---|---|---|---|
| Age (years) | 56.96 (3.44) | 53.51 (12.99) | 0.19 |
| Height (m) | 1.61 (0.13) | 1.64 (0.07) | 0.35 |
| Weight (kg) | 71.25 (12.91) | 74.35 (12.16) | 0.36 |
| BMI (kg/m2) | 27.20 (3.90) | 27.60 (4.40) | 0.72 |
| Fat average (%) | 39.16 (8.30) | 36.01 (8.54) | 0.19 |
| Lean mass (kg) | 25.30 (4.50) | 27.56 (4.05) | 0.07 |
| Cases Mean (SD) | Controls Mean (SD) | p-Value | t-Student | |
|---|---|---|---|---|
| BB MT (cm) | 2.59 (0.56) | 2.49 (0.42) | 0.70 | 0.48 |
| BB MT in MVC (cm) | 3.37 (0.66) | 3.30 (0.45) | 0.42 | 0.67 |
| RF MT (cm) | 0.99 (0.45) | 1.96 (0.37) | <0.001 | −8.37 |
| RF MT in MVC (cm) | 1.11 (0.54) | 2.28 (0.40) | <0.001 | −8.80 |
| BB EI (0–255) | 62.38 (12.88) | 52.03 (15.80) | 0.01 | 2.62 |
| RF EI (0–255) | 89.16 (22.31) | 54.68 (13.30) | <0.001 | 6.72 |
| HGS (kg) | 25.65 (12.80) | 29.57 (8.41) | 0.19 | −1.32 |
| KES (Nm) | 15.55 (29.06) | 154.40 (42.84) | <0.001 | −13.90 |
| Most Affected (SD) | Less Affected (SD) | p-Value | t-Student | |
|---|---|---|---|---|
| RF MT (cm) | 0.98 (0.47) | 1.27 (0.43) | 0.004 | −3.19 |
| RF MT in MVC (cm) | 1.11 (0.56) | 1.45 (0.48) | 0.007 | −2.96 |
| RF EI (0–255) | 93.47 (20.59) | 76.79 (24.27) | <0.001 | 6.11 |
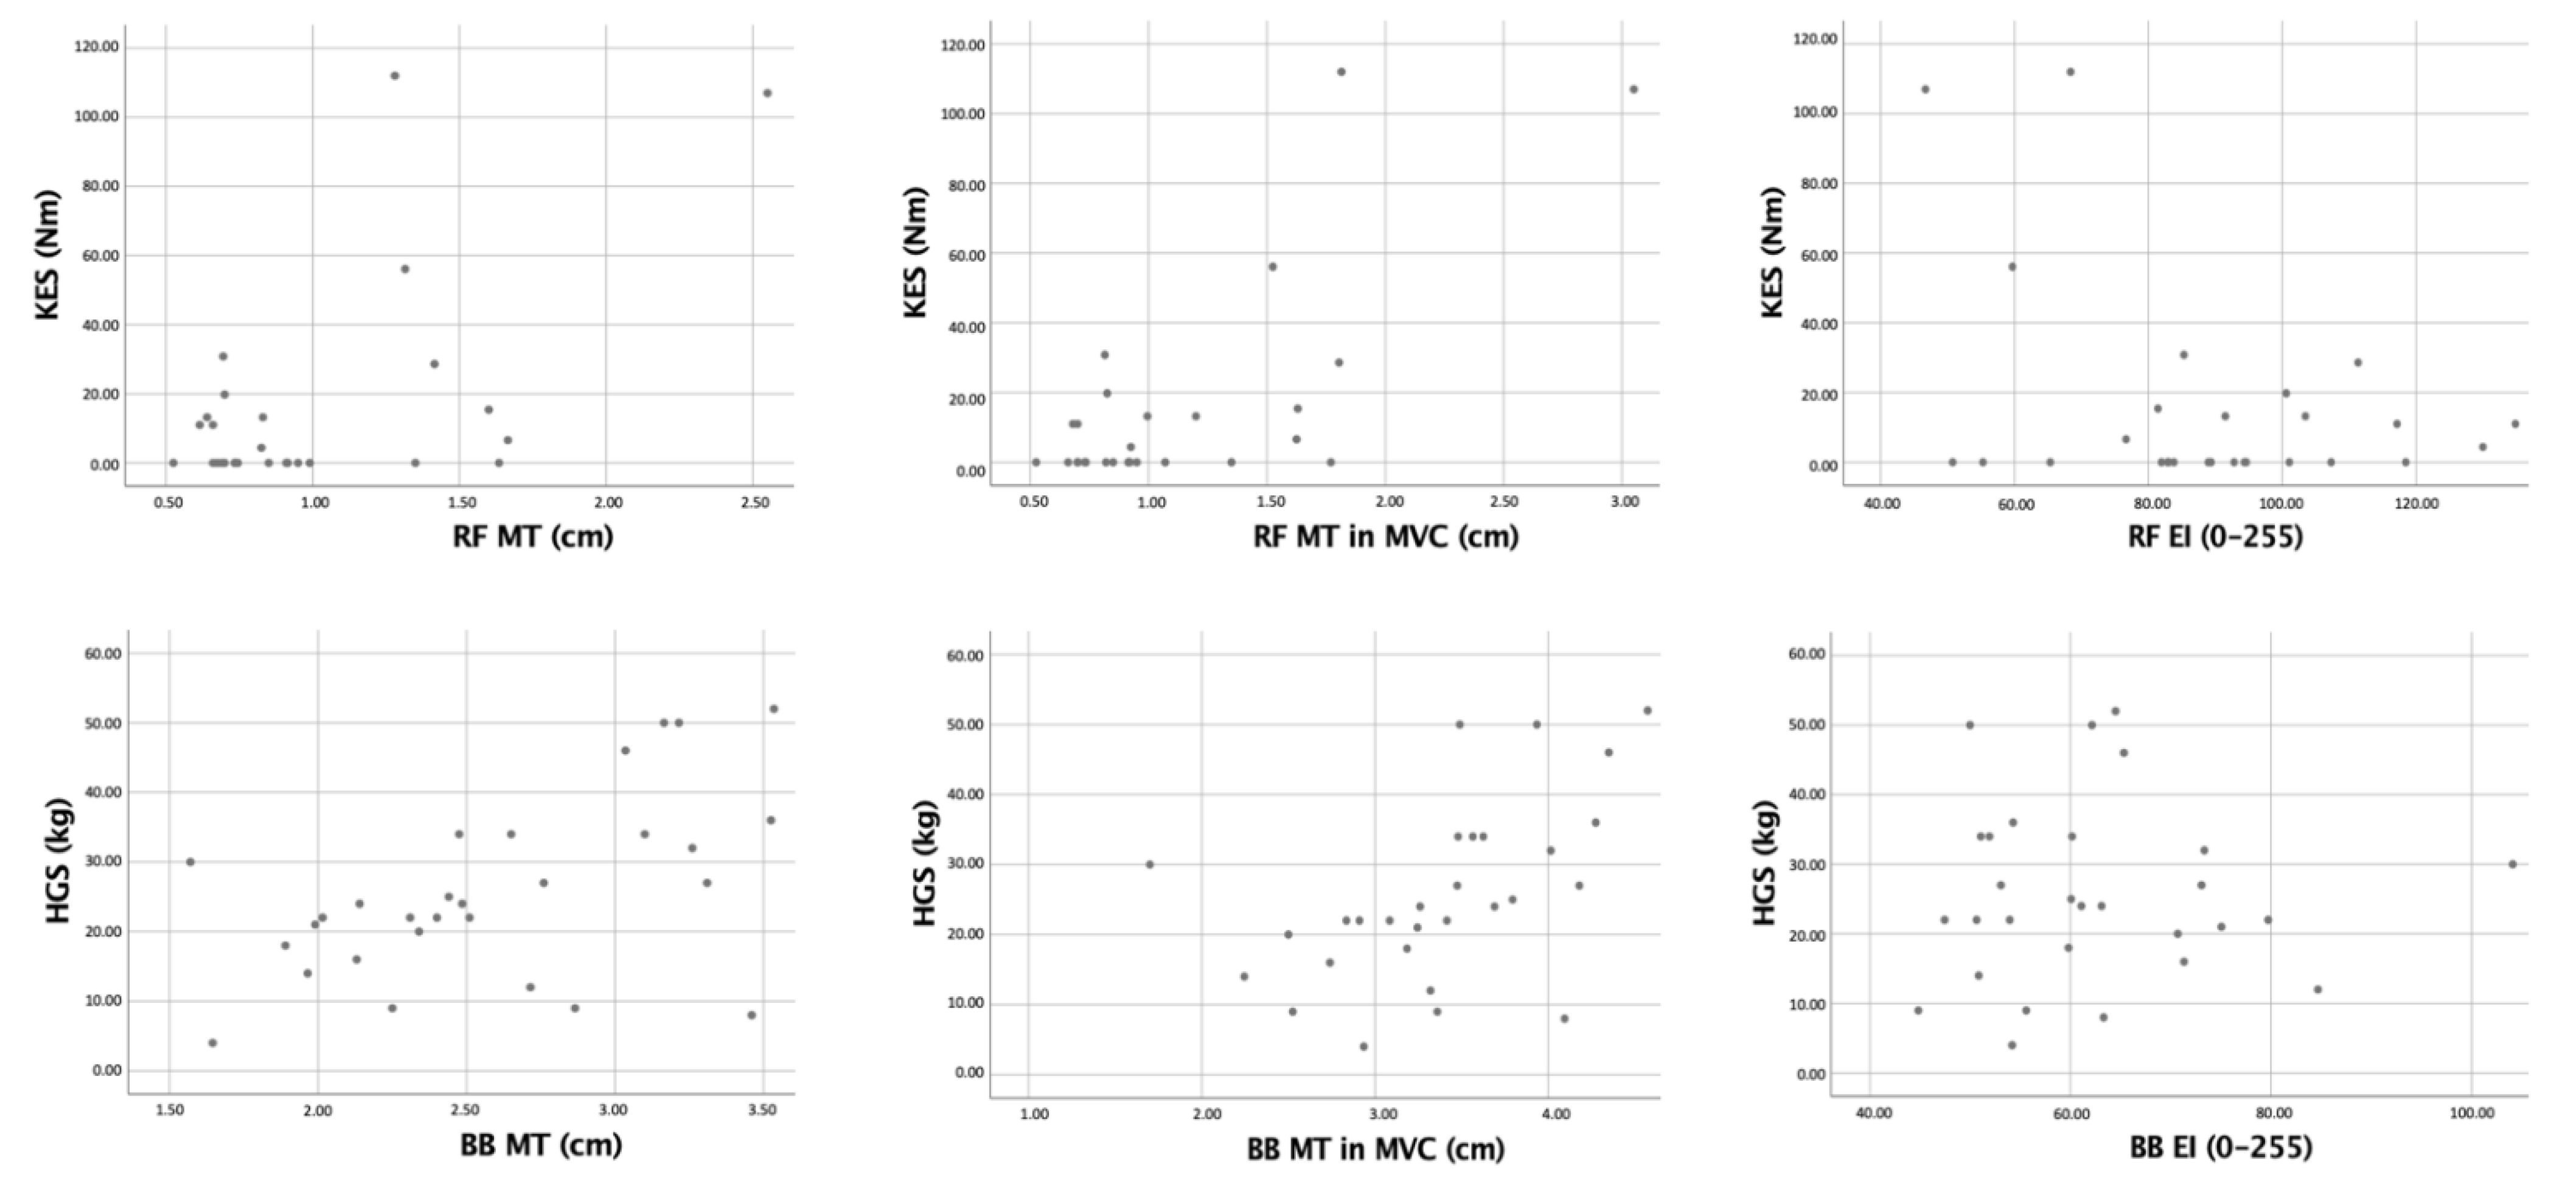
| Variable | Pearson Coefficient |
|---|---|
| BB MT (cm) | 0.53 * |
| BB MT in MVC (cm) | 0.51 * |
| RF MT (cm) | 0.58 ** |
| RF MT in MVC (cm) | 0.72 ** |
| BB EI (0–255) | 0.15 |
| RF EI (0–255) | −0.38 * |
Publisher’s Note: MDPI stays neutral with regard to jurisdictional claims in published maps and institutional affiliations. |
© 2022 by the authors. Licensee MDPI, Basel, Switzerland. This article is an open access article distributed under the terms and conditions of the Creative Commons Attribution (CC BY) license (https://creativecommons.org/licenses/by/4.0/).
Share and Cite
Mateos-Angulo, Á.; Salazar-Agulló, J.A.; Roldán-Jiménez, C.; Trinidad-Fernández, M.; Cuesta-Vargas, A.I. Ultrasonography Assessment Based on Muscle Thickness and Echo Intensity in Post-Polio Patients. Diagnostics 2022, 12, 2743. https://doi.org/10.3390/diagnostics12112743
Mateos-Angulo Á, Salazar-Agulló JA, Roldán-Jiménez C, Trinidad-Fernández M, Cuesta-Vargas AI. Ultrasonography Assessment Based on Muscle Thickness and Echo Intensity in Post-Polio Patients. Diagnostics. 2022; 12(11):2743. https://doi.org/10.3390/diagnostics12112743
Chicago/Turabian StyleMateos-Angulo, Álvaro, José Andrés Salazar-Agulló, Cristina Roldán-Jiménez, Manuel Trinidad-Fernández, and Antonio Ignacio Cuesta-Vargas. 2022. "Ultrasonography Assessment Based on Muscle Thickness and Echo Intensity in Post-Polio Patients" Diagnostics 12, no. 11: 2743. https://doi.org/10.3390/diagnostics12112743