
Multi-Channel Based Image Processing Scheme for Pneumonia Identification

 ,
,  , ,
, ,  , and
, and 
Abstract
:1. Introduction
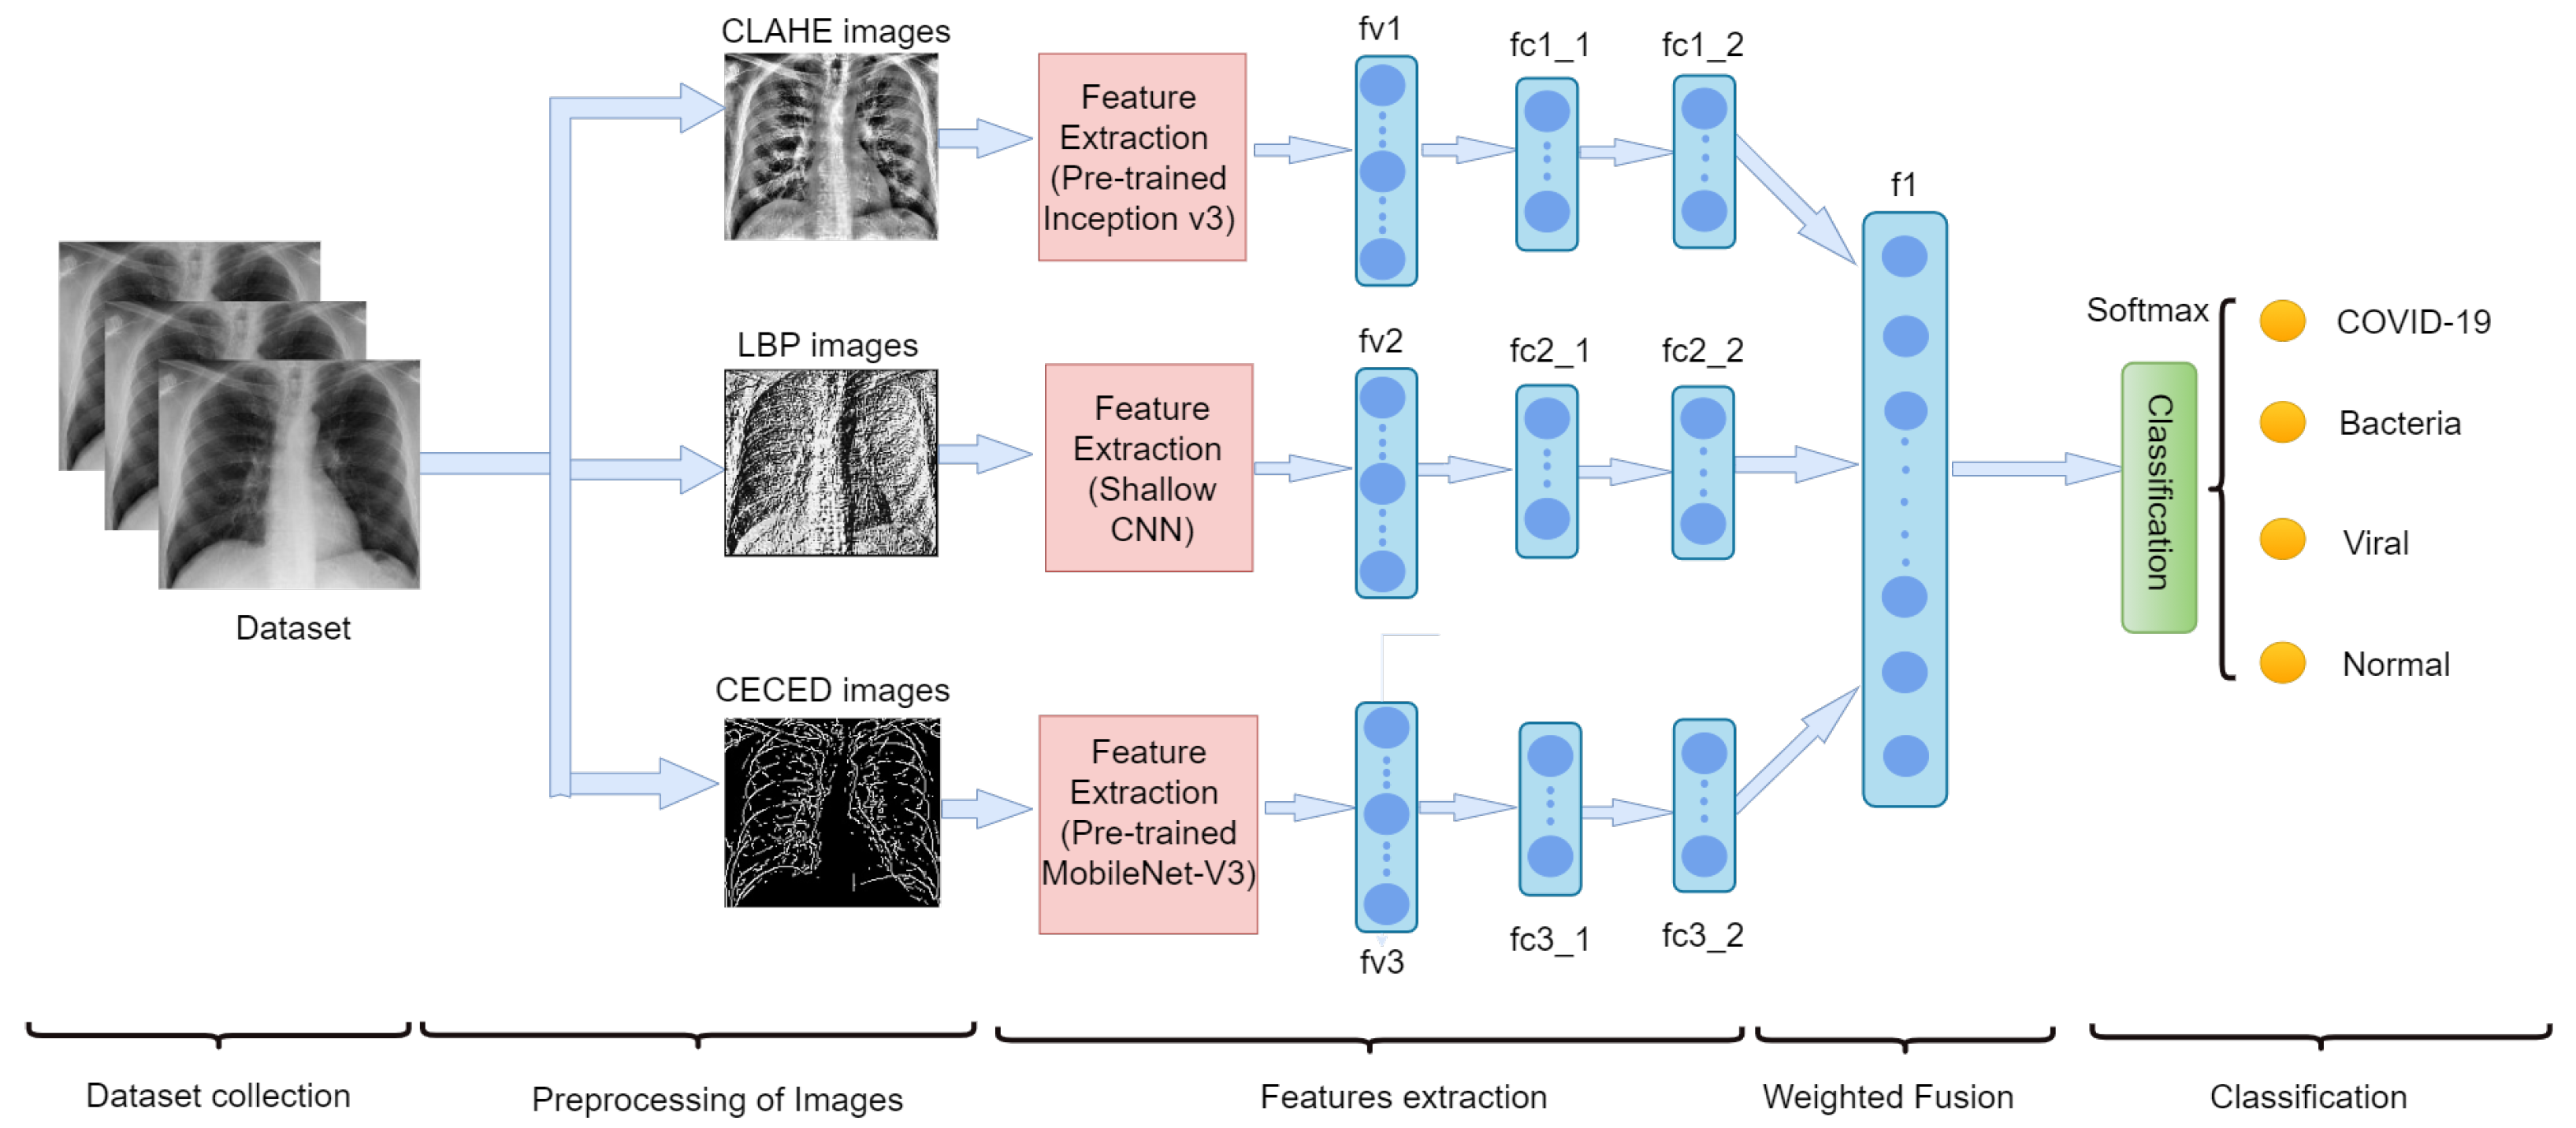
- We preprocess our CXR images into three forms, namely: LBP, CLAHE, and CECED.
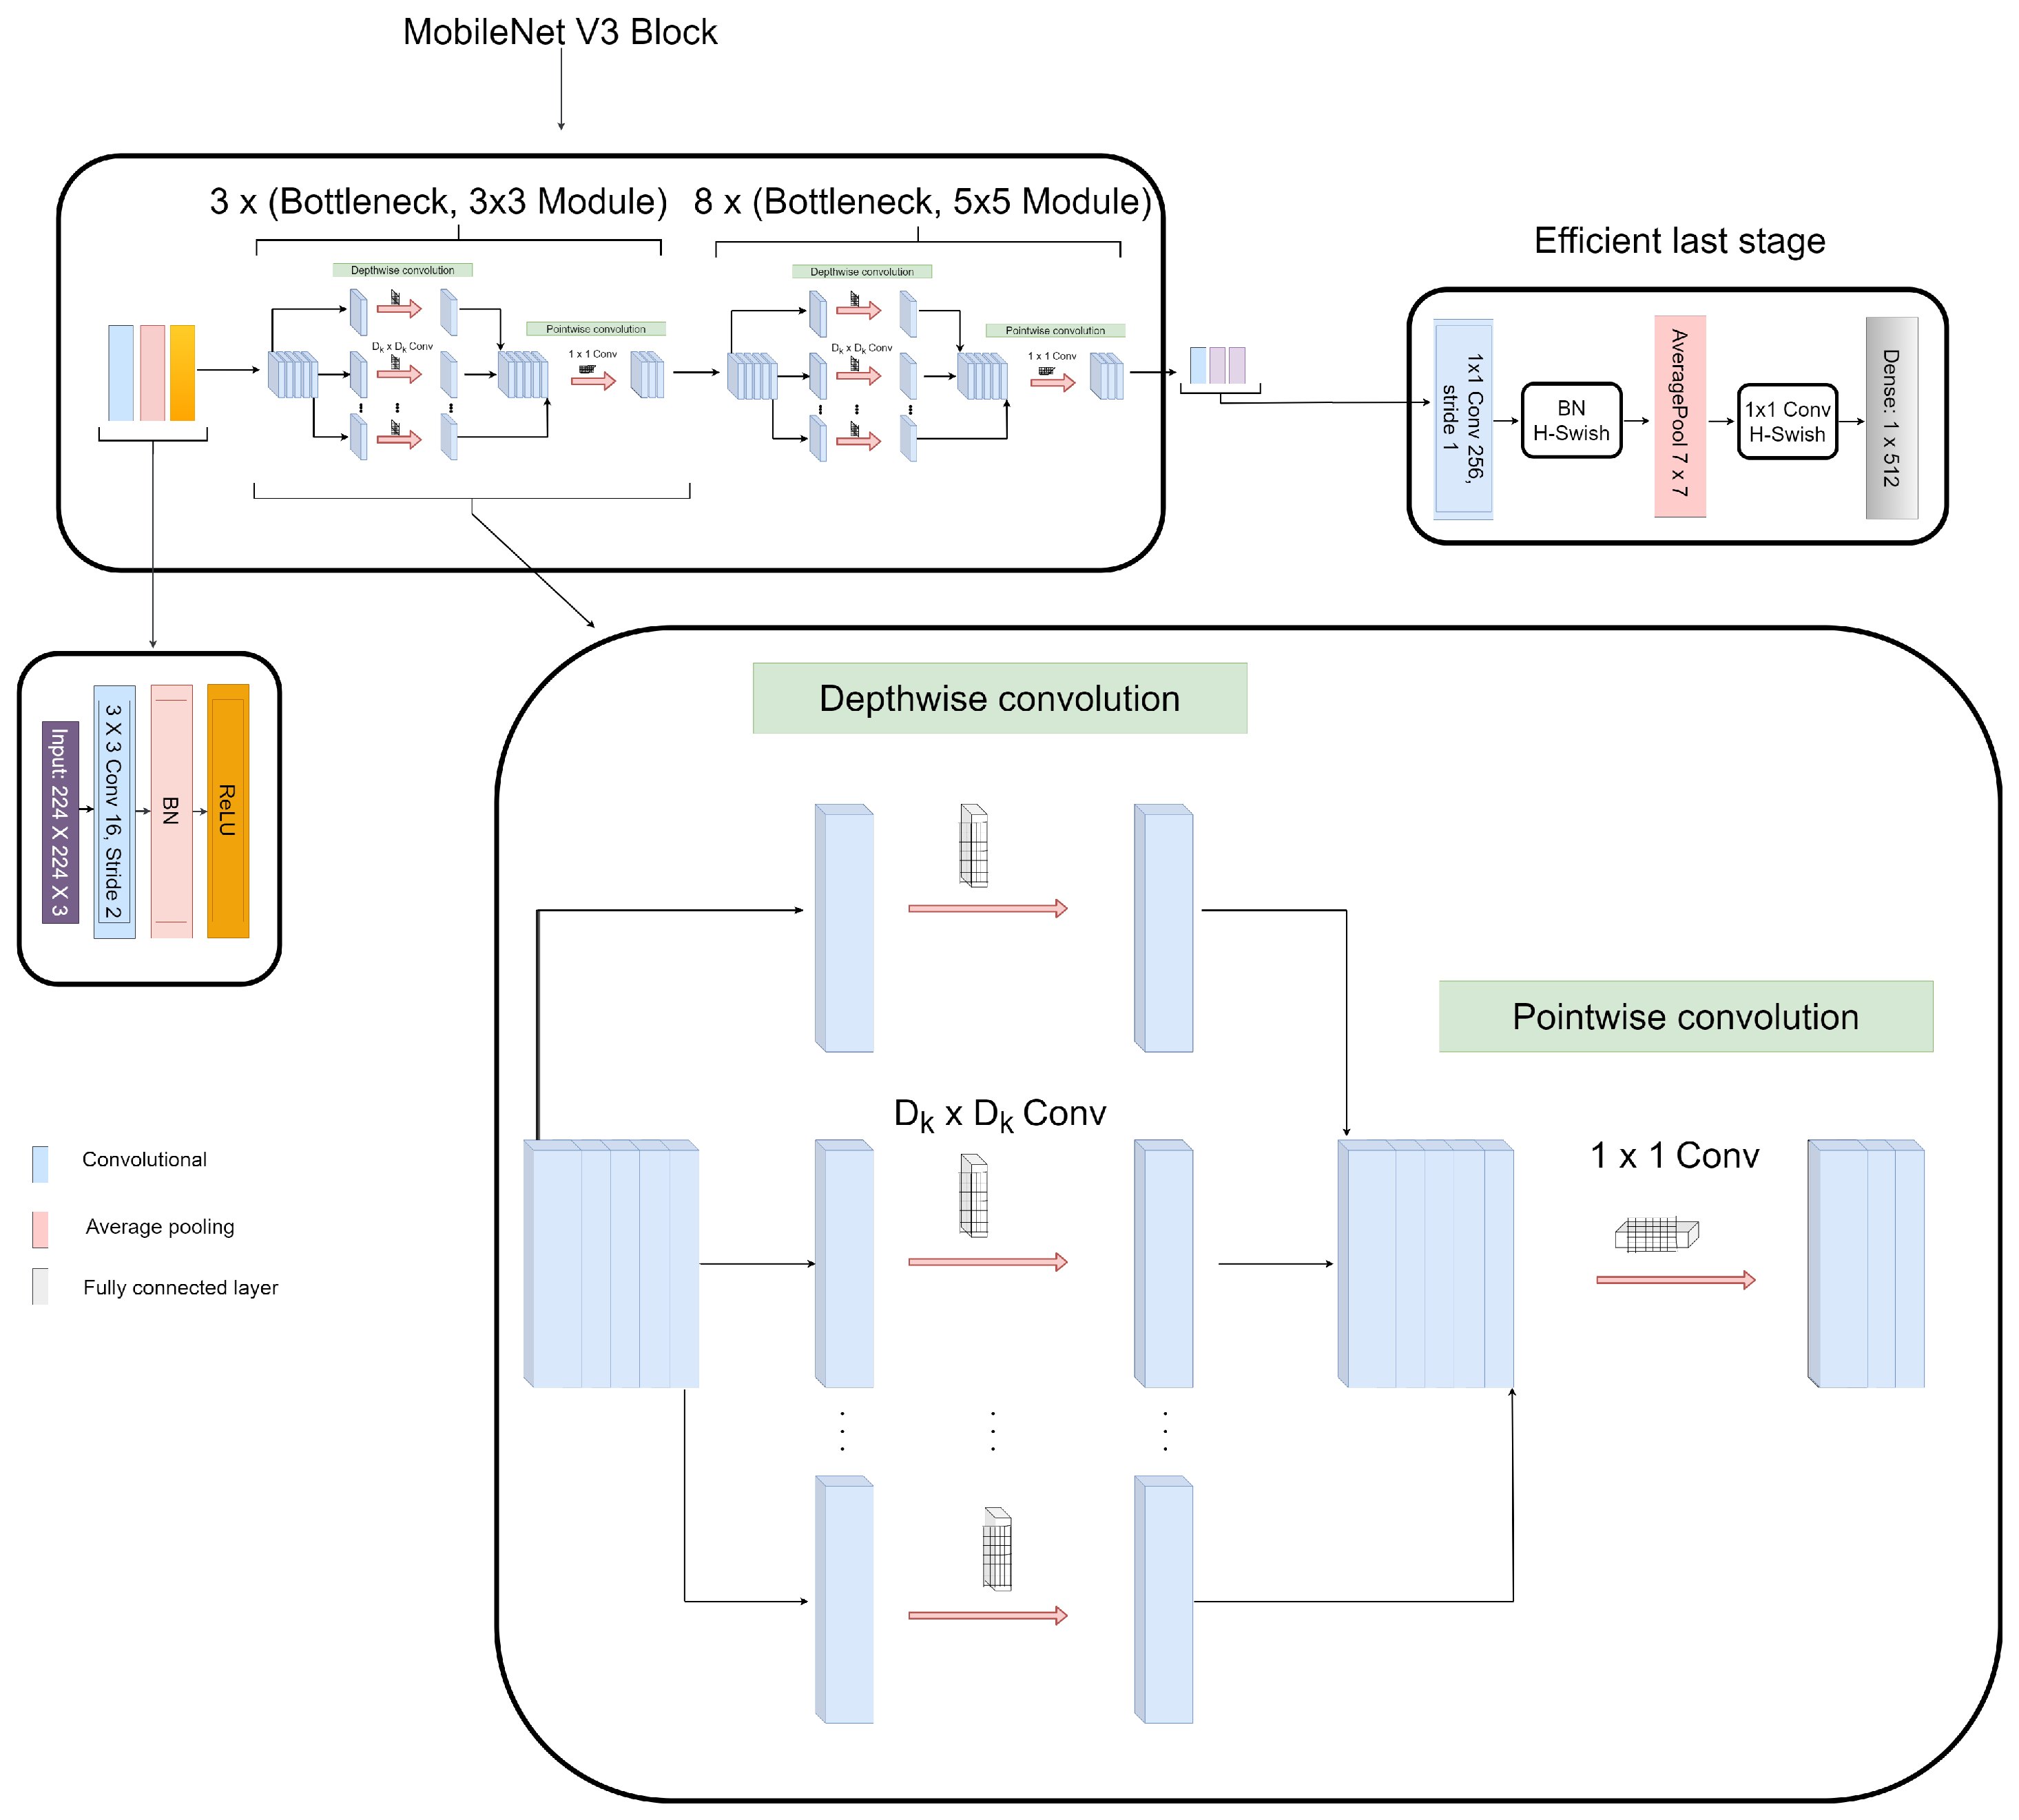
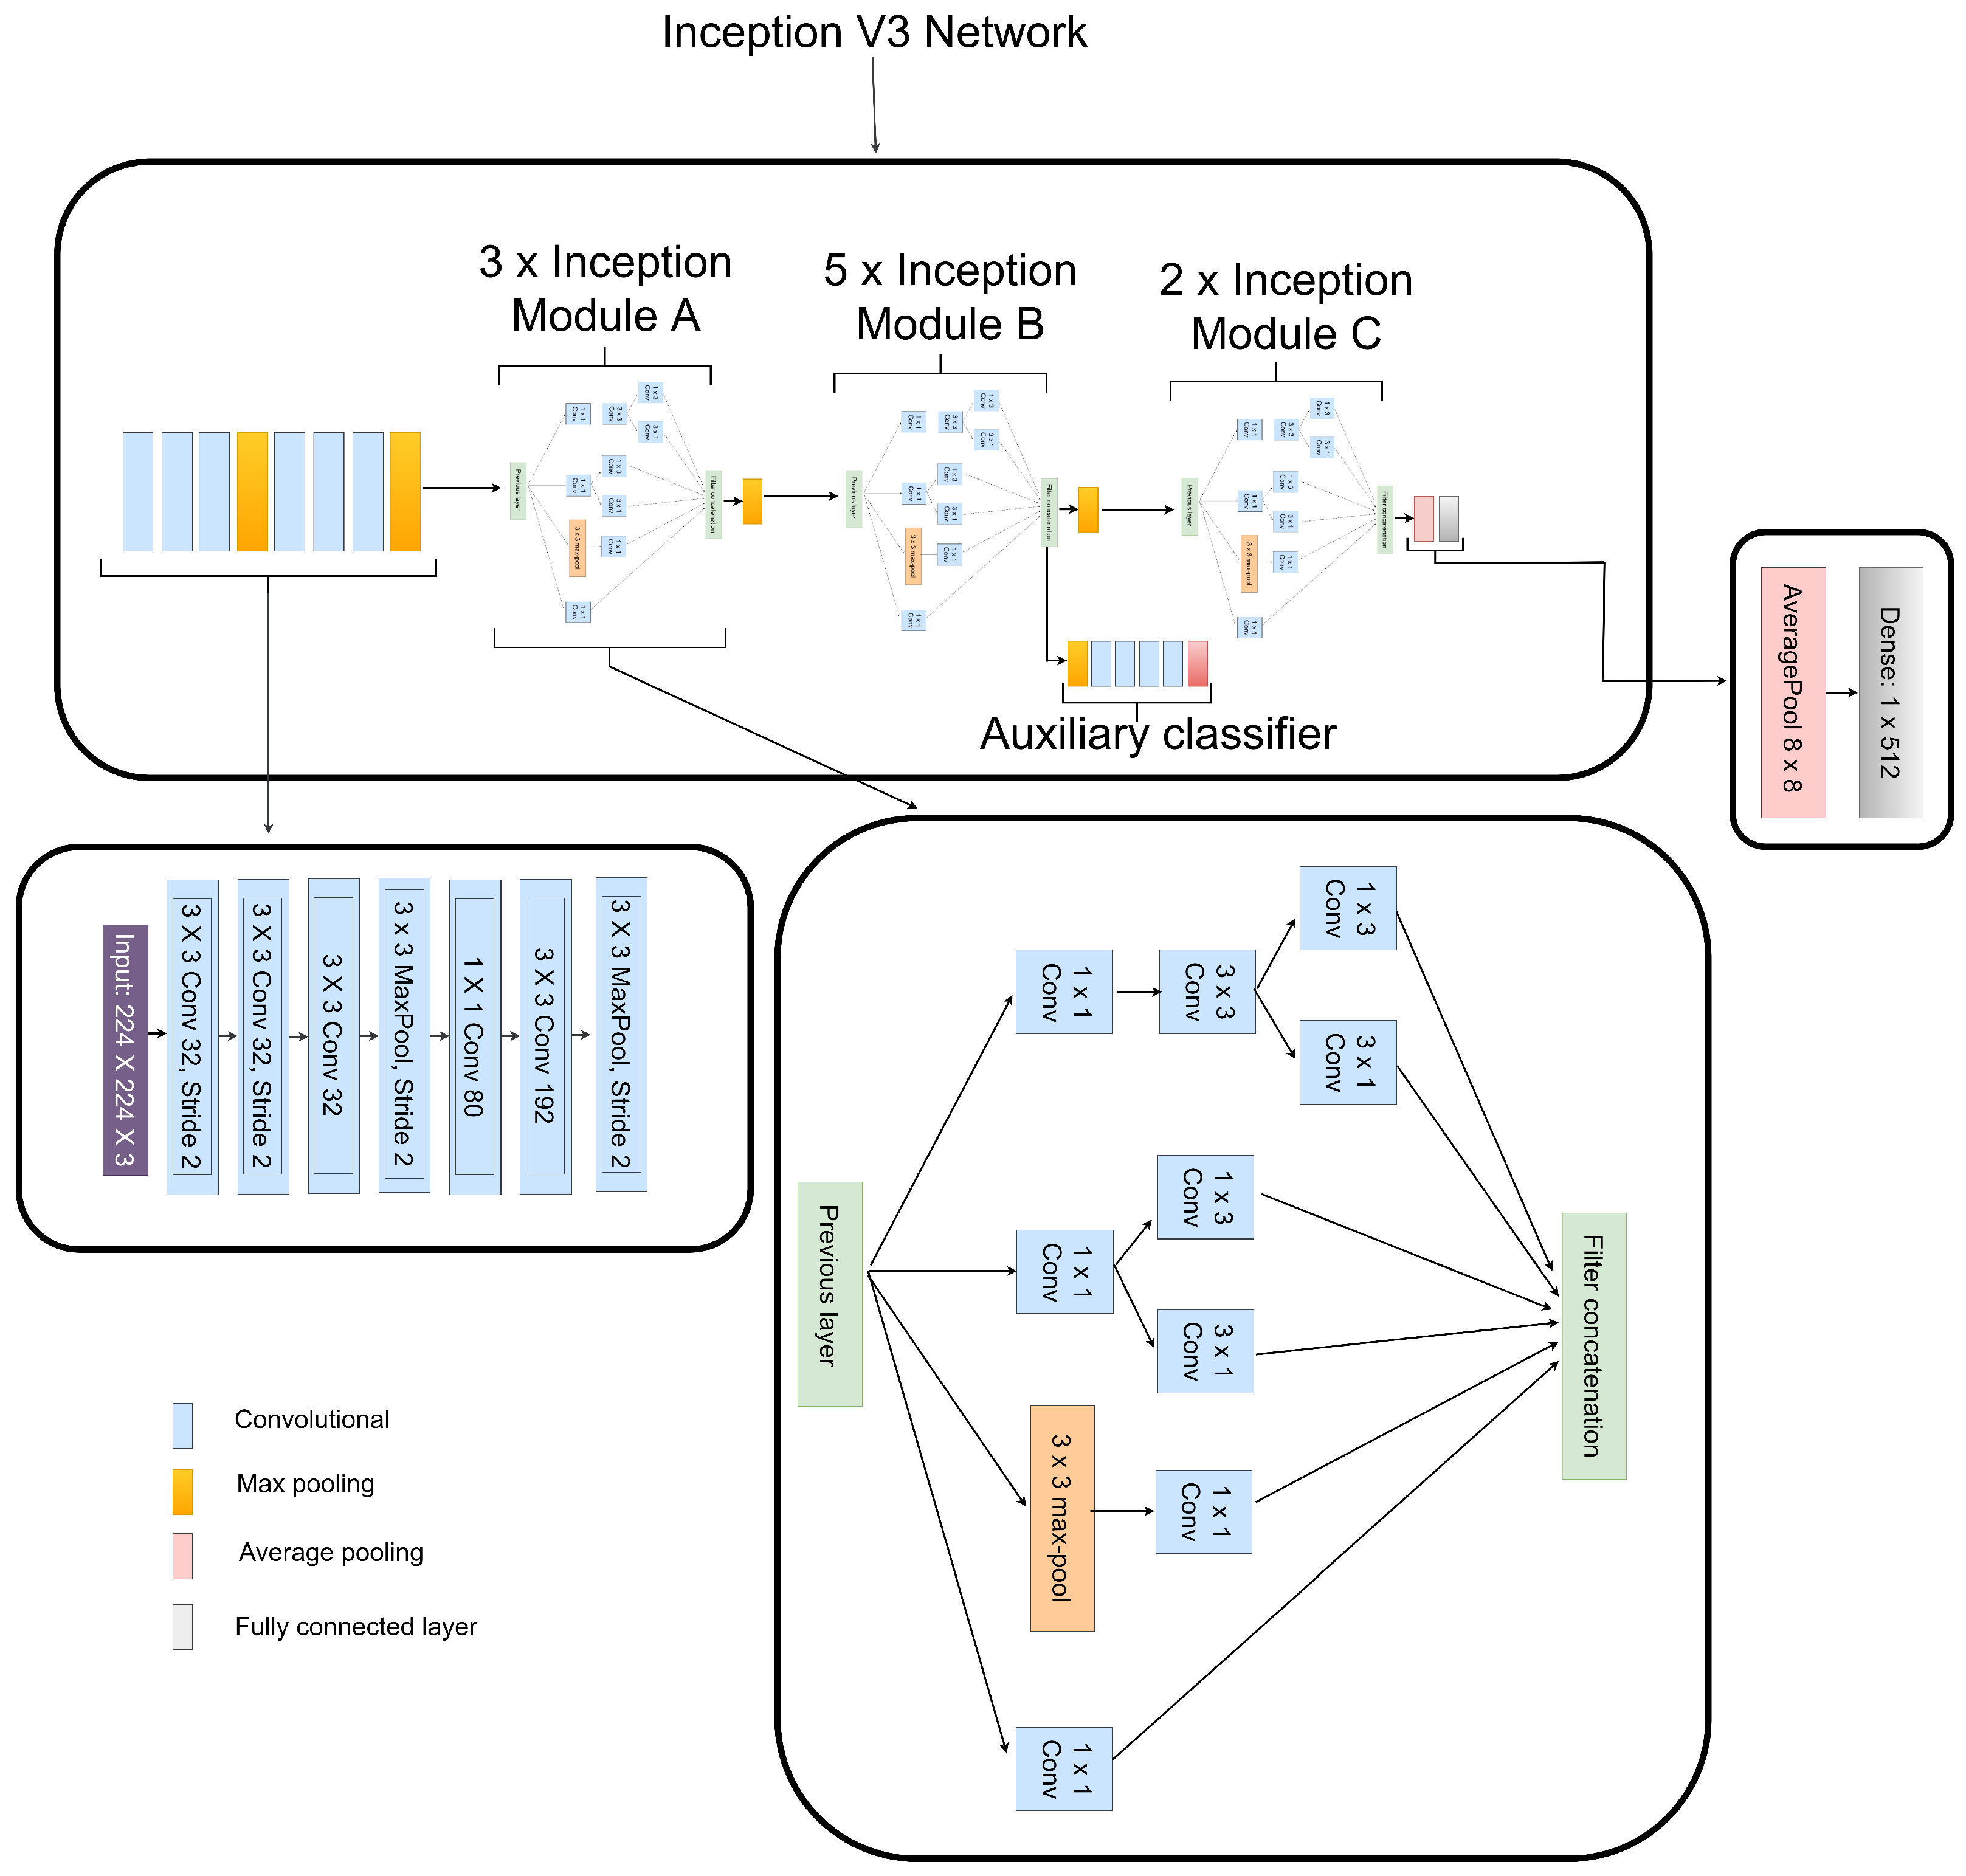
- Each preprocessed image features are extracted individually, that is the LBP CXR features are extracted using the shallow CNN, the CECED CXR features are extracted using the MobileNet-V3 and the CLAHE CXR feature images are extracted using the Inception v3.
- The feature vectors of these preprocessed CXR images are weighted fused for a robust prediction result.
- We evaluate the performance of each of the single models and our proposed model in this study.
2. Related Works
- Several DL techniques are thoroughly implemented for the classification task.
- The popular medical mode of imaging for the classification and detection of pneumonia-related ailment is the chest X-ray.
- The publishers focus on either binary classification or multi-classification, although just a few considered the multi-classification task.
3. Materials and Methods
3.1. Datasets
3.2. Data Preprocessing
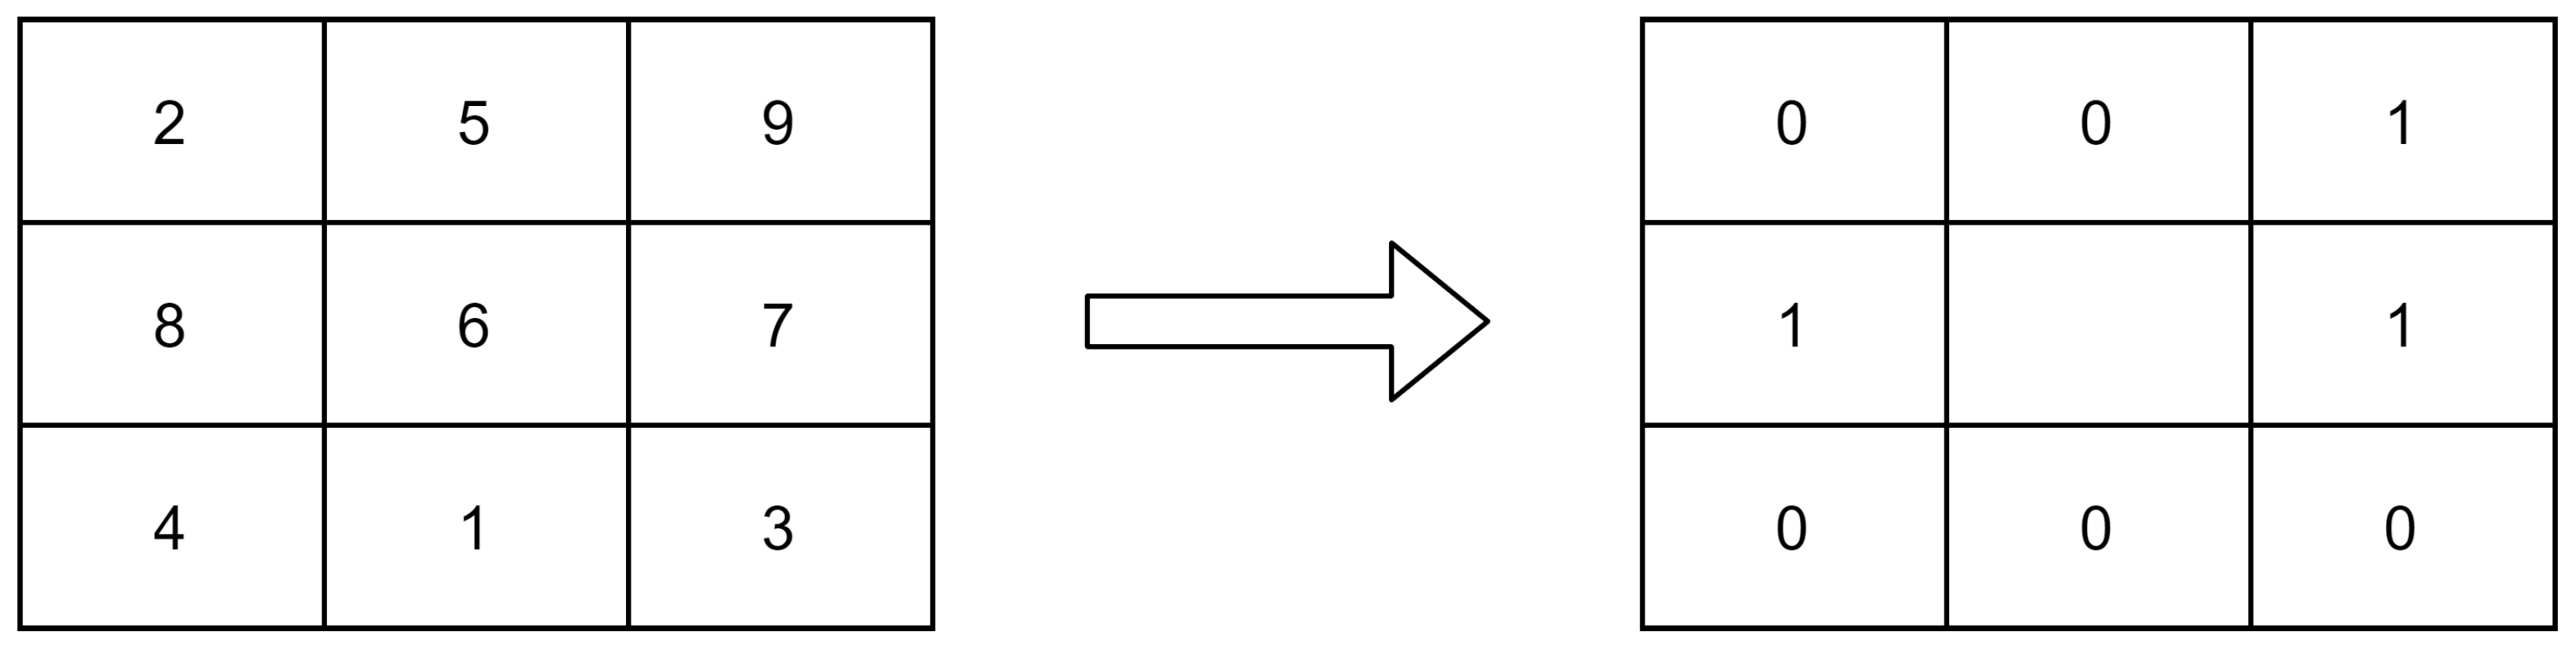
3.2.1. Local Binary Pattern (LBP) Images
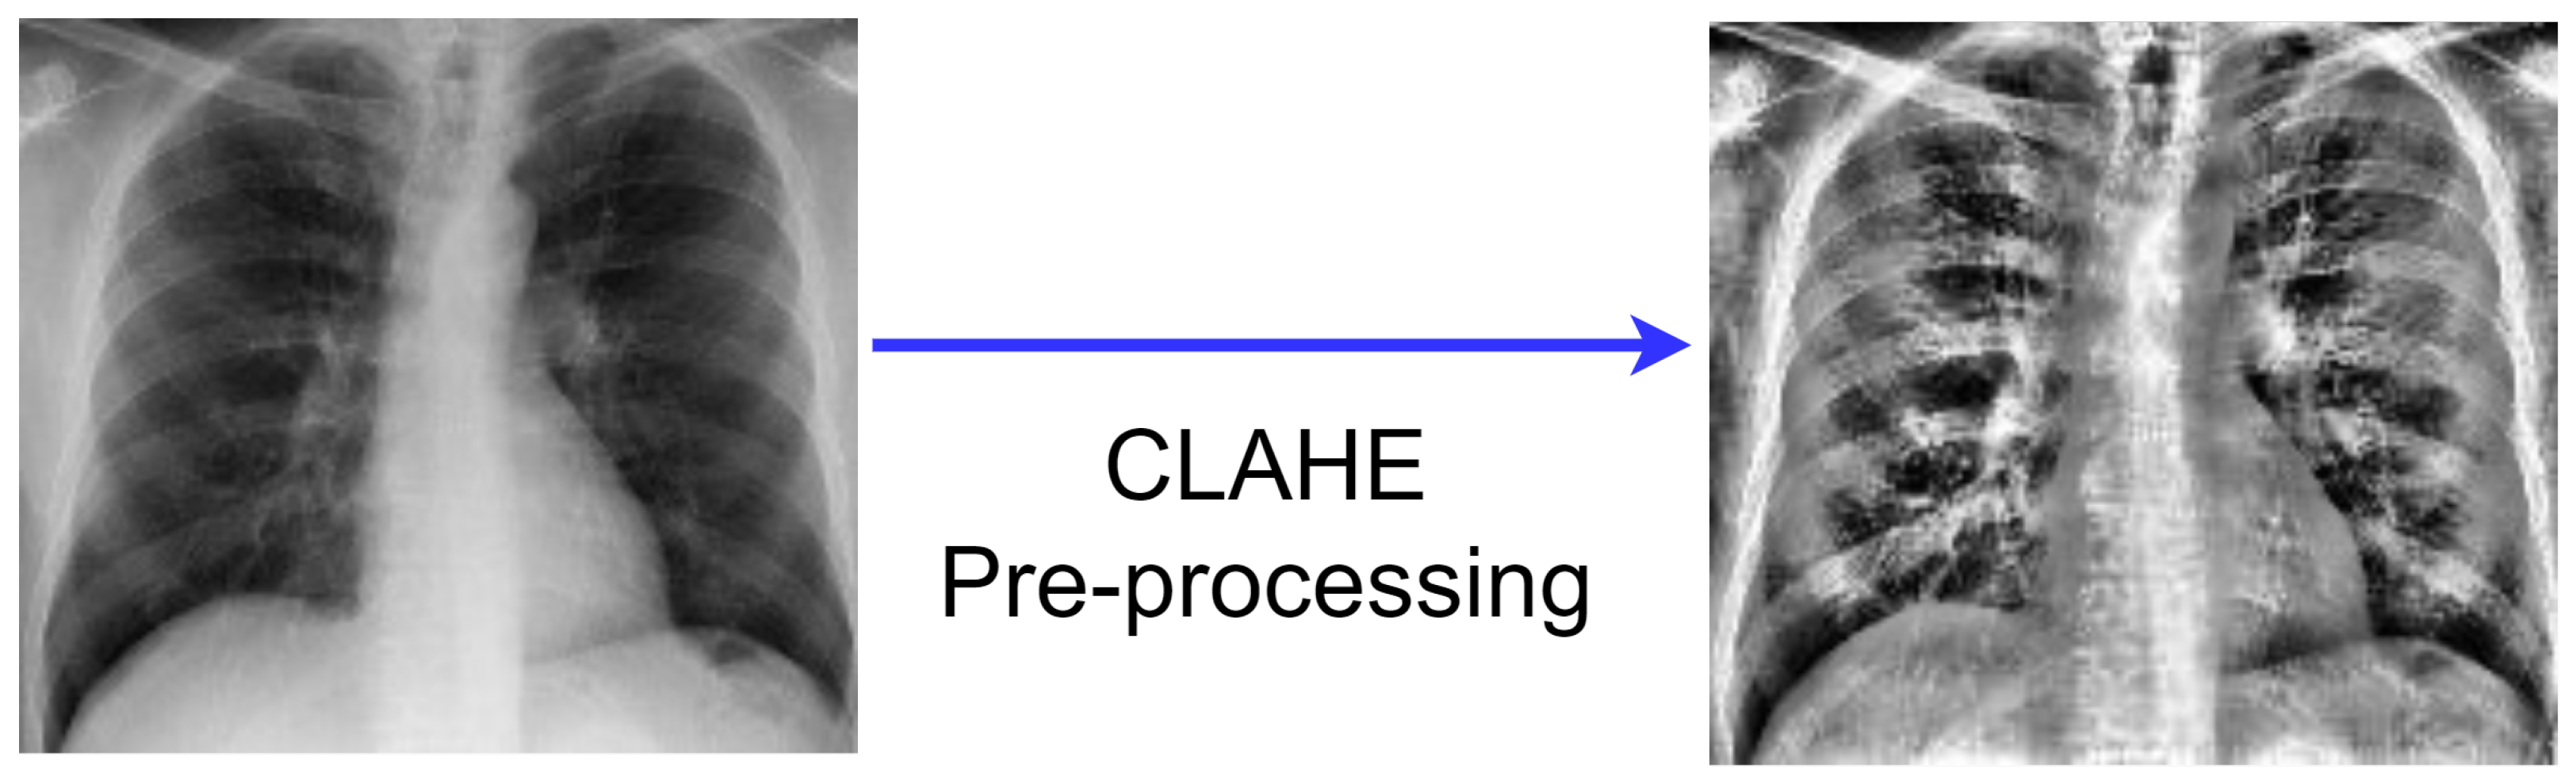
3.2.2. CLAHE Images
- The generation of the image transformation using the bin value of the histogram is the first stage of the CLAHE technique.
- Following that, using clip boundary, the contrast is confined to a binary count from 0 to 1. Before the image segment is processed, the clip boundary is added to the image.
- To prevent mapping background areas to gray scale, a specific bin value from the histogram region is used to create the entire image region. Clip boundary is used with the help of histogram clip to obtain better mapping.
- Finally, the finished CLAHE image is created by computing the image’s regions, then extracting, mapping, and interpolating all of the image pixels to get the most out of the image.
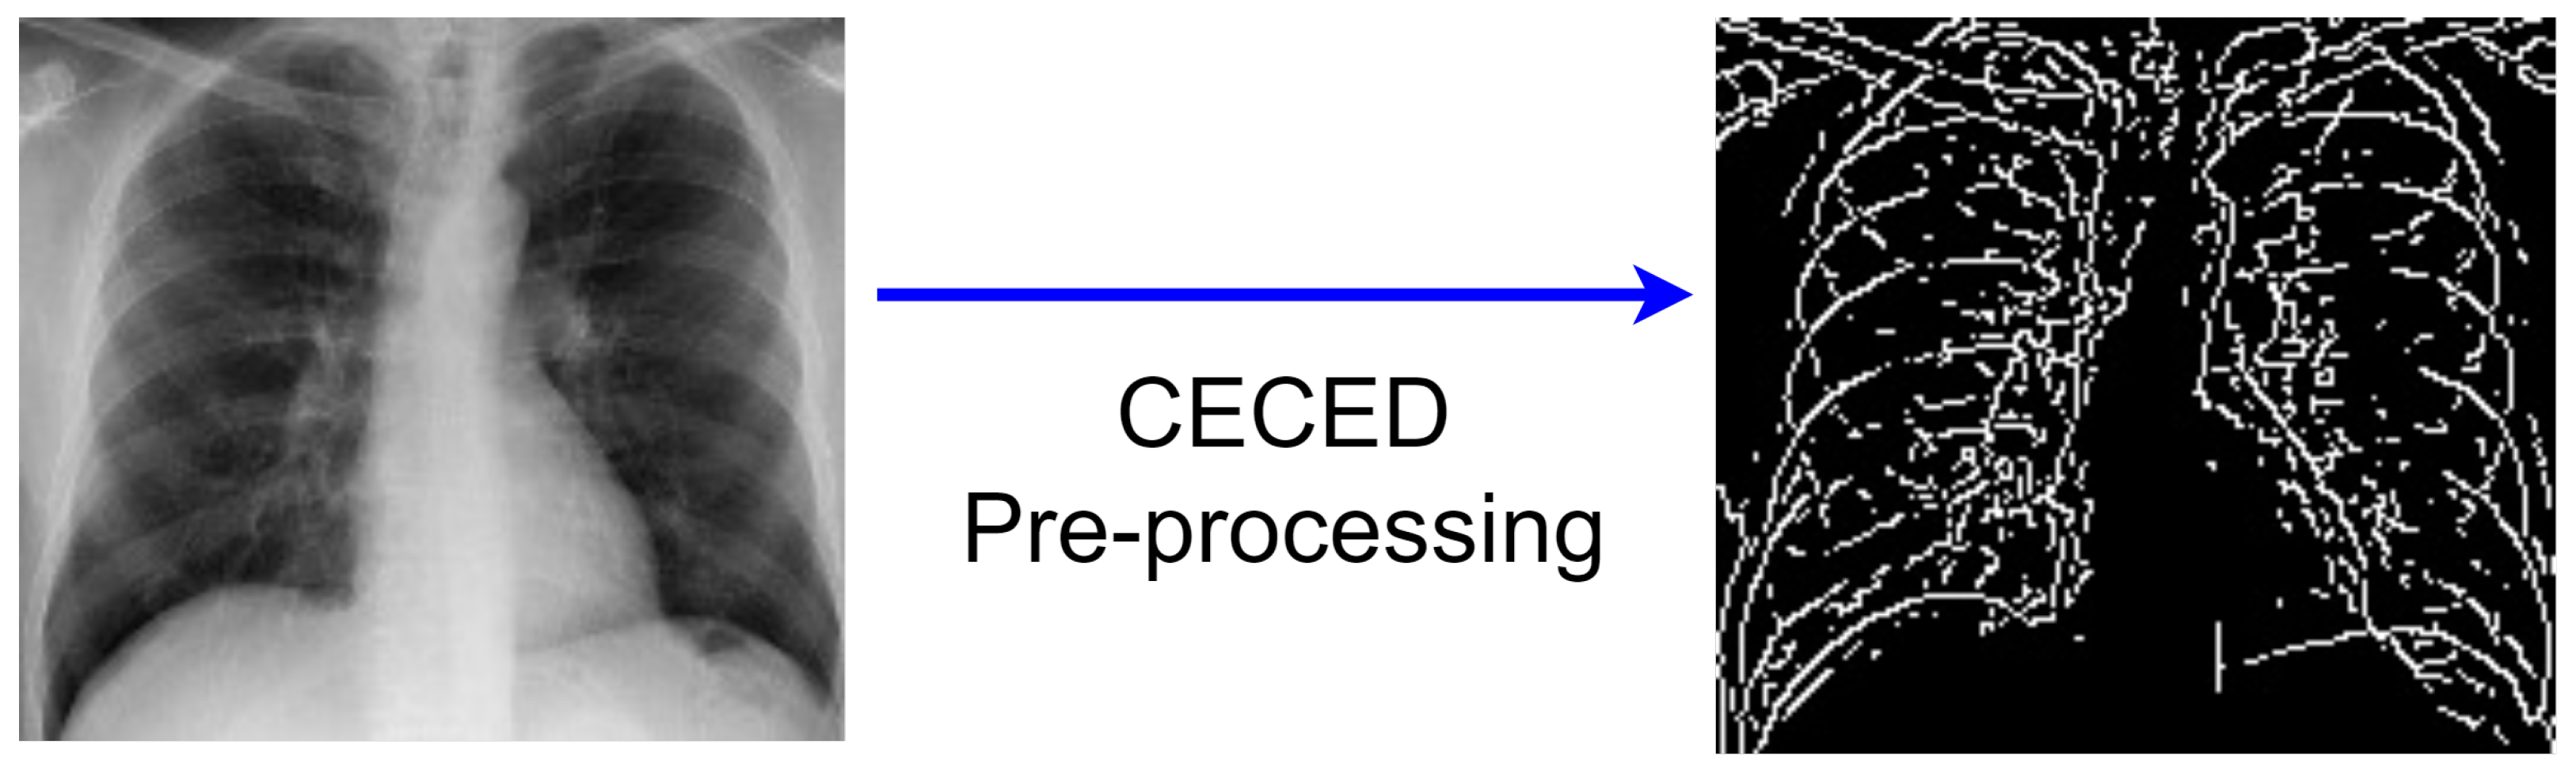
3.2.3. CECED Images
- Collection of the original pixel’s value, as well as the local minimum and maximum;
- The image’s morphological contrast is increased;
- To reduce noise, Gaussian smoothing is applied;
- The intensity gradient of the image is determined;
- A non-maximum suppression method is utilized;
- The hysteresis thresholding technique is adopted.
3.3. Feature Extraction
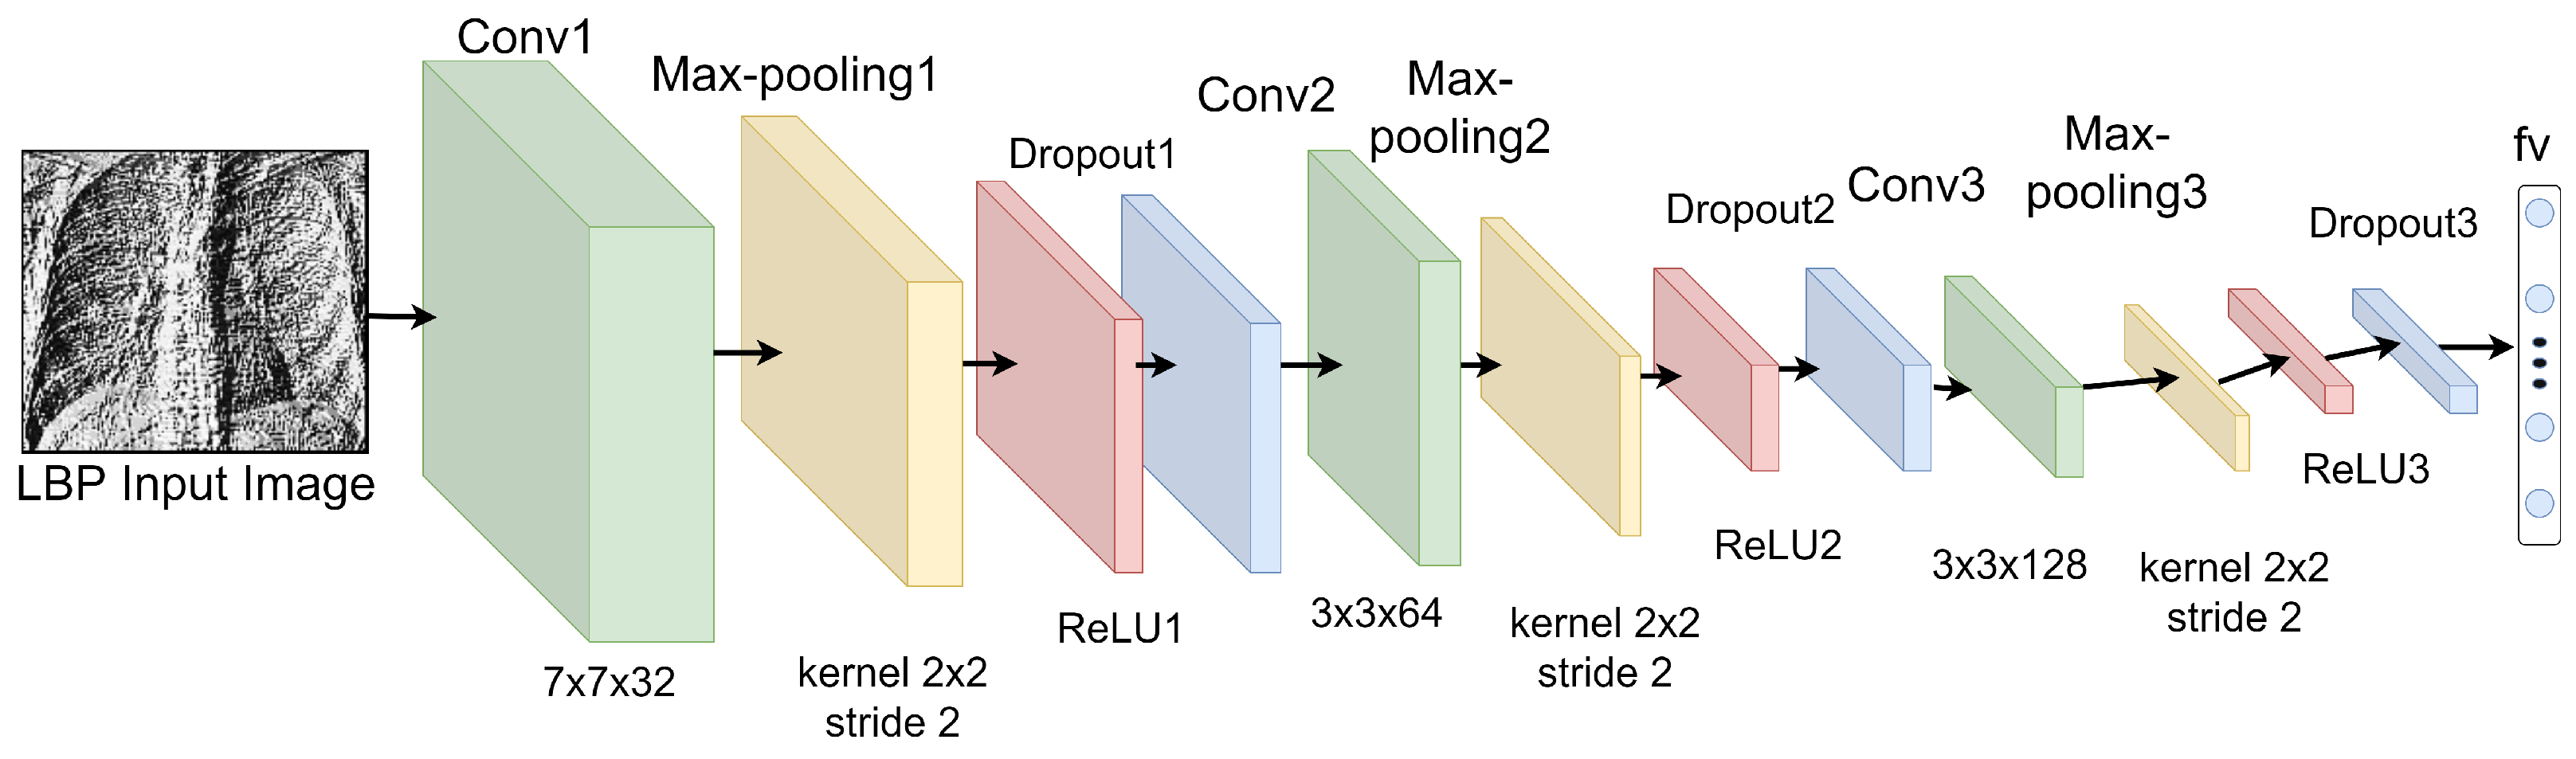
3.3.1. Features Extraction from LBP Images
3.3.2. Features Extraction from CECED CXR Images
3.3.3. Features Extraction from CLAHE CXR Images
3.4. Weighted Fusion of the Different Output Channels
4. Results
4.1. Experimental Setup and Configuration
4.2. Performance Metrics
4.3. Evaluation of the Single Model
4.3.1. Shallow CNN
4.3.2. Pretrained MobileNet-V3
4.3.3. Pretrained Inception-V3
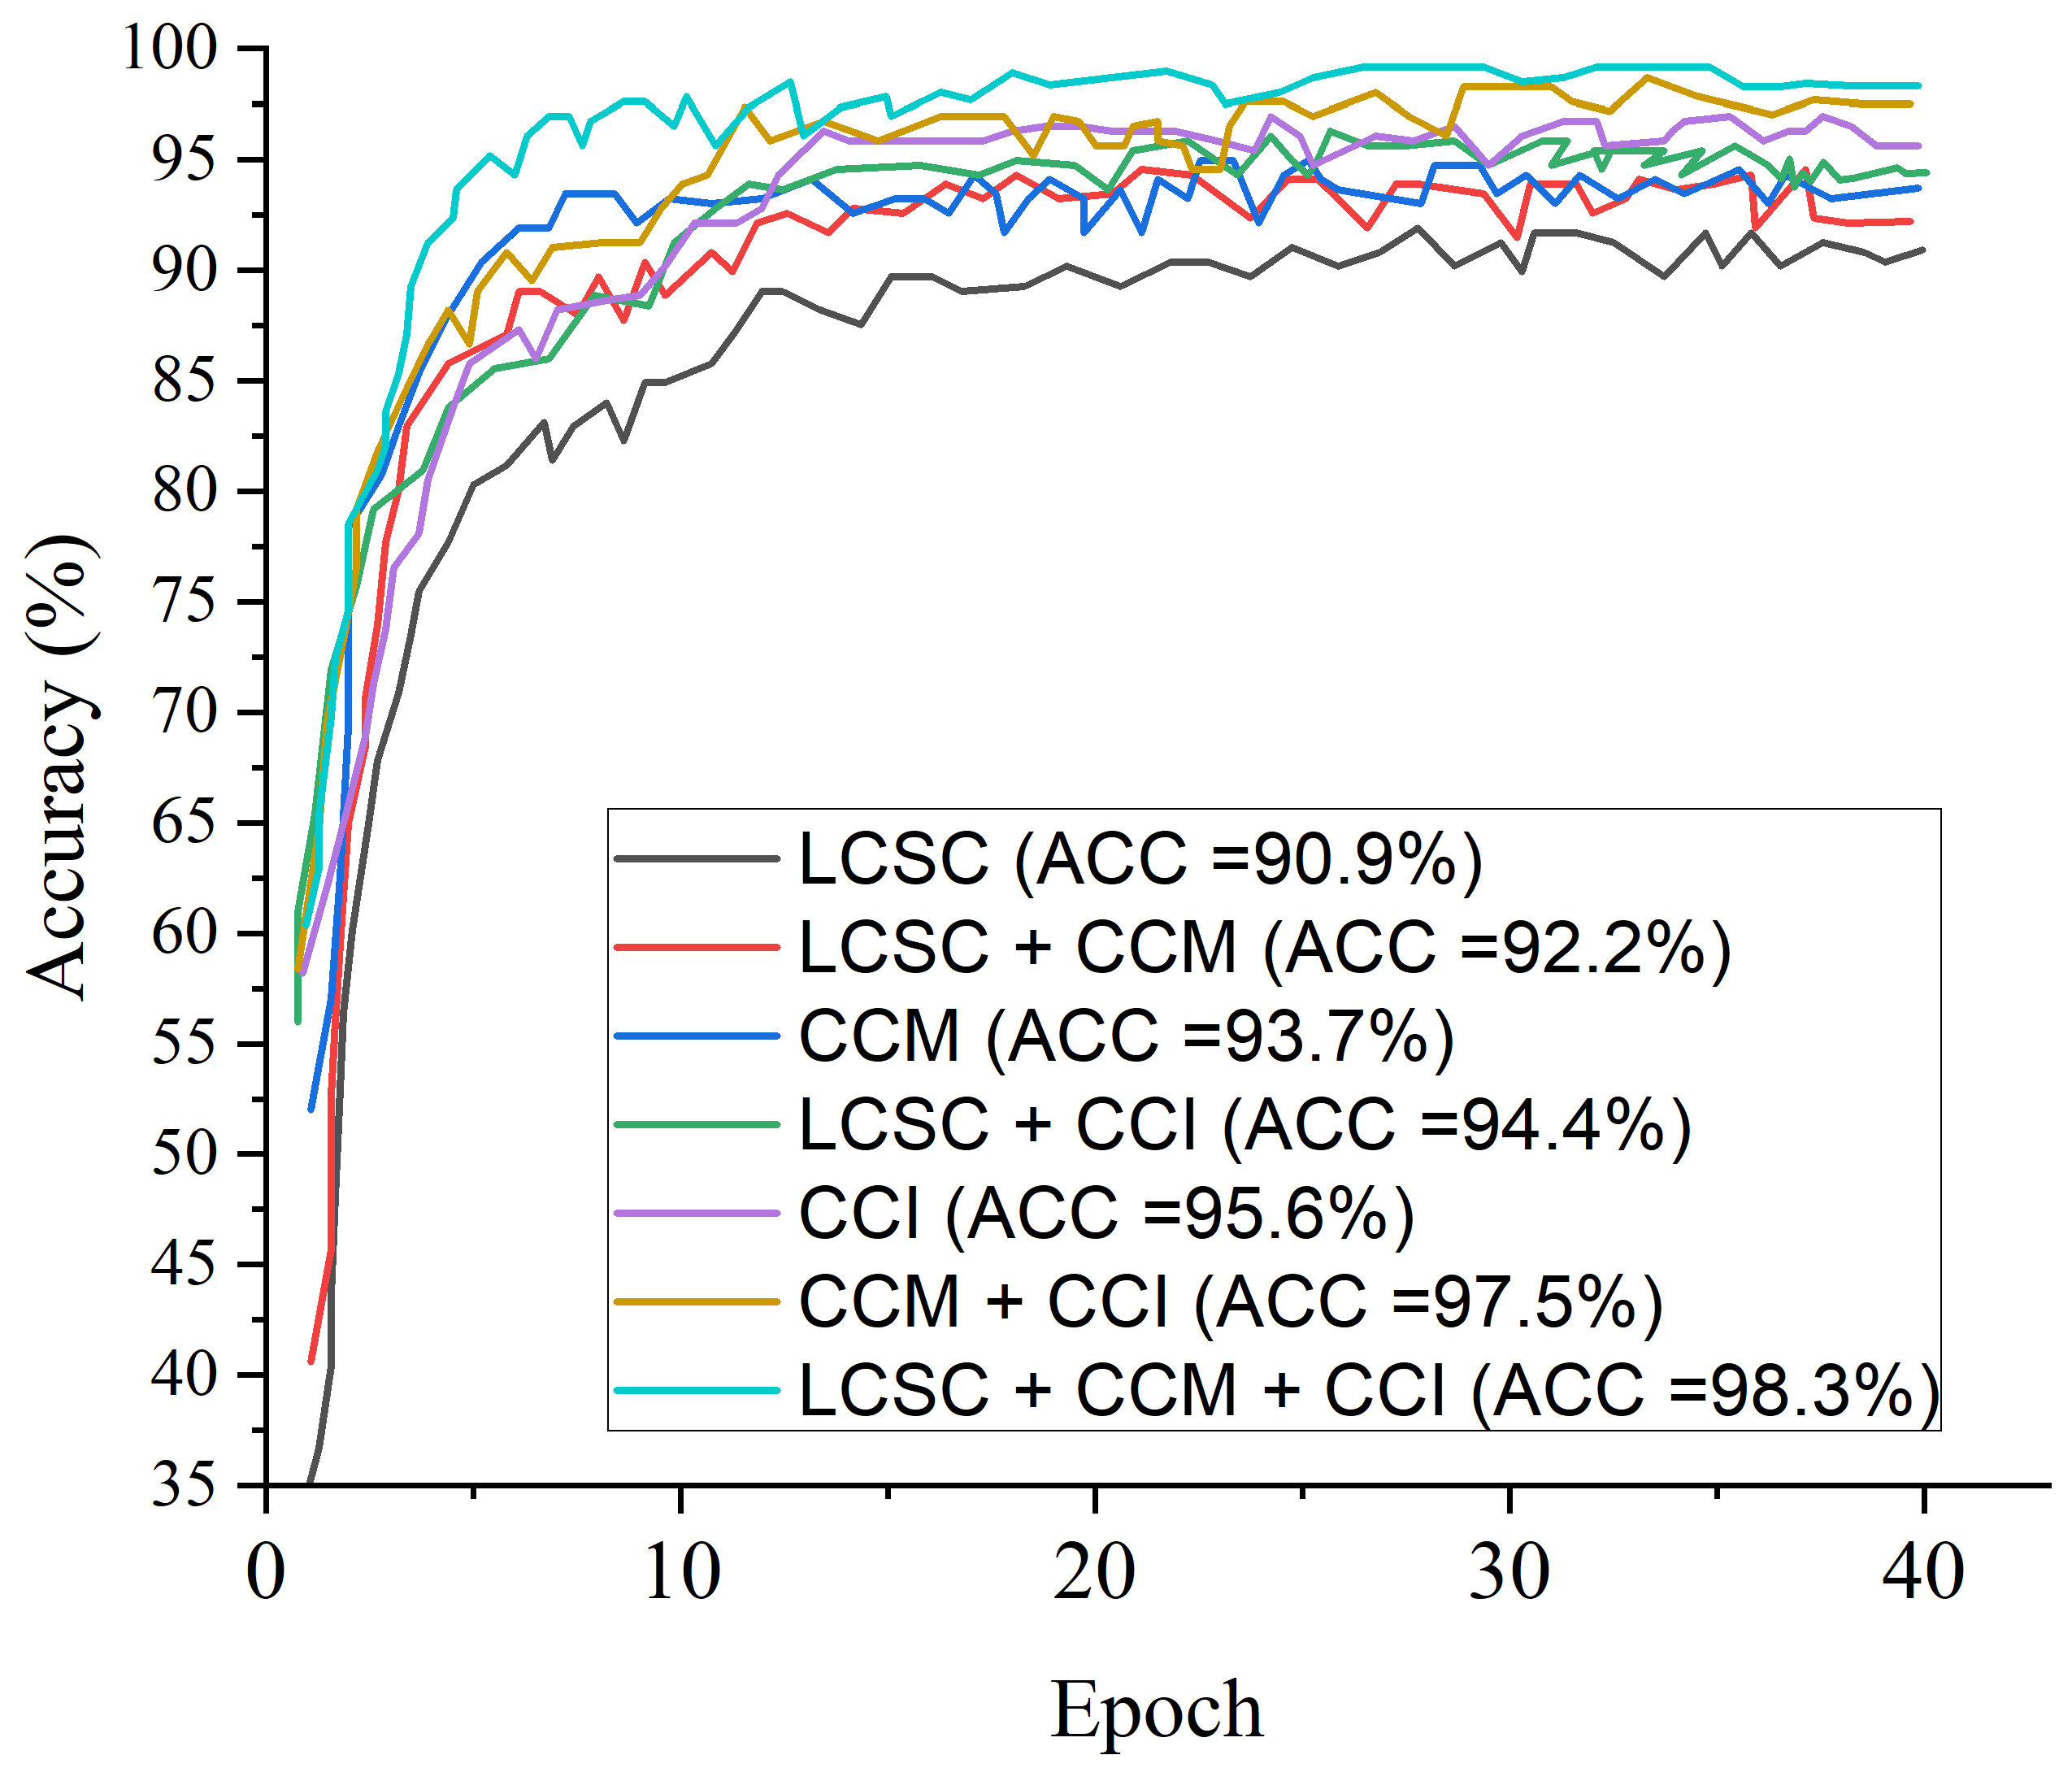
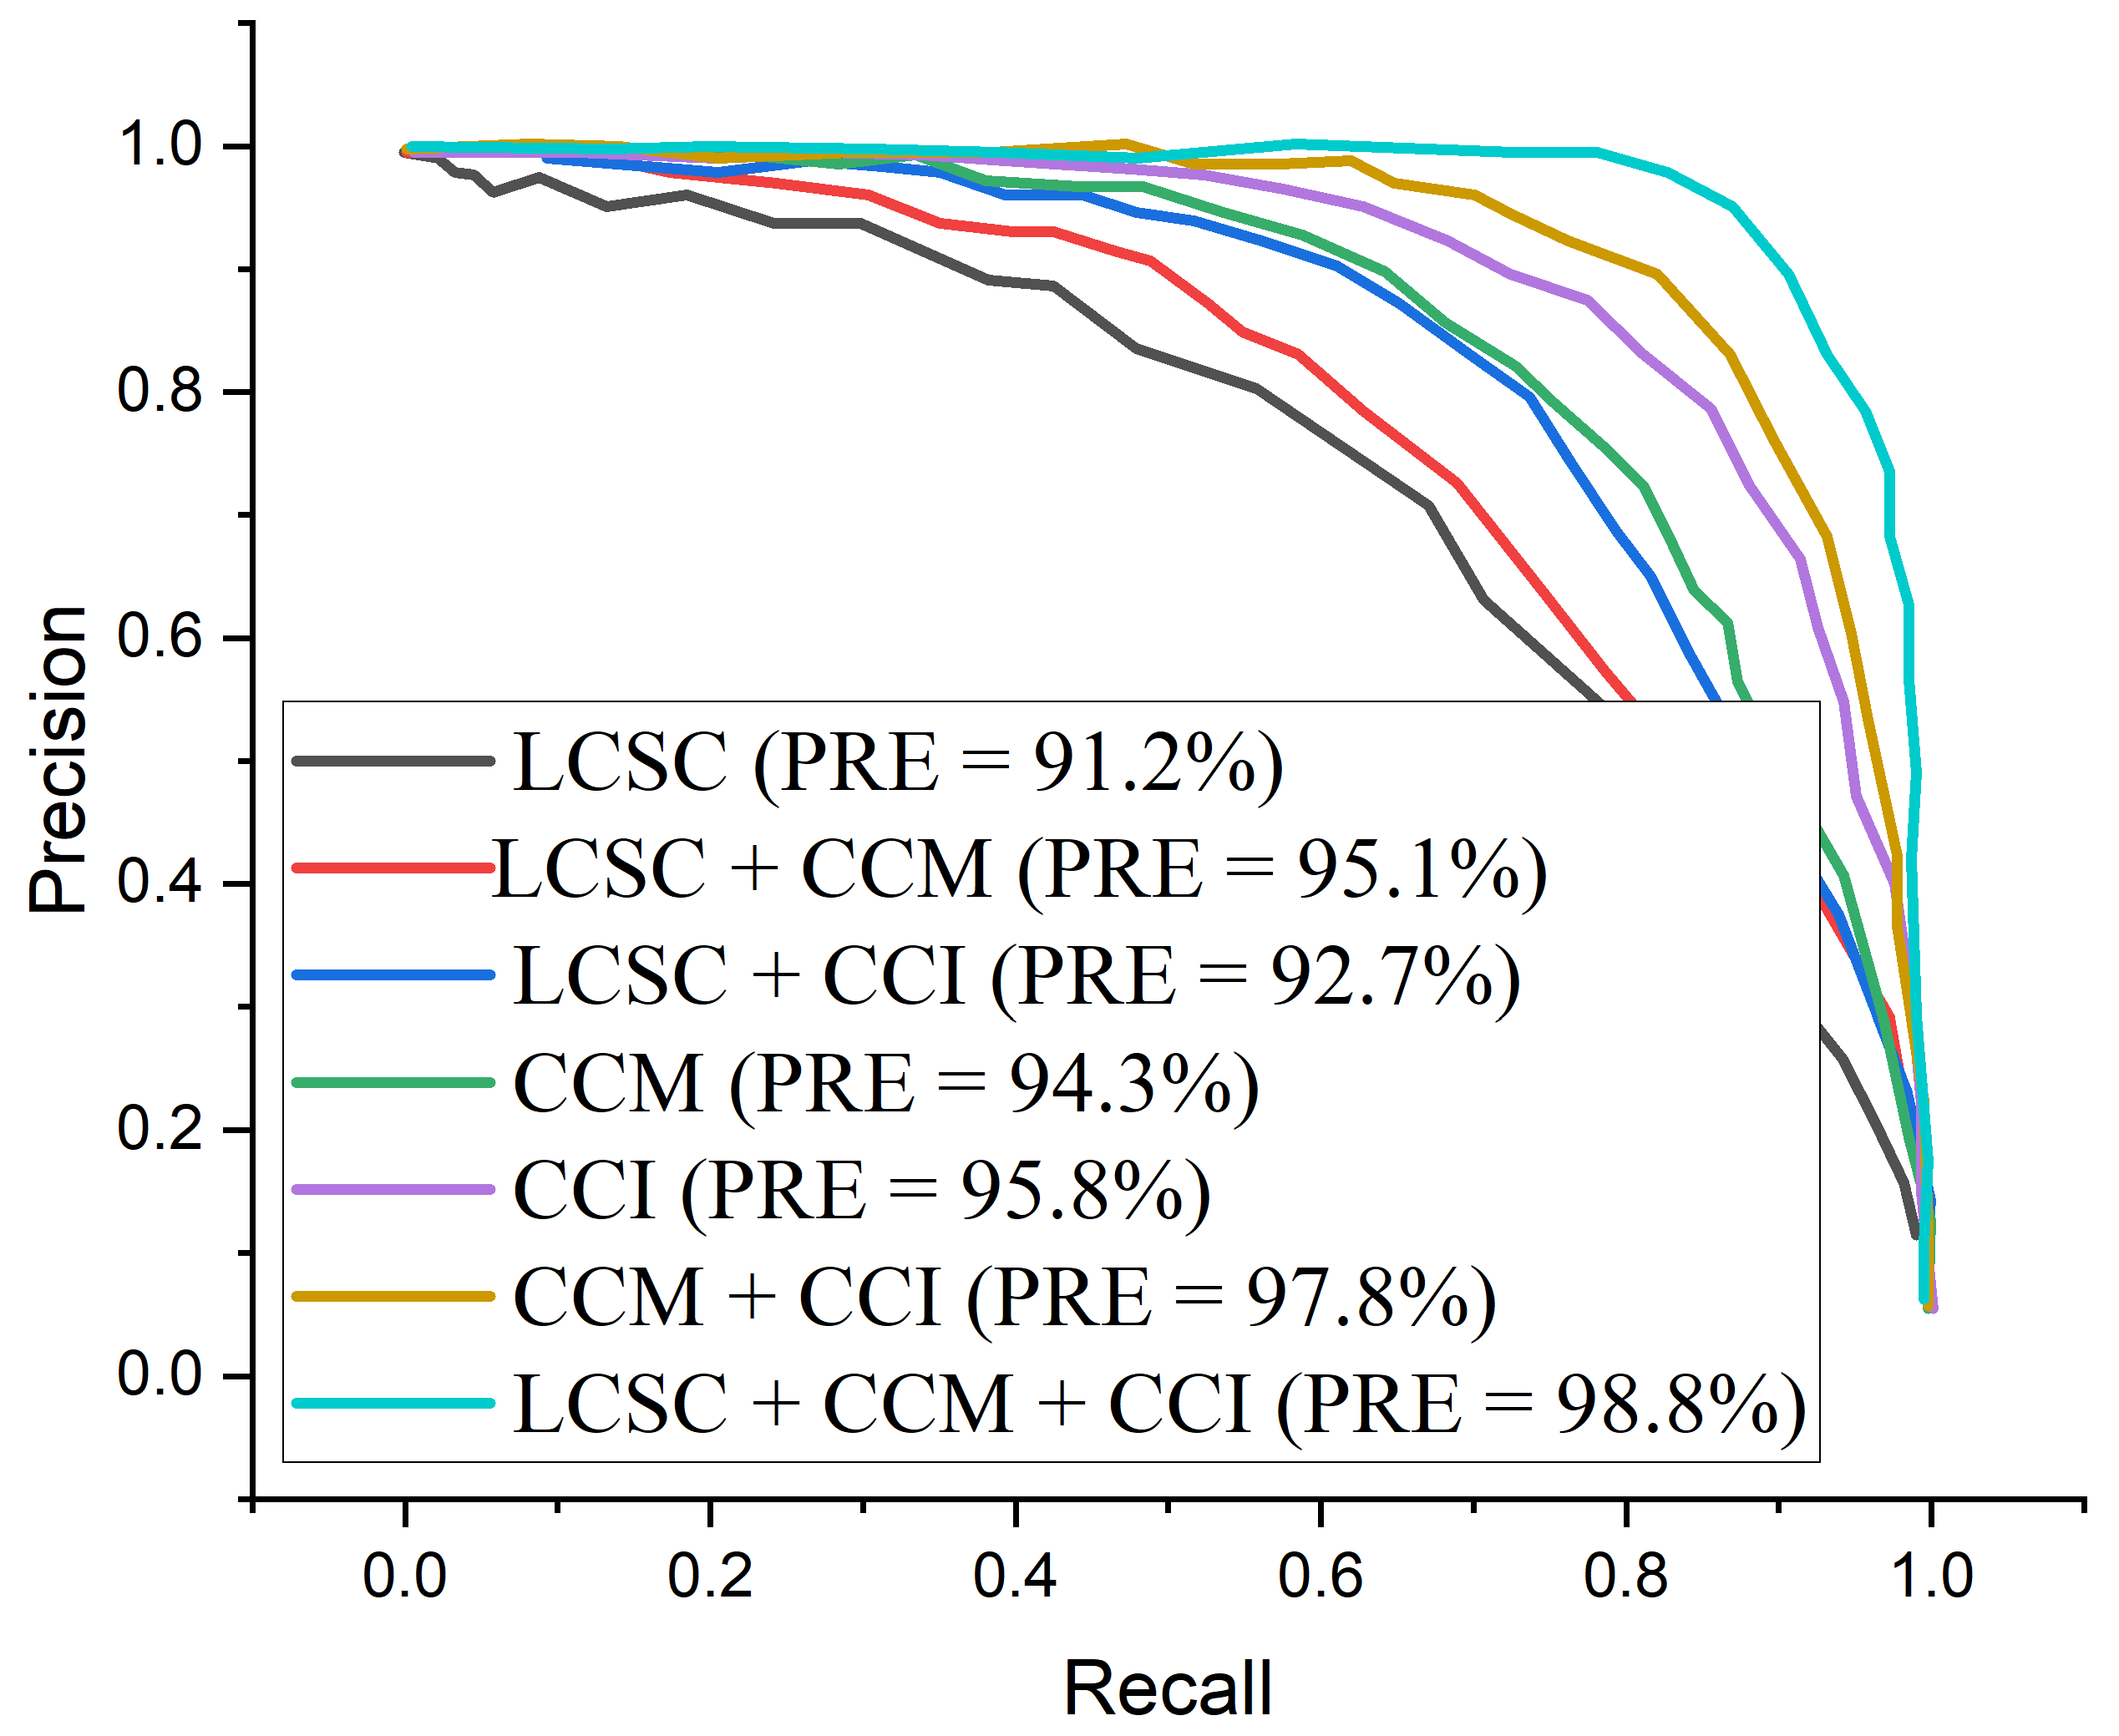
4.4. Evaluation of the Weighted Fusion
4.5. Result of the Proposed Model
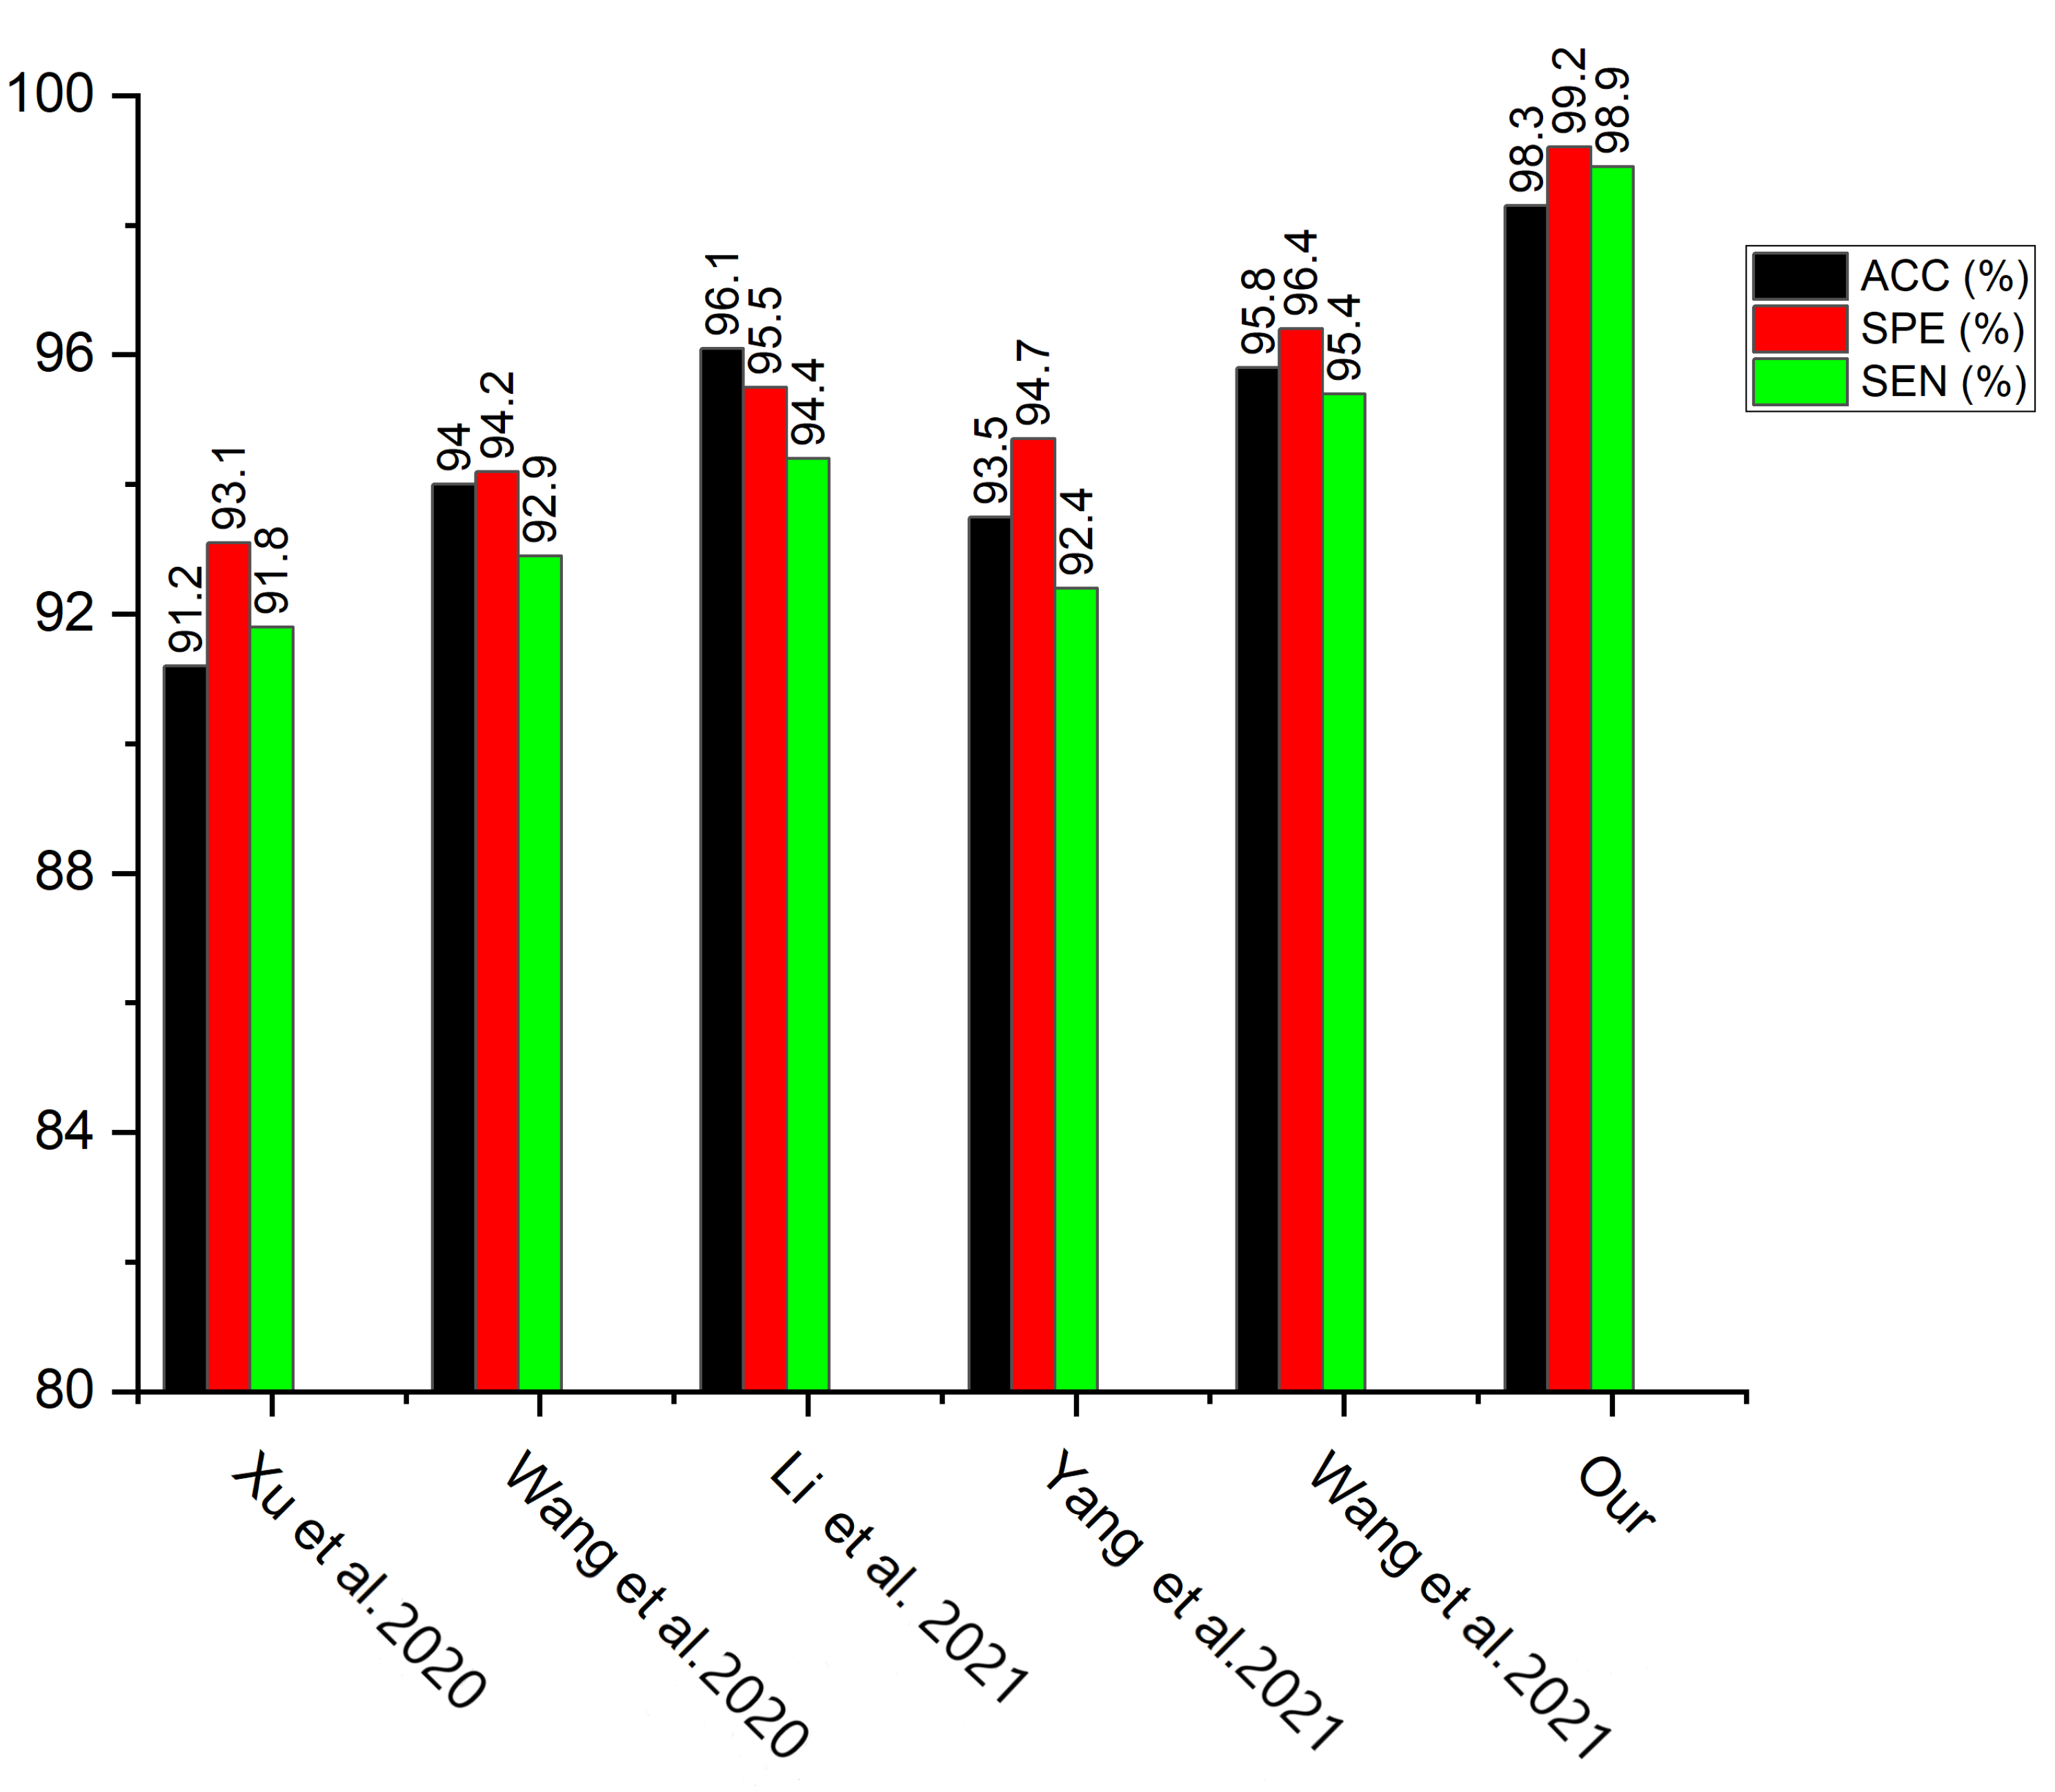
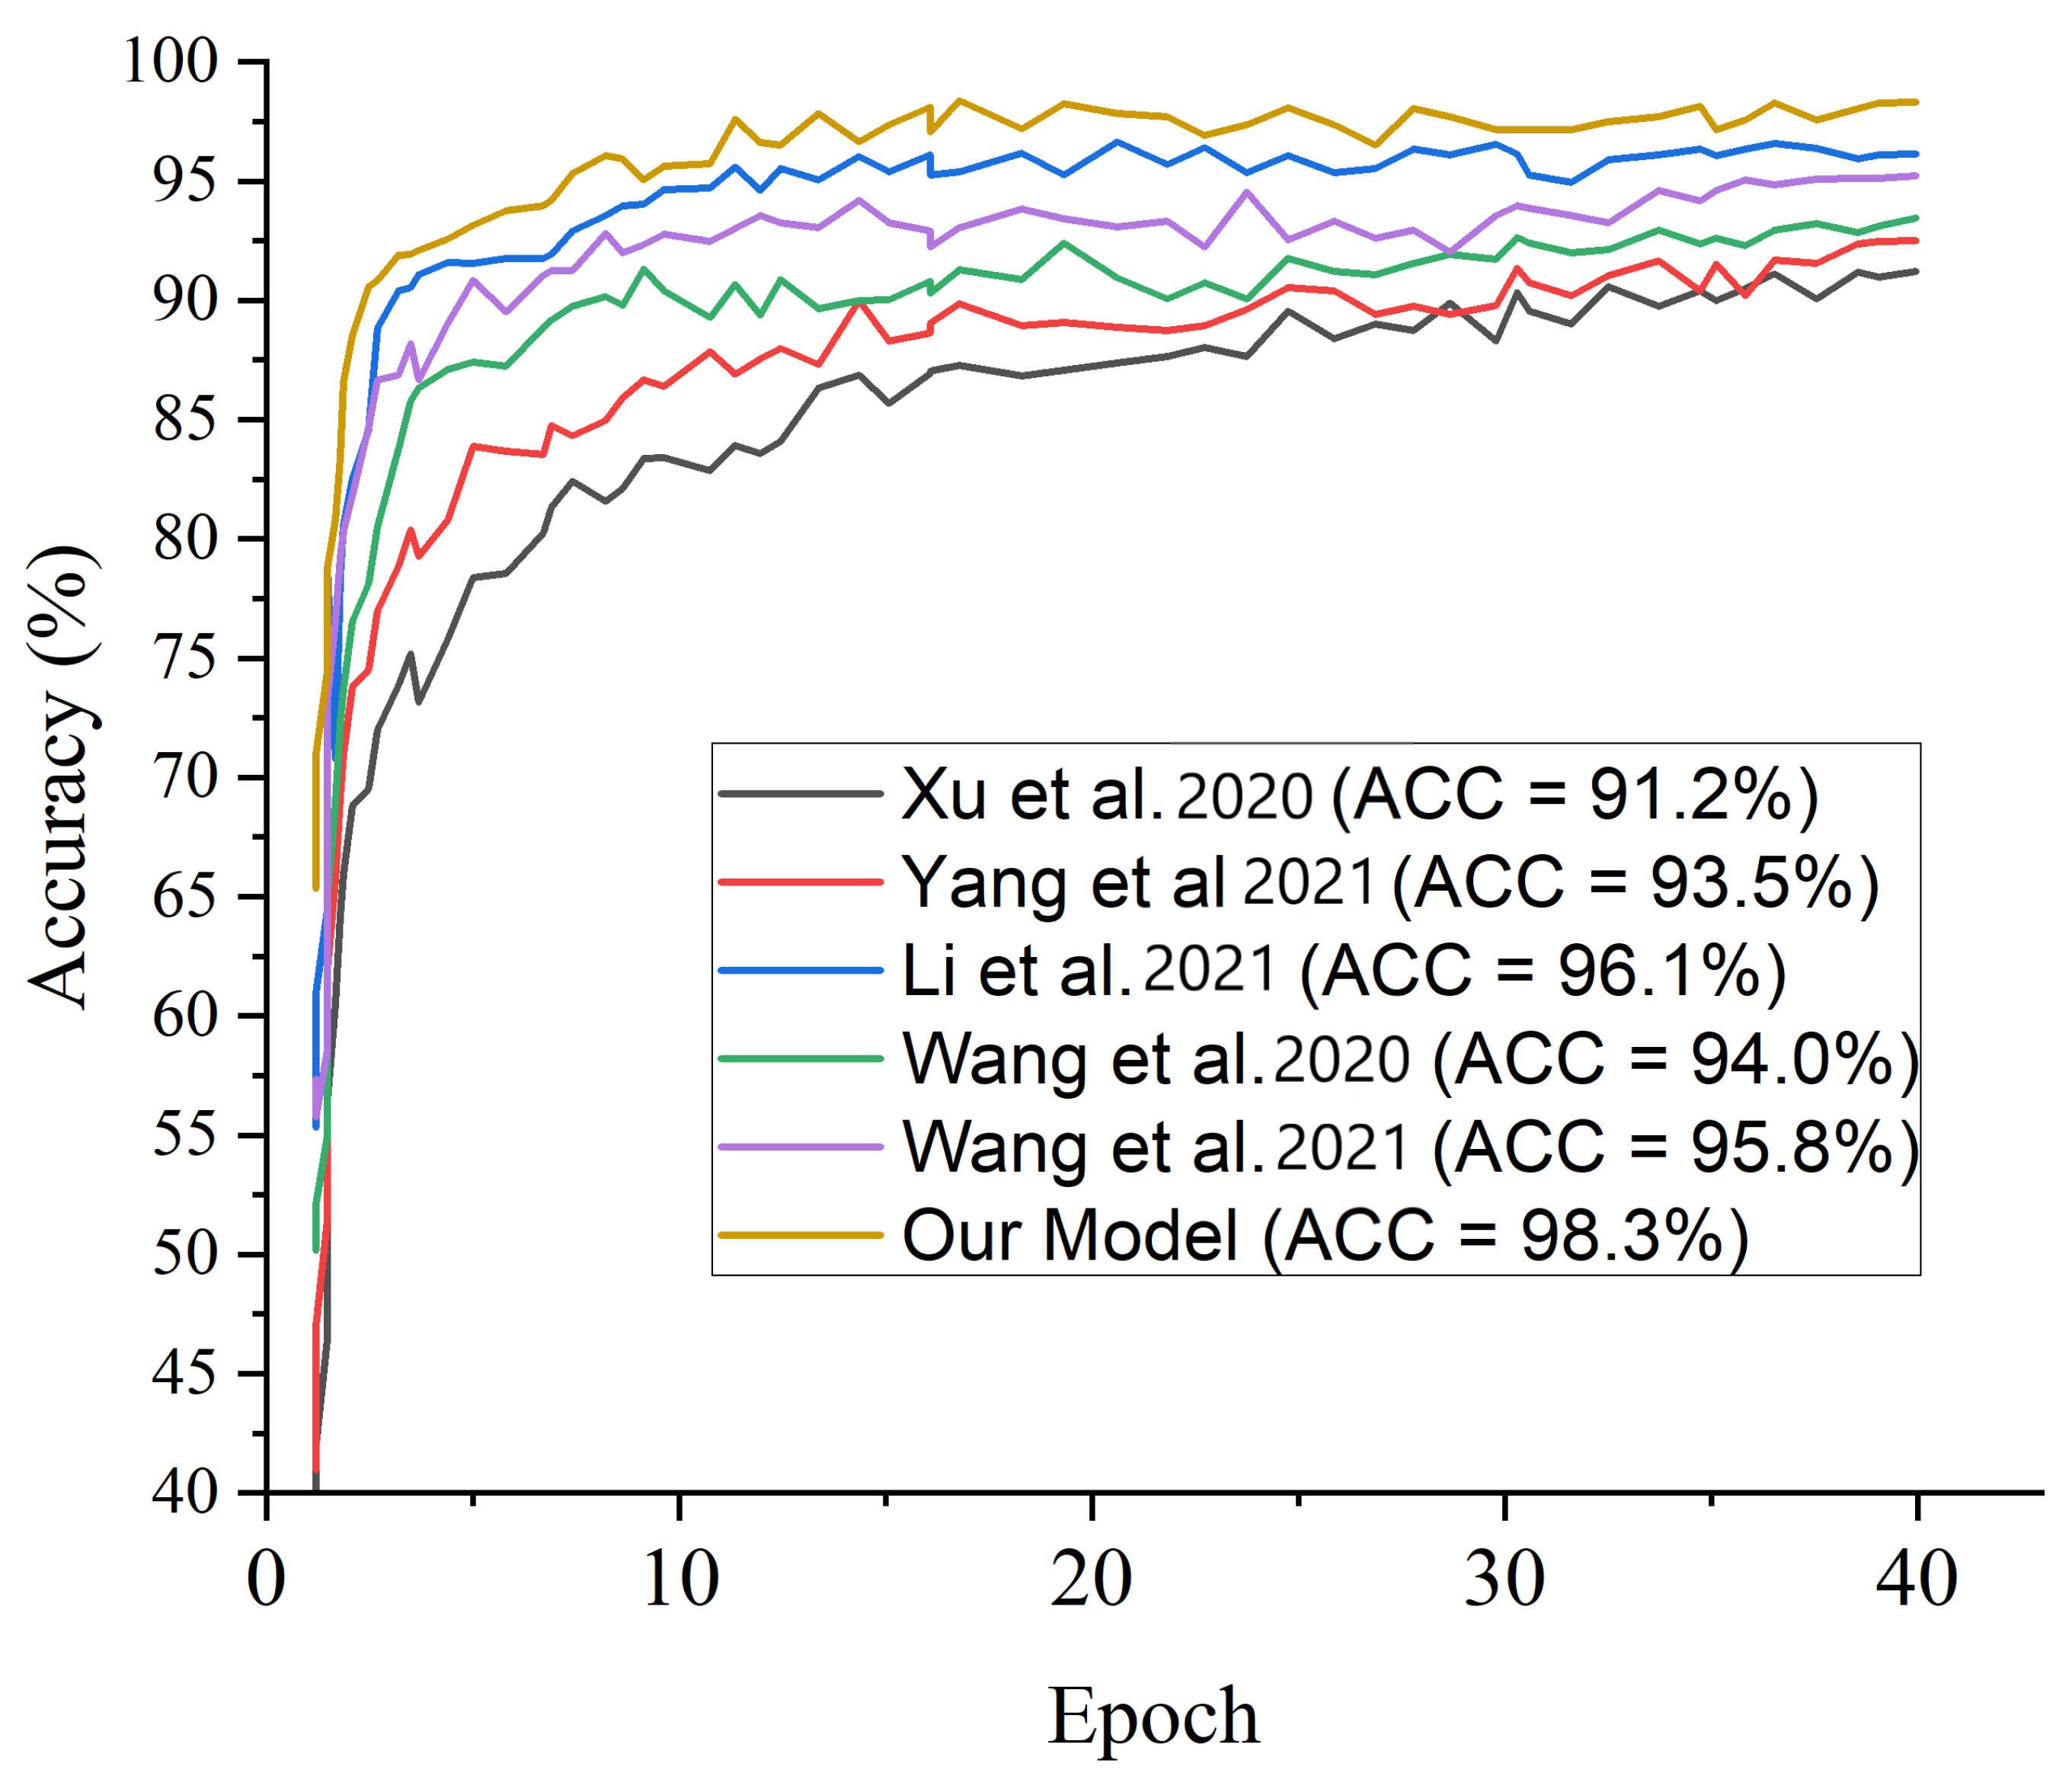
5. Discussion
5.1. Ablation Study
5.1.1. Hyperparameter Tuning
5.1.2. Raw X-ray Image Feature
6. Conclusions
Author Contributions
Funding
Institutional Review Board Statement
Informed Consent Statement
Data Availability Statement
Conflicts of Interest
References
- Ibrahim, U.; Ozsoz, M.; Serte, S.; Al-Turjman, F.; Yakoi, P.S. Pneumonia classification using deep learning from chest X-ray images during COVID-19. Cognit. Comput. 2021, 1–13. [Google Scholar] [CrossRef] [PubMed]
- Luján-Garc, J.E.; Yáñez-Márquez, C.; Villuendas-Rey, Y.; Camacho-Nieto, O. A transfer learning method for pneumonia classification and visualization. Appl. Sci. 2020, 10, 2908. [Google Scholar] [CrossRef] [Green Version]
- Stephen, O.; Sain, M.; Maduh, U.J.; Jeong, D.-U. An efficient deep learning approach to pneumonia classification in healthcare. J. Healthc. Eng. 2019, 2019, 4180949. [Google Scholar] [CrossRef] [PubMed] [Green Version]
- Acharya, A.K.; Satapathy, R. A deep learning based approach towards the automatic diagnosis of pneumonia from chest radio-graphs. Biomed. Pharmacol. J. 2020, 13, 449–455. [Google Scholar]
- Shi, F.; Xia, L.; Shan, F.; Song, B.; Wu, D.; Wei, Y.; Yuan, H.; Jiang, H.; He, Y.; Gao, Y.; et al. Large-scale screening to distinguish between COVID-19 and community-acquired pneumonia using infection size-aware classification. Phys. Med. Biol. 2021, 66, 65031. [Google Scholar] [CrossRef] [PubMed]
- El Asnaoui, K. Design ensemble deep learning model for pneumonia disease classification. Int. J. Multimed. Inf. Retr. 2021, 10, 55–68. [Google Scholar] [CrossRef] [PubMed]
- Nneji, G.U.; Cai, J.; Deng, J.; Monday, H.N.; Nahar, S.; Mgbejime, G.T.; James, E.C.; Woldeyes, S.K. A Dual Weighted Shared Capsule Network for Diabetic Retinopathy Fundus Classification. In Proceedings of the 2021 International Conference on High Performance Big Data and Intelligent Systems, Macau, China, 5–7 December 2021; pp. 297–302. [Google Scholar] [CrossRef]
- Nneji, G.U.; Cai, J.; Jianhua, D.; Monday, H.N.; Chikwendu, I.A.; Oluwasanmi, A.; James, E.C.; Mgbejime, G.T. Enhancing Low Quality in Radiograph Datasets Using Wavelet Transform Convolutional Neural Network and Generative Adversarial Network for COVID-19 Identification. In Proceedings of the 2021 the 4th International Conference on Pattern Recognition and Artificial Intelligence, Yibin, China, 20–22 August 2021; pp. 146–151. [Google Scholar] [CrossRef]
- Nneji, G.U.; Cai, J.; Jianhua, D.; Monday, H.N.; Ejiyi, C.J.; James, E.C.; Mgbejime, G.T.; Oluwasanmi, A. A Super-Resolution Generative Adversarial Network with Siamese CNN Based on Low Quality for Breast Cancer Identification. In Proceedings of the 2021 4th International Conference on Pattern Recognition and Artificial Intelligence, Yibin, China, 20–22 August 2021; pp. 218–223. [Google Scholar] [CrossRef]
- Monday, H.N.; Li, J.P.; Nneji, G.U.; Oluwasanmi, A.; Mgbejime, G.T.; Ejiyi, C.J.; Chikwendu, I.A.; James, E.C. Improved Convolutional Neural Multi-Resolution Wavelet Network for COVID-19 Pneumonia Classification. In Proceedings of the 2021 the 4th International Conference on Pattern Recognition and Artificial Intelligence, Yibin, China, 20–22 August 2021; pp. 267–273. [Google Scholar] [CrossRef]
- Monday, H.N.; Li, J.P.; Nneji, G.U.; James, E.C.; Chikwendu, I.A.; Ejiyi, C.J.; Oluwasanmi, A.; Mgbejime, G.T. The Capability of Multi Resolution Analysis: A Case Study of COVID-19 Diagnosis. In Proceedings of the 2021 the 4th International Conference on Pattern Recognition and Artificial Intelligence, Yibin, China, 20–22 August 2021; pp. 236–242. [Google Scholar] [CrossRef]
- Zilly, J.; Buhmann, J.M.; Mahapatra, D. Glaucoma detection using entropy sampling and ensemble learning for automatic optic cup and disc segmentation. Comput. Med. Imaging Graph. 2017, 55, 28–41. [Google Scholar] [CrossRef]
- Shah, V.; Keniya, R.; Shridharani, A.; Punjabi, M.; Shah, J.; Mehendale, N. Diagnosis of COVID-19 using CT scan images and deep learning techniques. Emerg. Radiol. 2021, 28, 497–505. [Google Scholar] [CrossRef]
- Maruthamuthu, M.K.; Raffiee, A.H.; De Oliveira, D.M.; Ardekani, A.M.; Verma, M.S. Raman spectra-based deep learning: A tool to identify microbial contamination. MicrobiologyOpen 2020, 9, e1122. [Google Scholar] [CrossRef]
- Maruthamuthu, M.K.; Rudge, S.R.; Ardekani, A.M.; Ladisch, M.R.; Verma, M.S. Process analytical technologies and data analytics for the manufacture of monoclonal antibodies. Trends Biotechnol. 2020, 38, 1169–1186. [Google Scholar] [CrossRef]
- Kermany, D.S.; Goldbaum, M.; Cai, W.; Valentim, C.C.S.; Liang, H.; Baxter, S.L.; McKeown, A.; Yang, G.; Wu, X.; Yan, F.; et al. Identifying Medical Diagnoses and Treatable Diseases by Image- Based Deep Learning. Cell 2018, 172, 1122–1131. [Google Scholar] [CrossRef] [PubMed]
- Santosh, C.; Antani, S. Automated chest X-ray screening: Can lung region symmetry help detect pulmonary abnormalities. IEEE Trans. Med. Imaging 2018, 37, 1168–1177. [Google Scholar] [CrossRef] [PubMed]
- Le Roux, M.; Myer, L.; Nicol, M.P. Incidence and severity of childhood pneumonia in the first year of life in a South African birth cohort. The Drakenstein Child Health Study. Lancet Glob. Health 2015, 3, e95–e103. [Google Scholar] [CrossRef] [Green Version]
- Cicero, M.; Bilbily, A.; Colak, E.; Dowdell, T.; Gray, B.; Perampaladas, K.; Barfett, J. Training and validating a deep convolutional neural network for computer-aided detection and classification of abnormalities on frontal chest radiographs. Investig. Radiol. 2017, 52, 281–287. [Google Scholar] [CrossRef]
- Guendel, S.; Grbic, S.; Georgescu, B.; Liu, S.; Maier, A.; Comaniciu, D. Learning to Recognize Abnormalities in Chest X-rays with Location-Aware Dense Networks. In Iberoamerican Congress on Pattern Recognition; Springer: Cham, Switzerland, 2018; pp. 757–765. [Google Scholar]
- Rajaraman, S.; Candemir, S.; Kim, I.; Thoma, G.; Antani, S. Visualization and interpretation of convolutional neural network predictions in detecting pneumonia in pediatric chest radiographs. Appl. Sci. 2018, 8, 1715. [Google Scholar] [CrossRef] [Green Version]
- Correa, M.; Zimic, M.; Barrientos, F.; Barrientos, R.; Román-Gonzalez, A.; Pajuelo, M.J.; Anticona, C.; Mayta, H.; Alva, A.; Solis-Vasquez, L.; et al. Automatic classification of pediatric pneumonia based on lung ultrasound pattern recognition. PLoS ONE 2018, 13, e0206410. [Google Scholar] [CrossRef]
- Ke, Q.; Zhang, J.; Wei, W.; Połap, D.; Woźniak, M.; Kośmider, L.; Damaševĭcius, R. A neuro-heuristic approach for recognition of lung diseases from X-ray images. Expert. Syst. Appl. 2019, 126, 218–232. [Google Scholar] [CrossRef]
- Saraiva, A.A.; Ferreira, N.M.F.; de Sousa, L.L.; Costa, N.J.C.; Sousa, J.V.M.; Santos, D.B.S.; Valente, A.; Soares, S. Classification of Images of Childhood Pneumonia Using Convolutional Neural Networks; BIOIMAGING: Geneva, Switzerland, 2019; pp. 112–119. [Google Scholar]
- Sirazitdinov, I.; Kholiavchenko, M.; Mustafaev, T.; Yixuan, Y.; Kuleev, R.; Ibragimov, B. Deep neural network ensemble for pneumonia localization from a large-scale chest X-ray database. Comput. Electr. Eng. 2019, 78, 388–399. [Google Scholar] [CrossRef]
- Liang, G.; Zheng, L. A transfer learning method with deep residual network for pediatric pneumonia diagnosis. Comput. Methods Programs Biomed. 2020, 187, 104964. [Google Scholar] [CrossRef]
- Apostolopoulos, I.D.; Mpesiana, T.A. COVID-19: Automatic detection from X-ray images utilizing transfer learning with convolutional neural networks. Phys. Eng. Sci. Med. 2020, 43, 635–640. [Google Scholar] [CrossRef] [Green Version]
- Xua, X.; Jiang, X.; Ma, C.; Du, P.; Li, X.; Lv, S.; Yu, L.; Ni, Q.; Chen, Y.; Su, J.; et al. A deep learning system to screen novel coronavirus disease 2019 pneumonia. Engineering 2020, 6, 1122–1129. [Google Scholar] [CrossRef] [PubMed]
- Habib, N.; Hasan, M.M.; Reza, M.M.; Rahman, M.M. Ensemble of CheXNet and VGG-19 feature extractor with random forest classifier for pediatric pneumonia detection. SN Comput. Sci. 2020, 1, 1–9. [Google Scholar] [CrossRef] [PubMed]
- Chouhan, V.; Singh, S.K.; Khamparia, A.; Gupta, D.; Tiwari, P.; Moreira, C.; Damaševičius, R.; de Albuquerque, V.H.C. A novel transfer learning based approach for pneumonia detection in chest X-ray images. Appl. Sci. 2020, 10, 559. [Google Scholar] [CrossRef] [Green Version]
- El Asnaoui, K.; Chawki, Y.; Idri, A. Automated Methods for Detection and Classification Pneumonia Based on X-ray Images Using Deep Learning. In Artificial Intelligence and Blockchain for Future Cybersecurity Applications; Springer: Berlin/Heidelberg, Germany, 2021; pp. 257–284. [Google Scholar]
- El Asnaoui, K.; Chawki, Y. Using X-ray images and deep learning for automated detection of coronavirus disease. J. Biomol. Struct. Dyn. 2020, 39, 3615–3626. [Google Scholar] [CrossRef] [PubMed]
- RSNA Pneumonia Detection Challenge | Kaggle [Internet]. Available online: https://www.kaggle.com/c/rsna-pneumonia-detection-challenge/data (accessed on 1 May 2021).
- Rahman, T.; Khandakar, A.; Qiblawey, Y.; Tahir, A.; Kiranyaz, S.; Kashem, S.B.A.; Islam, M.T.; Al Maadeed, S.; Zughaier, S.M.; Khan, M.S.; et al. Exploring the effect of image enhancement techniques on COVID-19 detection using chest X-ray images. Comput. Biol. Med. 2021, 132, 104319. [Google Scholar] [CrossRef] [PubMed]
- Yamaç, M.; Ahishali, M.; Degerli, A.; Kiranyaz, S.; Chowdhury, M.E.H.; Gabbouj, M. Convolutional Sparse Support Estimator-Based COVID-19 Recognition From X-Ray Images. IEEE Trans. Neural Netw. Learn. Syst. 2021, 32, 1810–1820. [Google Scholar] [CrossRef] [PubMed]
- Wang, J.; Bao, Y.; Wen, Y.; Lu, H.; Luo, H.; Xiang, Y.; Li, X.; Liu, C.; Qian, D. Prior-Attention Residual Learning for More Discriminative COVID-19 Screening in CT Images. IEEE Trans. Med. Imaging 2020, 39, 2572–2583. [Google Scholar] [CrossRef] [PubMed]
- Li, J.; Wang, Y.; Wang, S.; Wang, J.; Liu, J.; Jin, Q.; Sun, L. Multiscale Attention Guided Network for COVID-19 Diagnosis Using Chest X-Ray Images. IEEE J. Biomed. Health Inform. 2021, 25, 1336–1346. [Google Scholar] [CrossRef]
- Singh, K.K.; Singh, A. Diagnosis of COVID-19 from chest X-ray images using wavelets-based depthwise convolution network. Big Data Min. Anal. 2021, 4, 84–93. [Google Scholar] [CrossRef]
- Yang, Z.; Zhao, L.; Wu, S.; Chen, C.Y.-C. Lung Lesion Localization of COVID-19 From Chest CT Image: A Novel Weakly Supervised Learning Method. IEEE J. Biomed. Health Inform. 2021, 25, 1864–1872. [Google Scholar] [CrossRef]
- Wang, X.; Jiang, L.; Li, L.; Xu, M.; Deng, X.; Dai, L.; Xu, X.; Li, T.; Guo, Y.; Wang, Z.; et al. Joint Learning of 3D Lesion Segmentation and Classification for Explainable COVID-19 Diagnosis. IEEE Trans. Med Imaging 2021, 40, 2463–2476. [Google Scholar] [CrossRef]
- Alsharif, R.; Al-Issa, Y.; Alqudah, A.M.; Qasmieh, I.A.; Mustafa, W.A.; Alquran, H. PneumoniaNet: Automated Detection and Classification of Pediatric Pneumonia Using Chest X-ray Images and CNN Approach. Electronics 2021, 10, 2949. [Google Scholar] [CrossRef]
- Alqudah, A.M.; Qazan, S.; Masad, I.S. Artificial Intelligence Framework for Efficient Detection and Classification of Pneumonia Using Chest Radiography Images. J. Med. Biol. Eng. 2021, 41, 599–609. [Google Scholar] [CrossRef]
- Alquran, H.; Alsleti, M.; Alsharif, R.; Abu Qasmieh, I.; Alqudah, A.; Binti Harun, N.H. Employing Texture Features of Chest X-Ray Images and Machine Learning in COVID-19 Detection and Classification. Mendel 2021, 27, 9–17. [Google Scholar] [CrossRef]
- Masad, I.S.; Alqudah, A.; Alqudah, A.M.; Almashaqbeh, S. A hybrid deep learning approach towards building an intelligent system for pneumonia detection in chest X-ray images. Int. J. Electr. Comput. Eng. 2021, 11, 5530–5540. [Google Scholar] [CrossRef]


| Authors | Year | Mode of Imaging | DL Techniques | Classification Task | Evaluation Results |
|---|---|---|---|---|---|
| Cicero et al. [19] | 2017 | X-ray Image | GoogLeNet is utilized to classify two classes - normal and abnormal images | Binary class | For normal class: SEN = 91%, SPE = 91%, and UC = 96.4% For abnormal class: SEN (within 74% to 91%), SPE (within 75% to 91%), and AUC (within 85% to 96.2%) |
| Guendel et al. [20] | 2018 | X-ray Image | Used location-aware dense networks technique to identify anomalies in chest X-rays | Multiple class | PLCO dataset, mean AUC = 87.4%, Chest X-ray 14 dataset, mean AUC = 84.1% |
| Rajaraman et al. [21] | 2018 | X-ray Image | A modified VGG16 is employed for the identification and detection of viral and bacterial pneumonia | Binary class | ACC (within 91.8% to 96.2%) |
| Correa et al. [22] | 2018 | Ultrasound Image | Detection of pneumonia using 3 layers feed-forward neural network | Binary class | SEN = 90.9% SPE = 100% |
| Ke et al. [23] | 2019 | X-ray Image | Detection of lung diseases using an approach called neuroheuristic | Multiple class | Sensitivity = 84.22%, Accuracy = 79.06%, Specificity = 66.7% |
| Saraiva et al. [24] | 2019 | X-ray Image | A CNN model was applied on a dataset of 5863 images and cross-validation was used for the validation of the model | Binary class | Accuracy = 95.30% |
| Sirazitdinov et al. [25] | 2019 | X-ray Image | An emsemble of RetinaNet and Mask RCNN was applied | Binary class | Precision = 75.0%, Recall = 79%, F1-score = 77.0% |
| Liang and Zheng [26] | 2020 | X-ray Image | A modified 49 convolutional and 2 fully connected layer of a CNN model was used for the classification of children’s lung regions | Binary class | F1-score = 92.7% |
| Apostolopoulos et al. [27] | 2020 | X-ray Image | Different fine-tuning approaches were evaluated for the automatic detection of pneumonia | Binary class | VGG19 has the highest value of: Sensitivity = 92.85%, Specificity = 98.75%, Accuracy = 98.75% |
| Xu et al. [28] | 2020 | X-ray Image | Multiple CNN models were compared in order to categorize the classes of CT scans | Multiple class | Accuracy = 86.7% |
| Habib et al. [29] | 2020 | X-ray Image | Detection of pneumonia using an ensemble of VGG-19 and CheXNet for the extraction of features and random forest as the classifier | Binary class | Accuracy = 98.93% |
| Chouhan et al. [30] | 2020 | X-ray Image | A transfer learning technique is applied for the detection of pneumonia | Binary class | Accuracy = 96.4% Sensitivity 99.0% |
| El Asnaoui et al. [31] | 2020 | X-ray Image | A fine-tuned of eight different models for the detection and classification of pneumonia | Binary class | Highest accuracy is the fine-tubed ResNet50 (>96%) |
| El Asnaoui et al. [32] | 2020 | X-ray Image | A comparative findings of seven DL models for the classification and detection of pneumonia (including COVID-19) | Multiple class | Accuracy Evaluations: InceptionResNet-V2 = 92.18%, DenseNet201 = 88.09% |
| Dataset | Pneumonia Category | Value | Selected Amount Used |
|---|---|---|---|
| Kaggle database of RSNA [33] | Bacterial | 3029 | 1000 |
| Viral | 2983 | 1000 | |
| Normal | 8851 | 1000 | |
| Rahman et al. [34] | COVID-19 | 3616 | 1000 |
| Input | Operator | Expansion Size | Output | SE | NL | Stride |
|---|---|---|---|---|---|---|
| 224 × 224 × 3 | Conv2d, 3 × 3 | - | 16 | No | HS | 2 |
| 112 × 112 × 16 | bneck, 3 × 3 | 16 | 16 | Yes | RE | 2 |
| 56 × 56 × 16 | bneck, 3 × 3 | 72 | 24 | No | RE | 2 |
| 28 × 28 × 24 | bneck, 3 × 3 | 86 | 24 | No | RE | 1 |
| 28 × 28 × 24 | bneck, 5 × 5 | 96 | 40 | Yes | HS | 2 |
| 14 × 14 × 40 | bneck, 5 × 5 | 240 | 40 | Yes | HS | 1 |
| 14 × 14 × 40 | bneck, 5 × 5 | 240 | 40 | Yes | HS | 1 |
| 14 × 14 × 40 | bneck, 5 × 5 | 120 | 48 | Yes | HS | 1 |
| 14 × 14 × 48 | bneck, 5 × 5 | 144 | 48 | Yes | HS | 1 |
| 7 × 7 × 96 | bneck, 5 × 5 | 288 | 96 | Yes | HS | 2 |
| 7 × 7 × 96 | bneck, 5 × 5 | 576 | 96 | Yes | HS | 1 |
| 7 × 7 × 96 | bneck, 5 × 5 | 576 | 96 | Yes | HS | 1 |
| 7 × 7 × 256 | Conv2d, 1 × 1 | - | 256 | Yes | HS | 1 |
| 1 × 1 × 256 | Avg pool, 7 × 7 | - | - | No | - | 1 |
| 1 × 1 × 512 | Conv2d, 1 × 1 | - | 512 | No | HS | 1 |
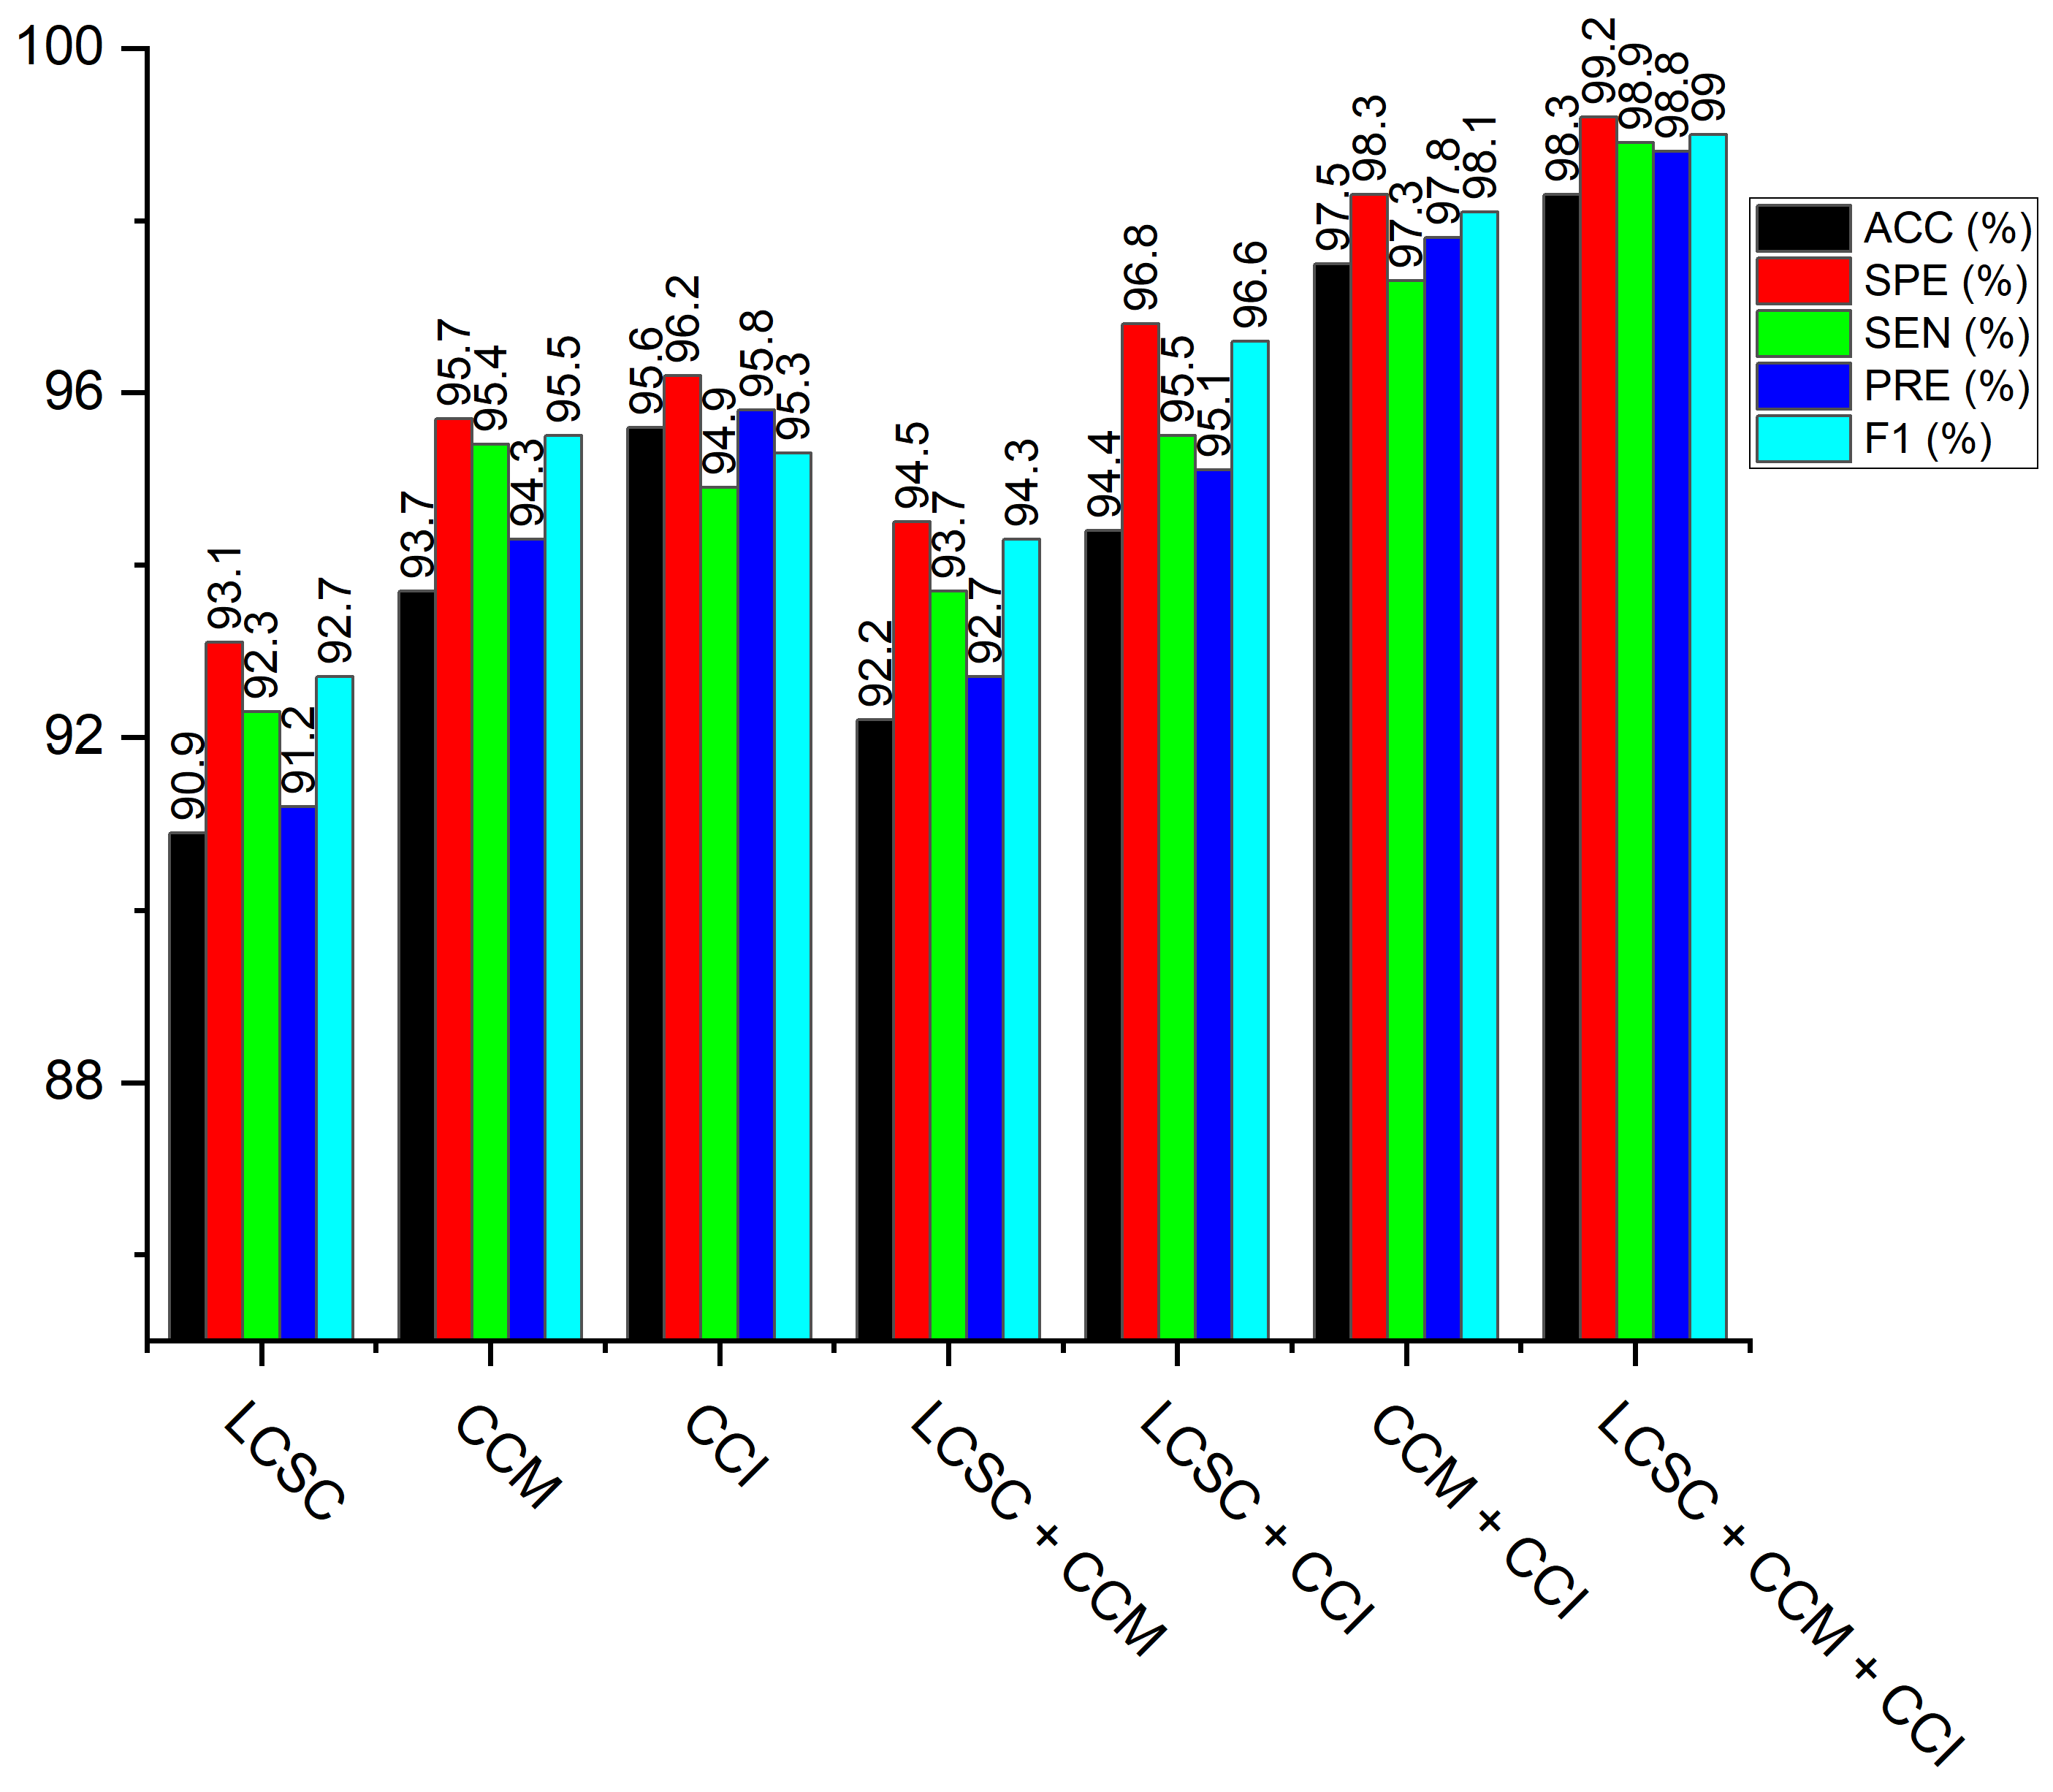
| Model | ACC (%) | SEN (%) | SPE (%) | PRE (%) | F1-s (%) | Time (min) |
|---|---|---|---|---|---|---|
| LBP-Channel Shallow CNN (LCSC) | 90.9 | 92.3 | 93.1 | 91.2 | 92.7 | 3.2 |
| CECED-Channel MobileNet-V3 (CCM) | 93.7 | 95.4 | 95.7 | 94.3 | 95.5 | 18.6 |
| CLAHE-Channel Inception-V3 (CCI) | 95.6 | 94.9 | 96.2 | 95.8 | 95.3 | 21.8 |
| LBP-Channel Shallow CNN + CECED-channel MobileNet-V3 (LCSC + CCM) | 92.2 | 93.7 | 94.5 | 92.7 | 94.3 | 23.4 |
| LBP-Channel Shallow CNN + CLAHE-channel Inception-V3 (LCSC + CCI) | 94.4 | 95.5 | 96.8 | 95.1 | 96.6 | 22.7 |
| CLAHE-Channel inception-V3 + CECED-channel MobileNet-V3 (CCI + CCM) | 97.5 | 97.3 | 98.3 | 97.8 | 98.1 | 26.8 |
| LBP-Channel Shallow CNN + CLAHE-channel Inception-V3 + CECED-channel MobileNet-V3 (LCSC + CCI + CCM) | 98.3 | 98.9 | 99.2 | 98.8 | 99.0 | 30.3 |
| Authors | ACC (%) | SEN (%) | SPE (%) |
|---|---|---|---|
| Cicero et al. [19] | 91.0 | 91.0 | 91.0 |
| Correa et al. [22] | - | 90.9 | 100.0 |
| Apostolopoulos et al. [27] | 98.0 | 92.9 | 98.8 |
| Xu et al. [28] | 86.7 | 86.9 | - |
| Habib et al. [29] | 98.93 | - | - |
| Chouchan et al. [30] | 96.4 | 99.6 | - |
| Yamaç et al. [35] | 86.5 | 79.2 | 90.7 |
| Wang et al. [36] | 93.3 | 90.7 | 95.5 |
| Li et al. [37] | 96.9 | 97.8 | 94.9 |
| J.K. K. Singh and A. Singh [38] | 95.8 | 96.1 | 95.7 |
| Yang et al. [39] | 88.4 | 64.7 | 92.9 |
| Wang et al. [40] | 94.5 | 94.7 | 97.3 |
| Alsharif et al. [41] | 99.7 | 99.7 | 99.8 |
| Alqudah et al. [42] | 93.9 | 93.2 | 96.6 |
| Alquran et al. [43] | 93.1 | 92.9 | 96.4 |
| Masad et al. [44] | 98.9 | 98.3 | 99.2 |
| Our Model | 98.3 | 98.9 | 99.2 |
| Model | ACC (%) | SEN (%) | SPE (%) |
|---|---|---|---|
| Xu et al. [28] | 91.2 | 91.8 | 93.1 |
| Wang et al. [36] | 94.0 | 92.9 | 94.2 |
| Li et al. [37] | 96.1 | 94.4 | 95.5 |
| Yang et al. [39] | 93.5 | 92.4 | 94.7 |
| Wang et al. [40] | 95.8 | 95.4 | 96.4 |
| Our Model | 98.3 | 98.9 | 99.2 |
| Model | LBP-Based Channel | CECED-Based Channel | CLAHE-Based Channel | ||||||
|---|---|---|---|---|---|---|---|---|---|
| ACC (%) | SEN (%) | SPE (%) | ACC (%) | SEN (%) | SPE (%) | ACC (%) | SEN (%) | SPE (%) | |
| AlexNet | 89.2 | 91.4 | 92.6 | 89.3 | 87.5 | 90.2 | 92.5 | 94.3 | 93.7 |
| VGG-16 | 88.9 | 90.7 | 91.4 | 90.9 | 90.1 | 91.8 | 91.4 | 92.8 | 91.9 |
| ResNet-152 | 84.6 | 86.2 | 87.9 | 91.4 | 92.3 | 93.1 | 87.8 | 88.1 | 87.6 |
| MobileNet-V3 | 87.7 | 89.4 | 90.5 | 93.7 | 95.4 | 95.7 | 90.4 | 91.6 | 90.8 |
| DenseNet-121 | 85.3 | 87.1 | 88.7 | 92.8 | 92.8 | 93.3 | 88.4 | 89.2 | 88.7 |
| Inception-V3 | 86.3 | 88.6 | 89.4 | 93.1 | 91.5 | 93.7 | 95.6 | 94.9 | 96.2 |
| Shallow CNN | 90.9 | 92.3 | 93.1 | 87.2 | 86.1 | 88.4 | 85.9 | 86.2 | 85.7 |
| Hyperparameters | (LCSC + Adam) | (CCI + Adam) | (CCM + Adam) | (LCSC + CCI + Adam) | (LCSC + CCM + Adam) | (CCI + CCM + Adam) | (LCSC + CCI + CCM + Adam) |
|---|---|---|---|---|---|---|---|
| Accuracy (%) | Accuracy (%) | Accuracy (%) | Accuracy (%) | Accuracy (%) | Accuracy (%) | Accuracy (%) | |
| LR (0.1) + Dropout (0.25) | 87.5 | 81.6 | 89.6 | 87.3 | 85.6 | 90.2 | 88.1 |
| LR (0.1) + Dropout (0.50) | 86.9 | 87.3 | 90.7 | 89.6 | 87.4 | 89.5 | 87.6 |
| LR (0.1) + Dropout (0.75) | 83.6 | 82.6 | 87.9 | 89.9 | 89.3 | 91.7 | 89.2 |
| LR (0.01) + Dropout (0.25) | 81.4 | 85.1 | 91.1 | 90.4 | 91.7 | 90.4 | 87.1 |
| LR (0.01) + Dropout (0.50) | 89.8 | 84.9 | 86.3 | 91.1 | 90.8 | 85.5 | 88.4 |
| LR (0.01) + Dropout (0.75) | 84.7 | 90.7 | 92.8 | 85.7 | 89.2 | 87.8 | 89.7 |
| LR (0.001) + Dropout (0.25) | 82.2 | 95.6 | 88.2 | 84.6 | 92.1 | 92.1 | 91.5 |
| LR (0.001) + Dropout (0.50) | 80.7 | 91.3 | 93.4 | 86.5 | 89.7 | 94.7 | 92.6 |
| LR (0.001) + Dropout (0.75) | 88.3 | 92.7 | 93.7 | 91.4 | 90.8 | 89.6 | 93.8 |
| LR (0.0001) + Dropout (0.25) | 85.9 | 83.4 | 85.6 | 87.9 | 92.4 | 96.3 | 97.4 |
| LR (0.0001) + Dropout (0.50) | 90.9 | 80.6 | 87.1 | 94.4 | 92.2 | 97.5 | 98.3 |
| LR (0.0001) + Dropout (0.75) | 79.5 | 86.2 | 88.9 | 89.8 | 93.3 | 95.7 | 95.9 |
| Hyperparameters | (LCSC + RMSProp) | (CCI + RMSProp) | (CCM + RMSProp) | (LCSC + CCI + RMSProp) | (LCSC + CCM + RMSProp) | (CCI + CCM + RMSProp) | (LCSC + CCI + CCM + RMSProp) |
|---|---|---|---|---|---|---|---|
| Accuracy (%) | Accuracy (%) | Accuracy (%) | Accuracy (%) | Accuracy (%) | Accuracy (%) | Accuracy (%) | |
| LR (0.1) + Dropout (0.25) | 88.5 | 89.1 | 88.9 | 87.6 | 90.7 | 89.7 | 90.1 |
| LR (0.1) + Dropout (0.50) | 89.7 | 87.4 | 89.5 | 87.2 | 89.5 | 90.3 | 91.3 |
| LR (0.1) + Dropout (0.75) | 86.3 | 90.7 | 88.1 | 89.3 | 89.6 | 91.6 | 89.8 |
| LR (0.01) + Dropout (0.25) | 87.7 | 88.2 | 89.6 | 88.4 | 88.4 | 92.5 | 91.6 |
| LR (0.01) + Dropout (0.50) | 81.4 | 91.5 | 91.2 | 90.6 | 90.9 | 90.9 | 93.4 |
| LR (0.01) + Dropout (0.75) | 81.1 | 89.8 | 90.4 | 89.7 | 91.6 | 92.1 | 92.8 |
| LR (0.001) + Dropout (0.25) | 83.8 | 92.3 | 92.2 | 88.9 | 90.1 | 91.4 | 94.4 |
| LR (0.001) + Dropout (0.50) | 86.5 | 89.6 | 94.3 | 87.3 | 93.7 | 93.7 | 96.5 |
| LR (0.001) + Dropout (0.75) | 84.2 | 90.9 | 93.5 | 90.4 | 92.4 | 95.3 | 95.9 |
| LR (0.0001) + Dropout (0.25) | 85.9 | 91.1 | 94.7 | 91.8 | 93.6 | 94.5 | 97.4 |
| LR (0.0001) + Dropout (0.50) | 88.6 | 89.5 | 93.9 | 90.6 | 92.9 | 93.9 | 96.2 |
| LR (0.0001) + Dropout (0.75) | 85.3 | 88.9 | 94.6 | 89.7 | 91.5 | 92.6 | 95.5 |
| Hyperparameters | (LCSC + SGD) | (CCI + SGD) | (CCM + SGD) | (LCSC + CCI + SGD) | (LCSC + CCM + SGD) | (CCI + CCM + SGD) | (LCSC + CCI + CCM + SGD) |
|---|---|---|---|---|---|---|---|
| Accuracy (%) | Accuracy (%) | Accuracy (%) | Accuracy (%) | Accuracy (%) | Accuracy (%) | Accuracy (%) | |
| LR (0.1) + Dropout (0.25) | 87.2 | 88.8 | 87.7 | 86.1 | 87.1 | 90.8 | 89.7 |
| LR (0.1) + Dropout (0.50) | 85.5 | 89.3 | 88.1 | 88.5 | 89.6 | 89.1 | 90.5 |
| LR (0.1) + Dropout (0.75) | 87.9 | 97.5 | 89.5 | 87.9 | 88.2 | 90.9 | 91.6 |
| LR (0.01) + Dropout (0.25) | 89.1 | 90.9 | 91.9 | 89.7 | 89.7 | 91.7 | 89.1 |
| LR (0.01) + Dropout (0.50) | 82.3 | 92.3 | 90.3 | 91.5 | 91.4 | 92.3 | 91.3 |
| LR (0.01) + Dropout (0.75) | 83.6 | 88.7 | 89.5 | 90.3 | 90.1 | 90.8 | 93.5 |
| LR (0.001) + Dropout (0.25) | 84.9 | 91.9 | 91.7 | 89.1 | 91.2 | 92.5 | 92.7 |
| LR (0.001) + Dropout (0.50) | 85.7 | 90.4 | 92.4 | 90.5 | 92.5 | 91.6 | 95.9 |
| LR (0.001) + Dropout (0.75) | 83.5 | 91.6 | 94.1 | 91.9 | 93.8 | 94.9 | 94.4 |
| LR (0.0001) + Dropout (0.25) | 86.3 | 89.3 | 93.3 | 89.7 | 92.9 | 95.3 | 96.2 |
| LR (0.0001) + Dropout (0.50) | 87.1 | 90.8 | 94.6 | 91.5 | 93.6 | 92.5 | 95.6 |
| LR (0.0001) + Dropout (0.75) | 88.8 | 89.2 | 93.0 | 90.3 | 92.3 | 93.7 | 96.8 |
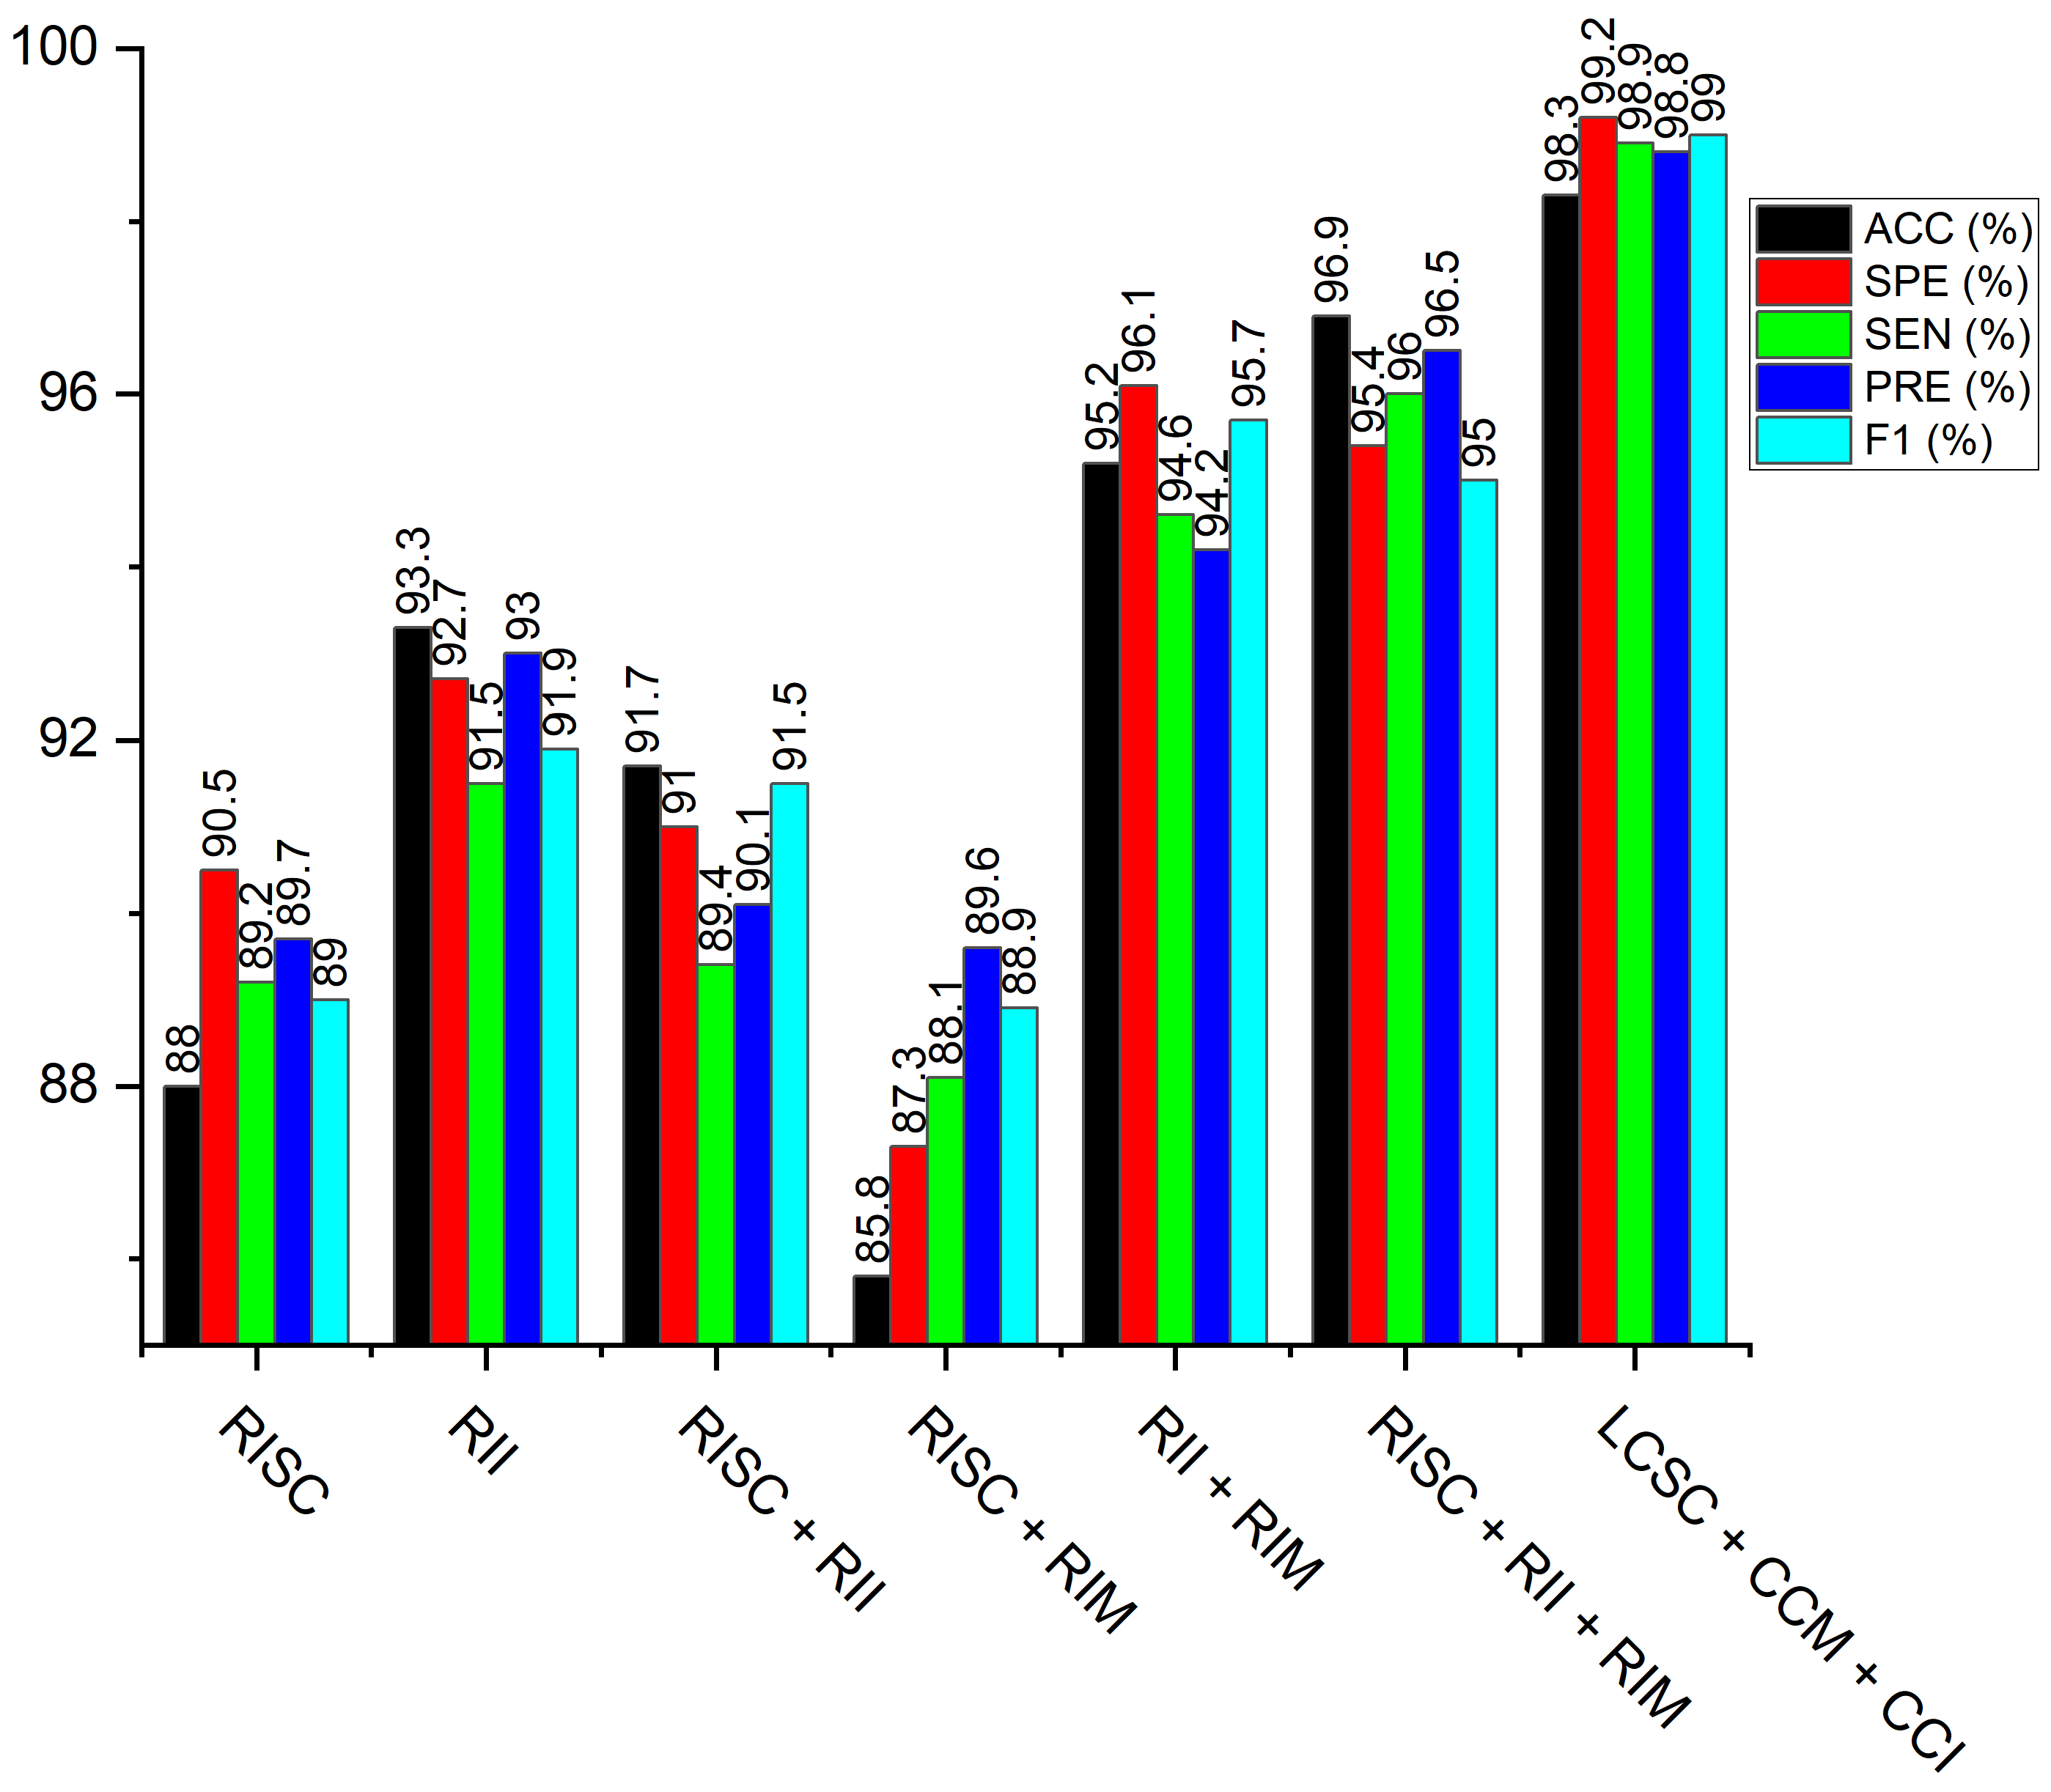
| Model | ACC (%) | SEN (%) | SPE (%) | PRE (%) | F1 (%) |
|---|---|---|---|---|---|
| Raw image Shallow CNN (RISC) | 82.1 | 83.6 | 80.8 | 82.9 | 83.3 |
| Raw image MobileNet-V3 (RIM) | 88.0 | 89.2 | 90.5 | 89.7 | 89.0 |
| Raw image Inception-V3 (RII) | 93.34 | 91.5 | 92.7 | 93.0 | 91.9 |
| Raw image Shallow CNN + Raw image Inception-V3 (RISC + RII) | 91.7 | 89.4 | 91.0 | 90.1 | 91.5 |
| Raw image Shallow CNN + Raw image MobileNet-V3 (RISC + RIM) | 85.8 | 86.1 | 87.3 | 89.6 | 88.9 |
| Raw image Inception-V3 + Raw image MobileNet-V3 (RII + RIM) | 95.2 | 94.6 | 96.1 | 94.2 | 95.7 |
| Raw image Shallow CNN + Raw image Inception-V3 + Raw image MobileNet-V3 (RISC + RII + RIM) | 96.9 | 96.0 | 95.4 | 96.5 | 95.0 |
| Model | Raw Image | ||
|---|---|---|---|
| ACC (%) | SEN (%) | SPE (%) | |
| AlexNet | 90.9 | 89.1 | 91.0 |
| VGG-16 | 89.6 | 90.3 | 89.2 |
| ResNet-152 | 90.2 | 88.5 | 89.0 |
| MobileNet-V3 | 88.0 | 89.2 | 90.5 |
| DenseNet-121 | 87.7 | 89.1 | 88.3 |
| Inception-V3 | 93.3 | 91.5 | 92.7 |
| Shallow CNN | 82.1 | 83.6 | 80.8 |
Publisher’s Note: MDPI stays neutral with regard to jurisdictional claims in published maps and institutional affiliations. |
© 2022 by the authors. Licensee MDPI, Basel, Switzerland. This article is an open access article distributed under the terms and conditions of the Creative Commons Attribution (CC BY) license (https://creativecommons.org/licenses/by/4.0/).
Share and Cite
Nneji, G.U.; Cai, J.; Deng, J.; Monday, H.N.; James, E.C.; Ukwuoma, C.C. Multi-Channel Based Image Processing Scheme for Pneumonia Identification. Diagnostics 2022, 12, 325. https://doi.org/10.3390/diagnostics12020325
Nneji GU, Cai J, Deng J, Monday HN, James EC, Ukwuoma CC. Multi-Channel Based Image Processing Scheme for Pneumonia Identification. Diagnostics. 2022; 12(2):325. https://doi.org/10.3390/diagnostics12020325
Chicago/Turabian StyleNneji, Grace Ugochi, Jingye Cai, Jianhua Deng, Happy Nkanta Monday, Edidiong Christopher James, and Chiagoziem Chima Ukwuoma. 2022. "Multi-Channel Based Image Processing Scheme for Pneumonia Identification" Diagnostics 12, no. 2: 325. https://doi.org/10.3390/diagnostics12020325
APA StyleNneji, G. U., Cai, J., Deng, J., Monday, H. N., James, E. C., & Ukwuoma, C. C. (2022). Multi-Channel Based Image Processing Scheme for Pneumonia Identification. Diagnostics, 12(2), 325. https://doi.org/10.3390/diagnostics12020325