
Polygenetic Variants Related to Osteoarthritis Risk and Their Interactions with Energy, Protein, Fat, and Alcohol Intake in Adults in a Large Cohort


Abstract
:1. Introduction
2. Methods
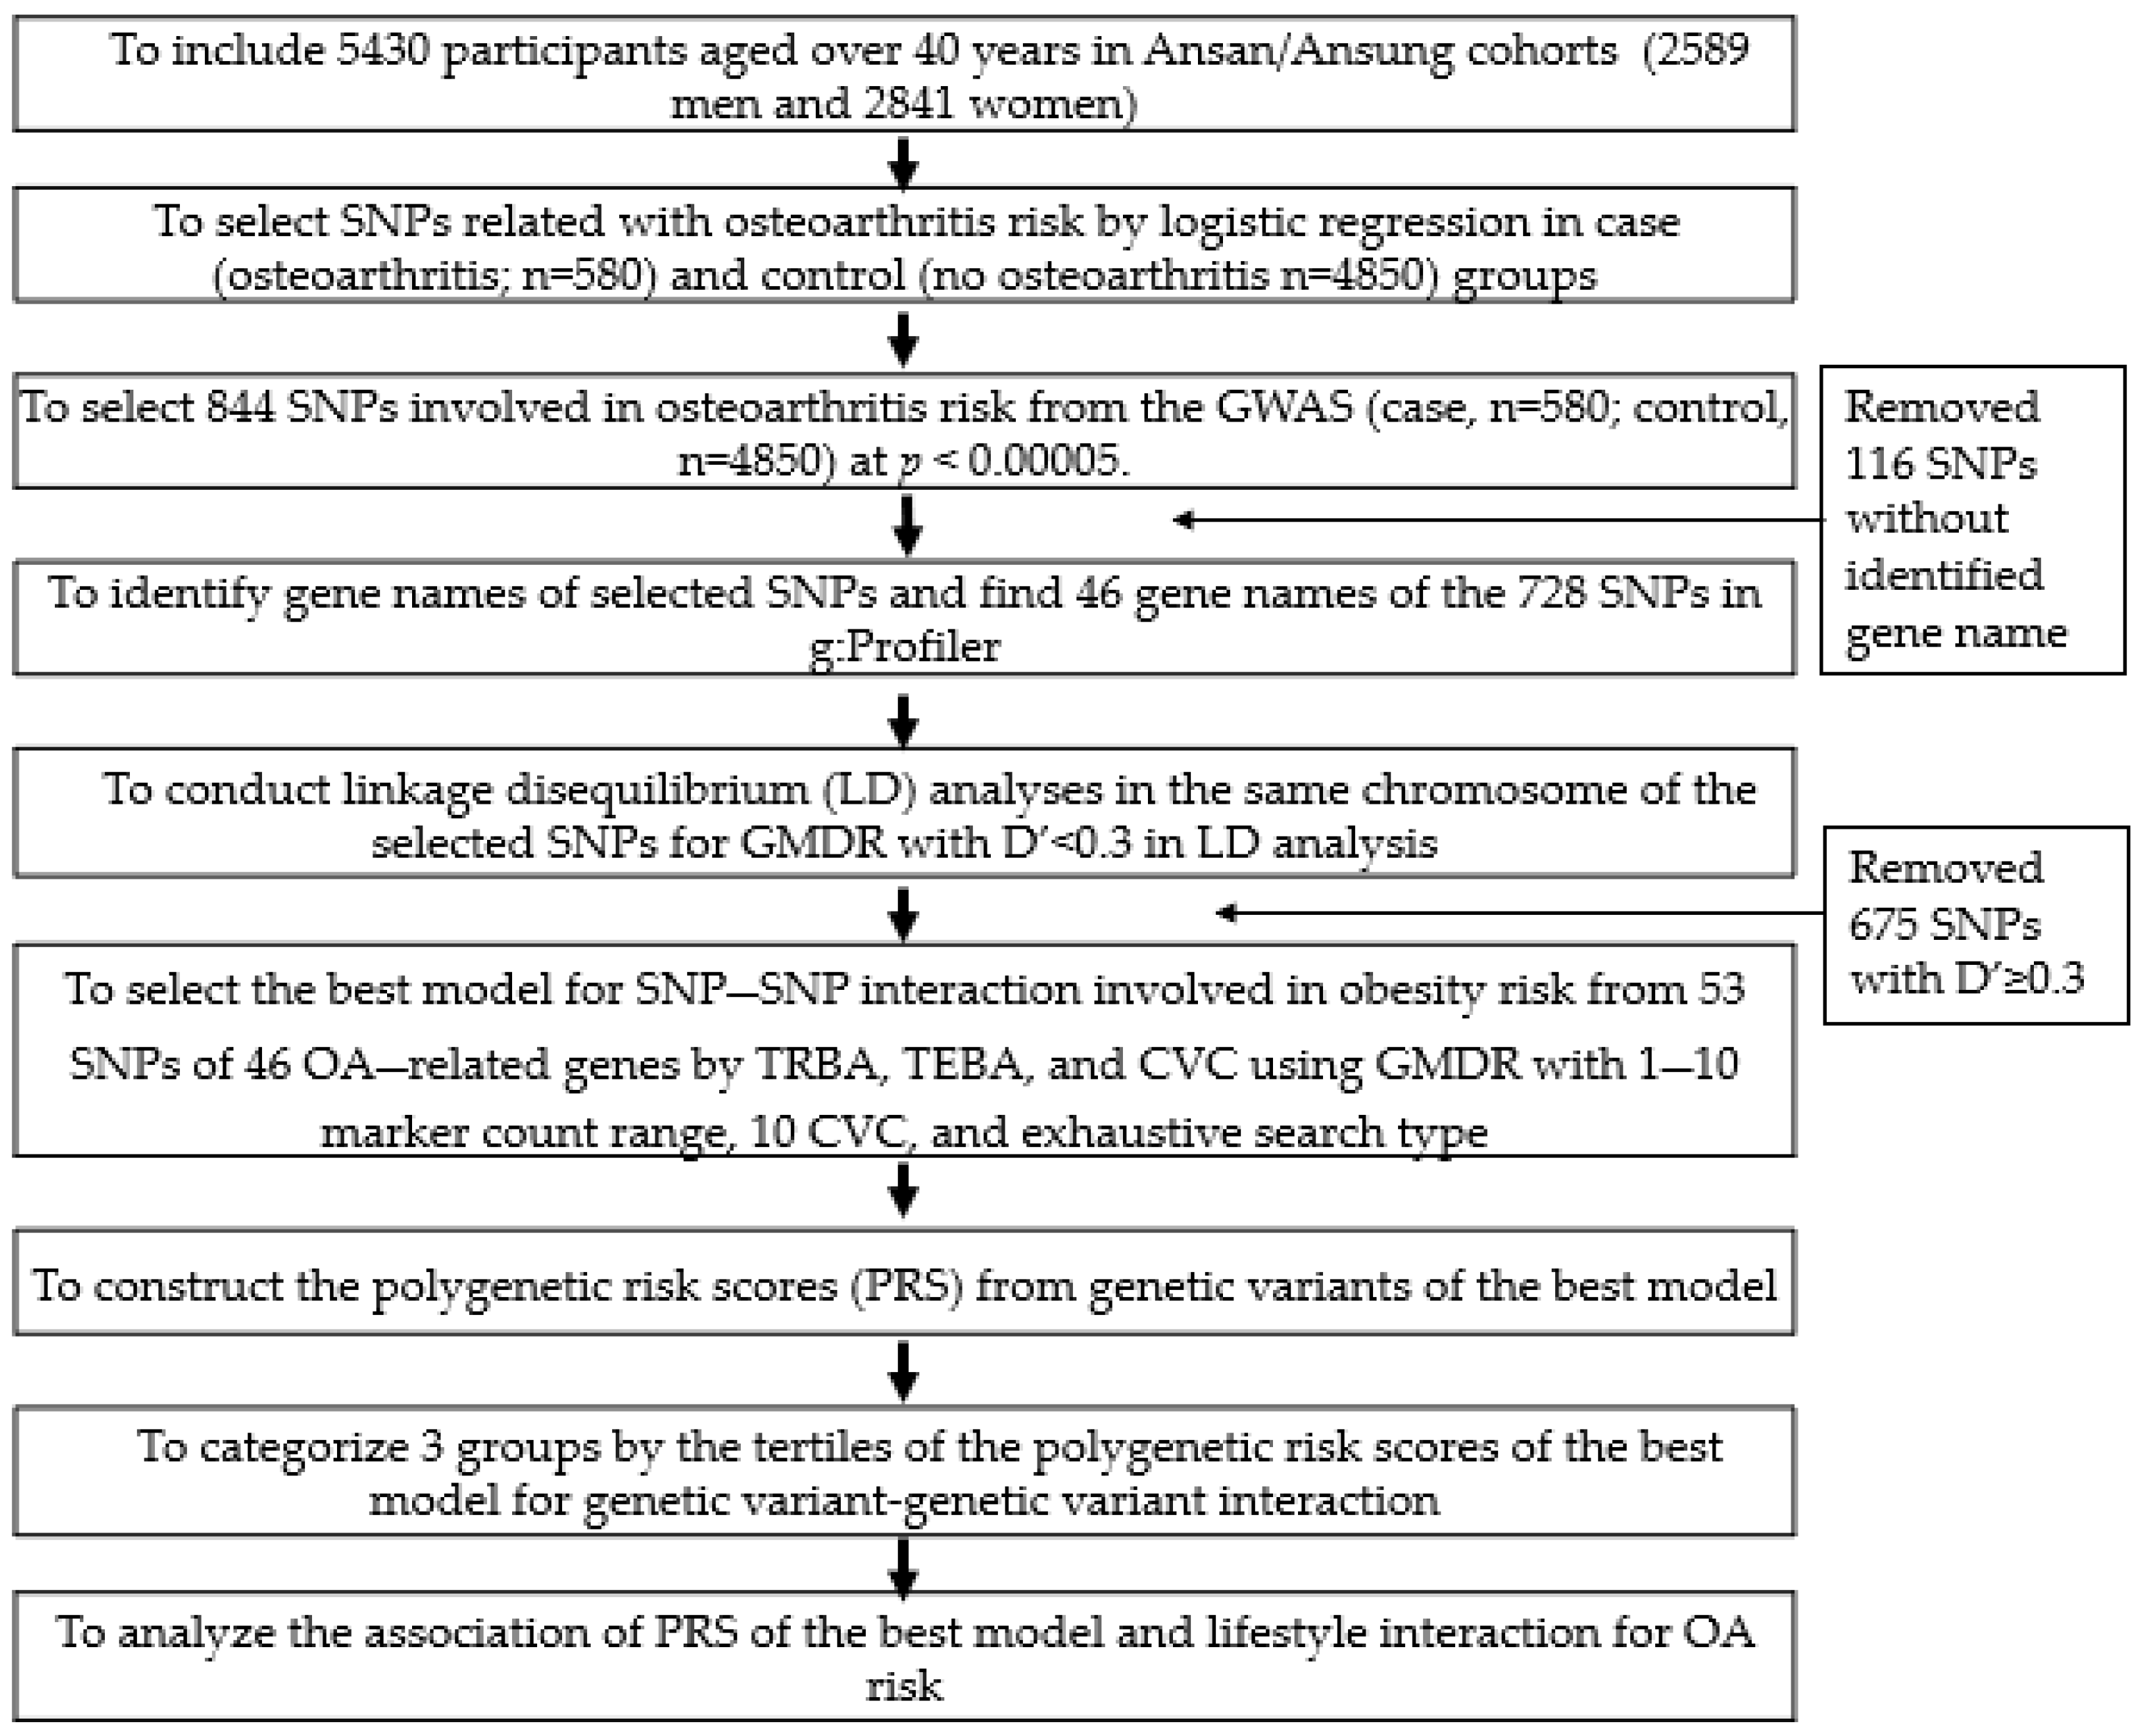
2.1. Participants
2.2. General Characteristics and Biochemical Measurements
2.3. Definition of Osteoarthritis, Obesity, and Metabolic Syndrome
2.4. Assessment of Foods and Nutrient Intake, and Diet Patterns
2.5. Genotyping and Quality Control
2.6. Expression Quantitative Trait Locus (eQTL) Analysis
2.7. The Best Model with SNP–SNP Interactions to Influence Osteoarthritis Risk
2.8. Statistical Analysis
3. Results
3.1. Characteristics of the Participants According to the Incidence of OA
3.2. Nutrient Intake and Lifestyles in the OA Participants
3.3. Genetic Variants Related to OA Risk and the Best Model with Genetic Variant–Genetic Variant Interaction
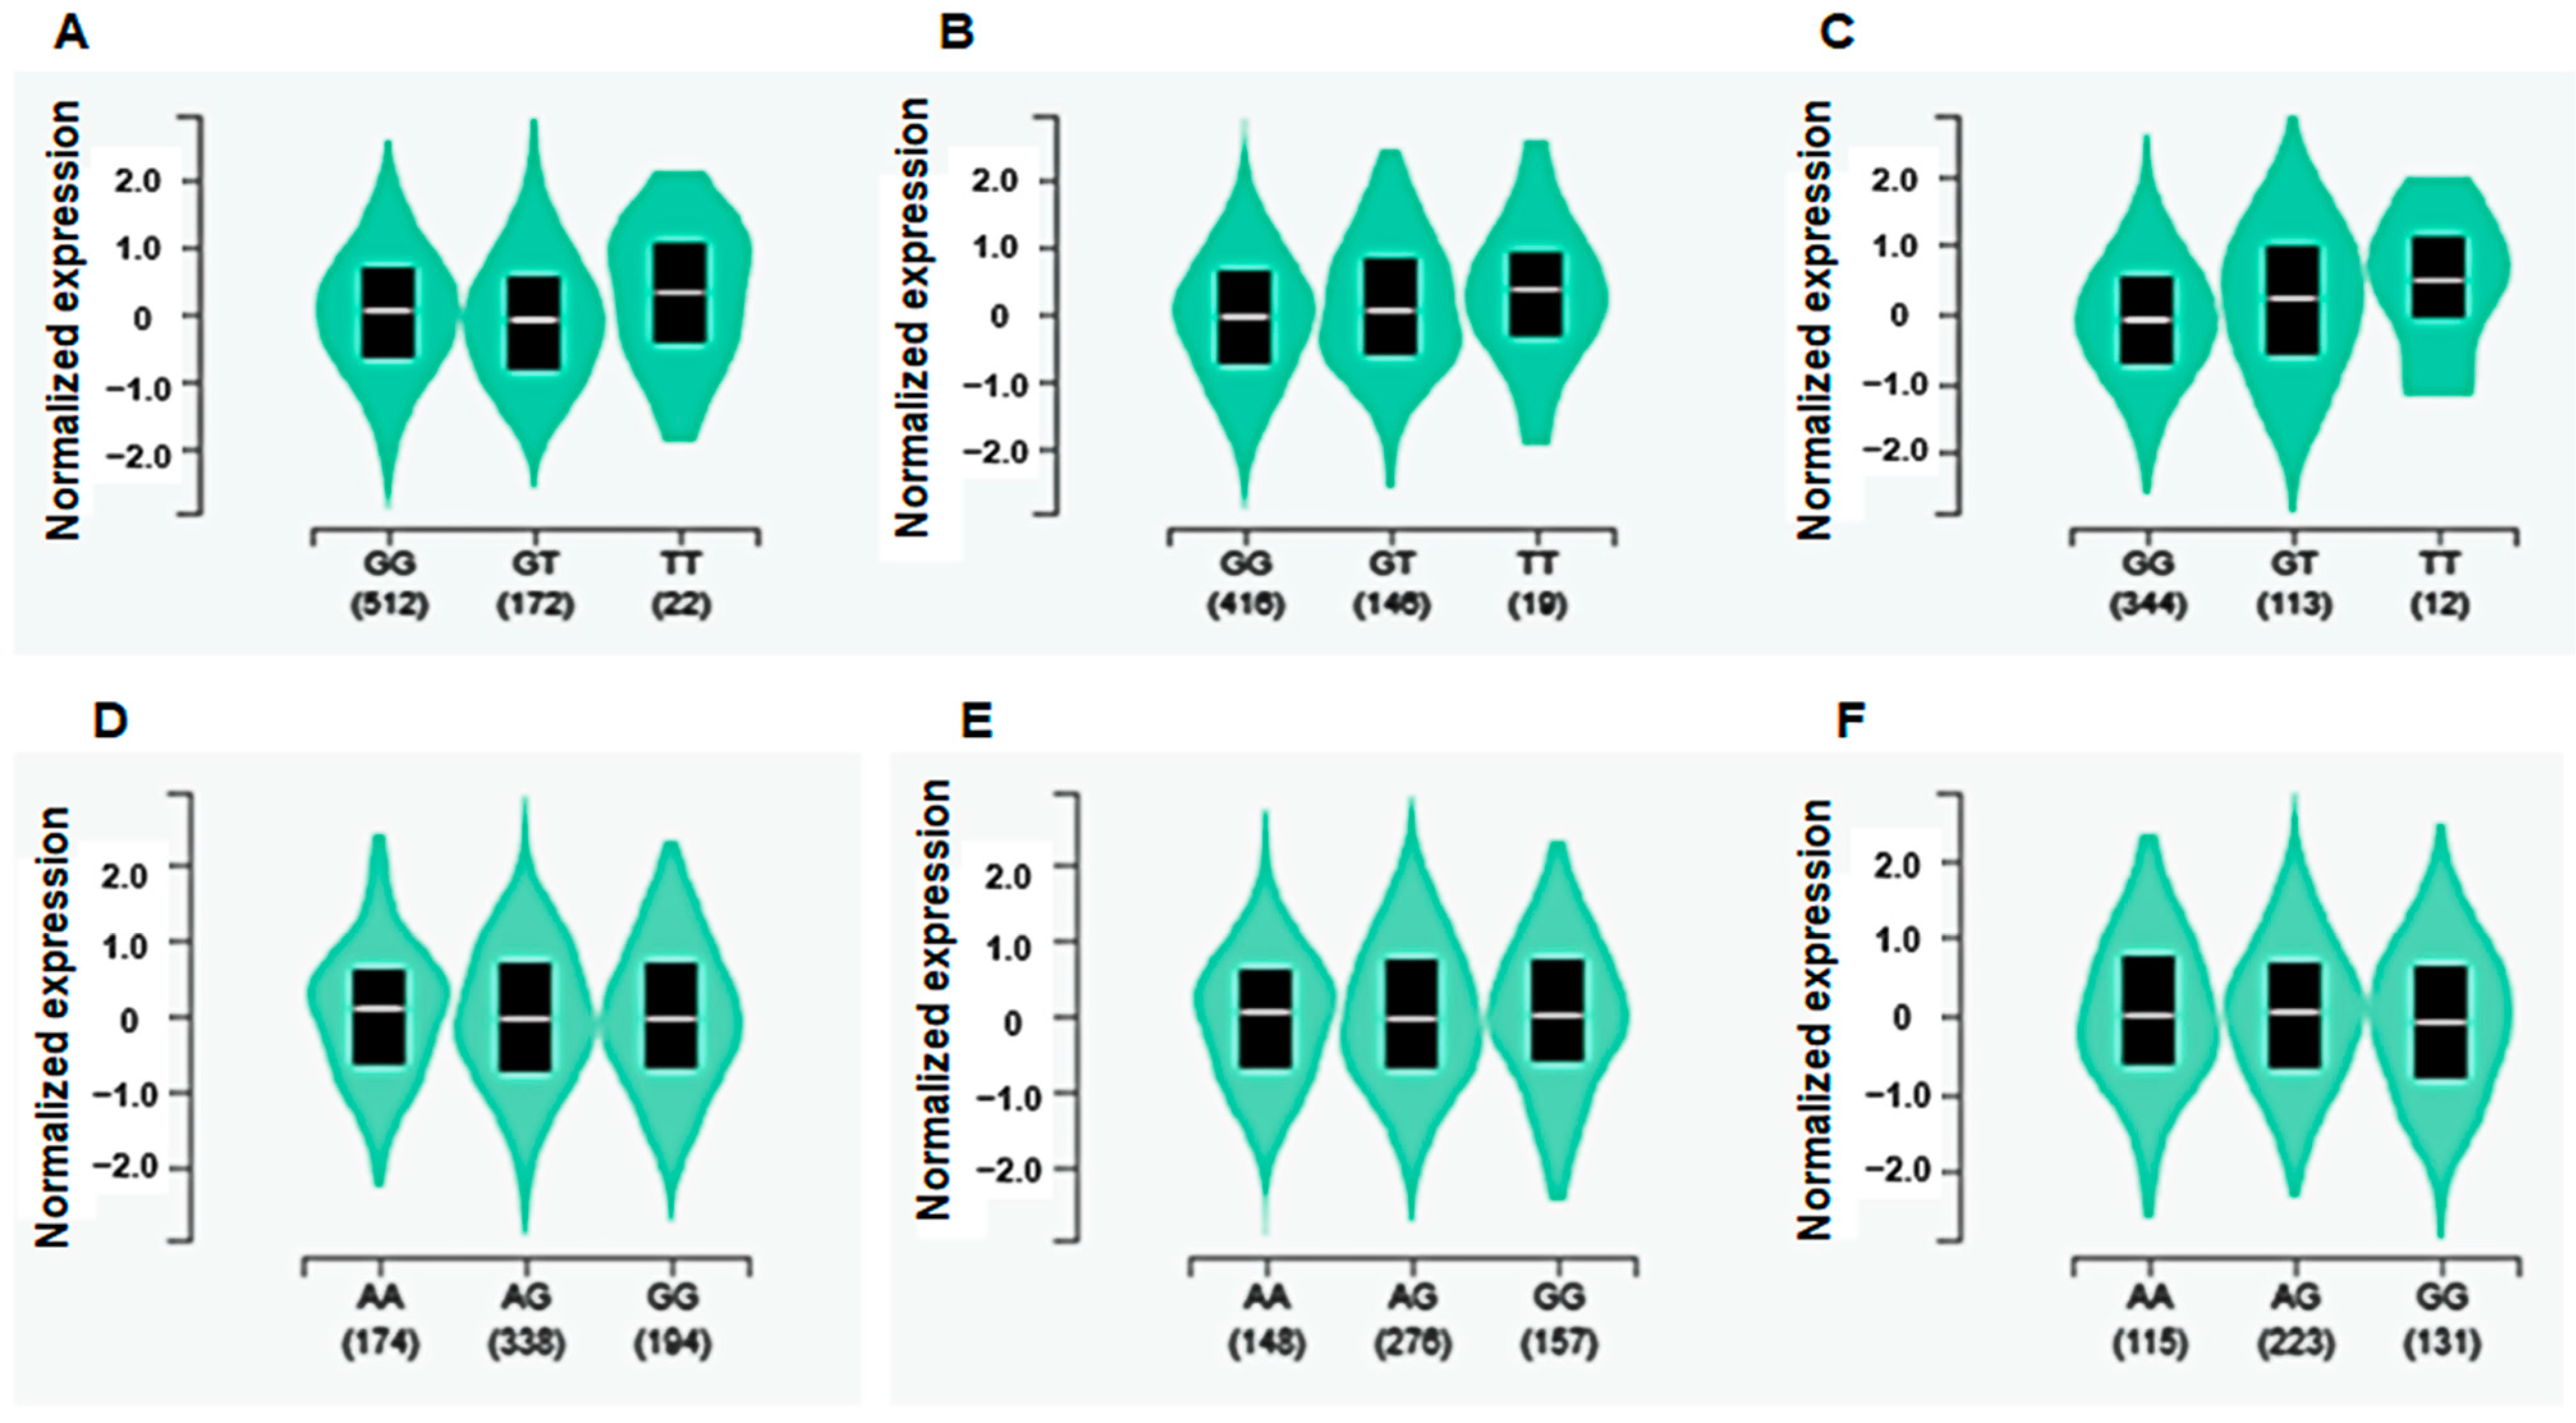
3.4. eQTL Analysis in Skeletal Muscle and Adipose Tissue
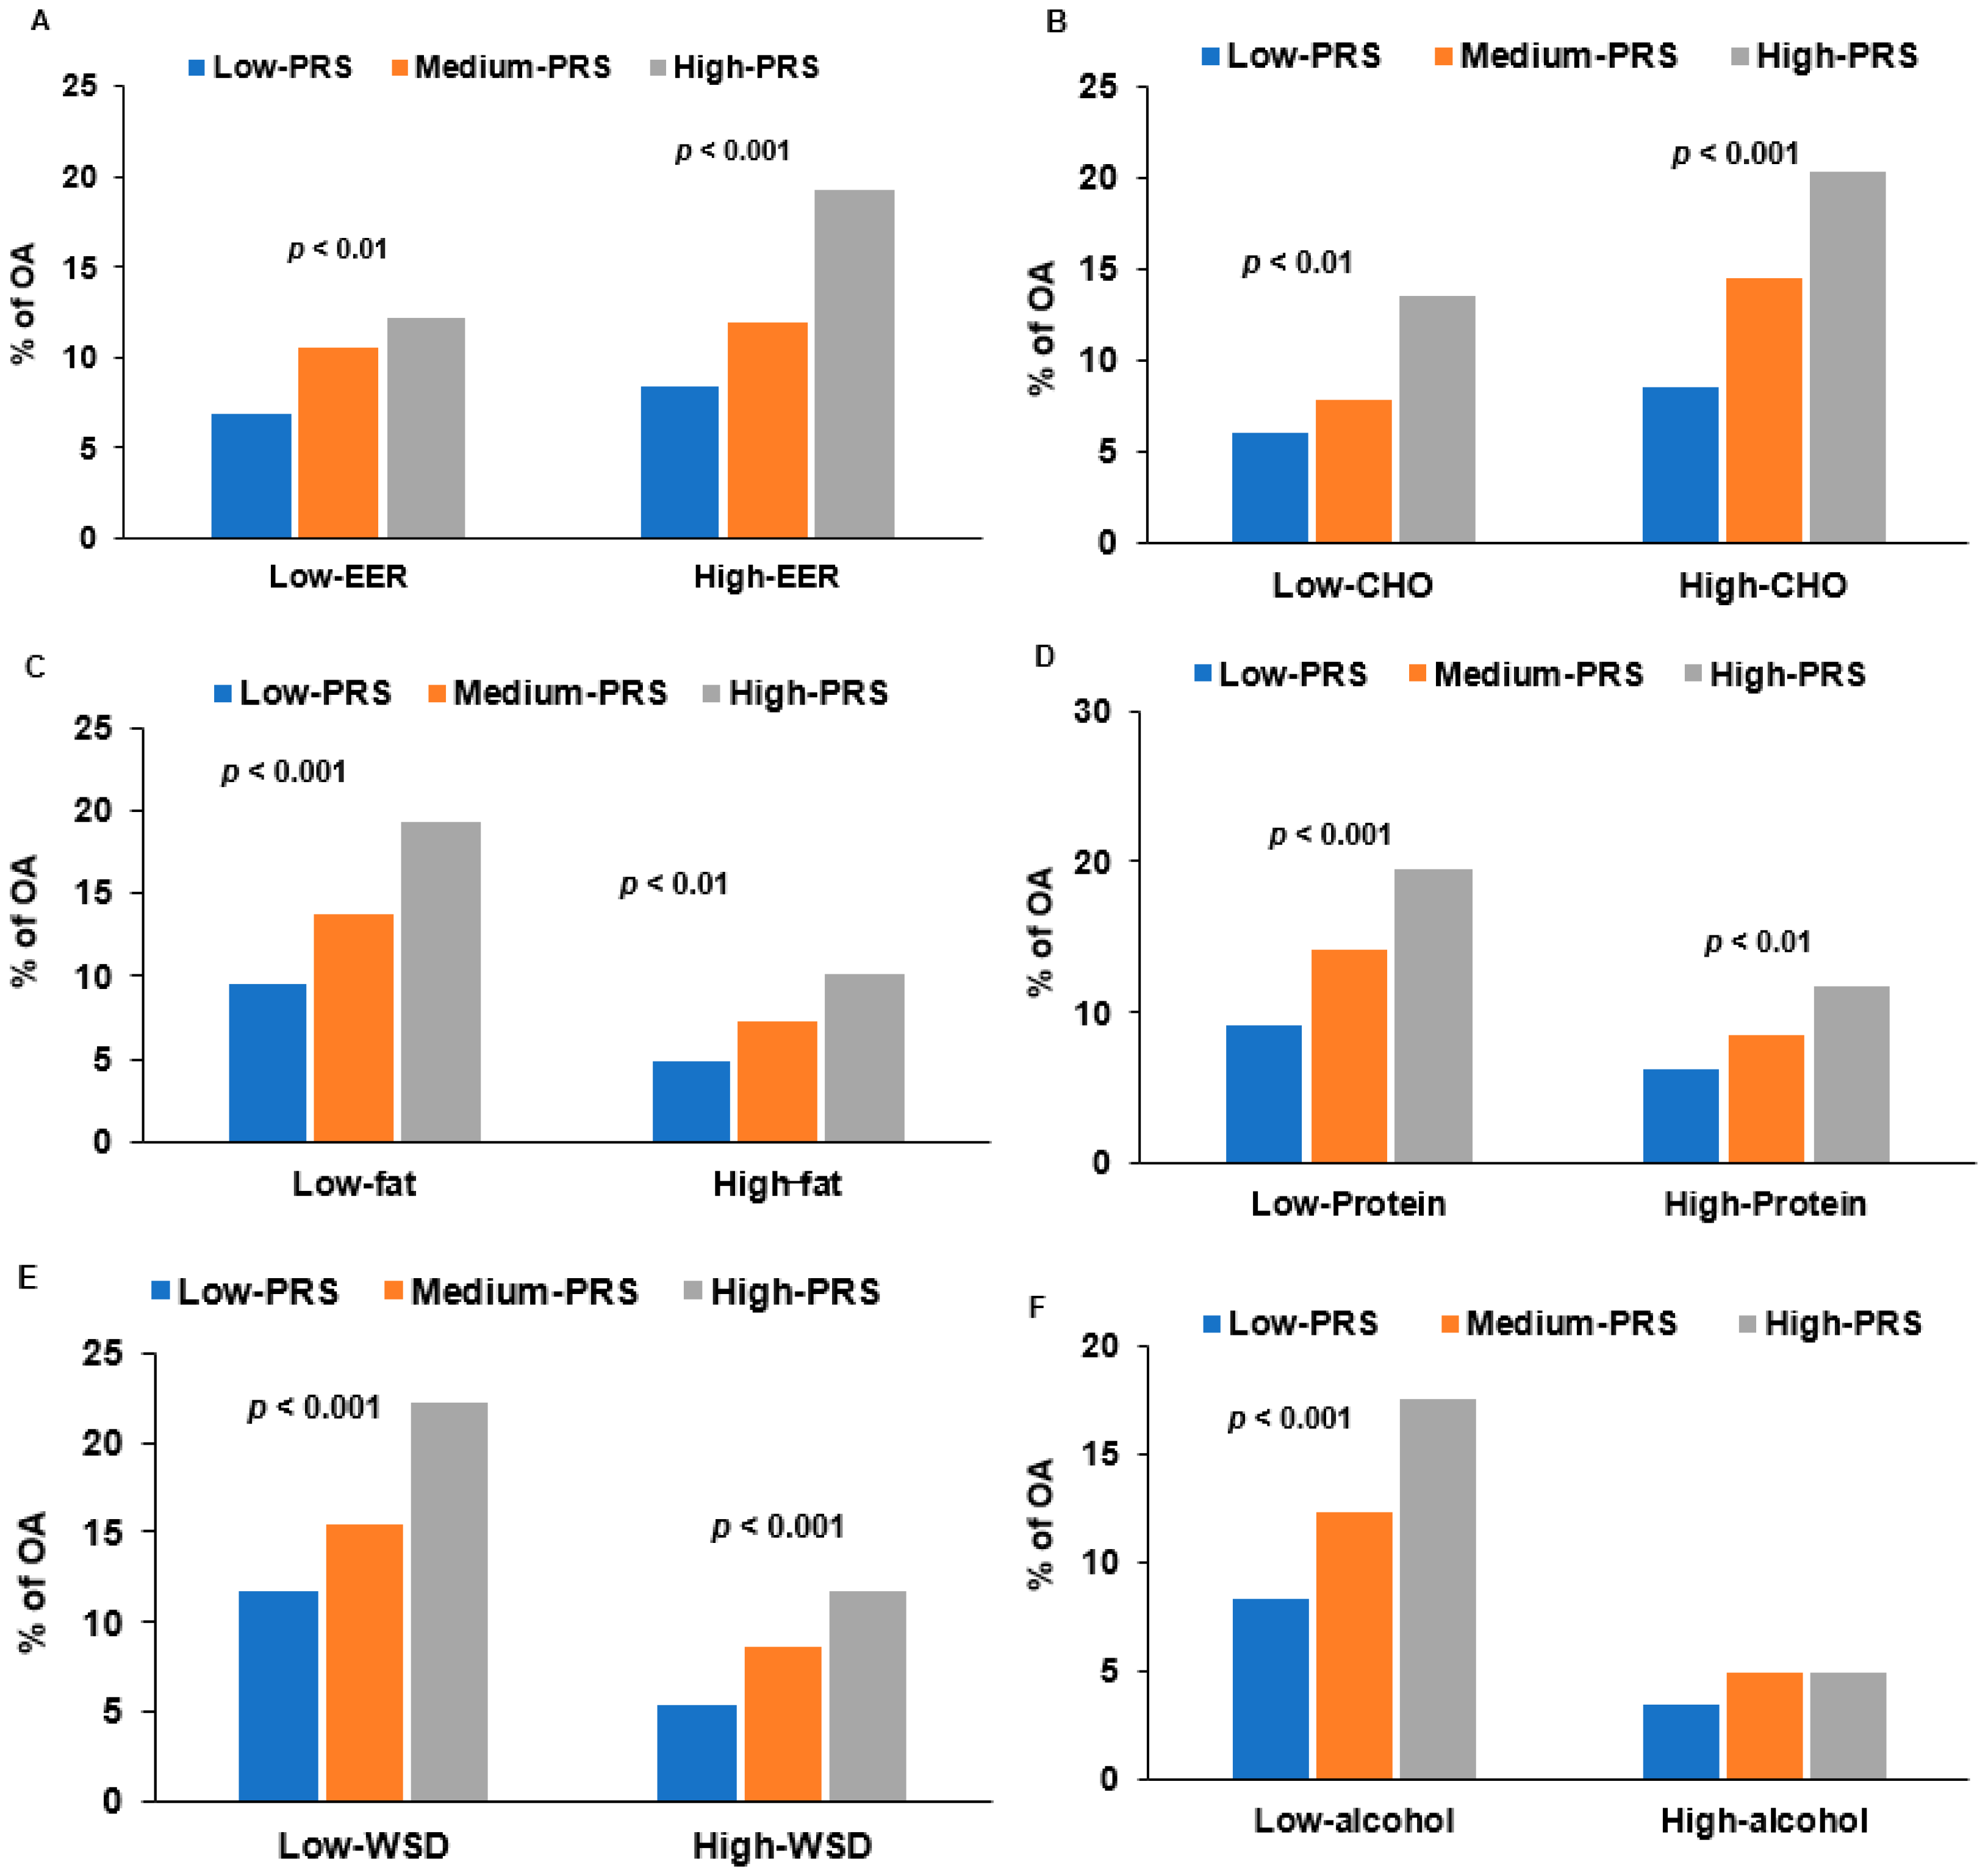
3.5. Interaction of PRS and Nutrient Intake in OA Risk
4. Discussion
Supplementary Materials
Funding
Institutional Review Board Statement
Informed Consent Statement
Data Availability Statement
Conflicts of Interest
References
- Fransen, M.; Bridgett, L.; March, L.; Hoy, D.; Penserga, E.; Brooks, P. The epidemiology of osteoarthritis in Asia. Int. J. Rheum. Dis. 2011, 14, 113–121. [Google Scholar] [CrossRef] [PubMed]
- Yucesoy, B.; Charles, L.E.; Baker, B.; Burchfiel, C.M. Occupational and genetic risk factors for osteoarthritis: A review. Work 2015, 50, 261–273. [Google Scholar] [CrossRef] [PubMed] [Green Version]
- Alissa, E.M.; Alzughaibi, L.S.; Marzouki, Z.M. Dietary intake of fatty acids and antioxidants in relation to radiographic knee osteoarthritis: Results from a case-control study. J. Hum. Nutr. Diet 2020, 33, 431–438. [Google Scholar] [CrossRef]
- Coskun Benlidayi, I. Diet in osteoarthritis. Rheumatol. Int. 2021, 41, 1699–1700. [Google Scholar] [CrossRef] [PubMed]
- Allen, K.D. Racial and ethnic disparities in osteoarthritis phenotypes. Curr. Opin. Rheumatol. 2010, 22, 528–532. [Google Scholar] [CrossRef] [PubMed]
- Loughlin, J.; Mustafa, Z.; Smith, A.; Irven, C.; Carr, A.J.; Clipsham, K.; Chitnavis, J.; Bloomfield, V.A.; McCartney, M.; Cox, O.; et al. Linkage analysis of chromosome 2q in osteoarthritis. Rheumatology 2000, 39, 377–381. [Google Scholar] [CrossRef] [Green Version]
- Xu, P.; Yao, J.; Hou, W. Relationships between COL2A1 gene polymorphisms and knee osteoarthritis in Han Chinese women. Mol. Biol Rep. 2011, 38, 2377–2381. [Google Scholar] [CrossRef]
- De Sire, A.; de Sire, R.; Petito, V.; Masi, L.; Cisari, C.; Gasbarrini, A.; Scaldaferri, F.; Invernizzi, M. Gut-joint axis: The role of physical exercise on gut microbiota modulation in older people with osteoarthritis. Nutrients 2020, 12, 574. [Google Scholar] [CrossRef] [Green Version]
- Hong, K.W.; Oh, B. Recapitulation of genome-wide association studies on body mass index in the Korean population. Int. J. Obes. 2012, 36, 1127–1130. [Google Scholar] [CrossRef] [Green Version]
- Bedogni, G.; Malavolti, M.; Severi, S.; Poli, M.; Mussi, C.; Fantuzzi, A.L.; Battistini, N. Accuracy of an eight-point tactile-electrode impedance method in the assessment of total body water. Eur. J. Clin. Nutr. 2002, 56, 1143–1148. [Google Scholar] [CrossRef] [Green Version]
- Park, S.; Ahn, J.; Lee, B.K. Self-rated subjective health status is strongly associated with sociodemographic factors, lifestyle, nutrient intakes, and biochemical indices, but not smoking status: KNHANES 2007–2012. J. Korean Med. Sci. 2015, 30, 1279–1287. [Google Scholar] [CrossRef] [PubMed] [Green Version]
- Kim, Y.; Han, B.G. Cohort profile: The Korean genome and epidemiology study (KoGES) consortium. Int. J. Epidemiol. 2017, 46, 1350. [Google Scholar] [CrossRef] [PubMed]
- Seo, M.H.; Lee, W.-Y.; Kim, S.S.; Kang, J.-H.; Kang, J.-H.; Kim, K.K.; Kim, B.-Y.; Kim, Y.-H.; Kim, W.-J.; Kim, E.M.; et al. 2018 Korean society for the study of obesity guideline for the management of obesity in Korea. J. Obes. Metab. Syndr. 2019, 28, 40–45. [Google Scholar] [CrossRef] [PubMed]
- Ahn, Y.; Kwon, E.; Shim, J.E.; Park, M.K.; Joo, Y.; Kimm, K.; Park, C.; Kim, D.H. Validation and reproducibility of food frequency questionnaire for Korean genome epidemiologic study. Eur. J. Clin. Nutr. 2007, 61, 1435–1441. [Google Scholar] [CrossRef] [PubMed]
- Ahn, Y.L.J.; Cho, N.H.; Shin, C.; Park, C.; Oh, B.S.; Kimm, K. Validation and calibration of semi-quantitative food frequency questionnaire—With participants of the Korean health and genome study. Korean J. Community Nutr. 2004, 9, 173–182. [Google Scholar]
- Paik, H.Y. Dietary reference intakes for Koreans (KDRIs). Asia Pac. J. Clin. Nutr. 2008, 17 (Suppl. 2), 416–419. [Google Scholar]
- Park, S.; Kang, S. A Western-style diet interacts with genetic variants of the LDL receptor to hyper-LDL cholesterolemia in Korean adults. Public Health Nutr. 2020, 24, 2964–2974. [Google Scholar] [CrossRef]
- Rabbee, N.; Speed, T.P. A genotype calling algorithm for affymetrix SNP arrays. Bioinformatics 2006, 22, 7–12. [Google Scholar] [CrossRef] [Green Version]
- Uma Jyothi, K.; Reddy, B.M. Gene-gene and gene-environment interactions in the etiology of type 2 diabetes mellitus in the population of Hyderabad, India. Meta Gene 2015, 5, 9–20. [Google Scholar] [CrossRef] [PubMed]
- Khera, A.V.; Chaffin, M.; Wade, K.H.; Zahid, S.; Brancale, J.; Xia, R.; Distefano, M.; Senol-Cosar, O.; Haas, M.E.; Bick, A.; et al. Polygenic prediction of weight and obesity trajectories from birth to adulthood. Cell 2019, 177, 587–596. [Google Scholar] [CrossRef] [Green Version]
- Lewis, C.M.; Vassos, E. Polygenic risk scores: From research tools to clinical instruments. Genome Med. 2020, 12, 44. [Google Scholar] [CrossRef] [PubMed]
- Zhou, J.-Y.; Song, M.Y.; Park, S. Carbohydrate and sodium intake and physical activity interact with genetic risk scores of four genetic variants mainly related to lipid metabolism to modulate metabolic syndrome risk in Korean middle-aged adults. Br. J. Nutr. 2019, 122, 919–927. [Google Scholar] [CrossRef] [PubMed]
- Bateman, J.F. Genetic aspects of osteoarthritis. Semin. Arthritis Rheum. 2005, 34, 15–18. [Google Scholar] [CrossRef] [PubMed]
- Gari, M.A.; AlKaff, M.; Alsehli, H.S.; Dallol, A.; Gari, A.; Abu-Elmagd, M.; Kadam, R.; Abuzinadah, M.F.; Gari, M.; Abuzenadah, A.M.; et al. Identification of novel genetic variations affecting osteoarthritis patients. BMC Med. Genet. 2016, 17, 68. [Google Scholar] [CrossRef] [PubMed] [Green Version]
- Mabey, T.; Honsawek, S. Cytokines as biochemical markers for knee osteoarthritis. World J. Orthoped. 2015, 6, 95–105. [Google Scholar] [CrossRef]
- Tait Wojno, E.D.; Hunter, C.A.; Stumhofer, J.S. The immunobiology of the interleukin-12 family: Room for discovery. Immunity 2019, 50, 851–870. [Google Scholar] [CrossRef]
- Nees, T.A.; Rosshirt, N.; Zhang, J.A.; Reiner, T.; Sorbi, R.; Tripel, E.; Walker, T.; Schiltenwolf, M.; Hagmann, S.; Moradi, B. Synovial cytokines significantly correlate with osteoarthritis-related knee pain and disability: Inflammatory mediators of potential clinical relevance. J. Clin. Med. 2019, 8, 1343. [Google Scholar] [CrossRef] [Green Version]
- Xu, J.; Kang, Y.; Liao, W.-M.; Yu, L. MiR-194 Regulates chondrogenic differentiation of human adipose-derived stem cells by targeting Sox5. PLoS ONE 2012, 7, e31861. [Google Scholar] [CrossRef] [Green Version]
- Diaz, F.; Thomas, C.K.; Garcia, S.; Hernandez, D.; Moraes, C.T. Mice lacking COX10 in skeletal muscle recapitulate the phenotype of progressive mitochondrial myopathies associated with cytochrome c oxidase deficiency. Hum. Mol. Genet. 2005, 14, 2737–2748. [Google Scholar] [CrossRef] [Green Version]
- Parsons, W.H.; Kolar, M.J.; Kamat, S.S.; Iii, A.B.C.; Hulce, J.J.; Saez, E.; Kahn, B.B.; Saghatelian, A.; Cravatt, B.F. AIG1 and ADTRP are atypical integral membrane hydrolases that degrade bioactive FAHFAs. Nat. Chem. Biol. 2016, 12, 367–372. [Google Scholar] [CrossRef] [Green Version]
- Baumbach, L.; Roos, E.M.; Lykkegaard, J.; Thomsen, K.S.; Kristensen, P.L.; Christensen, A.I.; Thorlund, J.B. Patients with osteoarthritis are least likely to receive lifestyle advice compared with patients with diabetes and hypertension: A national health survey study from Denmark. Osteoarthr. Cartil. Open 2020, 2, 100067. [Google Scholar] [CrossRef]
- Valsamidou, E.; Gioxari, A.; Amerikanou, C.; Zoumpoulakis, P.; Skarpas, G.; Kaliora, A.C. Dietary interventions with polyphenols in osteoarthritis: A systematic review directed from the preclinical data to randomized clinical studies. Nutrients 2021, 13, 1420. [Google Scholar] [CrossRef] [PubMed]
- Park, S.; Shin, B.K. Intermittent fasting with a high-protein diet mitigated osteoarthritis symptoms by increasing lean body mass and reducing inflammation in osteoarthritic rats with Alzheimer’s disease-like dementia. Br. J. Nutr. 2021, 127, 55–67. [Google Scholar] [CrossRef] [PubMed]
- Daily, J.W.; Yang, M.; Park, S. Efficacy of turmeric extracts and curcumin for alleviating the symptoms of joint arthritis: A systematic review and meta-analysis of randomized clinical trials. J. Med. Food 2016, 19, 717–729. [Google Scholar] [CrossRef] [PubMed] [Green Version]
- Kuszewski, J.C.; Wong, R.H.X.; Howe, P.R.C. Fish oil supplementation reduces osteoarthritis-specific pain in older adults with overweight/obesity. Rheumatol. Adv. Pract. 2020, 4, rkaa036. [Google Scholar] [CrossRef]
- MacFarlane, L.A.; Cook, N.R.; Kim, E.; Lee, I.M.; Iversen, M.D.; Gordon, D.; Buring, J.E.; Katz, J.N.; Manson, J.E.; Costenbader, K.H. The effects of vitamin D and marine omega-3 fatty acid supplementation on chronic knee pain in older US adults: Results from a randomized trial. Arthritis Rheumatol. 2020, 72, 1836–1844. [Google Scholar] [CrossRef] [PubMed]

| Control (n = 4850) | Osteoarthritis (n = 580) | Adjusted ORs and 95% CI | |
|---|---|---|---|
| Age (<55 yr) | 51.1 ± 0.10 1 | 54.7 ± 0.32 *** | 2.501 (1.989~3.144) |
| <45 | 1428 (96.8) | 48 (3.25) *** | 1 |
| 45–54 | 1826 (92.0) | 158 (7.96) | 2.388 (1.663~3.427) |
| 55–64 | 1176 (82.4) | 251 (17.6) | 4.344 (2.983~6.326) |
| ≥65 | 420 (8.66) | 123 (22.6) | 6.415 (4.203~9.790) |
| Sex (N, %; males) | 2476 (51.1) | 113 (19.5) *** | 3.198 (2.257~4.531) |
| Osteoarthritis duration (yrs) | 0 ± 0 | 9.98 ± 0.39 | |
| Height (cm) | 160.3 ± 0.08 | 160.4 ± 0.24 | 1.098 (0.805~1.498) |
| BMI (<25 kg/m2) | 24.5 ± 0.05 | 25.4 ± 0.14 *** | 1.488 (1.180~1.876) |
| Waist circumferences (M: <90 cm; F: <85 cm) | 82.2 ± 0.12 | 84.6 ± 0.37 *** | 1.372 (1.106~1.703) |
| Lean body mass (M: <35%; F: <28%) | 31.1 ± 0.05 | 31.5 ± 0.12 | 1.148 (0.926~1.424) |
| Fat mass (M: <25%; F: <30%) | 26.5 ± 0.08 | 27.7 ± 0.26 *** | 1.246 (1.005~1.545) |
| Education (N, %) | |||
| ≤Middle school | 2421 (84.3) | 452 (15.7) *** | 1 |
| High school | 1687 (94.4) | 100 (5.60) | 0.711 (0.531~0.951) |
| ≥College | 723 (96.8) | 24 (3.21) | 0.605 (0.376~0.974) |
| Income (N, %) | |||
| ≤$2000 | 1421(81.8) | 316 (18.2) *** | 1 |
| $2000–4000 | 2398 (92.2) | 203 (7.80) | 0.777 (0.621~1.001) |
| >$4000 | 971 (95.3) | 48 (4.71) | 0.690 (0.469~1.015) |
| MetS (N, %) | 908 (16.7) | 173 (29.8) *** | 1.051 (0.814~1.356) |
| Serum glucose (<126 mg/dL) | 87.5 ± 0.30 | 86.7 ± 0.93 | 0.864 (0.659~1.135) |
| Serum insulin (<9.5 IU/L) | 7.48 ± 0.06 | 7.63 ± 0.19 | 0.936 (0.760~1.154) |
| HbA1c (<6.5%) | 5.78 ± 0.01 | 5.72 ± 0.04 | 0.967 (0.717~1.305) |
| HOMA-IR (<1.95) | 1.63 ± 0.02 | 1.65 ± 0.04 | 0.969 (0.772~1.216) |
| HOMA-B (<160) | 149.4 ± 2.09 | 150.9 ± 6.50 | 1.109 (0.905~1.361) |
| Serum total cholesterol (<230 mg/dL) | 192.6 ± 0.51 | 194.4 ± 1.57 | 0.995 (0.762~1.300) |
| Serum HDL (M: <40, F: <50 mg/dL) | 44.7 ± 0.14 | 44.6 ± 0.43 | 0.984 (0.791~1.225) |
| Serum LDL (<130 mg/dL) | 115.6 ± 0.48 | 118.0 ± 1.49 | 1.049 (0.760~1.447) |
| Serum Triglyceride (<150 mg/dL) | 161.7 ± 1.51 | 159.1 ± 4.66 | 1.008 (0.822~1.235) |
| Serum CRP (<0.5 mg/dL) | 0.22 ± 0.01 | 0.21 ± 0.02 | 0.841 (0.451~1.571) |
| SBP (<130 mmHg) | 116.6 ± 0.24 | 117.0 ± 0.73 | 0.908 (0.723~1.140) |
| DBP (<90 mmHg) | 75.0 ± 0.16 | 75.1 ± 0.48 | 1.016 (0.760~1.358) |
| eGFR (<70 mL/min) | 85.4 ± 0.23 | 83.8 ± 0.71 * | 1.021 (0.793~1.314) |
| Serum AST (<40 U/L) | 29.2 ± 0.26 | 28.7 ± 0.81 | 0.880 (0.586~1.322) |
| Serum ALT(<35 U/L) | 28.3 ± 0.45 | 27.8 ± 1.38 | 1.051 (0.791~1.396) |
| Control (n = 4850) | Osteoarthritis (n = 580) | Adjusted ORs and 95% CI | |
|---|---|---|---|
| Energy (<EER%) 1 | 102.7 ± 0.53 2 | 105.4 ± 1.65 | 1.175 (0.966~1.428) 3 |
| Carbohydrates (<70 En%) | 70.8 ± 0.09 | 70.8 ± 0.29 | 1.055 (0.836~1.332) |
| Fiber (<20 g/d) | 21.3 ± 0.18 | 21.7 ± 0.56 | 0.966 (0.771~1.211) |
| Protein (<13 En%) | 13.5 ± 0.03 | 13.6 ± 0.10 | 0.957 (0.775~1.183) |
| Fat (<15 En%) | 14.6 ± 0.07 | 14.5 ± 0.22 | 0.975 (0.772~1.230) |
| Saturated fat (<5.7 En%) | 4.2 ± 0.4 | 4.3 ± 1.1 | 1.045 (0.798~1.368) |
| Monounsaturated fat (<7.0 En%) | 5.4 ± 0.4 | 5.5 ± 1.2 | 0.979 (0.737~1.299) |
| Polyunsaturated fat (<3.5 En%) | 2.6 ± 0.2 | 2.6 ± 0.5 | 0.880 (0.640~1.210) |
| Cholesterol (<250 mg/d) | 177 ± 1.57 | 179 ± 4.85 | 0.936 (0.705~1.243) |
| Vitamin C (<100 mg/d) | 128 ± 1.13 | 126 ± 3.50 | 0.932 (0.701~1.239) |
| Plant-based diet (<70th percentile) | 1588 (32.7) 4 | 211 (36.4) | 1.180 (0.944~1.476) |
| Western-style diet (<70th percentile) | 1691 (34.9) | 113 (19.5) *** | 0.726 (0.550~0.957) |
| Rice-main diet (<70th percentile) | 1623 (33.4) | 173 (29.8) | 1.081 (0.866~1.349) |
| Flavonoids (<70th percentile) | 64.2 ± 0.82 | 61.8 ± 2.56 | 0.965 (0.758~1.228) |
| Alcohol drinking (<20 g/d) | 9.85 ± 0.29 | 10.2 ± 0.90 | 1.061 (0.702~1.602) |
| Smoking (current smokers) | 1220 (25.6) | 58 (10.2) *** | 0.802 (0.501~1.285) |
| Regular exercise (<150 min/week) | 1379 (29.2) | 224 (40.5) *** | 1.212 (0.955~1.538) |
| CHR 1 | SNP 2 | Location | Mi 3 | OR 4 | L95 5 | U95 6 | p-Value for OR 7 | Genes | Feature | MAF 8 | HWE 9 |
|---|---|---|---|---|---|---|---|---|---|---|---|
| 3 | rs149045369 | 129206303 | T | 0.324 | 0.1925 | 0.5449 | 2.16 × 10⁻⁵ | IFT122 | transcript | 0.0526 | 0.786 |
| 3 | rs1491318751 | 159765533 | G | 1.639 | 1.3 | 2.067 | 2.94 × 10⁻⁵ | IL12A | intron | 0.0974 | 1 |
| 6 | rs6913416 | 157454046 | C | 2.559 | 1.659 | 3.947 | 2.14 × 10⁻⁵ | ARID1B | intron | 0.0194 | 1 |
| 6 | rs6570550 | 143480314 | A | 1.572 | 1.338 | 1.847 | 3.73 × 10⁻⁸ | AIG1 | intron | 0.3139 | 0.117 |
| 7 | rs1472529430 | 132018047 | T | 0.602 | 0.4785 | 0.7564 | 1.37 × 10⁻⁵ | PLXNA4 | intron | 0.1802 | 1 |
| 11 | rs148643344 | 85026573 | G | 1.765 | 1.379 | 2.258 | 6.29 × 10⁻⁶ | DLG2 | intron | 0.0771 | 0.128 |
| 12 | rs73283618 | 24112286 | C | 1.419 | 1.214 | 1.658 | 1.05 × 10⁻⁵ | SOX5 | intron | 0.3767 | 0.752 |
| 17 | rs62054459 | 13672047 | T | 0.567 | 0.4626 | 0.6939 | 3.96 × 10⁻⁸ | COX10 | intron | 0.232 | 0.733 |
| 17 | rs138377463 | 43069398 | A | 1.927 | 1.401 | 2.65 | 5.43 × 10⁻⁵ | NMT1 | intron | 0.0434 | 0.518 |
| 20 | rs141079635 | 41491626 | C | 2.077 | 1.482 | 2.912 | 2.18 × 10⁻⁵ | PTPRT | intron | 0.0382 | 0.357 |
| Model 1 | Model 2 | ||||
|---|---|---|---|---|---|
| For 5-SNP Model | Low-PRS (n = 2373) 1 | Medium-PRS (n = 1583) | High-PRS (n = 1474) | Medium-PRS (n = 1583) | High-PRS (n = 1474) |
| Osteoarthritis | 1 | 2.332 2 (1.853~2.935) 2 | 3.708 (2.617~5.254) | 2.381 (1.876~3.021) | 3.887 (2.723~5.548) |
| Rheumatoid arthritis | 1 | 1.309 (0.978~1.752) | 1.807 (1.128~2.894) | 1.316 (0.961~1.801) | 2.041 (1.258~3.311) |
| Metabolic syndrome | 1 | 0.908 (0.773~1.067) | 0.910 (0.679~1.218) | 0.886 (0.744~1.055) | 0.855 (0.624~1.169) |
| HOMA-IR | 1 | 1.063 (0.945~1.196) | 1.028 (0.829~1.274) | 1.080 (0.952~1.225) | 1.030 (0.821~1.293) |
| For 6-SNP model | Low-PRS (n = 2100) 3 | Medium~PRS (n = 2658) | High~PRS (n = 672) | Medium~PRS (n = 2658) | High~PRS (n = 672) |
| Osteoarthritis | 1 | 2.062 (1.619~2.626) | 4.165 (3.051~5.687) | 2.087 (1.624~2.681) | 4.422 (3.211~6.09) |
| Rheumatoid arthritis | 1 | 1.173 (0.867~1.585) | 1.735 (1.146~2.626) | 1.181 (0.857~1.627) | 1.855 (1.202~2.862) |
| Metabolic syndrome | 1 | 0.912 (0.772~1.078) | 0.841 (0.656~1.078) | 0.879 (0.732~1.056) | 0.802 (0.611~1.053) |
| HOMA-IR | 1 | 1.027 (0.910~1.160) | 0.974 (0.810~1.170) | 1.052 (0.925~1.198) | 0.977 (0.803~1.190) |
| Low-PRS (n = 2373) 1 | Medium-PRS (n = 1583) | High-PRS (n = 1474) | PRS-Nutrient Interaction p-Value 3 | |
|---|---|---|---|---|
| Low energy | 1 | 1.797 (1.290~2.503) 2 | 3.010 (1.937~4.678) | 0.0048 |
| High energy 4 | 1.934 (1.400~2.673) | 5.137 (3.396 ~7.770) | ||
| Low carbohydrate | 1 | 1.631 (1.091~2.439) | 3.567 (2.200~5.785) | 0.0864 |
| High carbohydrate 5 | 1.905 (1.450~2.502) | 3.878 (2.677~5.616) | ||
| Low protein | 1 | 1.979 (1.462~2.678) | 4.201 (2.794~6.317) | 0.0367 |
| High protein 6 | 1.619 (1.154~2.272) | 3.385 (2.217~5.168) | ||
| Low fat | 1 | 1.751 (1.343~2.283) | 3.838 (2.682~5.494) | 0.0420 |
| Moderate fat 7 | 2.019 (1.315~3.100) | 3.641 (2.168~6.117) | ||
| Low alcohol | 1 | 1.865 (1.474~2.360) | 4.011 (2.948~5.459) | 0.0207 |
| High alcohol 8 | 1.333 (0.603~2.948) | 2.403 (0.907~6.366) | ||
| Low WSD | 1 | 1.742 (1.249~2.430) | 4.127 (2.784~6.116) | 0.0304 |
| High WSD 9 | 1.949 (1.413~2.690) | 3.776 (2.361~6.039) | ||
| Low PBD | 1 | 2.244 (1.478~3.409) | 4.103 (2.362~7.128) | 0.5343 |
| High PBD 10 | 1.729 (1.309~2.282) | 3.855 (2.698~5.508) | ||
| Low RMD | 1 | 1.555 (1.070~2.261) | 3.817 (2.350~6.198) | 0.0591 |
| High RMD 11 | 2.079 (1.548~2.793) | 4.015 (2.741~5.881) | ||
| Low exercise | 1 | 2.163 (1.601~2.922) | 4.633 (3.167~6.778) | 0.1367 |
| High exercise 12 | 1.484 (1.051~2.096) | 2.904 (1.820~4.635) | ||
| Non-smoker | 1 | 1.882 (1.478~2.395) | 4.583 (3.349~6.270) | 0.1207 |
| Smoker + former smoker | 1.721 (1.363~2.174) | 3.719 (2.735~5.056) |
Publisher’s Note: MDPI stays neutral with regard to jurisdictional claims in published maps and institutional affiliations. |
© 2022 by the author. Licensee MDPI, Basel, Switzerland. This article is an open access article distributed under the terms and conditions of the Creative Commons Attribution (CC BY) license (https://creativecommons.org/licenses/by/4.0/).
Share and Cite
Park, S. Polygenetic Variants Related to Osteoarthritis Risk and Their Interactions with Energy, Protein, Fat, and Alcohol Intake in Adults in a Large Cohort. Diagnostics 2022, 12, 340. https://doi.org/10.3390/diagnostics12020340
Park S. Polygenetic Variants Related to Osteoarthritis Risk and Their Interactions with Energy, Protein, Fat, and Alcohol Intake in Adults in a Large Cohort. Diagnostics. 2022; 12(2):340. https://doi.org/10.3390/diagnostics12020340
Chicago/Turabian StylePark, Sunmin. 2022. "Polygenetic Variants Related to Osteoarthritis Risk and Their Interactions with Energy, Protein, Fat, and Alcohol Intake in Adults in a Large Cohort" Diagnostics 12, no. 2: 340. https://doi.org/10.3390/diagnostics12020340
APA StylePark, S. (2022). Polygenetic Variants Related to Osteoarthritis Risk and Their Interactions with Energy, Protein, Fat, and Alcohol Intake in Adults in a Large Cohort. Diagnostics, 12(2), 340. https://doi.org/10.3390/diagnostics12020340