
A Comparative Study of the Triglycerides/HDL Ratio and Pseudocholinesterase Levels in Patients with Bladder Cancer

 , , , ,
  ,
,  ,
,  ,
,  ,
, 
Abstract
:1. Introduction
2. Methods
2.1. Study Design and Data Source
2.2. Bladder Cancer Pathology
2.3. Metabolic Assessment at Entry
2.4. Diagnosis of Systemic Arterial Hypertension
2.5. Laboratory Data
2.6. Statistics
3. Results
3.1. Prevalence
3.2. Behaviour of the Principal Parameters According to Their Numerosity
3.3. Predictions by the “Index” Parameters
3.4. Discriminant Analysis of the Presence of Bladder Cancer
4. Discussion
5. Limitations
6. Conclusions
7. Future Directions
Supplementary Materials
Author Contributions
Funding
Informed Consent Statement
Data Availability Statement
Conflicts of Interest
References
- Nagase, K.; Tobu, S.; Kusano, S.; Takahara, K.; Udo, K.; Noguchi, M. The Association between Metabolic Syndrome and High-Stage Primary Urothelial Carcinoma of the Bladder. Curr. Urol. 2018, 12, 39–42. [Google Scholar] [CrossRef] [PubMed]
- Tang, C.; Yu, M.; Ma, J.; Zhu, Y. Metabolic classification of bladder cancer based on multi-omics integrated analysis to predict patient prognosis and treatment response. J. Transl. Med. 2021, 19, 1–15. [Google Scholar] [CrossRef] [PubMed]
- Snaebjornsson, M.T.; Janaki-Raman, S.; Schulze, A. Greasing the Wheels of the Cancer Machine: The Role of Lipid Metabolism in Cancer. Cell Metab. 2020, 31, 62–76. [Google Scholar] [CrossRef] [PubMed]
- Zhao, Y.-Y.; Miao, H.; Cheng, X.-L.; Wei, F. Lipidomics: Novel insight into the biochemical mechanism of lipid metabolism and dysregulation-associated disease. Chem. Interact. 2015, 240, 220–238. [Google Scholar] [CrossRef]
- Fernández, L.P.; Gómez de Cedrón, M.; Ramírez de Molina, A. Alterations of Lipid Metabolism in Cancer: Implications in Prognosis and Treatment. Front. Oncol. 2020, 10, 577420. [Google Scholar] [CrossRef]
- Massari, F.; Ciccarese, C.; Santoni, M.; Iacovelli, R.; Mazzucchelli, R.; Piva, F.; Scarpelli, M.; Berardi, R.; Tortora, G.; Lopez-Beltran, A.; et al. Metabolic phenotype of bladder cancer. Cancer Treat. Rev. 2016, 45, 46–57. [Google Scholar] [CrossRef]
- Gaziano, J.M.; Hennekens, C.H.; O’Donnell, C.J.; Breslow, J.L.; Buring, J.E. Fasting Triglycerides, High-Density Lipoprotein, and Risk of Myocardial Infarction. Circulation 1997, 96, 2520–2525. [Google Scholar] [CrossRef]
- Dai, D.; Chen, B.; Wang, B.; Tang, H.; Li, X.; Zhao, Z.; Li, X.; Xie, X.; Wei, W. Pretreatment TG/HDL-C Ratio Is Superior to Triacylglycerol Level as an Independent Prognostic Factor for the Survival of Triple Negative Breast Cancer Patients. J. Cancer 2016, 7, 1747–1754. [Google Scholar] [CrossRef] [Green Version]
- Luo, Y.; Yang, Z.; Qiu, Y.; Li, X.; Qin, L.; Su, Q.; Mo, W. Pretreatment triglycerides-to-high density lipoprotein cholesterol ratio in postmenopausal women with endometrial cancer. Kaohsiung J. Med. Sci. 2019, 35, 303–309. [Google Scholar] [CrossRef] [Green Version]
- Sun, H.; Huang, X.; Wang, Z.; Zhang, G.; Mei, Y.; Wang, Y.; Nie, Z.; Wang, S. Triglyceride-to-high density lipoprotein cholesterol ratio predicts clinical outcomes in patients with gastric cancer. J. Cancer 2019, 10, 6829–6836. [Google Scholar] [CrossRef]
- Popović, L.; Oresković, K.; Zupancić, B.; Petrunić, M.; Kunec-Vajić, E. The relation between plasma lipid levels and pseudo-cholinesterase activity in hypothyroidism. Horm. Metab. Res. 1998, 30, 137–140. [Google Scholar] [CrossRef]
- Ghooi, A.M.; Malviya, G.M.; Kashyab, A. A comparative study of LDH and PCHE in sera of cancer patients—Preliminary report. Indian J. Cancer 1980, 17, 31. [Google Scholar]
- Chougule, A.; Hussain, S.; Agarwal, D. Prognostic and diagnostic value of serum pseudocholinesterase, serum aspartate transaminase, and serum alinine transaminase in malignancies treated by radiotherapy. J. Cancer Res. Ther. 2008, 4, 21–25. [Google Scholar] [CrossRef]
- Zhang, B.; Shen, C.; Jin, J.; Song, Y.; Zhao, Z.; Zhang, X.; Wang, G.; Fan, Y.; Mi, Y.; Hu, S.; et al. Pretreatment serum pseudocholinesterase level as a novel prognostic biomarker for upper tract urothelial carcinoma. Int. Urol. Nephrol. 2016, 48, 1993–1999. [Google Scholar] [CrossRef]
- Mitsunaga, S.; Kinoshita, T.; Hasebe, T.; Nakagohri, T.; Konishi, M.; Takahashi, S.; Gotohda, N.; Ochiai, A. Low serum level of cho-linesterase at recurrence of pancreatic cancer is a poor prognostic factor and relates to systemic disorder and nerve plexus invasion. Pancreas 2008, 36, 241–248. [Google Scholar] [CrossRef]
- Bi, Y.; Zhang, J.; Zeng, D.; Chen, L.; Ye, W.; Yang, Q.; Ling, Y. Cholinesterase is Associated with Prognosis and Response to Chem-otherapy in Advanced Gastric Cancer. Pathol. Oncol. Res. 2021, 27, 580800. [Google Scholar] [CrossRef]
- Wei, W.; Wang, M.; Li, Y.; Meng, Q.; Tang, Y.; Lu, H.; Yu, W.; Cheng, Q.; Li, Y.; Xu, L.; et al. Muscarinic cholinergic signaling and overactive bladderlike symptoms associated with invasive bladder cancer. Oncol. Lett. 2018, 16, 775–784. [Google Scholar] [CrossRef] [Green Version]
- Meng, F.; Yin, X.; Ma, X.; Guo, X.-D.; Jin, B.; Li, H. Assessment of the value of serum cholinesterase as a liver function test for cirrhotic patients. Biomed. Rep. 2013, 1, 265–268. [Google Scholar] [CrossRef]
- Kojima, T.; Miyazaki, J.; Nishiyama, H.; Kawai, K. Biomarkers for precision medicine in bladder cancer. Int. J. Clin. Oncol. 2016, 22, 207–213. [Google Scholar] [CrossRef]
- European Association of Urology. Guidelines, 2017 ed.; European Association of Urology: Arnhem, The Netherlands, 2017; Available online: https://uroweb.org/wp-content/uploads/Guidelines_WebVersion_Complete-1.pdf (accessed on 15 October 2021).
- American Cancer Society. Last Updated 30 January 2019. Available online: https://www.cancer.org/latest-news.html (accessed on 15 October 2021).
- Shim, Y.S.; Baek, J.W.; Kang, M.J.; Oh, Y.J.; Yang, S.; Hwang, I.T. Reference Values for The Triglyceride to High-Density Lipoprotein Cholesterol Ratio and Non-High-Density Lipoprotein Cholesterol in Korean Children and Adolescents: The Korean National Health and Nutrition Examination Surveys 2007-2013. J. Atheroscler. Thromb. 2016, 23, 1334–1344. [Google Scholar] [CrossRef] [Green Version]
- Fluss, R.; Faraggi, D.; Reiser, B. Estimation of the Youden Index and its associated cut-off point. Biom. J. 2005, 47, 458–472. [Google Scholar] [CrossRef] [PubMed] [Green Version]
- Bray, F.; Ferlay, J.; Soerjomataram, I.; Siegel, R.L.; Torre, L.A.; Jemal, A. Global cancer statistics 2018: GLOBOCAN estimates of incidence and mortality worldwide for 36 cancers in 185 countries. CA Cancer J. Clin. 2018, 68, 394–424. [Google Scholar] [CrossRef] [PubMed] [Green Version]
- Di Bonito, P.; Valerio, G.; Grugni, G.; Licenziati, M.R.; Maffeis, C.; Manco, M.; Miraglia del Giudice, E.; Pacifico, L.; Pellegrin, M.C.; Tomat, M.; et al. CARdiometabolic risk factors in overweight and obese children in ITALY (CARITALY) Study Group: Com-parison of non-HDL-cholesterol versus triglycerides-to-HDL-cholesterol ratio in relation to cardiometabolic risk factors and preclinical organ damage in overweight/obese children: The CARITALY study. Nutr. Metab. Cardiovasc. Dis. 2015, 25, 489–494. [Google Scholar] [PubMed]
- Giannini, C.; Santoro, N.; Caprio, S.; Kim, G.; Lartaud, D.; Shaw, M.; Pierpont, B.; Weiss, R. The triglyceride-to-HDL cholesterol ratio: Association with insulin resistance in obese youths of different ethnic backgrounds. Diabetes Care 2011, 34, 1869–1874. [Google Scholar] [CrossRef] [Green Version]
- Pacifico, L.; Bonci, E.; Andreoli, G.; Romaggioli, S.; Di Miscio, R.; Lombardo, C.; Chiesa, C. Association of serum triglyceride-to-HDL cholesterol ratio with carotid artery intima-media thickness, insulin resistance and nonalcoholic fatty liver disease in children and adolescents. Nutr. Metab. Cardiovasc. Dis. 2014, 24, 737–743. [Google Scholar] [CrossRef]
- Zhou, M.; Zhu, L.; Cui, X.; Feng, L.; Zhao, X.; He, S.; Ping, F.; Li, W.; Li, Y. The triglyceride to high-density lipoprotein cholesterol (TG/HDL-C) ratio as a predictor of insulin resistance but not of β cell function in a Chinese population with different glucose tolerance status. Lipids Health Dis. 2016, 15, 104. [Google Scholar] [CrossRef] [Green Version]
- Karhapää, P.; Malkki, M.; Laakso, M. Isolated low HDL cholesterol. An insulin-resistant state. Diabetes 1994, 43, 411–714. [Google Scholar] [CrossRef]
- Tarantino, G.; Crocetto, F.; Di Vito, C.; Creta, M.; Martino, R.; Pandolfo, S.D.; Pesce, S.; Napolitano, L.; Capone, D.; Imbimbo, C. Association of NAFLD and Insulin Resistance with Non-Metastatic Bladder Cancer Patients: A Cross-Sectional Retrospective Study. J. Clin. Med. 2021, 10, 346. [Google Scholar] [CrossRef]
- Fang, H.; Yao, B.; Yan, Y.; Xu, H.; Liu, Y.; Tang, H.; Zhou, J.; Cao, L.; Wang, W.; Zhang, J.; et al. Diabetes Mellitus Increases the Risk of Bladder Cancer: An Updated Meta-Analysis of Observational Studies. Diabetes Technol. Ther. 2013, 15, 914–922. [Google Scholar] [CrossRef] [Green Version]
- Zhou, M.S.; Schulman, I.H.; Zeng, Q. Link between the renin-angiotensin system and insulin resistance: Implications for cardi-ovascular disease. Vasc. Med. 2012, 17, 330–341. [Google Scholar] [CrossRef]
- Teleka, S.; Hindy, G.; Drake, I.; Poveda, A.; Melander, O.; Liedberg, F.; Orho-Melander, M.; Stocks, T. Blood pressure and bladder cancer risk in men by use of survival analysis and in interaction with NAT2 genotype, and by Mendelian randomization analysis. PLoS ONE 2020, 15, e0241711. [Google Scholar] [CrossRef]
- Kimura, S.; Soria, F.; D’Andrea, D.; Foerster, B.; Abufaraj, M.; Vartolomei, M.D.; Karakiewicz, P.I.; Mathieu, R.; Moschini, M.; Rink, M.; et al. Prognostic Value of Serum Cholinesterase in Non–muscle-invasive Bladder Cancer. Clin. Genitourin. Cancer 2018, 16, e1123–e1132. [Google Scholar] [CrossRef]
- Katoh, S.; Peltonen, M.; Wada, T.; Zeniya, M.; Sakamoto, Y.; Utsunomiya, K.; Tuomilehto, J. Fatty liver and serum cholinesterase are independently correlated with HbA1c levels: Cross-sectional analysis of 5384 people. J. Int. Med. Res. 2014, 42, 542–553. [Google Scholar] [CrossRef]
- Borai, A.; Livingstone, C.; Abdelaal, F.; Bawazeer, A.; Keti, V.; Ferns, G. The relationship between glycosylated haemoglobin (HbA1c) and measures of insulin resistance across a range of glucose to3erance. Scand. J. Clin. Lab. Investig. 2011, 71, 168–172. [Google Scholar] [CrossRef]
- Chen, C.; Zhu, Z.; Mao, Y.; Xu, Y.; Du, J.; Tang, X.; Cao, H. HbA1c may contribute to the development of non-alcoholic fatty liver disease even at normal-range levels. Biosci. Rep. 2020, 40, 20193996. [Google Scholar] [CrossRef] [Green Version]
- Zicha, J.; Kunes, J.; Devynck, M.-A. Abnormalities of membrane function and lipid metabolism in hypertension A review. Am. J. Hypertens. 1999, 12, 315–331. [Google Scholar] [CrossRef]
- Herr, H.W. Transurethral Resection of Muscle-Invasive Bladder Cancer: 10-Year Outcome. J. Clin. Oncol. 2001, 19, 89–93. [Google Scholar] [CrossRef]
- Bada, M.; de Concilio, B.; Crocetto, F.; Creta, M.; Silvestri, T.; di Mauro, M.; Celia, A. Laparoscopic radical cystectomy with extra-corporeal urinary diversion: An Italian single-center experience with 10-year outcomes. Minerva Urol. Nefrol. 2020, 72, 641–643. [Google Scholar] [CrossRef]
- Ferro, M.; La Civita, E.; Liotti, A.; Cennamo, M.; Tortora, F.; Buonerba, C.; Crocetto, F.; Lucarelli, G.; Busetto, G.; Del Giudice, F.; et al. Liquid Biopsy Biomarkers in Urine: A Route towards Molecular Diagnosis and Personalized Medicine of Bladder Cancer. J. Pers. Med. 2021, 11, 237. [Google Scholar] [CrossRef]
- Ferro, M.; Babă, D.-F.; de Cobelli, O.; Musi, G.; Lucarelli, G.; Terracciano, D.; Porreca, A.; Busetto, G.M.; Del Giudice, F.; Soria, F.; et al. Neutrophil percentage-to-albumin ratio predicts mortality in bladder cancer patients treated with neoadjuvant chemotherapy followed by radical cystectomy. Future Sci. OA 2021, 7, FSO709. [Google Scholar] [CrossRef]
- Dobiásová, M.; Frohlich, J. The plasma parameter log (TG/HDL-C) as an atherogenic index: Correlation with lipoprotein particle size and esterification rate in apoB-lipoprotein-depleted plasma (FER(HDL)). Clin. Biochem. 2001, 34, 583–588. [Google Scholar] [CrossRef]
- Virani, S.S. Non-HDL cholesterol as a metric of good quality of care: Opportunities and challenges. Tex. Heart Inst. J. 2011, 38, 160–162. [Google Scholar] [PubMed]
- Enomoto, M.; Adachi, H.; Hirai, Y.; Fukami, A.; Satoh, A.; Otsuka, M.; Kumagae, S.-I.; Nanjo, Y.; Yoshikawa, K.; Esaki, E.; et al. LDL-C/HDL-C Ratio Predicts Carotid Intima-Media Thickness Progression Better Than HDL-C or LDL-C Alone. J. Lipids 2011, 2011, 1–6. [Google Scholar] [CrossRef] [PubMed] [Green Version]
- Cai, G.; Shi, G.; Xue, S.; Lu, W. The atherogenic index of plasma is a strong and independent predictor for coronary artery disease in the Chinese Han population. Medicine 2017, 96, e8058. [Google Scholar] [CrossRef]
- Wu, T.-T.; Gao, Y.; Zheng, Y.-Y.; Ma, Y.-T.; Xie, X. Atherogenic index of plasma (AIP): A novel predictive indicator for the coronary artery disease in postmenopausal women. Lipids Health Dis. 2018, 17, 1–7. [Google Scholar] [CrossRef]


| BCa | Previous BCa | No CaBD | p-Value | |
|---|---|---|---|---|
| Age (years), median (IQR) | 71 (57–73) | 69.5 (64–75) | 66.5 (57–73) | 0.0007 * |
| Gender (M/F), n | 177/31 | 71/17 | 67/33 | 0.001 ** |
| BMI | 26.6 (24.1–29.4) | 27 (24.7–29.2) | 26.7 (24.1–29.4) | 0.65 * |
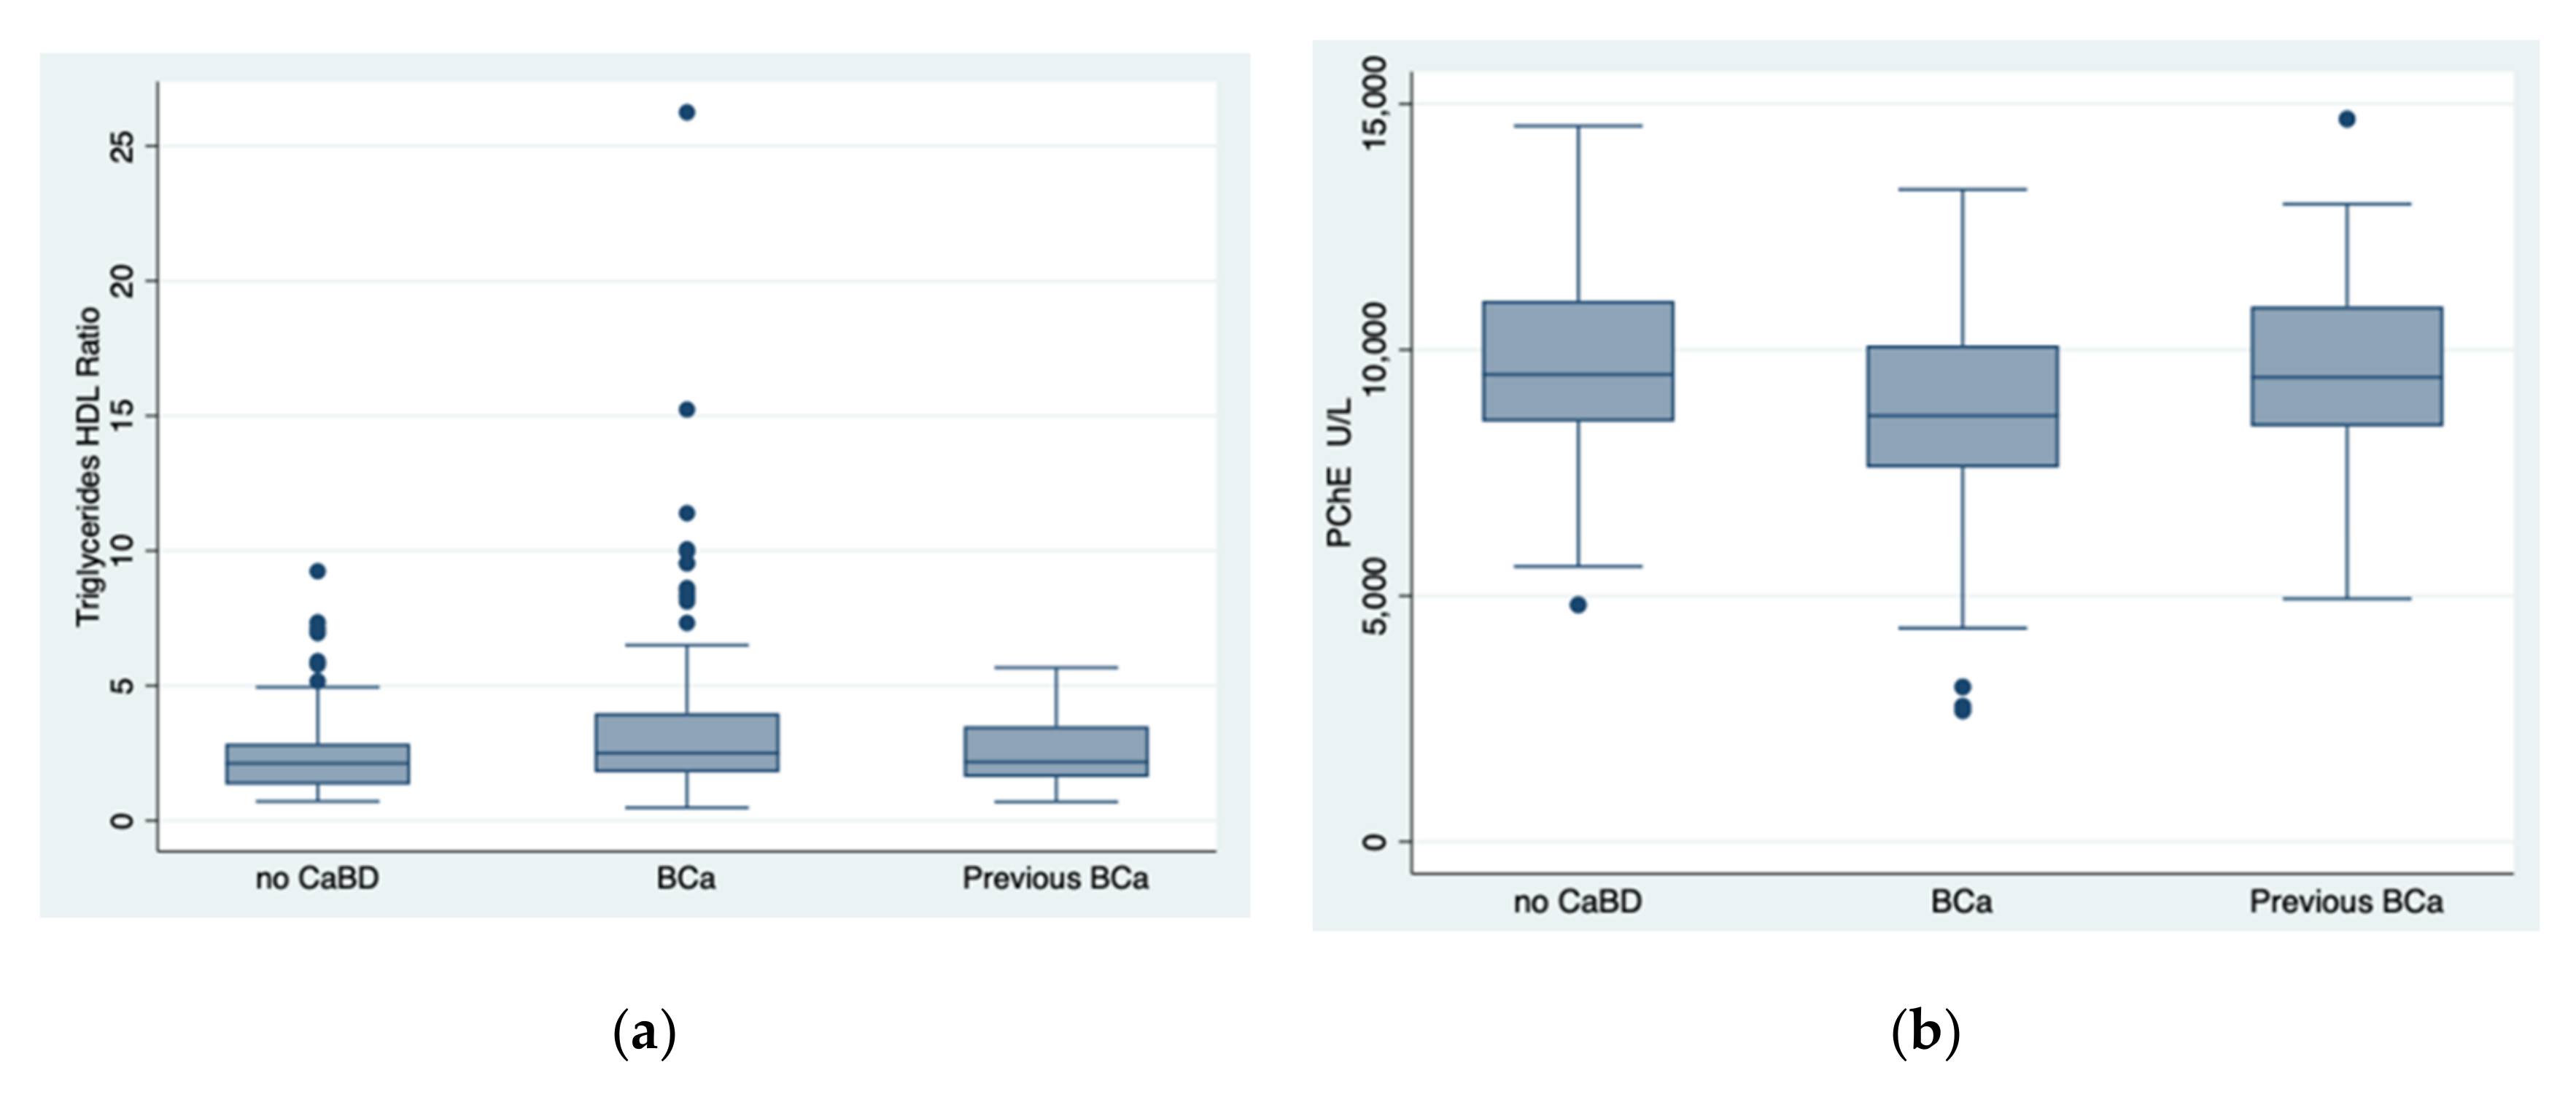
| Triglycerides/HDL Ratio | 2.5 (1.8–4) | 2.1 (1.6–3.5) | 2.1 (1.3–2.8) | 0.023 * |
| PChE (U/L) | 8660 (7605–10,088) | 9440 (8440–10,979) | 9497 (8538–10,993) | 0.0005 * |
| Glucose (mg/dL) | 97 (87–115) | 97 (85–109) | 91.5 (81–108) | 0.15 * |
| Total Cholesterol (mg/dL) | 172.5 (148–203) | 175.5 (152–216) | 185 (160–209) | 0.12 * |
| LDL Cholesterol (mg/dL) | 107 (81–134) | 115.5 (90–150) | 116 (93–138) | 0.11 * |
| HDL Cholesterol (mg/dL) | 42 (36–49) | 47 (37.5–56) | 46 (40–55) | 0.0065 * |
| Triglycerides (mg/dL) | 112 (84–144) | 106.5 (77–140) | 97.5 (75–127.5) | 0.03 * |
| Uric Acid (mg/dL) | 5.8 (4.7–6.8) | 5.5 (4.6–6.8) | 5.3 (4.4–5–9) | 0.046 * |
| Ferritin (ng/mL) | 89 (43–176) | 71.5 (43.5–114) | 83 (35.5–136.5) | 0.28 * |
| Creatinine (mg/dL) | 1 (0.8–1.2) | 0.9 (0.8–1–1) | 0.8 (0.7–1) | 0.0002 * |
| T2DM, n | 50 | 15 | 15 | 0.127 ** |
| Hypertension, n | 131 | 54 | 51 | 0.124 ** |
| GGT (U/L | 20 (15–32) | 19 (16–29) | 22 (15–30) | 0.8 * |
| ALT (U/L) | 18 (13–22) | 17 (12–23) | 18 (13–22) | 0.55 * |
| AST (U/L) | 19 (15–22) | 19 (17–23) | 18 (15–22) | 0.34 * |
| ALP (U/L) | 81 (67–99) | 74 (63–87) | 80 (66–101) | 0.16 * |
| LDH (U/L) | 186 (165–212) | 193 (172–222) | 180 (158–208) | 0.01 * |
| Platelets (103/uL) | 205 (168.5–246.5) | 213 (178.5–230) | 216 (178–266) | 0.16 * |
| d.v. | BCa (Yes/No) | Odds Ratio | Std. Err. | z | p >|z| | 95% CI |
|---|---|---|---|---|---|---|
| i.v. | Triglycerides/HDL Ratio | 1.22022 | 0.0848785 | 2.86 | 0.004 | 1.064706–1.398455 |
| i.v | PChE | 0.9997446 | 0.0000648 | −3.94 | 0.0000 | 0.9996176–9998715 |
| Ordered Probit Regression: Number of Observations = 162, Pseudo R2 = 0.0011 | ||||||
| d.v. | Staging | Coefficient | Std. Err. | Z | p > |z| | 95% CI |
| i.v. | Triglycerides/HDL Ratio | −0.02272 | 0.03165 | −0.72 | 0.47 | 0.08476–0.03930 |
| Ordered Probit Regression: Number of Observations = 174, Pseudo R2 = 0.0274 | ||||||
| d.v. | Staging | Coefficient | Std. Err. | z | p> |z| | 95% CI |
| i.v. | PChE | −0.00015 | 0.00004 | −3.67 | 0.000 | −0.00023–0.00007 |
| Area under the ROC Curve of the TG/HDL Ratio | 0.5878 |
|---|---|
| True | |
| Classified D no D | Total |
| + 97 68 | 165 |
| − 65 75 | 140 |
| Total 162 143 | 305 |
| Sensitivity Pr (+ D) | 59.8% |
| Specificity Pr (− no D) | 52.4% |
| Positive predictive value Pr (D+) | 58.7% |
| Negative predictive value Pr (no D) | 53.5% |
| False positive rate for true no D Pr (+ no D) | 47.5% |
| False negative rate for true D Pr (− D) | 40.1% |
| False positive rate for classified + Pr (no D+) | 41.2% |
| False negative rate for classified − Pr (D−) | 46.4% |
| Correctly classified | 56.3% |
| Cut-Off | Sensitivity | Specificity | Correctly Classified | LR+ | LR− |
|---|---|---|---|---|---|
| <=2.147 | 64.20% | 49.65% | 57.38% | 0.12752 | 0.72 |
Publisher’s Note: MDPI stays neutral with regard to jurisdictional claims in published maps and institutional affiliations. |
© 2022 by the authors. Licensee MDPI, Basel, Switzerland. This article is an open access article distributed under the terms and conditions of the Creative Commons Attribution (CC BY) license (https://creativecommons.org/licenses/by/4.0/).
Share and Cite
Crocetto, F.; Pandolfo, S.D.; Aveta, A.; Martino, R.; Trama, F.; Caputo, V.F.; Barone, B.; Abate, M.; Sicignano, E.; Cilio, S.; et al. A Comparative Study of the Triglycerides/HDL Ratio and Pseudocholinesterase Levels in Patients with Bladder Cancer. Diagnostics 2022, 12, 431. https://doi.org/10.3390/diagnostics12020431
Crocetto F, Pandolfo SD, Aveta A, Martino R, Trama F, Caputo VF, Barone B, Abate M, Sicignano E, Cilio S, et al. A Comparative Study of the Triglycerides/HDL Ratio and Pseudocholinesterase Levels in Patients with Bladder Cancer. Diagnostics. 2022; 12(2):431. https://doi.org/10.3390/diagnostics12020431
Chicago/Turabian StyleCrocetto, Felice, Savio Domenico Pandolfo, Achille Aveta, Raffaele Martino, Francesco Trama, Vincenzo Francesco Caputo, Biagio Barone, Marco Abate, Enrico Sicignano, Simone Cilio, and et al. 2022. "A Comparative Study of the Triglycerides/HDL Ratio and Pseudocholinesterase Levels in Patients with Bladder Cancer" Diagnostics 12, no. 2: 431. https://doi.org/10.3390/diagnostics12020431