Abstract
Purpose: To evaluate the diagnostic performance of ultrasound point shear wave elastography (pSWE) using acoustic radiation force impulse (ARFI) technology in different benign and malignant mesenteric masses (MMs). Methods: A total of 69 patients with MMs diagnosed from September 2018 to November 2021 were included retrospectively in the study. The inclusion criteria were (1) an MM over 1 cm; (2) valid ARFI measurements; and (3) confirmation of the diagnosis of an MM by histological examination and/or clinical and radiological follow-up. To examine the mean ARFI velocities (MAVs) for potential cut-off values between benign and malignant MMs, a receiver operating characteristics analysis was implemented. Results: In total, 37/69 of the MMs were benign (53.6%) and 32/69 malignant (46.4%). Benign MMs demonstrated significantly lower MAVs than mMMs (1.59 ± 0.93 vs. 2.76 ± 1.01 m/s; p < 0.001). Selecting 2.05 m/s as a cut-off value yielded a sensitivity and specificity of 75.0% and 70.3%, respectively, in diagnosing malignant MMs (area under the curve = 0.802, 95% confidence interval 0.699–0.904). Conclusion: ARFI elastography may represent an additional non-invasive tool for differentiating benign from malignant MMs. However, to validate the results of this study, further prospective randomized studies are required.
1. Introduction
The mesentery is a complex, contiguous, membranous peritoneal fold, which starts at the level of the aortic origin of the superior mesenteric artery (known as the root of the mesentery) and then extends in a fan-like fashion toward its insertion at the intestinal border, thus connecting the intestine (from the level of the duodenojejunal junction to the rectum) to the posterior abdominal wall [1]. Several pathologies can affect the mesentery, which could be benign or malignant, solid or cystic, and primary (originating within the mesentery) or secondary. In many cases, the definite diagnosis requires obtaining biopsies or even surgical exploration [1,2]. Many benign mesenteric pathologies (mesenteropathies) present as a mass on imaging, making it difficult to distinguish benign from malignant mesenteropathies [3,4,5,6,7,8].
Computed tomography (CT) is the most widely utilized imaging modality in the diagnosis of mesenteric masses (MMs). In addition, magnetic resonance imaging (MRI), positron emission tomography–computed tomography (PET-CT), and B-mode ultrasound (US) are used for evaluating MMs [2,3,9,10]. As a new trend in US imaging, contrast-enhanced ultrasound (CEUS) is used to assess perfusion patterns of various pathologies, including MMs [11,12,13,14,15,16,17,18,19,20]. Another new trend in US imaging is US elastography, which is a non-invasive tool for assessing tissue stiffness, with guidelines available for hepatic and non-hepatic applications [21,22,23,24,25,26]. Acoustic radiation force impulse (ARFI) is a type of point shear wave elastography (pSWE) that depends on the differences of acoustic wave propagation velocity in different tissues, determined by measuring the degree of displacement within a 0.5 to 1.0 cm box on the US screen, known as the “region of interest” (ROI) [27]. In 2019, the European Federation for Ultrasound in Medicine and Biology (EFSUMB) published guidelines on the use of elastography in non-hepatic organs [21]. However, to date, no guidance for the use of ARFI elastography in the mesentery is currently available.
The aim of this study was to evaluate the feasibility and diagnostic performance of US ARFI elastography as a quantitative, non-invasive method for characterizing MMs of various etiologies.
2. Materials and Methods
This study included 80 consecutive patients with MMs detected on B-mode US between September 2018 and November 2021, who underwent an elastographic evaluation (ARFI) at our tertiary healthcare facility (university hospital). This study was approved by the local ethics committee (protocol code: EK_MR_09_04_20_görg_2) and conducted in accordance with the amended Declaration of Helsinki. Informed consent for the US examination was obtained from each patient.
The inclusion criteria were (1) an MM over 1 cm; (2) valid ARFI measurements; and (3) confirmation of the diagnosis of an MM by histological examination and/or clinical and radiological follow-up. In total, 11/80 patients (13.8%) with an MM were excluded due to the absence of diagnostic confirmation. Finally, data from 69 MMs were analyzed retrospectively.
2.1. Ultrasound Examinations
All US and ARFI elastographic examinations were performed using a Siemens Acuson S2000, Acuson S3000, and Acuson Sequoia (Siemens Medical Solutions, Erlangen, Germany) by a German Society for Ultrasound in Medicine (DEGUM) Level III-qualified examiner (C.G., internal medicine) with more than 35 years of US experience [28]. With the patient lying supine, the curved linear-array transducer (6C1) was placed on the abdomen, and the whole mesentery was examined systematically for suspected areas. Focus and gain were adjusted as needed. The transducer was placed gently on the abdomen where the mesenteric thickening or mass could be easily visualized, and the depth was adjusted, bringing the mesentery to the center of the screen. Both the echogenicity (hypoechoic, isoechoic) and size of the MM (largest diameter in cm) were evaluated on B-mode US.
2.2. Acoustic Radiation Force Impulse Examinations
The ROI (dimensions = 10 × 5 mm) was positioned on the US screen completely within the MM. For each measurement, the patient was asked to hold their breath in mid-expiration for at least 6 s. The measurement was displayed as velocity (m/s) on the upper corner of the screen. If the lesion moved while being measured, this single reading “shot” was considered invalid and was repeated. In the event of air superimposition, the patient was positioned carefully to enable an adequate measurement to be made. A total of 11 valid measurements were obtained for each ARFI study [29,30]. Both the depth of the measurement and the mean ARFI velocities (MAVs) were registered. In the case of measurements at different depths within the lesion, an average depth was calculated.
2.3. Statistical Analysis
Demographic and biometric data were expressed as mean values ± standard deviations (SDs). Statistical evaluation was performed on the categorical variable using Fisher’s exact test and on the continuous data using Mann–Whitney tests. The diagnostic performance was assessed using receiver operating characteristics (ROC) curves. Cut-offs between groups were examined for accuracy using the area under the ROC curve (AUROC) and the 95% confidence interval (CI). A p-value of <0.05 was defined as significant. The statistical analyses were performed using Excel (Microsoft 365 MSO; Microsoft Corporation, Redmond, WA, USA) and SPSS Version 26.0 statistics software (IBM, Armonk, NY, USA).
3. Results
3.1. Demographic and Clinical Data
Of the 69 study patients, 51 (73.9%) were male and 18 (26.1%) female. The mean age was 62 ± 14 years (range 21–91). The mean body mass index (BMI) was 27.4 ± 5.5 kg/m2 (range 13.9–45.1). The final diagnosis was malignant mesenteric mass (mMM) in 32/69 cases (46.4%) and benign mesenteric mass (bMM) in 37/69 cases (53.6%). An overview of all diagnostic entities is shown in Table 1.

Table 1.
Overview of all diagnostic entities in the study sample (n = 69).
In 28/32 cases (87.5%), the diagnosis of an mMM was confirmed by histological examination of the MM. In the other 4/32 cases (12.5%), the diagnosis of an mMM was confirmed by radiological examinations of the mMM and a histological examination of a distant metastasis.
Of the 37 bMMs, in a total of 17 cases (45.9%) the diagnosis of a bMM was confirmed by histological examination of the MM. In the remaining 20/37 cases (54.1%), the diagnosis of a benign lesion was confirmed based on clinical follow-up and/or a cross-sectional imaging (CT or MRI).
3.2. B-Mode Ultrasound Data
Malignant mesenteric masses were hypoechoic in 29/32 cases (90.6%) and isoechoic in 3/32 cases (9.4%), whereas bMMs were hypoechoic in 11/37 cases (29.7%) and isoechoic in 26/37 cases (70.3%). Hypoechoic MMs were significantly more frequently associated with malignancy compared to isoechoic MMs (p < 0.001, Fisher’s exact test). The mean size of all 69 MMs was 6.34 ± 3.93 cm (range 1.5–22.0 cm); the size did not differ significantly between bMMs (5.35 ± 2.40 cm) and mMMs (7.48 ± 4.98 cm; p = 0.15, Mann–Whitney test).
3.3. Acoustic Radiation Force Impulse Examinations
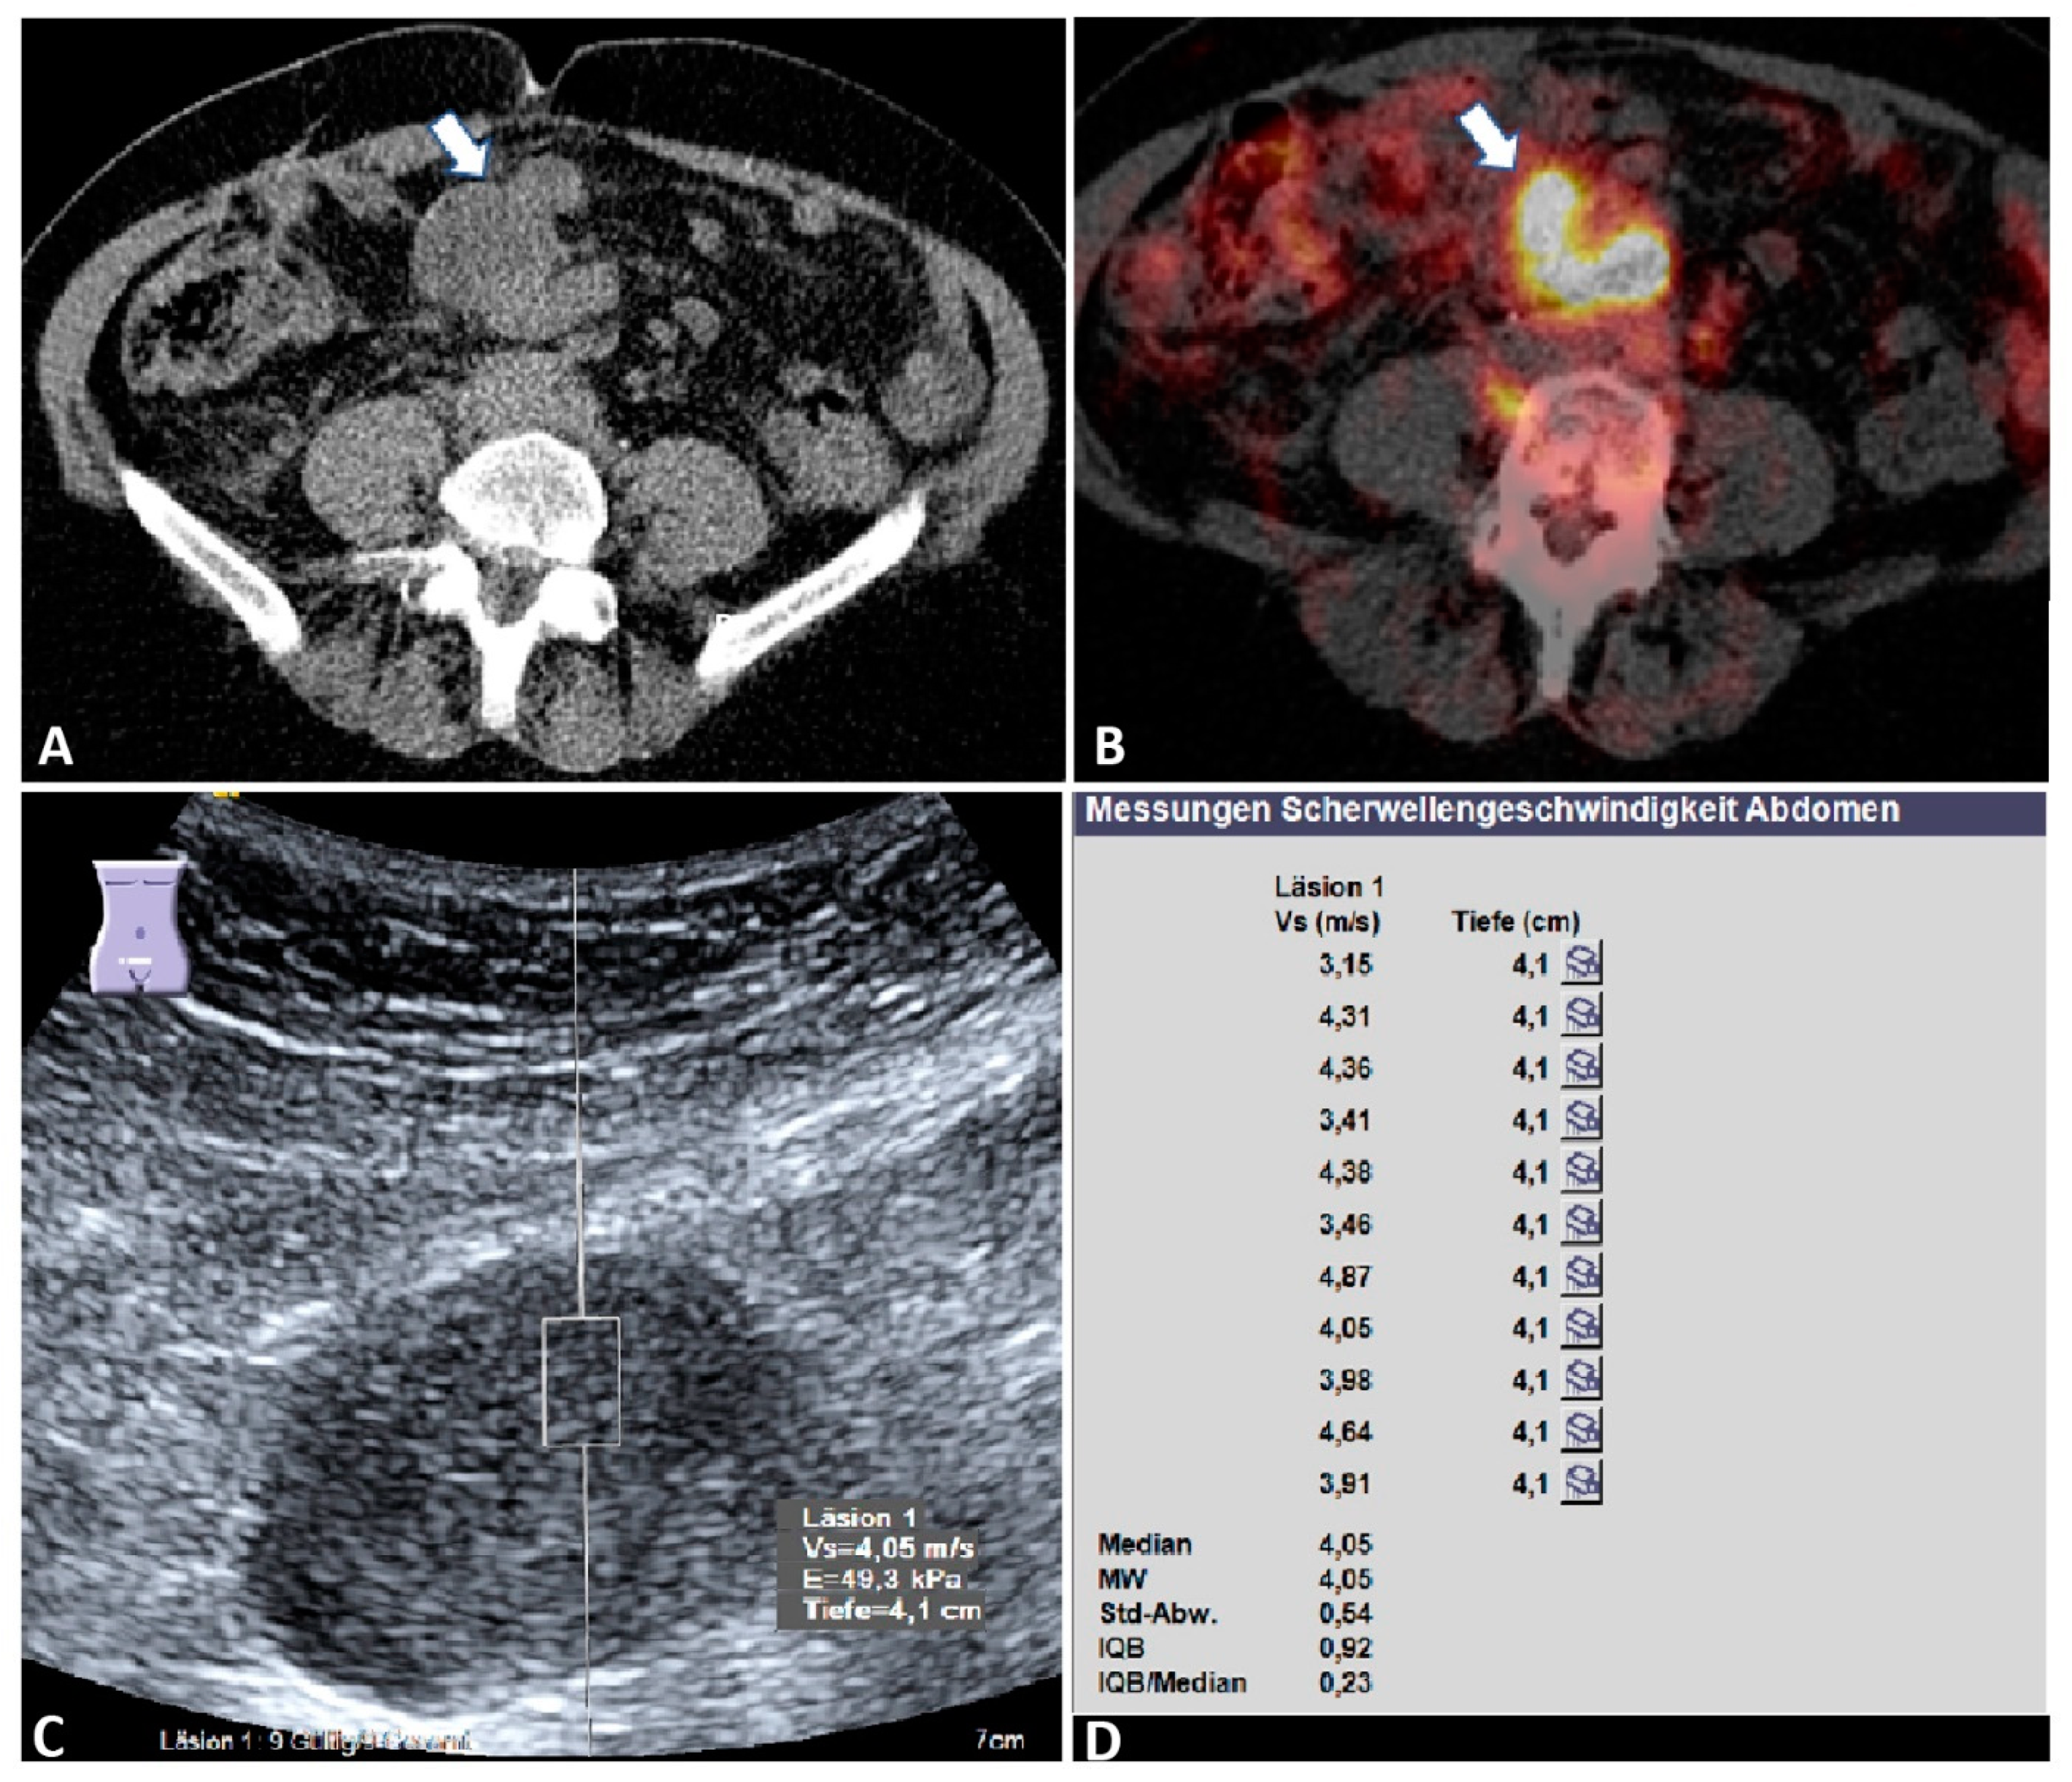
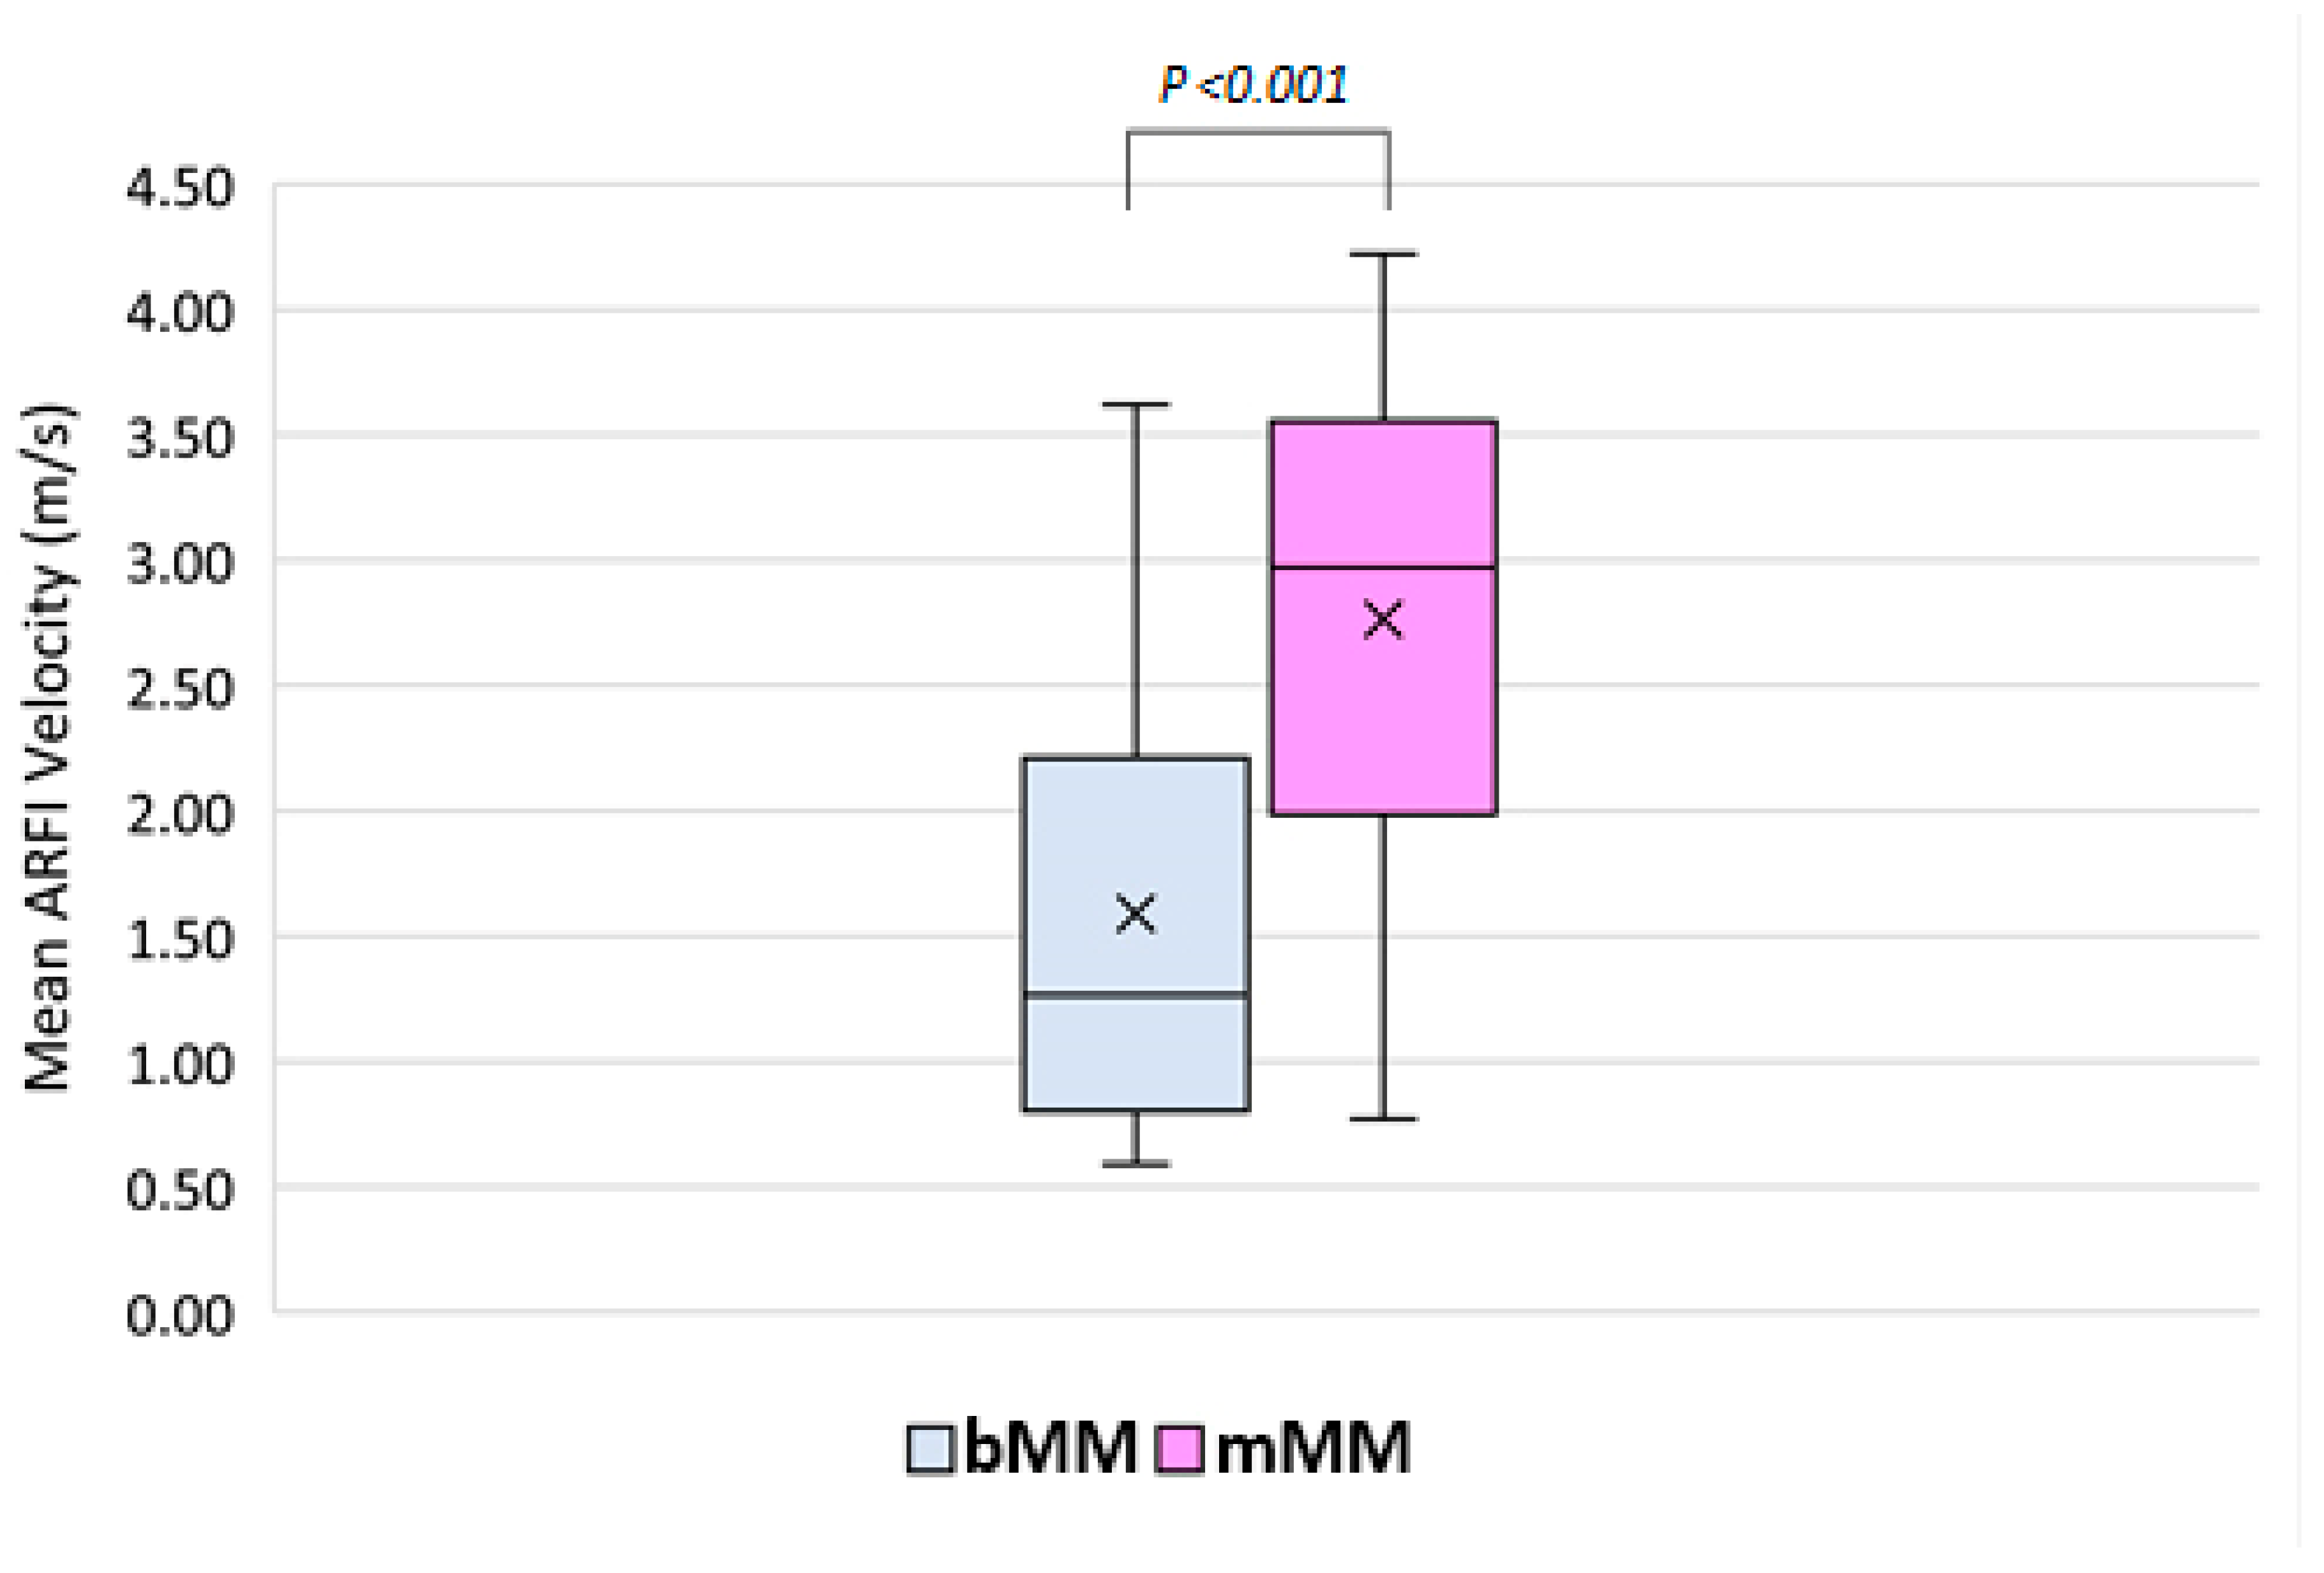
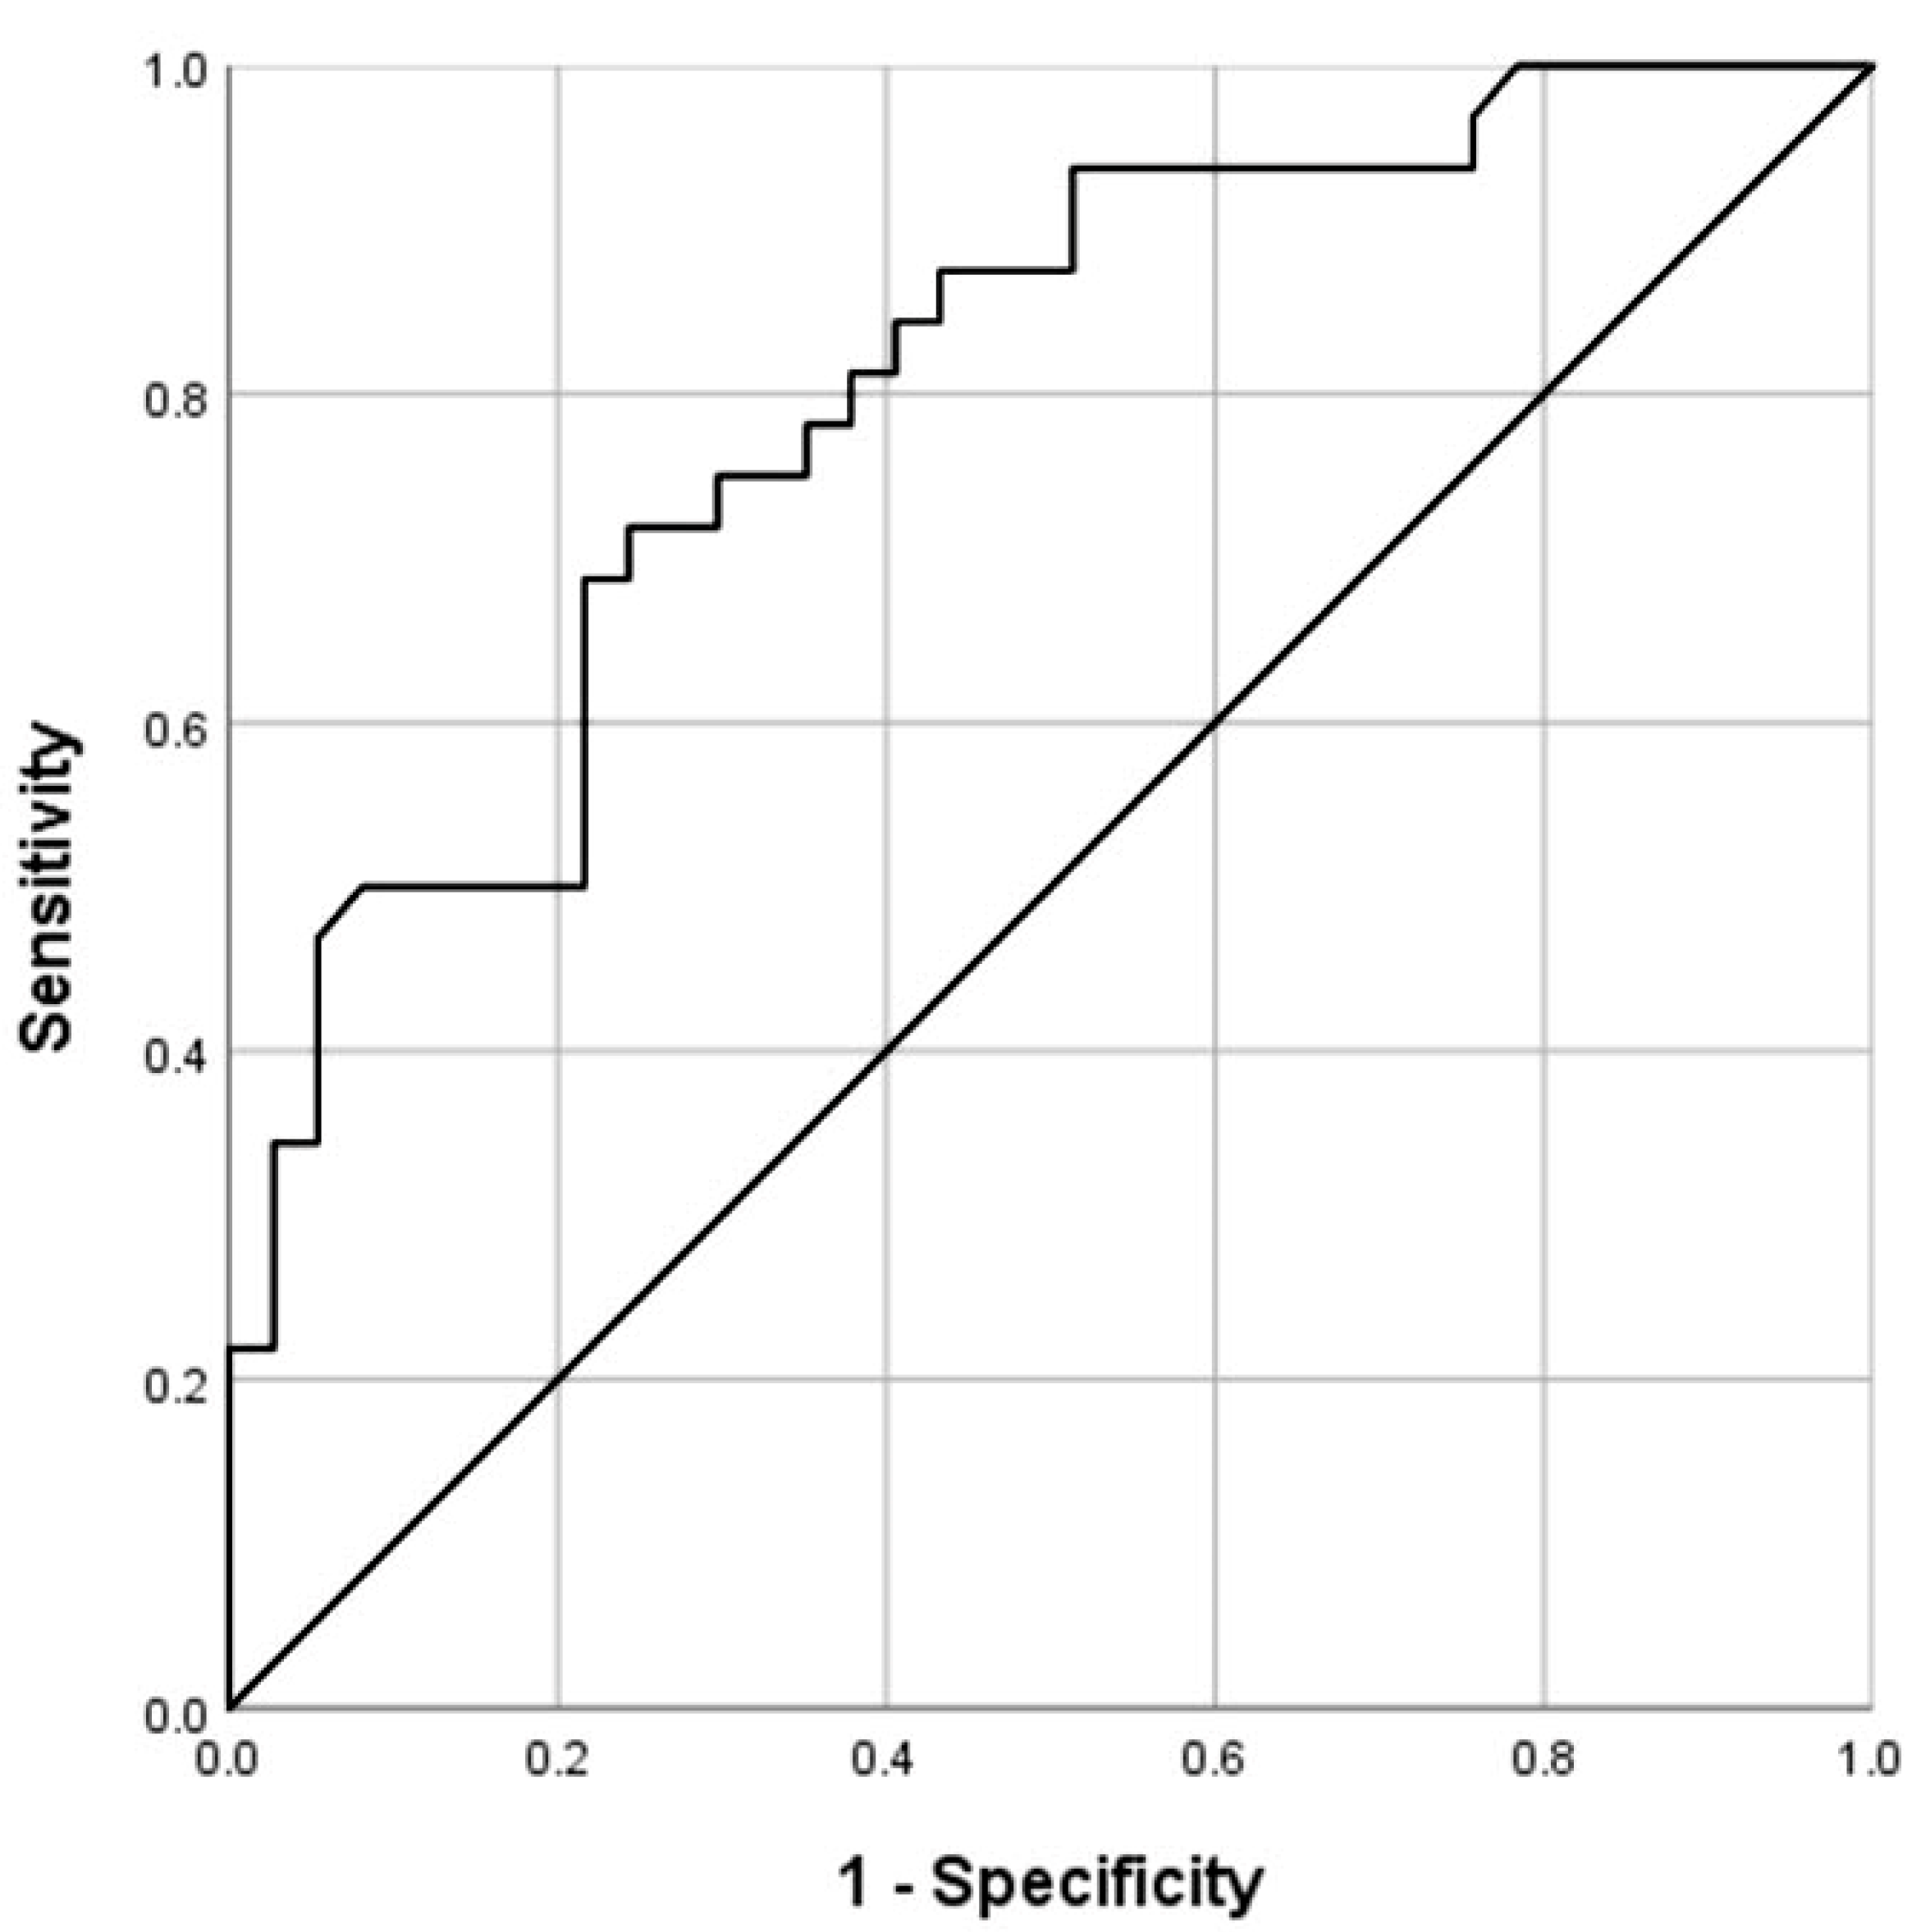
Benign MMs demonstrated significantly lower mean MAVs than mMMs (1.59 ± 0.93 vs. 2.76 ± 1.01 m/s; p < 0.001, Mann–Whitney U-test; Figure 1, Figure 2, Figure 3 and Figure 4). The selection of 2.05 m/s as a cut-off value yielded a sensitivity, specificity, positive predictive value, and negative predictive value of 75.0%, 70.3%, 68.6%, and 76.5%, respectively, in diagnosing mMMs (area under the curve (AUC) = 0.802, 95% CI = 0.699–0.904, Figure 5) (Table 2). In subgroup analysis, hematological mMMs (15/32; 46.9%) showed high MAVs (2.73 ± 1.03 m/s), similar to those of non-hematological mMMs (17/32; 53.1%) (2.79 ± 1.03 m/s). Furthermore, the MAVs of sclerosing mesenteritis cases (15/69; 21.7%) (1.53 ± 0.96 m/s) were significantly lower than those of mMMs (32/69; 46.4%) (2.76 ± 1.01 m/s; p = 0.001). The MAVs among benign and malignant subgroups of MMs are shown in Table 2.

Figure 1.
Benign mesenteric mass. An 80-year-old male patient with a known history of type 1 autoimmune pancreatitis under immunosuppressive treatment. (A) Magnetic resonance imaging appearance of a mass-like “misty mesentery” in the right upper portion of the umbilical region (arrow) (courtesy of Prof. Dr. Mahnken, Department of Radiology, University Hospital Marburg); (B) the ultrasound appearance of an ill-defined, slightly inhomogeneous, echogenic mesenteric mass (arrows); (C) the final acoustic radiation force impulse (ARFI) report of the same mass, showing a mean ARFI velocity (MW) of 1.29 m/s. The mesenteric histology showed an IgG−4-positive sclerosing mesenteritis. Läsion 1: lesion 1; Vs (m/s): velocity in meter per second; Tiefe (cm): depth in centimeter; MW = mean value (Mittelwert); Std-Abw.: standard deviation (Standard Abweichung); IQB: interquartile range (Interquartilbereich).

Figure 2.
Malignant mesenteric mass. A 67-year-old male patient with a known history of malignant lymphoma and suspected recurrence on staging. (A) Computed tomography showing a hypointense round mass in the left upper quadrant (arrow) (courtesy of Prof. Dr. Mahnken, Department of Radiology, University Hospital Marburg); (B) B-mode ultrasound showing a hypoechoic mesenteric mass (arrows); (C) the final acoustic radiation force impulse (ARFI) report of the same mass, showing a mean ARFI velocity (MW) of 2.72 m/s. The mesenteric histology showed a high-grade malignant lymphoma. Läsion 1: lesion 1; Vs (m/s): velocity in meter per second; Tiefe (cm): depth in centimeter; MW = mean value (Mittelwert); Std-Abw.: standard deviation (Standard Abweichung); IQB = interquartile range (Interquartilbereich).
Figure 3.
Malignant mesenteric mass. A 76-year-old female patient with a known history of ovarian cancer and suspected recurrence on staging. (A) Computed tomography image (left) shows a hypointense mesenteric mass (arrow) (courtesy of Prof. Dr. Mahnken, Department of Radiology, University Hospital Marburg); (B) positron emission tomography–computed tomography reveals a high intensity of fluorodeoxyglucose uptake within the mass (arrow)), indicating mesenteric metastasis (courtesy of Prof. Dr. Luster, Department of Nuclear Medicine, University Hospital Marburg); (C) B-mode ultrasound showing a hypoechoic mesenteric mass; (D) the final acoustic radiation force impulse (ARFI) report of the same mass, showing a mean ARFI velocity (MW) of 4.05 m/s. Läsion 1: lesion 1; Vs (m/s): velocity in meter per second; Tiefe (cm): depth in centimeter; MW = mean value (Mittelwert); Std-Abw.: standard deviation (Standard Abweichung); IQB = interquartile range (Interquartilbereich); E: elasticity in Kilopaskal (kPa).
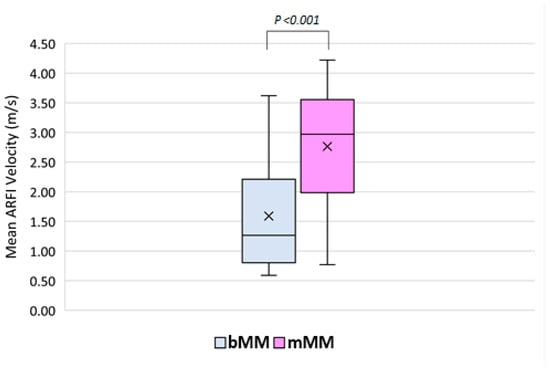
Figure 4.
Differences in mean acoustic radiation force impulse (ARFI) velocities between benign and malignant mesenteric masses in the study. The mean ARFI velocity (MAV) in m/s is represented with an “X” in each box, and the median ARFI velocity in subgroups is shown as a horizontal line within each box. bMM: benign mesenteric mass (MAV = 1.59 ± 0.90 m/s), mMM: malignant mesenteric mass (MAV = 2.76 ± 1.01 m/s) (p < 0.001).
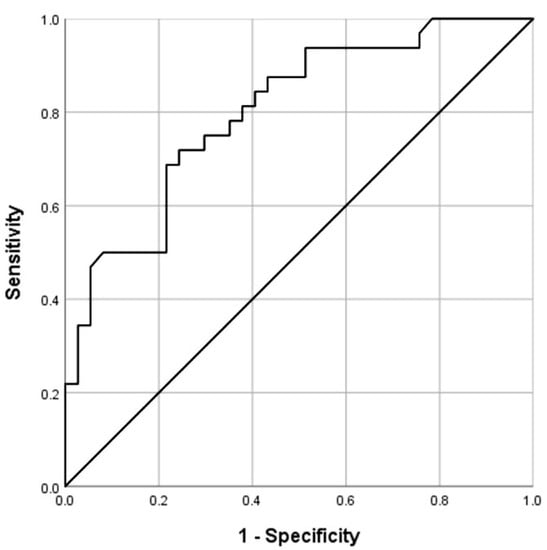
Figure 5.
Receiver operator characteristic curve for the differences in mean acoustic radiation force impulse velocities between benign and malignant mesenteric masses.

Table 2.
Comparison of acoustic radiation force impulse (ARFI) data in different benign and malignant mesenteric masses in n = 69 study patients.
4. Discussion
The mesentery is one of the forgotten abdominal structures. The clinical, pathophysiological, and immunological functions of the mesentery as a distinct organ have been discussed increasingly in many recent reviews [1,31]. The clinical manifestation of mesenteropathies is variable [1,3]. Furthermore, some benign entities, such as mesenteritis, show similar radiological characteristics to those of malignant neoplasms, and distinction between these lesions and neoplastic lesions of the mesentery can present a radiological challenge [3]. Therefore, the need remains to develop new non-invasive methods to evaluate MMs.
Shear wave elastography (SWE) uses the acoustic stimulation of tissue, which induces shear waves that propagate perpendicularly to the compressive (stimulating) signal; these waves are registered at different locations, allowing the estimation of their velocity, which in turn represents tissue elasticity [32]. There are two main types of SWE. In two-dimensional (2D)-SWE, body tissues are stimulated at different points, generating propagating shear waves, which are monitored in real time at different locations within the image, thus generating a quantitative elastogram in the form of a “topographic” colored map correlating to a scale of different elastic measurements in m/s or kilopascals [32]. In point shear wave elastography (pSWE), such as acoustic radiation force impulse (ARFI) pSWE, the resulting shear waves propagate in a direction perpendicular to the axial stimulating acoustic beam, and the speed of propagation of these shear waves is measured within a region of interest (ROI) by estimating the time needed to travel from the border near to the stimulus to the border away from the stimulus [33]. Both pSWE and 2D-SWE have excellent performance in assessing liver fibrosis and cirrhosis [34,35,36], with good reproducibility [34,37], and both modalities perform similarly well in differentiating malignant and benign lesions [38,39,40]. The feasibility of performing examinations in ascites and obesity is considered among the advantages of pSWE. Due to these features, ARFI elastography may be a suitable method for the evaluation of intra-abdominal pathologies. In a standardized study, we examined the performance of pSWE using ARFI as a new US-based sonographic modality in different MMs and as a potential tool in the diagnosis of different MMs. In this study, the mean ARFI values in the mMM group were 2.76 m/s with an SD of ±1.01 m/s (Figure 2 and Figure 3), and in the bMM group, they were 1.59 m/s with an SD of ±0.93 m/s (Figure 1). Malignant MMs demonstrated significantly higher MAVs compared with bMMs (p < 0.001, Mann–Whitney U-test). Using the AUROC and in order to maximize sensitivity and specificity, we suggest a value of 2.05 m/s as a cut-off for mMMs (AUC = 0.803, 95% CI 0.702–0.904). The calculated sensitivity, specificity, positive predictive value, and negative predictive value were 75.0%, 70.3%, 68.6%, and 76.5%, respectively.
These findings reveal that pSWE using ARFI may be an additional useful non-invasive tool for the evaluation of malignancy of MMs in addition to B-mode US and CEUS (Table 3). Particularly in incidentally detected mesenteric pathologies, ARFI combined with B-mode US features and perfusion patterns on CEUS may help in developing diagnostic algorithms. However, in the presence of malignant disease or clinical suspicion of malignant disease, PET-CT remains the imaging method with the highest diagnostic performance (Table 3).

Table 3.
Comparison of various imaging modalities regarding their diagnostic performance in differentiating benign and malignant mesenteric masses.
A further notable finding of this study was the difference between the MAVs of sclerosing mesenteritis and those of mMMs. The MAVs of sclerosing mesenteritis (15/69; 21.7%) (1.53 ± 0.96 m/s) were significantly lower than those of mMMs (32/69; 46.4%) (2.76 ± 1.01 m/s; p = 0.001). These results are important because sclerosing mesenteritis and mMMs may have similar features in different imaging modalities, such as CT or CEUS, and may not be differentiated from each other [11,41]. However, it should be noted that sclerosing mesenteritis may also be caused secondarily due to an underlying malignant disease [42]. Therefore, histological confirmation should always be strongly considered when sclerosing mesenteritis is suspected. The MAVs of hematologic malignancies (15/69; 21.7%) (2.79 ± 1.03 m/s) were not significantly different compared with those of non-hematologic malignancies (17/69; 24.6%) (2.73 ± 1.03 m/s; p > 0.05), and a differentiation between hematologic and non-hematologic malignancies by ARFI elastography was not possible.
There were some limitations to this study. (1) Technical difficulty and failure of measurement: due to the anatomical location of the mesentery and the superimposition of air-filled intestinal loops, ARFI examination of the mesentery may be difficult. In the event of air superimposition, the patient was positioned carefully to enable an adequate measurement to be made. (2) Reproducibility: due to the retrospective nature of the study, the evaluation of inter-rater reliability in the performance of the ARFI elastography investigation in the mesentery was not possible; however, the reproducibility of ARFI has been described in various studies in other organs [30,37,43]. (3) Small sample size: due to the relatively small number of subjects (n = 69), further large prospective studies are needed to validate these results. (4) Validation of diagnosis: a histological examination was not performed in all the MMs. However, all the diagnoses in these patients were confirmed by a future cross-sectional imaging modality (CT or MRI) and clinical follow-up.
5. Conclusions
Our understanding of the mesenterial organ in terms of structure, composition, and role in health and disease is still evolving. In this study, we confirmed the feasibility of pSWE using ARFI in quantifying the degree of stiffness of different benign and malignant mesenteric pathologies. We also found significant differences in stiffness between bMMs and mMMs. Elastography, in particular pSWE, may represent a helpful diagnostic modality in the evaluation of mesenteric pathologies. However, to validate the results of this study, further prospective randomized studies are required.
Author Contributions
E.S.Z., A.A. and C.G. designed the study and were guarantors of the paper. A.A. evaluated and interpreted the data and wrote the manuscript based on the support and comments of all other authors. All authors participated in the data preparation, literature search, and interpretation of results. E.S.Z., C.G., S.K., C.F.D. and A.A. reviewed the manuscript. All authors have read and agreed to the published version of the manuscript.
Funding
This research was funded by the Anneliese Pohl Foundation (Anneliese Pohl Stiftung), grant number: 62083088.
Institutional Review Board Statement
The study was conducted according to the guidelines of the Declaration of Helsinki and approved by the Ethics Committee of Philipps University Marburg (protocol code: EK_MR_09_04_20_görg_2 and date of approval: 9 April 2020).
Informed Consent Statement
Informed consent was obtained from all subjects involved in the study for ultrasound examinations.
Data Availability Statement
The data presented in this study are available on request from the corresponding author.
Acknowledgments
This research was funded by a research grant from the Anneliese Pohl Foundation (Anneliese Pohl Stiftung), and we gratefully acknowledge this support.
Conflicts of Interest
The authors declare no conflict of interest.
References
- Coffey, J.C.; O’Leary, D.P. The mesentery: Structure, function, and role in disease. Lancet Gastroenterol. Hepatol. 2016, 1, 238–247. [Google Scholar] [CrossRef]
- Dufay, C.; Abdelli, A.; Le Pennec, V.; Chiche, L. Mesenteric tumors: Diagnosis and treatment. J. Visc. Surg. 2012, 149, e239–e251. [Google Scholar] [CrossRef] [PubMed]
- Danford, C.J.; Lin, S.C.; Wolf, J.L. Sclerosing Mesenteritis. Am. J. Gastroenterol. 2019, 114, 867–873. [Google Scholar] [CrossRef]
- Diab, R.; Virarkar, M.; Saleh, M.; Elsheif, S.; Javadi, S.; Bhosale, P.; Faria, S. Imaging spectrum of mesenteric masses. Abdom. Radiol. 2020, 45, 3618–3636. [Google Scholar] [CrossRef]
- Aslan, S.; Nural, M.S. CT features of asymptomatic heterotopic pancreas in jejunal mesentery. Turk. J. Gastroenterol. 2019, 30, 208–210. [Google Scholar] [CrossRef] [PubMed]
- Winant, A.J.; Vora, A.; Ginter, P.S.; Levine, M.S.; Brylka, D.A. More than just metastases: A practical approach to solid mesenteric masses. Abdom. Imaging 2014, 39, 605–621. [Google Scholar] [CrossRef] [PubMed]
- Smith, J.P.; Arnoletti, J.P.; Varadarajulu, S.; Morgan, D.E. Post-pancreatitis Fat Necrosis Mimicking Carcinomatosis. Radiol. Case Rep. 2008, 3, 192. [Google Scholar] [CrossRef] [Green Version]
- Gottschalk, U.; Nitzsche, C.; Felber, J.; Dietrich, C.F. Enteroscopy and imaging in sclerosing mesenteritis. Z. Gastroenterol. 2012, 50, 1013–1017. [Google Scholar] [CrossRef]
- Zissin, R.; Metser, U.; Hain, D.; Even-Sapir, E. Mesenteric panniculitis in oncologic patients: PET-CT findings. Br. J. Radiol. 2006, 79, 37–43. [Google Scholar] [CrossRef]
- Nakatani, K.; Nakamoto, Y.; Togashi, K. FDG-PET/CT assessment of misty mesentery: Feasibility for distinguishing viable mesenteric malignancy from stable conditions. Eur. J. Radiol. 2013, 82, e380–e385. [Google Scholar] [CrossRef] [Green Version]
- Trenker, C.; Safai Zadeh, E.; Petzold, G.; Görg, C.; Neesse, A. Mesenteric Masses on 2D Mode and Contrast-Enhanced Ultrasound: A Retrospective Study in 69 Patients. Ultraschall Med.-Eur. J. Ultrasound 2017, 38, 655–660. [Google Scholar] [CrossRef] [PubMed]
- Safai Zadeh, E.; Kindermann, J.; Dietrich, C.F.; Görg, C.; Bleyl, T.; Alhyari, A.; Trenker, C. Clinical Awareness and Acceptance of Sonographically Diagnosed Epiploic Appendagitis (EA): A Retrospective Analysis of EA in a Single Tertiary Academic Referral Center. Ultrasound Int. Open 2020, 6, E87–E93. [Google Scholar] [CrossRef] [PubMed]
- Safai Zadeh, E.; Beutel, B.; Dietrich, C.F.; Keber, C.U.; Huber, K.P.; Görg, C.; Trenker, C. Perfusion Patterns of Peripheral Pulmonary Lesions in COVID-19 Patients Using Contrast-Enhanced Ultrasound (CEUS). J. Ultrasound Med. 2021, 40, 2403–2411. [Google Scholar] [CrossRef] [PubMed]
- Safai Zadeh, E.; Dietrich, C.F.; Amjad, A.; Trenker, C.; Görg, C. Transcutaneous B-Mode Ultrasound (TUS) and contrast-enhanced ultrasound (CEUS) pattern of mediastinal tumors: A Pictorial Essay. J. Ultrason. 2021, 21, e340–e347. [Google Scholar] [CrossRef]
- Safai Zadeh, E.; Görg, C.; Dietrich, C.F.; Görlach, J.; Alhyari, A.; Trenker, C. Contrast-Enhanced Ultrasound for Evaluation of Pleural Effusion: A Pictorial Essay. J. Ultrasound Med. 2021, 41, 485–503. [Google Scholar] [CrossRef]
- Safai Zadeh, E.; Keber, C.U.; Dietrich, C.F.; Westhoff, C.C.; Günter, C.; Beutel, B.; Alhyari, A.; Trenker, C.; Görg, C. Perfusion Patterns of Peripheral Pulmonary Granulomatous Lesions Using Contrast-Enhanced Ultrasound (CEUS) and Their Correlation with Immunohistochemically Detected Vascularization Patterns. J. Ultrasound Med. 2021, 41, 565–574. [Google Scholar] [CrossRef]
- Safai Zadeh, E.; Weide, J.; Dietrich, C.F.; Trenker, C.; Koczulla, A.R.; Görg, C. Diagnostic Accuracy of B-Mode- and Contrast-Enhanced Ultrasound in Differentiating Malignant from Benign Pleural Effusions. Diagnostics 2021, 11, 1293. [Google Scholar] [CrossRef]
- Safai Zadeh, E.; Westhoff, C.C.; Keber, C.U.; Trenker, C.; Dietrich, C.F.; Alhyari, A.; Mohr, C.G.L.; Görg, C. Perfusion Patterns of Peripheral Organizing Pneumonia (POP) Using Contrast-Enhanced Ultrasound (CEUS) and Their Correlation with Immunohistochemically Detected Vascularization Patterns. Diagnostics 2021, 11, 1601. [Google Scholar] [CrossRef]
- Safai Zadeh, E.; Dietrich, C.F.; Kmoth, L.; Trenker, C.; Alhyari, A.; Ludwig, M.; Görg, C. Peripheral Pulmonary Lesions in Confirmed Pulmonary Arterial Embolism: Follow-up Study of B-Mode Ultrasound and of Perfusion Patterns Using Contrast-Enhanced Ultrasound (CEUS). J. Ultrasound Med. 2021. [Google Scholar] [CrossRef]
- Findeisen, H.; Görg, C.; Hartbrich, R.; Dietrich, C.F.; Görg, K.; Trenker, C.; Safai Zadeh, E. Contrast-enhanced ultrasound is helpful for differentiating benign from malignant parietal pleural lesions. J. Clin. Ultrasound 2021, 50, 90–98. [Google Scholar] [CrossRef]
- Săftoiu, A.; Gilja, O.H.; Sidhu, P.S.; Dietrich, C.F.; Cantisani, V.; Amy, D.; Bachmann-Nielsen, M.; Bob, F.; Bojunga, J.; Brock, M.; et al. The EFSUMB Guidelines and Recommendations for the Clinical Practice of Elastography in Non-Hepatic Applications: Update 2018. Ultraschall Med. 2019, 40, 425–453. [Google Scholar] [CrossRef] [PubMed] [Green Version]
- Dietrich, C.F.; Bamber, J.; Berzigotti, A.; Bota, S.; Cantisani, V.; Castera, L.; Cosgrove, D.; Ferraioli, G.; Friedrich-Rust, M.; Gilja, O.H.; et al. EFSUMB Guidelines and Recommendations on the Clinical Use of Liver Ultrasound Elastography, Update 2017 (Long Version). Ultraschall Med. 2017, 38, e16–e47. [Google Scholar] [CrossRef] [PubMed] [Green Version]
- Ferraioli, G.; Barr, R.G.; Farrokh, A.; Radzina, M.; Cui, X.W.; Dong, Y.; Rocher, L.; Cantisani, V.; Polito, E.; D’Onofrio, M.; et al. How to perform shear wave elastography. Part I. Med. Ultrason. 2022, 24, 95–106. [Google Scholar] [CrossRef] [PubMed]
- Dietrich, C.F.; Burmeister, S.; Hollerbach, S.; Arcidiacono, P.G.; Braden, B.; Fusaroli, P.; Hocke, M.; Iglesias-Garcia, J.; Kitano, M.; Larghi, A.; et al. Do we need elastography for EUS? Endosc. Ultrasound 2020, 9, 284–290. [Google Scholar] [CrossRef]
- Dietrich, C.F.; Ferraioli, G.; Sirli, R.; Popescu, A.; Sporea, I.; Pienar, C.; Kunze, C.; Taut, H.; Schrading, S.; Bota, S.; et al. General advice in ultrasound based elastography of pediatric patients. Med. Ultrason. 2019, 21, 315–326. [Google Scholar] [CrossRef] [Green Version]
- Dietrich, C.F.; Hocke, M. Elastography of the Pancreas, Current View. Clin. Endosc. 2019, 52, 533–540. [Google Scholar] [CrossRef] [Green Version]
- D’Onofrio, M.; Crosara, S.; De Robertis, R.; Canestrini, S.; Demozzi, E.; Gallotti, A.; Pozzi Mucelli, R. Acoustic radiation force impulse of the liver. World J. Gastroenterol. 2013, 19, 4841–4849. [Google Scholar] [CrossRef]
- Heese, F.; Görg, C. The value of highest quality ultrasound as a reference for ultrasound diagnosis. Ultraschall Med. 2006, 27, 220–224. [Google Scholar] [CrossRef]
- Barr, R.G.; Ferraioli, G.; Palmeri, M.L.; Goodman, Z.D.; Garcia-Tsao, G.; Rubin, J.; Garra, B.; Myers, R.P.; Wilson, S.R.; Rubens, D.; et al. Elastography Assessment of Liver Fibrosis: Society of Radiologists in Ultrasound Consensus Conference Statement. Radiology 2015, 276, 845–861. [Google Scholar] [CrossRef] [Green Version]
- Alhyari, A.; Görg, C.; Dietrich, C.F.; Trenker, C.; Ludwig, M.; Safai Zadeh, E. Diagnostic Performance of Point Shear Wave Elastography Using Acoustic Radiation Force Impulse Technology in Peripheral Pulmonary Consolidations: A Feasibility Study. Ultrasound Med. Biol. 2022, S0301-5629(22)00003-5. [Google Scholar] [CrossRef]
- Dalla Pria, H.R.F.; Torres, U.S.; Velloni, F.; Santiago, R.A.; Zacarias, M.S.; Silva, L.F.D.; Tamamoto, F.; Walsh, D.; von Atzingen, A.C.; Coffey, J.C.; et al. The Mesenteric Organ: New Anatomical Concepts and an Imaging-based Review on Its Diseases. Semin. Ultrasound CT MR 2019, 40, 515–532. [Google Scholar] [CrossRef] [PubMed]
- Ozturk, A.; Grajo, J.R.; Dhyani, M.; Anthony, B.W.; Samir, A.E. Principles of ultrasound elastography. Abdom. Radiol. 2018, 43, 773–785. [Google Scholar] [CrossRef] [PubMed]
- Șirli, R.; Popescu, A.; Sporea, I. Liver Fibrosis Assessment by Point Shear-Wave Elastography Techniques. In Ultrasound Elastography; IntechOpen: London, UK, 2019. [Google Scholar] [CrossRef] [Green Version]
- Petzold, G.; Hofer, J.; Ellenrieder, V.; Neesse, A.; Kunsch, S. Liver Stiffness Measured by 2-Dimensional Shear Wave Elastography: Prospective Evaluation of Healthy Volunteers and Patients With Liver Cirrhosis. J. Ultrasound Med. 2019, 38, 1769–1777. [Google Scholar] [CrossRef] [PubMed]
- Kiani, A.; Brun, V.; Lainé, F.; Turlin, B.; Morcet, J.; Michalak, S.; Le Gruyer, A.; Legros, L.; Bardou-Jacquet, E.; Gandon, Y.; et al. Acoustic radiation force impulse imaging for assessing liver fibrosis in alcoholic liver disease. World J. Gastroenterol. 2016, 22, 4926–4935. [Google Scholar] [CrossRef] [PubMed]
- Tachi, Y.; Hirai, T.; Kojima, Y.; Miyata, A.; Ohara, K.; Ishizu, Y.; Honda, T.; Kuzuya, T.; Hayashi, K.; Ishigami, M.; et al. Liver stiffness measurement using acoustic radiation force impulse elastography in hepatitis C virus-infected patients with a sustained virological response. Aliment Pharm. Ther. 2016, 44, 346–355. [Google Scholar] [CrossRef] [PubMed]
- Bob, F.; Bota, S.; Sporea, I.; Sirli, R.; Petrica, L.; Schiller, A. Kidney shear wave speed values in subjects with and without renal pathology and inter-operator reproducibility of acoustic radiation force impulse elastography (ARFI)—Preliminary results. PLoS ONE 2014, 9, e113761. [Google Scholar] [CrossRef] [Green Version]
- Li, G.; Li, D.-W.; Fang, Y.-X.; Song, Y.-J.; Deng, Z.-J.; Gao, J.; Xie, Y.; Yin, T.-S.; Ying, L.; Tang, K.-F. Performance of Shear Wave Elastography for Differentiation of Benign and Malignant Solid Breast Masses. PLoS ONE 2013, 8, e76322. [Google Scholar] [CrossRef]
- Liu, B.; Liang, J.; Zheng, Y.; Xie, X.; Huang, G.; Zhou, L.; Wang, W.; Lu, M. Two-dimensional shear wave elastography as promising diagnostic tool for predicting malignant thyroid nodules: A prospective single-centre experience. Eur. Radiol. 2015, 25, 624–634. [Google Scholar] [CrossRef]
- Zhan, J.; Jin, J.-M.; Diao, X.-H.; Chen, Y. Acoustic radiation force impulse imaging (ARFI) for differentiation of benign and malignant thyroid nodules—A meta-analysis. Eur. J. Radiol. 2015, 84, 2181–2186. [Google Scholar] [CrossRef]
- Horton, K.M.; Lawler, L.P.; Fishman, E.K. CT findings in sclerosing mesenteritis (panniculitis): Spectrum of disease. Radiographics 2003, 23, 1561–1567. [Google Scholar] [CrossRef]
- Green, M.S.; Chhabra, R.; Goyal, H. Sclerosing mesenteritis: A comprehensive clinical review. Ann. Transl. Med. 2018, 6, 336. [Google Scholar] [CrossRef] [PubMed]
- Ma, J.J.; Ding, H.; Mao, F.; Sun, H.C.; Xu, C.; Wang, W.P. Assessment of liver fibrosis with elastography point quantification technique in chronic hepatitis B virus patients: A comparison with liver pathological results. J. Gastroenterol. Hepatol. 2014, 29, 814–819. [Google Scholar] [CrossRef] [PubMed]
Publisher’s Note: MDPI stays neutral with regard to jurisdictional claims in published maps and institutional affiliations. |
© 2022 by the authors. Licensee MDPI, Basel, Switzerland. This article is an open access article distributed under the terms and conditions of the Creative Commons Attribution (CC BY) license (https://creativecommons.org/licenses/by/4.0/).


