
Systematic Review of Prognostic Role of Blood Cell Ratios in Patients with Gastric Cancer Undergoing Surgery

 ,
,  and
and
Abstract
:1. Introduction
2. Methods
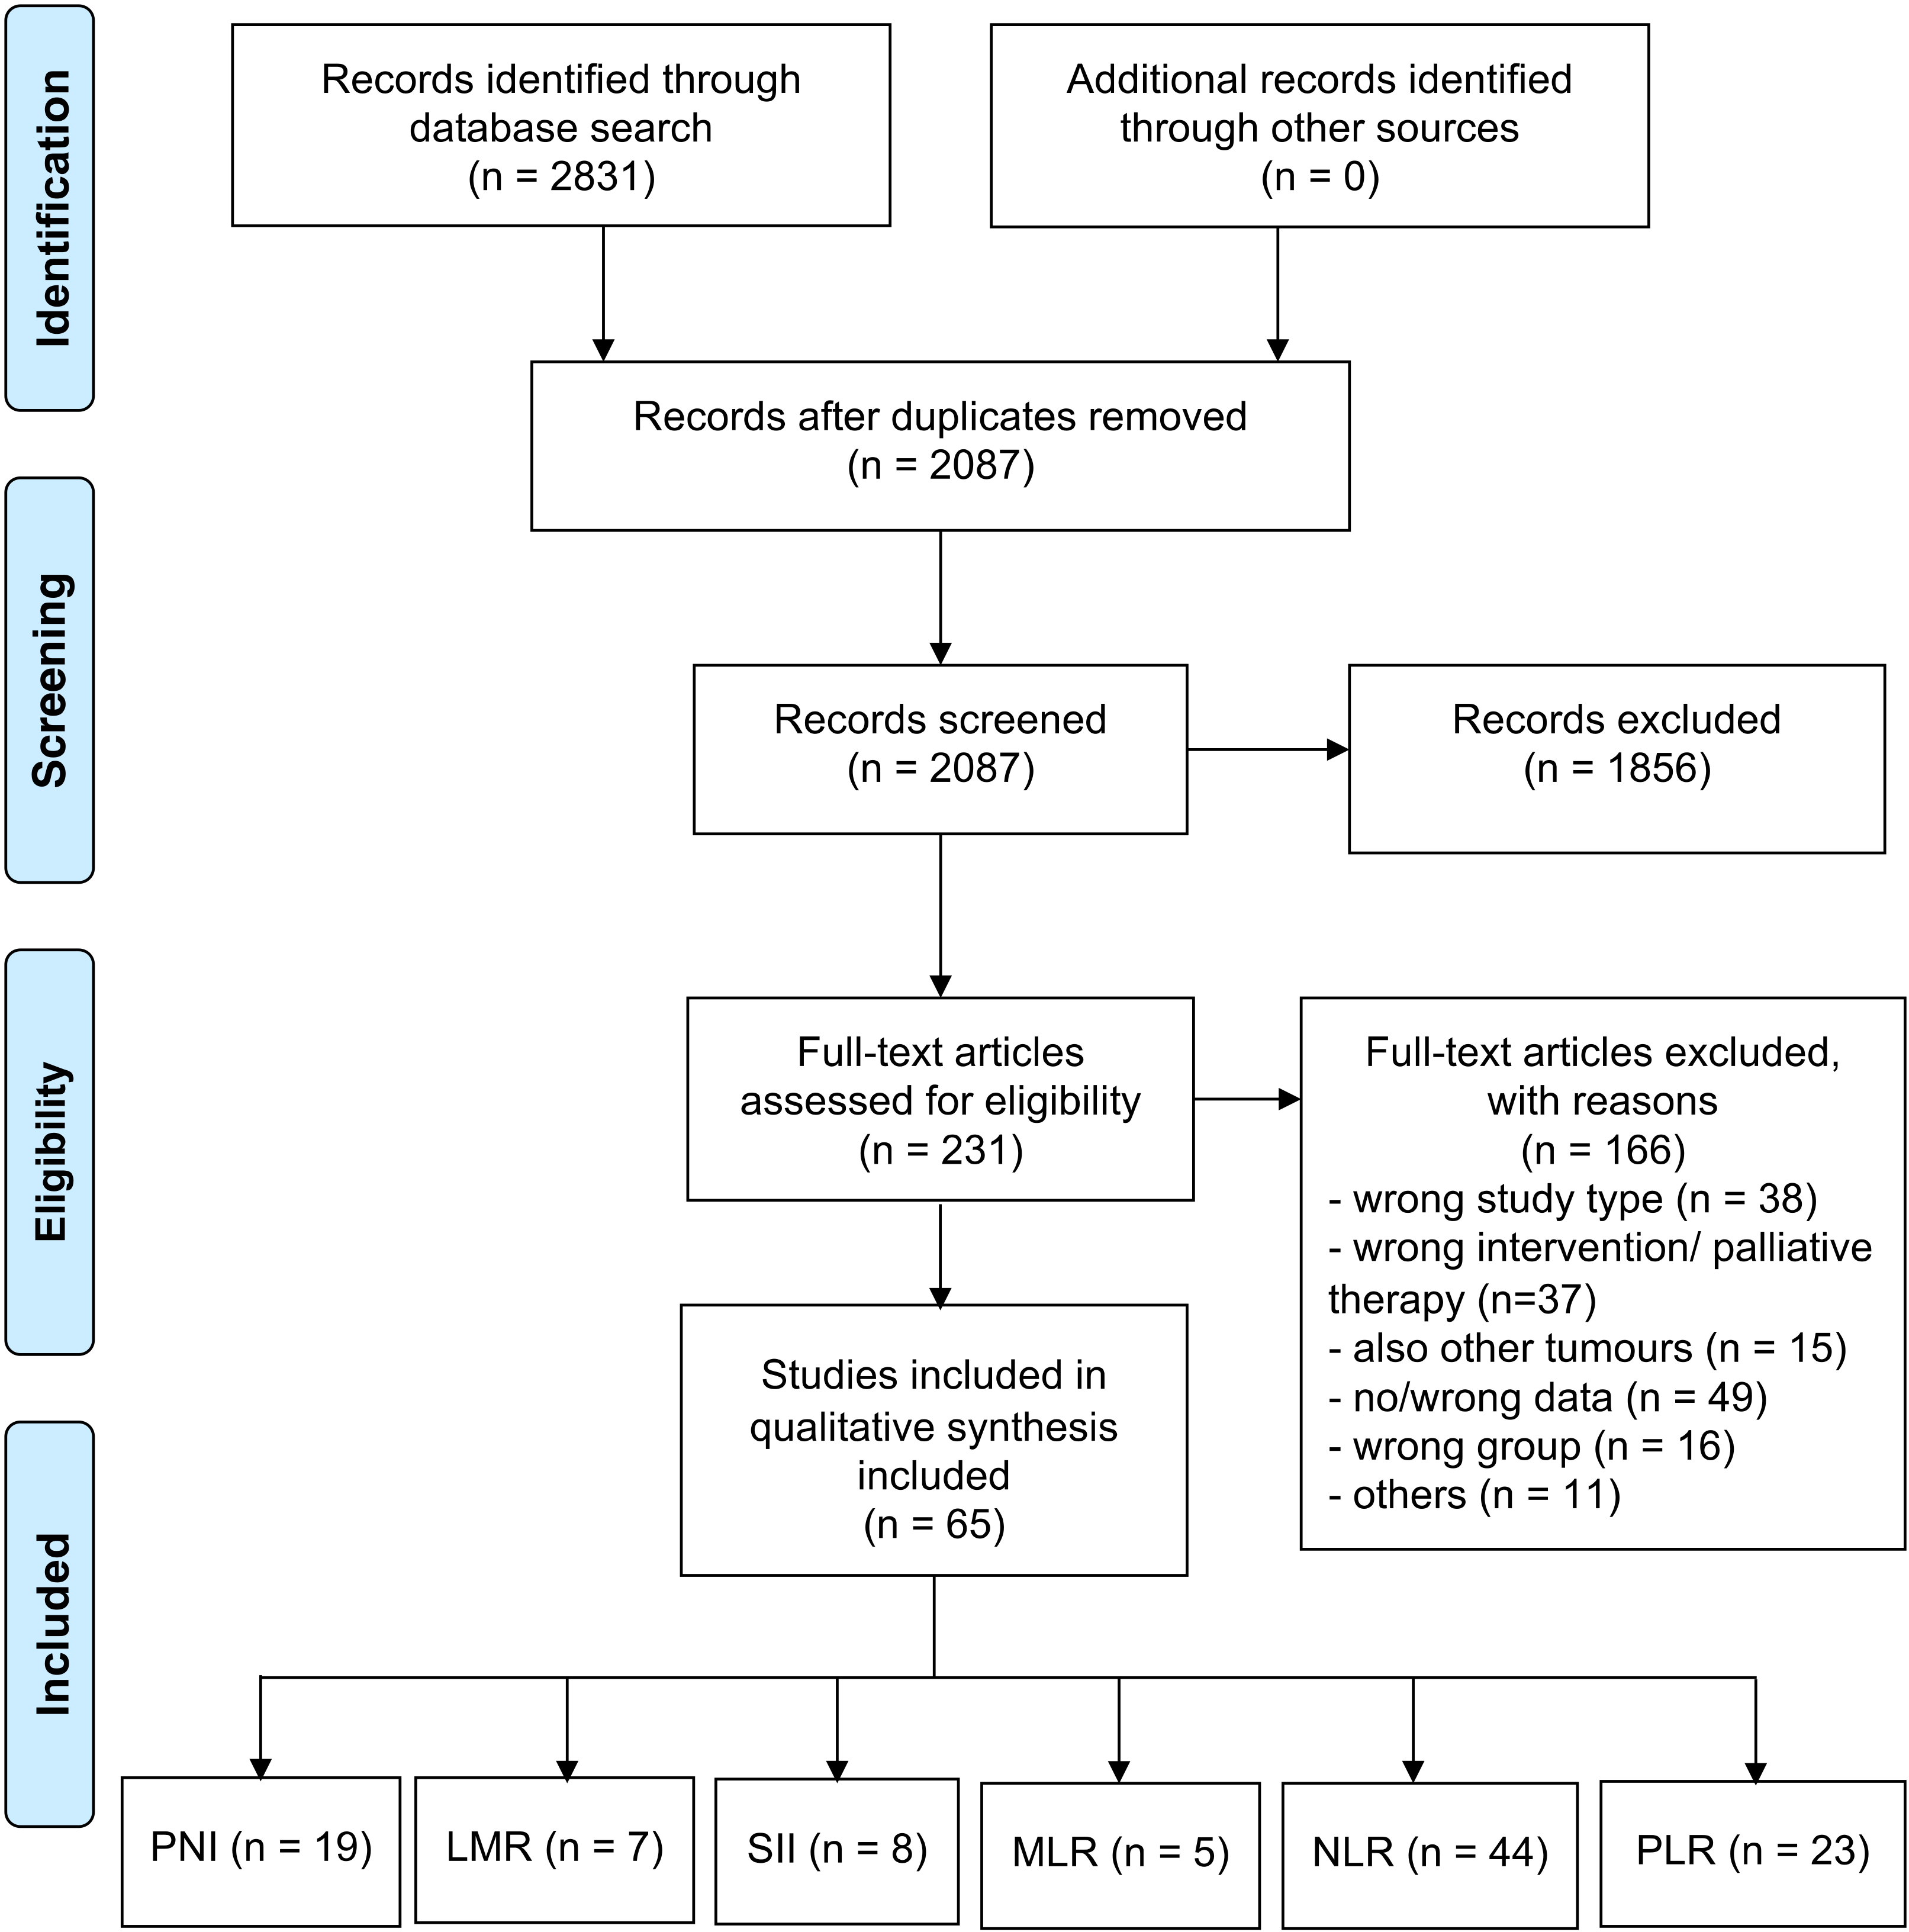
2.1. Systematic Literature Search
2.2. Study Selection
2.3. Data Extraction
2.4. Critical Appraisal (Bias)
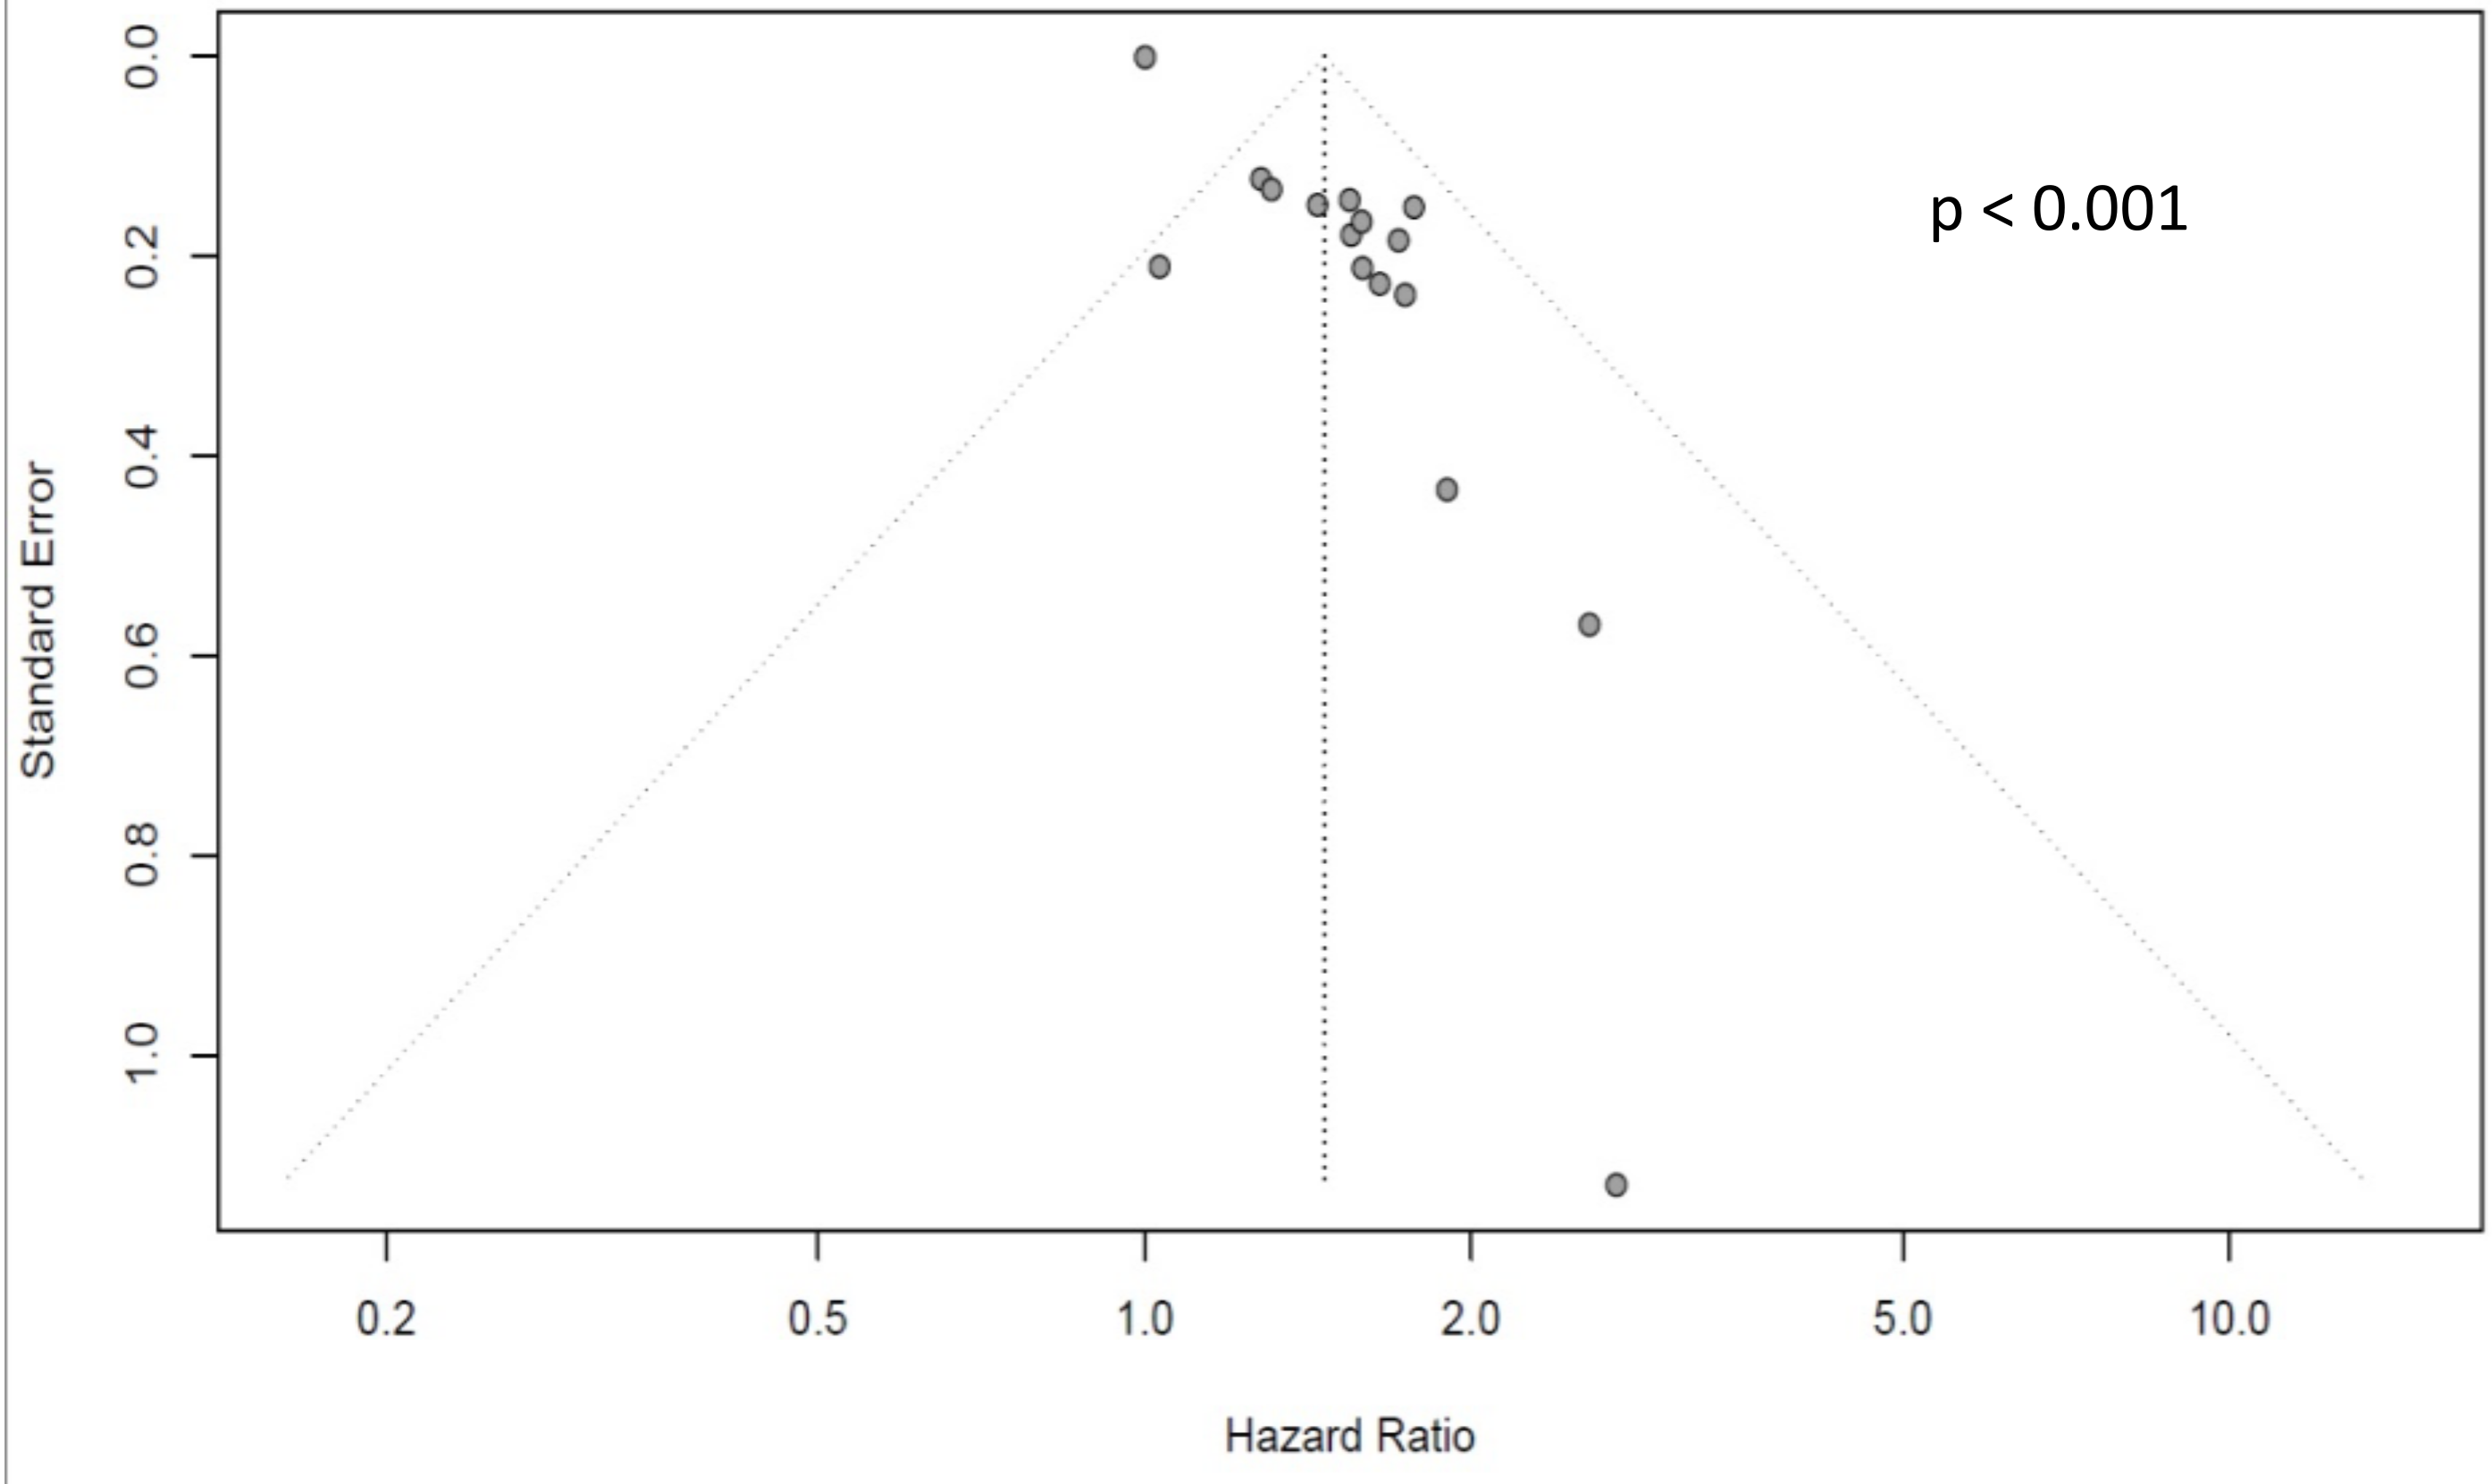
2.5. Data Handling and Statistical Analysis
3. Results
3.1. Qualitative Analysis
3.2. Quantitative Analysis
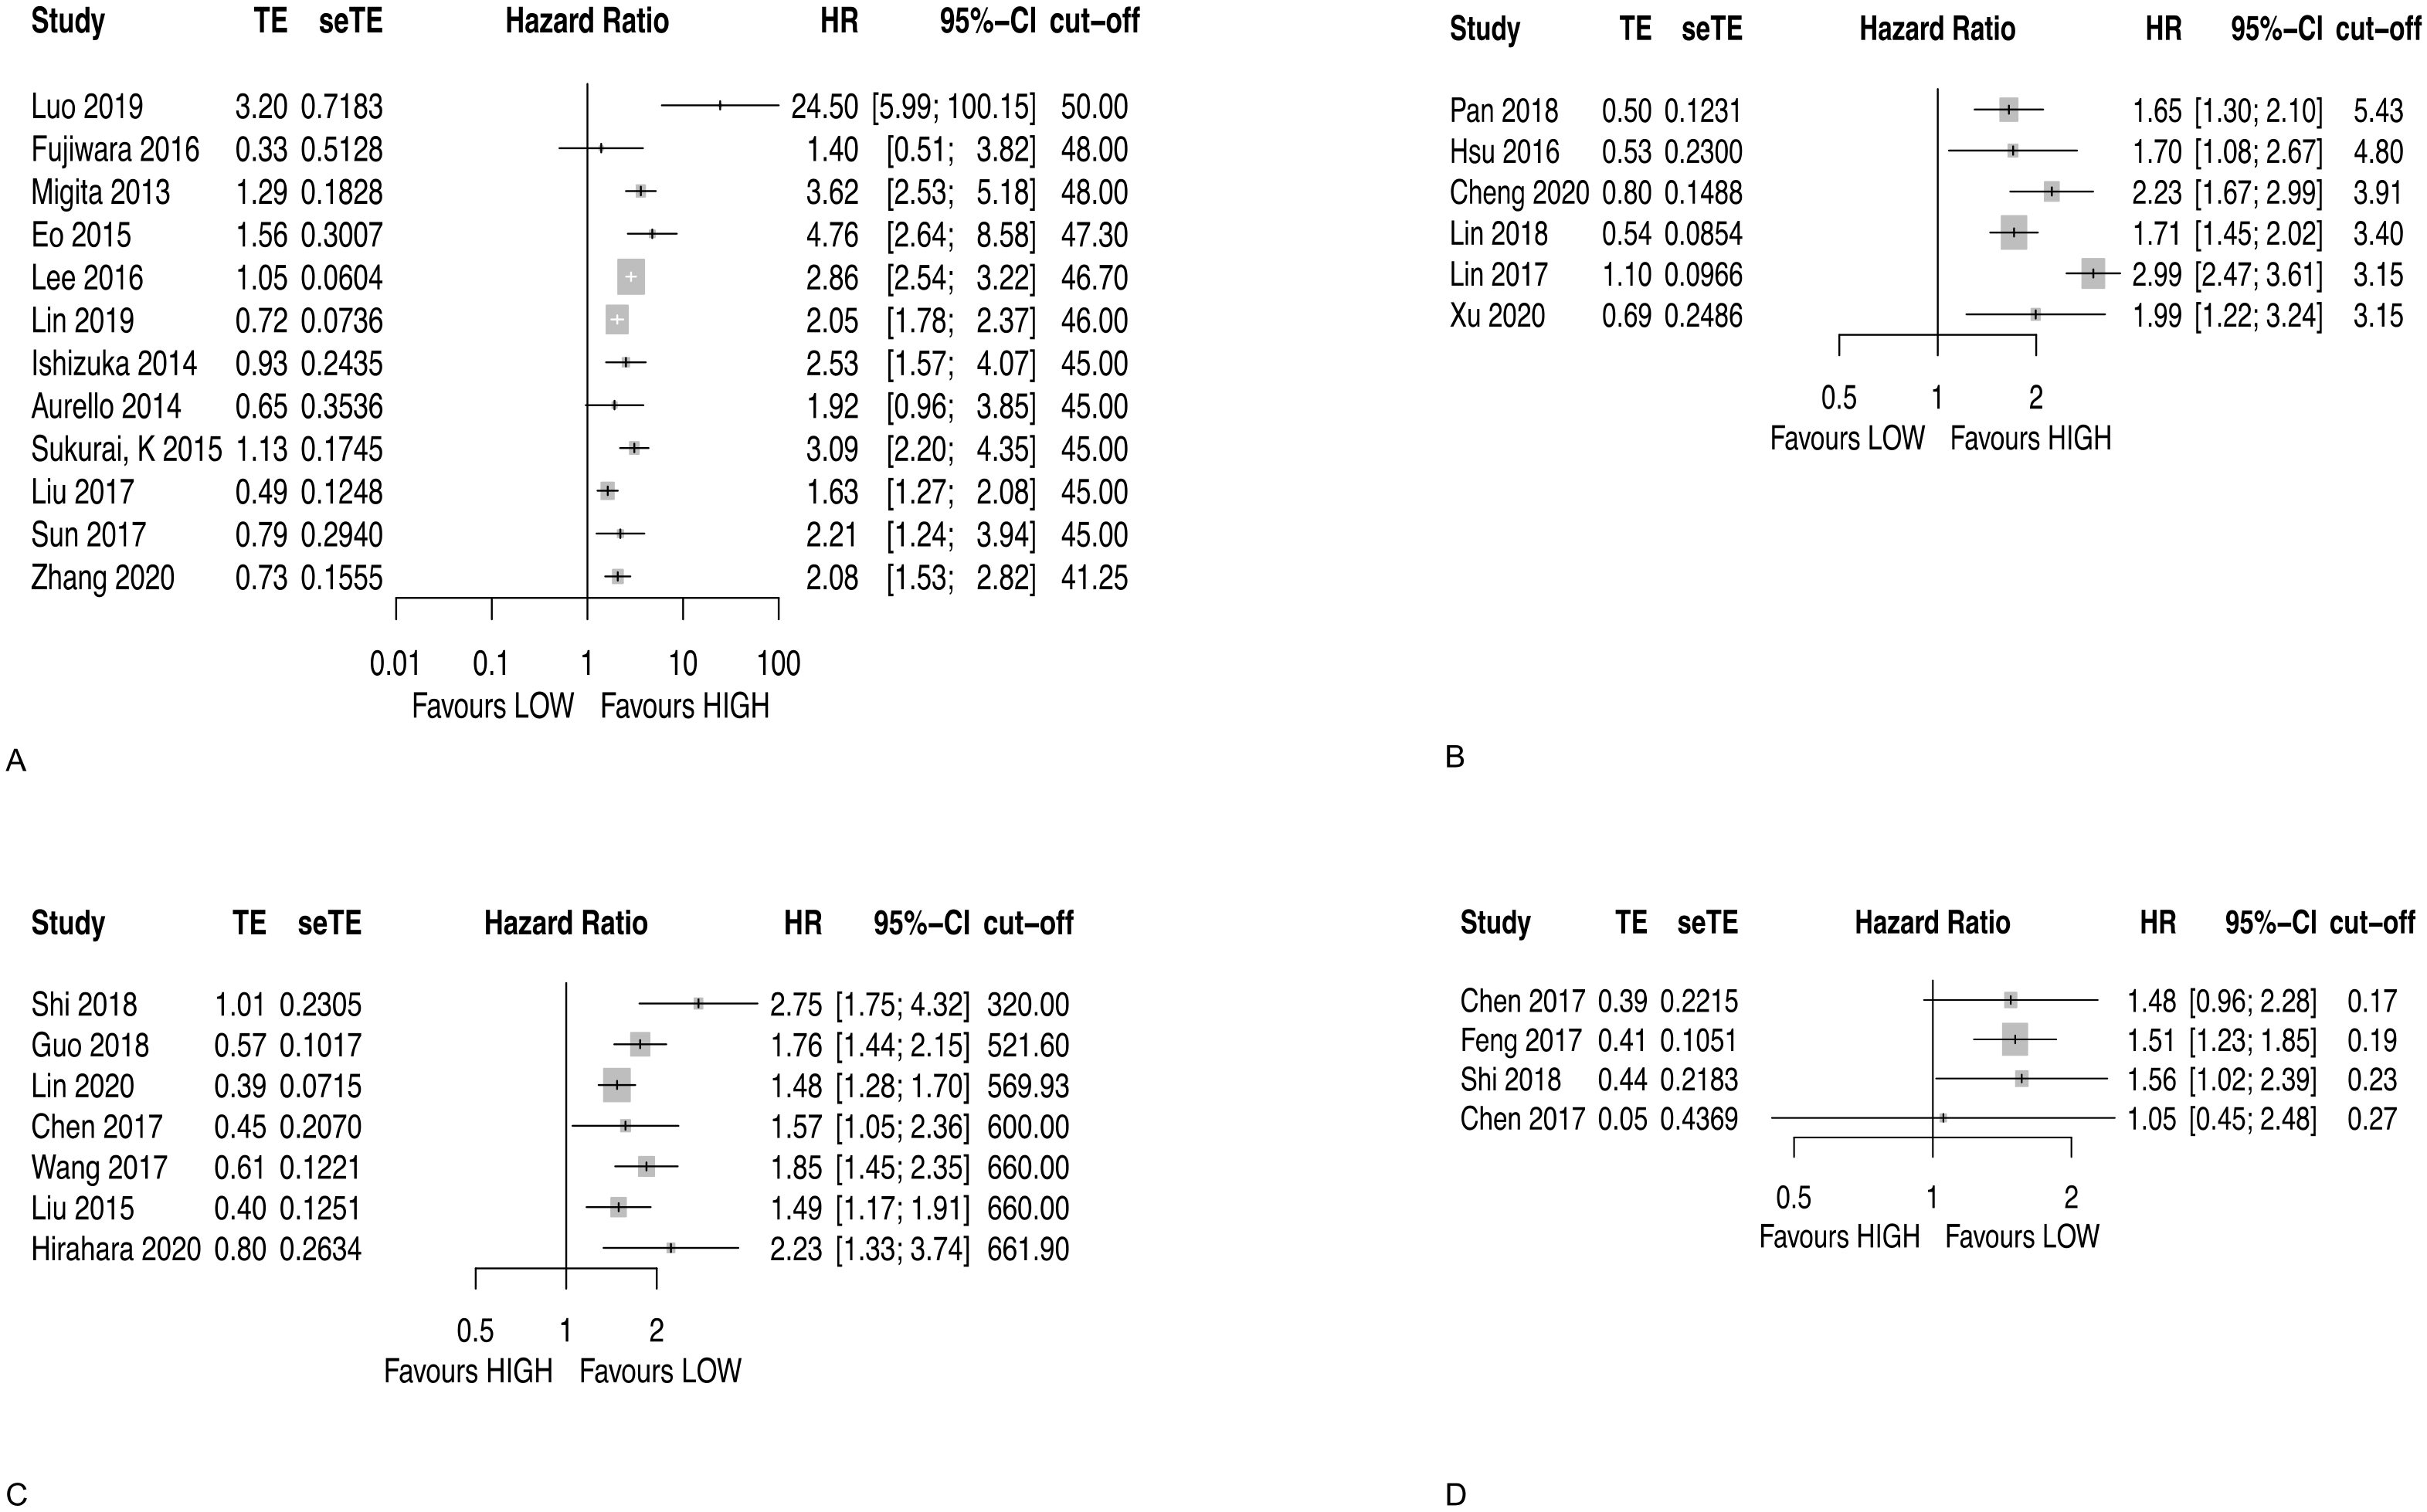
3.2.1. Prognostic Nutritional Index (PNI)
3.2.2. Lymphocyte to Monocyte Ratio (LMR)
3.2.3. Systemic Immune-Inflammation Index (SII)
3.2.4. Monocyte to Lymphocyte Ratio (MLR)
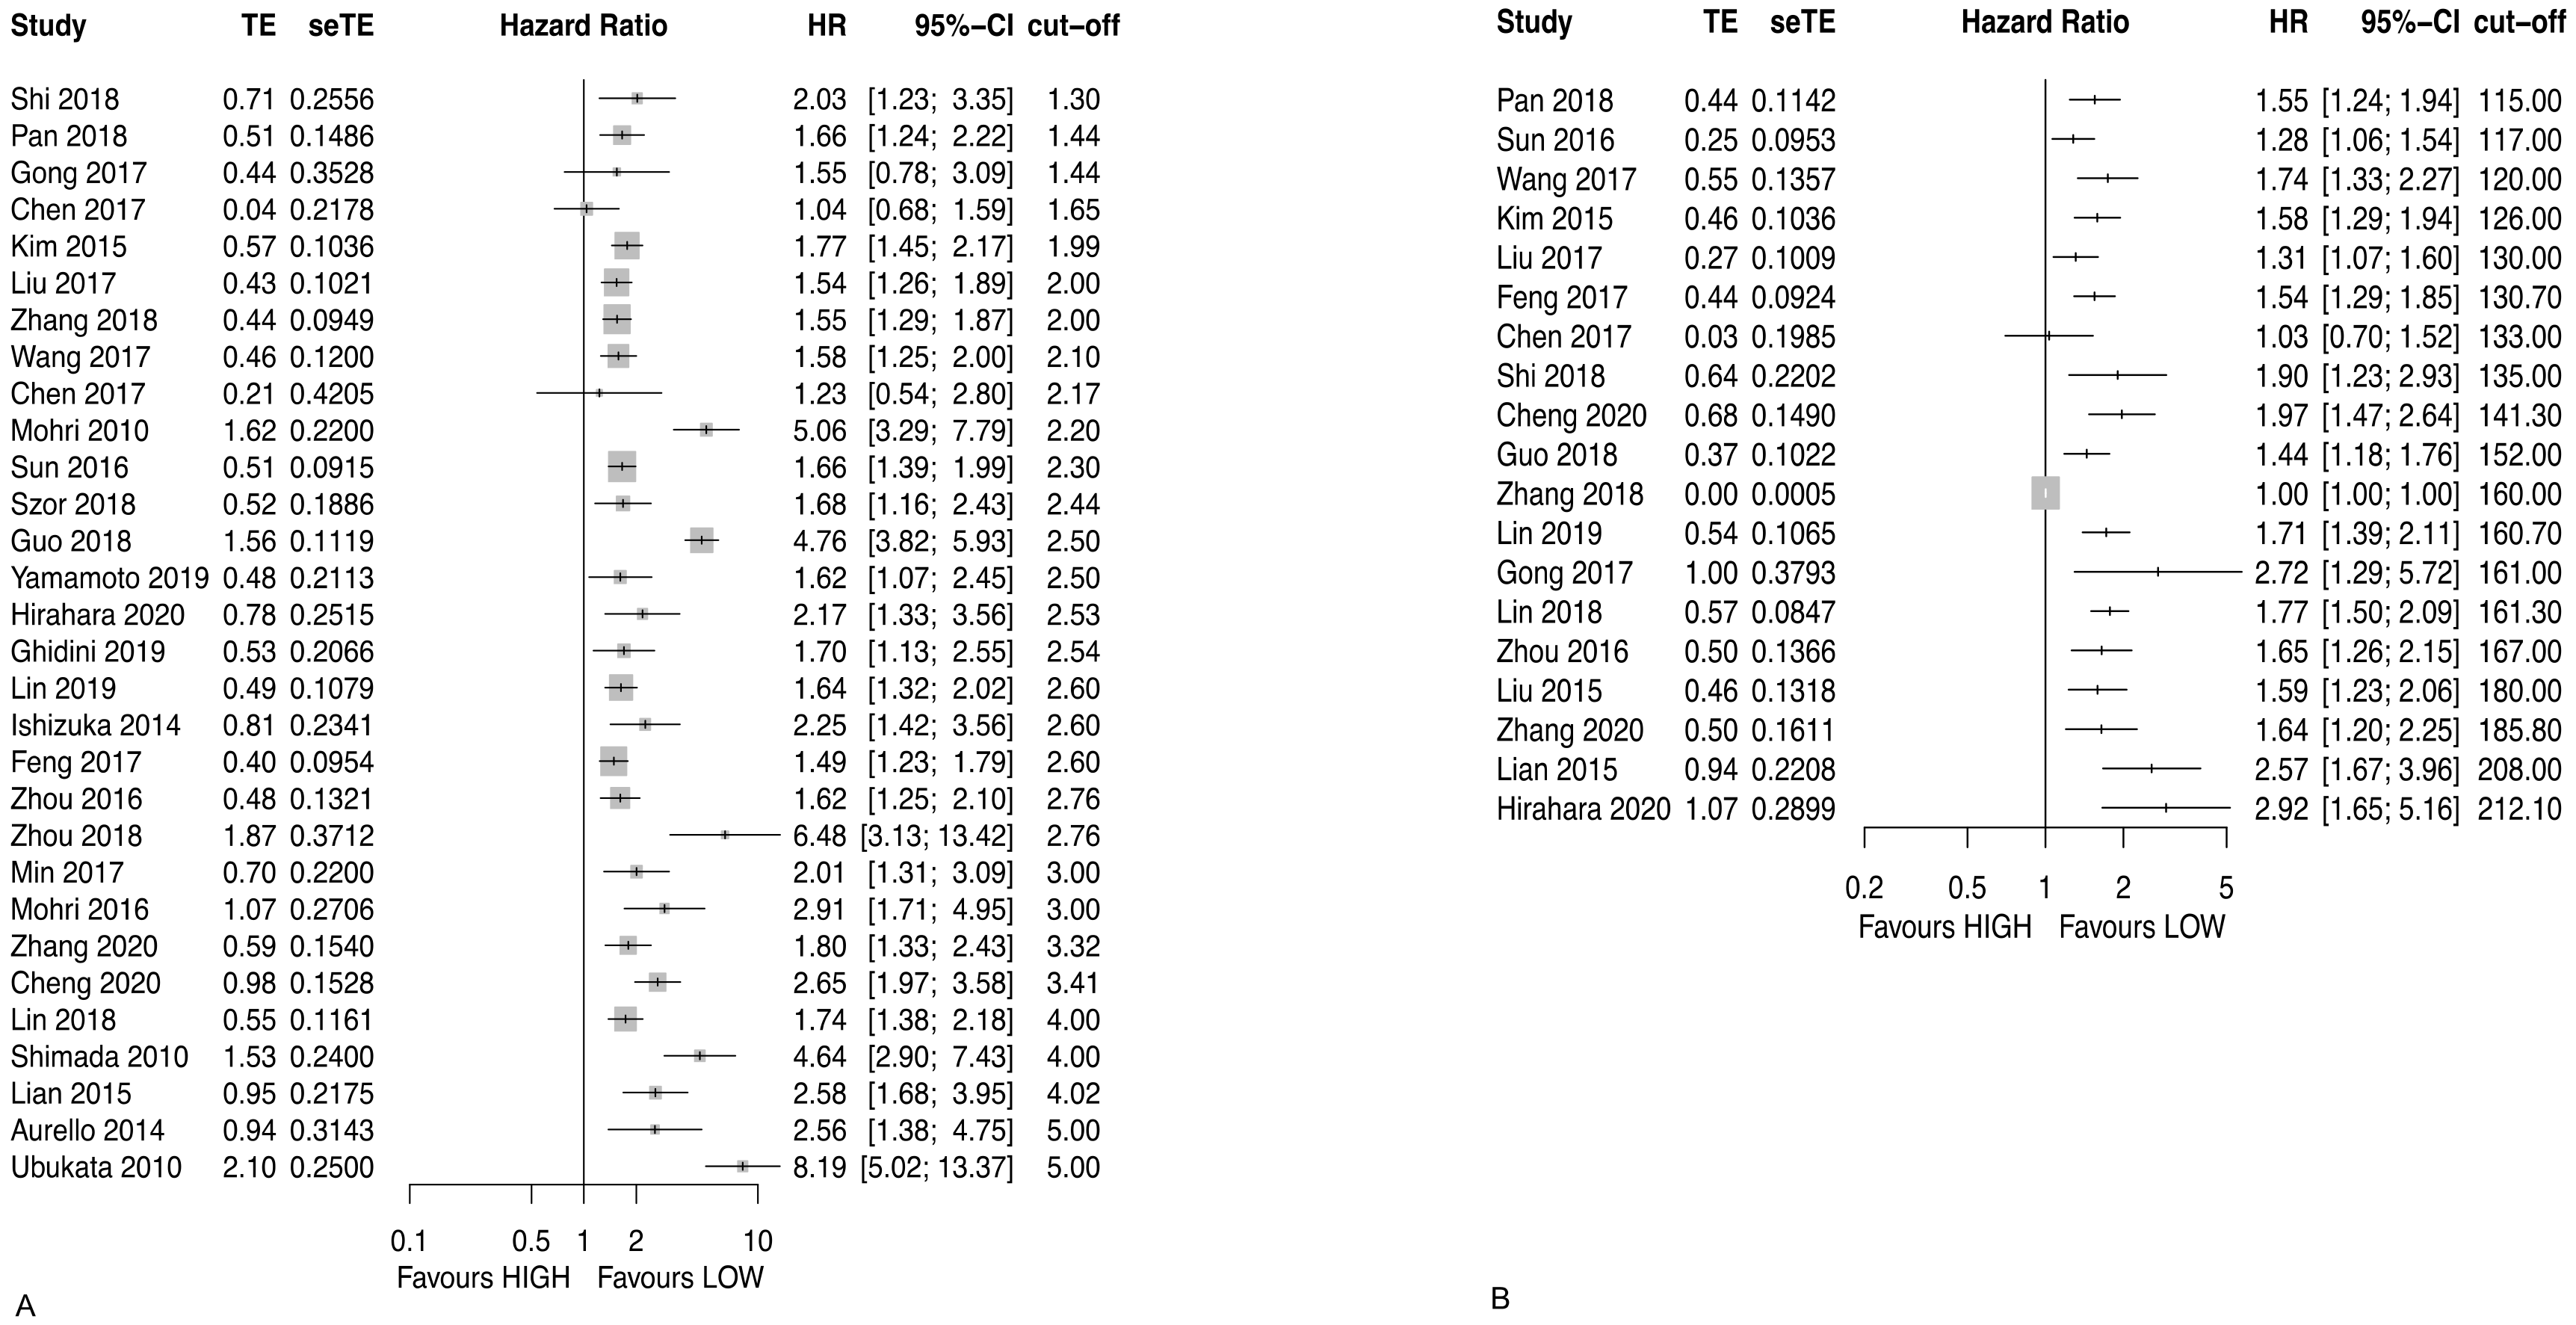
3.2.5. Neutrophil to Lymphocyte Ratio (NLR)
3.2.6. Platelet to Lymphocyte Ratio (PLR)
3.3. Blood Cell Ratio Recommendation
4. Discussion
Supplementary Materials
Author Contributions
Funding
Institutional Review Board Statement
Informed Consent Statement
Data Availability Statement
Conflicts of Interest
References
- Bray, F.; Ferlay, J.; Soerjomataram, I.; Siegel, R.L.; Torre, L.A.; Jemal, A. Global cancer statistics 2018: GLOBOCAN estimates of incidence and mortality worldwide for 36 cancers in 185 countries. CA Cancer J. Clin. 2018, 68, 394–424. [Google Scholar] [CrossRef] [PubMed] [Green Version]
- Shitara, K.; Bang, Y.J.; Iwasa, S.; Sugimoto, N.; Ryu, M.H.; Sakai, D.; Chung, H.-C.; Kawakami, H.; Yabusaki, H.; Lee, J.; et al. Trastuzumab deruxtecan in previously treated HER2-positive gastric cancer. N. Engl. J. Med. 2020, 382, 2419–2430. [Google Scholar] [CrossRef] [PubMed]
- Wilke, H.; Muro, K.; Van Cutsem, E.; Oh, S.C.; Bodoky, G.; Shimada, Y.; Hironaka, S.; Sugimoto, N.; Lipatov, O.; Kim, T.-Y.; et al. Ramucirumab plus paclitaxel versus placebo plus paclitaxel in patients with previously treated advanced gastric or gastro-oesophageal junction adenocarcinoma (RAINBOW): A double-blind, randomised phase 3 trial. Lancet Oncol. 2014, 15, 1224–1235. [Google Scholar] [CrossRef]
- Balkwill, F.; Mantovani, A. Inflammation and cancer: Back to Virchow? Lancet 2001, 357, 539–545. [Google Scholar] [CrossRef]
- Urabe, M.; Yamashita, H.; Watanabe, T.; Seto, Y. Comparison of prognostic abilities among preoperative laboratory data indices in patients with resectable gastric and esophagogastric junction adenocarcinoma. World J. Surg. 2018, 42, 185–194. [Google Scholar] [CrossRef]
- Grivennikov, S.I.; Greten, F.R.; Karin, M. Immunity, inflammation, and cancer. Cell 2010, 140, 883–899. [Google Scholar] [CrossRef] [Green Version]
- Ma, E.S.; Wang, Z.X.; Zhu, M.Q.; Zhao, J. Immune evasion mechanisms and therapeutic strategies in gastric cancer. World J. Gastrointest. Oncol. 2022, 14, 216–229. [Google Scholar] [CrossRef]
- Ma, J.Y.; Liu, Q. Clinicopathological and prognostic significance of lymphocyte to monocyte ratio in patients with gastric cancer: A meta-analysis. Int. J. Surg. 2018, 50, 67–71. [Google Scholar] [CrossRef]
- Mellor, K.L.; Powell, A.; Lewis, W.G. Systematic review and meta-analysis of the prognostic significance of neutrophil-lymphocyte ratio (NLR) after R0 gastrectomy for cancer. J. Gastrointest. Cancer. 2018, 49, 237–244. [Google Scholar] [CrossRef] [Green Version]
- Xin-Ji, Z.; Yong-Gang, L.; Xiao-Jun, S.; Xiao-Wu, C.; Dong, Z.; Da-Jian, Z. The prognostic role of neutrophils to lymphocytes ratio and platelet count in gastric cancer: A meta-analysis. Int. J. Surg. 2015, 21, 84–91. [Google Scholar] [CrossRef]
- Page, M.J.; McKenzie, J.E.; Bossuyt, P.M.; Boutron, I.; Hoffmann, T.C.; Mulrow, C.D.; Shamseer, L.; Tetzlaff, J.M.; Akl, E.A.; Brennan, S.E.; et al. The PRISMA 2020 statement: An updated guideline for reporting systematic reviews. Int. J. Surg. 2021, 88, 105906. [Google Scholar] [CrossRef] [PubMed]
- Kalkum, E.; Klotz, R.; Seide, S.; Hüttner, F.J.; Kowalewski, K.F.; Nickel, F.; Khajeh, E.; Knebel, P.; Diener, M.K.; Probst, P. Systematic reviews in surgery-recommendations from the study center of the German society of surgery. Langenbeck’s Arch. Surg. 2021. [Google Scholar] [CrossRef] [PubMed]
- Goossen, K.; Tenckhoff, S.; Probst, P.; Grummich, K.; Mihaljevic, A.L.; Büchler, M.W.; Diener, M.K. Optimal literature search for systematic reviews in surgery. Langenbeck’s Arch. Surg. 2018, 403, 119–129. [Google Scholar] [CrossRef]
- Hayden, J.A.; van der Windt, D.A.; Cartwright, J.L.; Côté, P.; Bombardier, C. Assessing bias in studies of prognostic factors. Ann. Intern. Med. 2013, 158, 280–286. [Google Scholar] [CrossRef]
- Egger, M.; Davey Smith, G.; Schneider, M.; Minder, C. Bias in meta-analysis detected by a simple, graphical test. BMJ 1997, 315, 629–634. [Google Scholar] [CrossRef] [PubMed] [Green Version]
- Tierney, J.F.; Stewart, L.A.; Ghersi, D.; Burdett, S.; Sydes, M.R. Practical methods for incorporating summary time-to-event data into meta-analysis. Trials 2007, 8, 16. [Google Scholar] [CrossRef] [Green Version]
- Rohatgi, A. Webplotdigitizer 2020. Available online: https://automeris.io/WebPlotDigitizer (accessed on 7 July 2020).
- Balduzzi, S.; Rücker, G.; Schwarzer, G. How to perform a meta-analysis with R: A practical tutorial. Evid. Based Ment. Health 2019, 22, 153–160. [Google Scholar] [CrossRef] [Green Version]
- Rücker, G.; Steinhauser, S.; Kolampally, S.; Schwarzer, G. Diagmeta: Meta-Analysis of Diagnostic Accuracy Studies with Several Cutpoints. Available online: https://CRAN.R-project.org/package=diagmeta (accessed on 2 April 2020).
- Team, R.C. R: A Language and Environment for Statistical Computing Vienna, Austria. Available online: https://www.R-project.org/ (accessed on 10 May 2020).
- Steinhauser, S.; Schumacher, M.; Rücker, G. Modelling multiple thresholds in meta-analysis of diagnostic test accuracy studies. BMC Med. Res. Methodol. 2016, 16, 97. [Google Scholar] [CrossRef] [PubMed] [Green Version]
- Aurello, P.; Tierno, S.M.; Berardi, G.; Tomassini, F.; Magistri, P.; D’Angelo, F.; Ramacciato, G. Value of preoperative inflammation-based prognostic scores in predicting overall survival and disease-free survival in patients with gastric cancer. Ann. Surg. Oncol. 2014, 21, 1998–2004. [Google Scholar] [CrossRef]
- Eo, W.K.; Chang, H.J.; Suh, J.; Ahn, J.; Shin, J.; Hur, J.Y.; Kim, G.Y.; Lee, S.; Park, S.; Lee, S. The prognostic nutritional index predicts survival and identifies aggressiveness of gastric cancer. Nutr. Cancer. 2015, 67, 1260–1267. [Google Scholar] [CrossRef]
- Fujiwara, Y.; Fukuda, S.; Tsujie, M.; Kitani, K.; Inoue, K.; Hayashi, T.; Ishikawa, H.; Yukawa, M.; Inoue, M. Outcome predictors for patients with stage II/III gastric cancer who undergo gastrectomy and S-1 adjuvant chemotherapy. Oncol. Lett. 2017, 14, 1621–1627. [Google Scholar] [CrossRef] [Green Version]
- Ishizuka, M.; Oyama, Y.; Abe, A.; Tago, K.; Tanaka, G.; Kubota, K. Prognostic nutritional index is associated with survival after total gastrectomy for patients with gastric cancer. Anticancer Res. 2014, 34, 4223–4229. [Google Scholar] [PubMed]
- Lee, J.Y.; Kim, H.I.; Kim, Y.N.; Hong, J.H.; Alshomimi, S.; An, J.Y.; Cheong, J.-H.; Hyung, W.J.; Noh, S.H.; Kim, C.-B. Clinical significance of the prognostic nutritional index for predicting short- and long-term surgical outcomes after gastrectomy: A retrospective analysis of 7781 gastric cancer patients. Medicine 2016, 95, e3539. [Google Scholar] [CrossRef]
- Lin, J.X.; Lin, L.Z.; Tang, Y.H.; Wang, J.B.; Lu, J.; Chen, Q.Y.; Cao, L.-L.; Lin, M.; Tu, R.-H.; Huang, C.-M.; et al. Which nutritional scoring system is more suitable for evaluating the short- or long-term prognosis of patients with gastric cancer who underwent radical gastrectomy? J. Gastrointest. Surg. 2019, 24, 1969–1977. [Google Scholar] [CrossRef] [PubMed]
- Liu, X.; Qiu, H.; Kong, P.; Zhou, Z.; Sun, X. Gastric cancer, nutritional status, and outcome. OncoTargets Ther. 2017, 10, 2107–2114. [Google Scholar] [CrossRef] [PubMed] [Green Version]
- Luo, Z.; Zhou, L.; Balde, A.I.; Li, Z.; He, L.; ZhenWei, C.; Zou, Z.; Huang, S.; Han, S.; Zhou, M.W.; et al. Prognostic impact of preoperative prognostic nutritional index in resected advanced gastric cancer: A multicenter propensity score analysis. Eur. J. Surg. Oncol. 2019, 45, 425–431. [Google Scholar] [CrossRef]
- Migita, K.; Takayama, T.; Saeki, K.; Matsumoto, S.; Wakatsuki, K.; Enomoto, K.; Tanaka, T.; Ito, M.; Kurumatani, N.; Nakajima, Y. The prognostic nutritional index predicts long-term outcomes of gastric cancer patients independent of tumor stage. Ann. Surg. Oncol. 2013, 20, 2647–2654. [Google Scholar] [CrossRef]
- Sakurai, K.; Ohira, M.; Tamura, T.; Toyokawa, T.; Amano, R.; Kubo, N.; Tanaka, H.; Muguruma, K.; Yashiro, M.; Maeda, K.; et al. Predictive potential of preoperative nutritional status in long-term outcome projections for patients with gastric cancer. Ann. Surg. Oncol. 2016, 23, 525–533. [Google Scholar] [CrossRef]
- Sun, J.; Wang, D.; Mei, Y.; Jin, H.; Zhu, K.; Liu, X.; Zhang, Q.; Yu, J. Value of the prognostic nutritional index in advanced gastric cancer treated with preoperative chemotherapy. J. Surg. Res. 2017, 209, 37–44. [Google Scholar] [CrossRef] [Green Version]
- Jiang, N.; Deng, J.Y.; Ding, X.W.; Ke, B.; Liu, N.; Zhang, R.P.; Liang, H. Prognostic nutritional index predicts postoperative complications and long-term outcomes of gastric cancer. World J. Gastroenterol. 2014, 20, 10537–10544. [Google Scholar] [CrossRef] [PubMed]
- Murakami, Y.; Saito, H.; Kono, Y.; Shishido, Y.; Kuroda, H.; Matsunaga, T.; Fukumoto, Y.; Osaki, T.; Ashida, K.; Fujiwara, Y. Combined analysis of the preoperative and postoperative prognostic nutritional index offers a precise predictor of the prognosis of patients with gastric cancer. Surg Today. 2018, 48, 395–403. [Google Scholar] [CrossRef]
- Nozoe, T.; Ninomiya, M.; Maeda, T.; Matsukuma, A.; Nakashima, H.; Ezaki, T. Prognostic nutritional index: A tool to predict the biological aggressiveness of gastric carcinoma. Surg. Today. 2010, 40, 440–443. [Google Scholar] [CrossRef]
- Pan, Q.X.; Su, Z.J.; Zhang, J.H.; Wang, C.R.; Ke, S.Y. A comparison of the prognostic value of preoperative inflammation-based scores and TNM stage in patients with gastric cancer. OncoTargets Ther. 2015, 8, 1375–1385. [Google Scholar] [CrossRef] [PubMed] [Green Version]
- Saito, H.; Kono, Y.; Murakami, Y.; Kuroda, H.; Matsunaga, T.; Fukumoto, Y.; Osaki, T. Influence of prognostic nutritional index and tumor markers on survival in gastric cancer surgery patients. Langenbeck’s Arch. Surg. 2017, 402, 501–507. [Google Scholar] [CrossRef] [PubMed]
- Song, S.; Liu, H.; Xue, Y. Clinical significance of prognostic nutritional index in patients with advanced gastric cancer. Chin. J. Gastrointest. Surg. 2018, 21, 180–184. [Google Scholar]
- Sun, K.Y.; Xu, J.B.; Chen, S.L.; Yuan, Y.J.; Wu, H.; Peng, J.J.; Chen, C.-Q.; Guo, P.; Hao, Y.-T.; He, Y.-L. Novel immunological and nutritional-based prognostic index for gastric cancer. World J. Gastroenterol. 2015, 21, 5961–5971. [Google Scholar] [CrossRef] [PubMed]
- Zhang, Y.; Zhu, J.Y.; Zhou, L.N.; Tang, M.; Chen, M.B.; Tao, M. Predicting the prognosis of gastric cancer by albumin/globulin ratio and the prognostic nutritional index. Nutr. Cancer 2020, 72, 635–644. [Google Scholar] [CrossRef]
- Hsu, J.T.; Wang, C.C.; Le, P.H.; Chen, T.H.; Kuo, C.J.; Lin, C.J.; Chou, W.-C.; Yeh, T.-S. Lymphocyte-to-monocyte ratios predict gastric cancer surgical outcomes. J. Surg. Res. 2016, 202, 284–290. [Google Scholar] [CrossRef]
- Lin, J.P.; Lin, J.X.; Cao, L.L.; Zheng, C.H.; Li, P.; Xie, J.W.; Wang, J.-B.; Lu, J.; Chen, Q.-Y.; Lin, M.; et al. Preoperative lymphocyte-to-monocyte ratio as a strong predictor of survival and recurrence for gastric cancer after radical-intent surgery. Oncotarget 2017, 8, 79234–79247. [Google Scholar] [CrossRef]
- Lin, J.X.; Lin, J.P.; Xie, J.W.; Wang, J.B.; Lu, J.; Chen, Q.Y.; Cao, L.-l.; Lin, M.; Tu, R.; Zheng, C.-H.; et al. Prognostic importance of the preoperative modified systemic inflammation score for patients with gastric cancer. Gastric Cancer Off. J. Int. Gastric Cancer Assoc. Jpn. Gastric Cancer Assoc. 2018, 22, 403–412. [Google Scholar] [CrossRef] [Green Version]
- Pan, Y.C.; Jia, Z.F.; Cao, D.H.; Wu, Y.H.; Jiang, J.; Wen, S.M.; Zhao, D.; Zhang, S.-L.; Cao, X.-Y. Preoperative lymphocyte-to-monocyte ratio (LMR) could independently predict overall survival of resectable gastric cancer patients. Medicine 2018, 97, e13896. [Google Scholar] [CrossRef] [PubMed]
- Lieto, E.; Galizia, G.; Auricchio, A.; Cardella, F.; Mabilia, A.; Basile, N.; Del Sorbo, G.; Castellano, P.; Romano, C.; Orditura, M.; et al. Preoperative neutrophil to lymphocyte ratio and lymphocyte to monocyte ratio are prognostic factors in gastric cancers undergoing surgery. J. Gastrointest. Surg. 2017, 21, 1764–1774. [Google Scholar] [CrossRef] [PubMed]
- Cheng, C.B.; Zhang, Q.X.; Zhuang, L.P.; Sun, J.W. Prognostic value of lymphocyte-to-C-reactive protein ratio in patients with gastric cancer after surgery: A multicentre study. Jpn. J. Clin. Oncol. 2020, 50, 1141–1149. [Google Scholar] [CrossRef]
- Xu, B.B.; Xu, Y.; Lu, J.; Wu, Y.; Wang, J.B.; Lin, J.X.; Xie, J.-W.; Li, P.; Zheng, C.-H.; Huang, A.-M.; et al. Prognostic significance of combined lymphocyte-monocyte ratio and tumor-associated macrophages in gastric cancer patients after radical resection. J. Cancer. 2020, 11, 5078–5087. [Google Scholar] [CrossRef] [PubMed]
- Chen, L.; Yan, Y.; Zhu, L.; Cong, X.; Li, S.; Song, S.; Song, H.; Xue, Y. Systemic immune-inflammation index as a useful prognostic indicator predicts survival in patients with advanced gastric cancer treated with neoadjuvant chemotherapy. Cancer Manag. Res. 2017, 9, 849–867. [Google Scholar] [CrossRef] [Green Version]
- Guo, J.; Chen, S.; Chen, Y.; Li, S.; Xu, D. Combination of CRP and NLR: A better predictor of postoperative survival in patients with gastric cancer. Cancer Manag. Res. 2018, 10, 315–321. [Google Scholar] [CrossRef] [Green Version]
- Liu, X.; Chen, S.; Liu, J.; Xu, D.; Li, W.; Zhan, Y.; Li, Y.; Chen, Y.; Zhou, Z.; Sun, X. Impact of systemic inflammation on gastric cancer outcomes. PLoS ONE. 2017, 12, e0174085. [Google Scholar] [CrossRef] [Green Version]
- Shi, H.; Jiang, Y.; Cao, H.; Zhu, H.; Chen, B.; Ji, W. Nomogram based on systemic immune-inflammation index to predict overall survival in gastric cancer patients. Disease Mark. 2018, 2018, 1787424. [Google Scholar] [CrossRef] [Green Version]
- Wang, K.; Diao, F.; Ye, Z.; Zhang, X.; Zhai, E.; Ren, H.; Li, T.; Wu, H.; He, Y.; Cai, S.; et al. Prognostic value of systemic immune-inflammation index in patients with gastric cancer. Chin. J. Cancer. 2017, 36, 1–7. [Google Scholar] [CrossRef]
- Lu, J.; Xu, B.B.; Zheng, Z.F.; Xie, J.W.; Wang, J.B.; Lin, J.X.; Chen, Q.-y.; Cao, L.-l.; Lin, M.; Tu, R.-h.; et al. CRP/prealbumin, a novel inflammatory index for predicting recurrence after radical resection in gastric cancer patients: Post hoc analysis of a randomized phase III trial. Gastric Cancer. 2019, 22, 536–545. [Google Scholar] [CrossRef] [Green Version]
- Hirahara, N.; Matsubara, T.; Fujii, Y.; Kaji, S.; Kawabata, Y.; Hyakudomi, R.; Yamamoto, T.; Taniura, T.; Tajima, Y. Comparison of the prognostic value of immunoinflammation-based biomarkers in patients with gastric cancer. Oncotarget 2020, 11, 2625–2635. [Google Scholar] [CrossRef] [PubMed]
- Lin, J.X.; Wang, Z.K.; Huang, Y.Q.; Xie, J.W.; Wang, J.B.; Lu, J.; Chen, Q.-Y.; Lin, M.; Tu, R.-H.; Huang, Z.-N.; et al. Dynamic changes in pre- and postoperative levels of inflammatory markers and their effects on the prognosis of patients with gastric cancer. J. Gastrointest. Surg. 2021, 25, 387–396. [Google Scholar] [CrossRef] [Green Version]
- Chen, L.; Hao, Y.; Zhu, L.; Li, S.; Zuo, Y.; Zhang, Y.; Song, H.; Xue, Y. Monocyte to lymphocyte ratio predicts survival in patients with advanced gastric cancer undergoing neoadjuvant chemotherapy. OncoTargets Ther. 2017, 10, 4007–4016. [Google Scholar] [CrossRef] [PubMed] [Green Version]
- Feng, F.; Sun, L.; Zheng, G.; Liu, S.; Liu, Z.; Xu, G.; Guo, M.; Lian, X.; Fan, D.; Zhang, H. Low lymphocyte-to-white blood cell ratio and high monocyte-to-white blood cell ratio predict poor prognosis in gastric cancer. Oncotarget 2017, 8, 5281–5291. [Google Scholar] [CrossRef] [PubMed] [Green Version]
- Li, S.; Lan, X.; Gao, H.; Li, Z.; Chen, L.; Wang, W.; Song, S.; Wang, Y.; Li, C.; Zhang, H.; et al. Systemic inflammation response index (SIRI), cancer stem cells and survival of localised gastric adenocarcinoma after curative resection. J. Cancer Res. Clin. Oncol. 2017, 143, 2455–2468. [Google Scholar] [CrossRef]
- Chen, L.; Zuo, Y.; Zhu, L.; Zhang, Y.; Li, S.; Ma, F.; Han, Y.; Song, H.; Xue, Y. Peripheral venous blood neutrophil-to-lymphocyte ratio predicts survival in patients with advanced gastric cancer treated with neoadjuvant chemotherapy. OncoTargets Ther. 2017, 10, 2569–2580. [Google Scholar] [CrossRef] [Green Version]
- Ghidini, M.; Donida, B.M.; Totaro, L.; Ratti, M.; Pizzo, C.; Benzoni, I.; Lomiento, D.; Aldighieri, F.; Toppo, L.; Ranieri, V.; et al. Prognostic factors associated with survival in a large cohort of gastric cancer patients resected over a decade at a single Italian center: The Cremona experience. Clin. Trans. Oncol. 2020, 22, 1004–1012. [Google Scholar] [CrossRef]
- Gong, W.; Zhao, L.; Dong, Z.; Dou, Y.; Liu, Y.; Ma, C.; Qu, X. After neoadjuvant chemotherapy platelet/lymphocyte ratios negatively correlate with prognosis in gastric cancer patients. J. Clin. Lab. Anal. 2018, 32, e22364. [Google Scholar] [CrossRef] [Green Version]
- Kim, E.Y.; Lee, J.W.; Yoo, H.M.; Park, C.H.; Song, K.Y. The platelet-to-lymphocyte ratio versus neutrophil-to-lymphocyte ratio: Which is better as a prognostic factor in gastric cancer? Ann. Surg. Oncol. 2015, 22, 4363–4370. [Google Scholar] [CrossRef]
- Lian, L.; Xia, Y.Y.; Zhou, C.; Shen, X.M.; Li, X.L.; Han, S.G.; Zheng, Y.; Mao, Z.-Q.; Gong, F.-R.; Wu, M.-Y.; et al. Application of platelet/lymphocyte and neutrophil/lymphocyte ratios in early diagnosis and prognostic prediction in patients with resectable gastric cancer. Cancer Biomark. Sect. A Dis. Mark. 2015, 15, 899–907. [Google Scholar] [CrossRef]
- Lin, J.X.; Lin, J.P.; Xie, J.W.; Wang, J.B.; Lu, J.; Chen, Q.Y.; Cao, L.-l.; Lin, M.; Tu, R.; Zheng, C.-H.; et al. Prognostic value and association of sarcopenia and systemic inflammation for patients with gastric cancer following radical gastrectomy. Oncologist 2019, 24, e1091–e1101. [Google Scholar] [CrossRef] [PubMed] [Green Version]
- Min, K.W.; Kwon, M.J.; Kim, D.H.; Son, B.K.; Kim, E.K.; Oh, Y.H.; Wi, Y.C. Persistent elevation of postoperative neutrophil-to-lymphocyte ratio: A better predictor of survival in gastric cancer than elevated preoperative neutrophil-to-lymphocyte ratio. Sci. Rep. 2017, 7, 13967. [Google Scholar] [CrossRef] [PubMed]
- Mohri, Y.; Tanaka, K.; Ohi, M.; Yokoe, T.; Miki, C.; Kusunoki, M. Prognostic significance of host- and tumor-related factors in patients with gastric cancer. World J. Surg. 2010, 34, 285–290. [Google Scholar] [CrossRef] [PubMed]
- Mohri, Y.; Tanaka, K.; Toiyama, Y.; Ohi, M.; Yasuda, H.; Inoue, Y.; Kusunoki, M. Impact of preoperative neutrophil to lymphocyte ratio and postoperative infectious complications on survival after curative gastrectomy for gastric cancer: A single institutional cohort study. Medicine 2016, 95, e3125. [Google Scholar] [CrossRef]
- Shimada, H.; Takiguchi, N.; Kainuma, O.; Soda, H.; Ikeda, A.; Cho, A.; Miyazaki, A.; Gunji, H.; Yamamoto, H.; Nagata, M. High preoperative neutrophil-lymphocyte ratio predicts poor survival in patients with gastric cancer. Gastric Cancer 2010, 13, 170–176. [Google Scholar] [CrossRef] [Green Version]
- Sun, X.; Wang, J.; Liu, J.; Chen, S.; Liu, X. Albumin concentrations plus neutrophil lymphocyte ratios for predicting overall survival after curative resection for gastric cancer. OncoTargets Ther. 2016, 9, 4661–4669. [Google Scholar] [CrossRef] [Green Version]
- Szor, D.J.; Roncon Dias, A.; Pereira, M.A.; Ramos, M.; Zilberstein, B.; Cecconello, I.; Ribeiro, U., Jr. Neutrophil-lymphocyte ratio is associated with prognosis in patients who underwent potentially curative resection for gastric cancer. J. Surg. Oncol. 2018, 117, 851–857. [Google Scholar] [CrossRef] [PubMed]
- Ubukata, H.; Motohashi, G.; Tabuchi, T.; Nagata, H.; Konishi, S.; Tabuchi, T. Evaluations of interferon-gamma/interleukin-4 ratio and neutrophil/lymphocyte ratio as prognostic indicators in gastric cancer patients. J. Surg. Oncol. 2010, 102, 742–747. [Google Scholar] [CrossRef]
- Yamamoto, M.; Kurokawa, Y.; Kobayashi, N.; Takahashi, T.; Miyazaki, Y.; Tanaka, K.; Makino, T.; Yamasaki, M.; Nakajima, K.; Mori, M.; et al. Prognostic value of the combined index of plasma fibrinogen and the neutrophil-lymphocyte ratio in gastric cancer. World J. Surgery. 2020, 44, 207–212. [Google Scholar] [CrossRef]
- Zhang, L.X.; Wei, Z.J.; Xu, A.M.; Zang, J.H. Can the neutrophil-lymphocyte ratio and platelet-lymphocyte ratio be beneficial in predicting lymph node metastasis and promising prognostic markers of gastric cancer patients? Tumor maker retrospective study. Int. J. Surg. 2018, 56, 320–327. [Google Scholar] [CrossRef]
- Zhou, D.; Wu, Y.; Lin, Z.; Shi, L.; Zhao, L.; Liu, T.; Yu, D.; Zhang, T. Prognostic value of combination of pretreatment red cell distribution width and neutrophil-to-lymphocyte ratio in patients with gastric cancer. Gastroenterol. Res. Pract. 2018, 2018, 8042838. [Google Scholar] [CrossRef] [PubMed]
- Zhou, X.; Xu, L.; Huang, Z.; Zhang, L.; Zhang, H.; Zhu, W.; Liu, P. The hematologic markers as prognostic factors in patients with resectable gastric cancer. Cancer Biomark. Sect. A Dis. Markers. 2016, 17, 359–367. [Google Scholar] [CrossRef]
- Fang, Y.; Lu, J.; Liu, F.L. Clinical value of preoperative inflammatory parameters in advanced node-negative gastric cancer patients following radical gastrectomy. Int. J. Clin. Exp. Med. 2017, 10, 6780–6790. [Google Scholar]
- Graziosi, L.; Marino, E.; De Angelis, V.; Rebonato, A.; Cavazzoni, E.; Donini, A. Prognostic value of preoperative neutrophils to lymphocytes ratio in patients resected for gastric cancer. Am. J. Surg. 2015, 209, 333–337. [Google Scholar] [CrossRef]
- Hsu, J.T.; Liao, C.K.; Le, P.H.; Chen, T.H.; Lin, C.J.; Chen, J.S.; Chiang, K.-C.; Yeh, T.-S. Prognostic value of the preoperative neutrophil to lymphocyte ratio in resectable gastric cancer. Medicine 2015, 94, e1589. [Google Scholar] [CrossRef] [PubMed]
- Jiang, N.; Deng, J.Y.; Liu, Y.; Ke, B.; Liu, H.G.; Liang, H. The role of preoperative neutrophil-lymphocyte and platelet-lymphocyte ratio in patients after radical resection for gastric cancer. Biomarkers. 2014, 19, 444–451. [Google Scholar] [CrossRef] [PubMed]
- Lee, D.Y.; Hong, S.W.; Chang, Y.G.; Lee, W.Y.; Lee, B. Clinical significance of preoperative inflammatory parameters in gastric cancer patients. J. Gastric Cancer 2013, 13, 111–116. [Google Scholar] [CrossRef]
- Miyatani, K.; Saito, H.; Kono, Y.; Murakami, Y.; Kuroda, H.; Matsunaga, T.; Fukumoto, Y.; Osaki, T.; Ashida, K.; Fujiwara, Y. Combined analysis of the pre- and postoperative neutrophil-lymphocyte ratio predicts the outcomes of patients with gastric cancer. Surg. Today 2018, 48, 300–307. [Google Scholar] [CrossRef]
- Qiu, M.; Zhou, Y.; Jin, Y.; Wei, X.L.; Wang, D.S.; Ren, C.; Bai, L.; Yang, D.-j.; Xu, R.-h. Prognostic effect of high pretreatment neutrophil to lymphocyte ratio on survival of patients with gastric adenocarcinoma in China. Int. J. Biol. Mark. 2015, 30, e96–e103. [Google Scholar] [CrossRef] [PubMed]
- Saito, H.; Kono, Y.; Murakami, Y.; Shishido, Y.; Kuroda, H.; Matsunaga, T.; Fukumoto, Y.; Osaki, T.; Ashida, K.; Fujiwara, Y. Prognostic significance of the preoperative ratio of C-reactive protein to albumin and neutrophil-lymphocyte ratio in gastric cancer patients. World J. Surg. 2018, 42, 1819–1825. [Google Scholar] [CrossRef]
- Yu, L.; Lv, C.Y.; Yuan, A.H.; Chen, W.; Wu, A.W. Significance of the preoperative neutrophil-to-lymphocyte ratio in the prognosis of patients with gastric cancer. World J. Gastroenterol. 2015, 21, 6280–6286. [Google Scholar] [CrossRef] [PubMed]
- Liu, X.C.; Sun, X.W.; Liu, J.J.; Kong, P.F.; Chen, S.X.; Zhan, Y.Q.; Xu, D. Preoperative C-reactive protein/albumin ratio predicts prognosis of patients after curative resection for gastric cancer. Trans. Oncol. 2015, 8, 339–345. [Google Scholar] [CrossRef] [PubMed] [Green Version]
- Saito, H.; Kono, Y.; Murakami, Y.; Shishido, Y.; Kuroda, H.; Matsunaga, T.; Fukumoto, Y.; Osaki, T.; Ashida, K.; Fujiwara, Y. Prognostic significance of platelet-based inflammatory indicators in patients with gastric cancer. World J. Surg. 2018, 42, 2542–2550. [Google Scholar] [CrossRef] [PubMed]
- Onodera, T.; Goseki, N.; Kosaki, G. Prognostic nutritional index in gastrointestinal surgery of malnourished cancer patients. Nihon Geka Gakkai Zasshi. 1984, 85, 1001–1005. [Google Scholar]
- Moons, K.G.; Royston, P.; Vergouwe, Y.; Grobbee, D.E.; Altman, D.G. Prognosis and prognostic research: What, why, and how? BMJ 2009, 338, b375. [Google Scholar] [CrossRef]
- Royston, P.; Moons, K.G.; Altman, D.G.; Vergouwe, Y. Prognosis and prognostic research: Developing a prognostic model. BMJ 2009, 338, b604. [Google Scholar] [CrossRef]
- Moons, K.G.; Kengne, A.P.; Woodward, M.; Royston, P.; Vergouwe, Y.; Altman, D.G.; Grobbee, D.E. Risk prediction models: I. Development, internal validation, and assessing the incremental value of a new (bio)marker. Heart 2012, 98, 683–690. [Google Scholar] [CrossRef] [Green Version]
- Grobbee, D.; Hoes, A. Clinical Epidemiology: Principles, Methods, and Applications for Clinical Research; Jones & Bartlett Publishers: Burlington, MA, USA, 2008. [Google Scholar]
- Steyerberg, E. Clinical Prediction Models: A Practical Approach to Development, Validation and Updating; Springer: New York, NY, USA, 2009; Volume 28, p. 500. [Google Scholar]
- Altman, D.G.; Vergouwe, Y.; Royston, P.; Moons, K.G. Prognosis and prognostic research: Validating a prognostic model. BMJ 2009, 338, b605. [Google Scholar] [CrossRef]
- Moons, K.G.; Kengne, A.P.; Grobbee, D.E.; Royston, P.; Vergouwe, Y.; Altman, D.G.; Woodward, M. Risk prediction models: II. External validation, model updating, and impact assessment. Heart 2012, 98, 691–698. [Google Scholar] [CrossRef]
- Li, Z.; Li, S.; Ying, X.; Zhang, L.; Shan, F.; Jia, Y.; Ji, J. The clinical value and usage of inflammatory and nutritional markers in survival prediction for gastric cancer patients with neoadjuvant chemotherapy and D2 lymphadenectomy. Gastric Cancer 2020, 23, 540–549. [Google Scholar] [CrossRef] [Green Version]
- Liu, Z.; Liang, Y.; Tang, X.; Qu, H. Decrease in blood neutrophil-to-lymphocyte ratio indicates better survival after neoadjuvant chemotherapy in patients with advanced gastric cancer. Front. Surg. 2021, 8, 745748. [Google Scholar] [CrossRef]
- Radulescu, D.; Baleanu, V.D.; Padureanu, V.; Radulescu, P.M.; Bordu, S.; Patrascu, S.; Socea, B.; Bacalbasa, N.; Surlin, M.V.; Georgescu, I.; et al. Neutrophil/Lymphocyte ratio as predictor of anastomotic leak after gastric cancer surgery. Diagnostics 2020, 10, 799. [Google Scholar] [CrossRef]
- Chen, G.; Wang, J.; Chen, K.; Kang, M.; Zhang, H.; Jin, X.; Lin, L.; Chen, J. Relationship between postoperative complications and the prognosis of gastric carcinoma patients who underwent surgical resection: A systematic review and meta-analysis. Cancer Control 2021, 28, 10732748211011955. [Google Scholar] [CrossRef]

| Blood Cell Ratio | Calculation | Hypothesized Association |
|---|---|---|
| PLR | Platelets/lymphocytes | Low ratio with long survival |
| NLR | Neutrophiles/lymphocytes | Low ratio with long survival |
| MLR | Monocytes/lymphocytes | Low ratio with long survival |
| LMR | Lymphocytes/monocytes | High ratio with long survival |
| PNI | (10 × albumin) + (0.005 × lymphocytes) | High ratio with long survival |
| SII | Platelets × neutrophils/lymphocytes | Low ratio with long survival |
| Study | Patients | Survival Type | Study Participation | Study Attrition | Prognostic Factor Measurement | Outcome Measurement | Study Confounding | Statistical Analysis and Reporting | Investigated Blood Cell Ratio (Cut-Off) |
|---|---|---|---|---|---|---|---|---|---|
| Aurello 2014 [22] | 102 | OS, DFS | low | moderate | moderate | moderate | low | moderate | PNI (45), NLR (5) |
| Eo 2015 [23] | 314 | OS, DFS, OR | low | high | moderate | moderate | moderate | low | PNI (47.3) |
| Fujiwara 2016 [24] | 62 | OS | moderate | high | moderate | moderate | high | moderate | PNI (48) |
| Ishizuka 2014 [25] | 154 | OS | moderate | high | moderate | moderate | high | moderate | PNI (45), NLR (2.6) |
| Lee 2016 [26] | 7781 | OS, DFS | low | moderate | moderate | low | moderate | low | PNI (46.7), NLR (2.43) |
| Lin 2019 [27] | 2182 | OS | low | moderate | moderate | low | high | low | PNI (46.7) |
| Liu 2017 [28] | 1330 | OS | low | moderate | low | low | moderate | low | PNI (45) |
| Luo 2019 [29] | 128 | OS, DFS | low | high | high | moderate | low | low | PNI (50) |
| Migita 2013 [30] | 548 | OS, OR | low | high | moderate | moderate | high | low | PNI (48) |
| Sakurai, K. 2015 [31] | 594 | OS | moderate | high | moderate | moderate | high | low | PNI (45) |
| Sun 2017 [32] | 117 | OS, OR | moderate | moderate | moderate | low | low | moderate | PNI (45) |
| Jiang 2014 [33] | 377 | OR | low | moderate | moderate | moderate | low | moderate | PNI (46) |
| Murakami 2017 [34] | 254 | OR | moderate | high | moderate | moderate | high | moderate | PNI (52) |
| Nozoe 2009 [35] | 248 | OR | low | moderate | moderate | high | high | high | PNI (49.7) |
| Pan 2015 [36] | 207 | OR | moderate | low | moderate | low | moderate | moderate | PNI (45), NLR (4) |
| Saito 2017 [37] | 453 | OR | moderate | high | moderate | moderate | high | moderate | PNI (46,7) |
| Song 2018 [38] | 1150 | OR | unclear | unclear | unclear | unclear | unclear | unclear | PNI (51.81) |
| Sun 2015 [39] | 632 | OR | moderate | moderate | moderate | moderate | moderate | high | PNI (48.2) |
| Zhang 2020 [40] | 273 | OS, DFS | moderate | high | moderate | moderate | moderate | moderate | PNI (41.25), NLR (3.32), PLR (185.8) |
| Hsu 2016 [41] | 926 | OS, OR | moderate | moderate | moderate | moderate | high | moderate | LMR (4.8) |
| Lin 2017 [42] | 452 | OS, DFS | low | moderate | moderate | low | moderate | low | LMR (3.15) |
| Lin 2018 [43] | 1786 | OS | low | moderate | moderate | low | moderate | low | LMR (3.4), NLR (4), PLR (161.3) |
| Pan 2018 [44] | 870 | OS, OR | moderate | moderate | moderate | low | low | moderate | LMR (5.43), NLR (1.44), PLR (115) |
| Lieto 2017 [45] | 297 | DFS, OR | low | moderate | moderate | low | low | moderate | LMR (3.37), NLR (3.22) |
| Cheng 2020 [46] | 607 | OS | moderate | moderate | moderate | moderate | high | moderate | LMR (3.91), NLR (3.41), PLR (141.3) |
| Xu 2020 [47] | 401 | OS, DFS | low | moderate | moderate | low | moderate | moderate | LMR (3.15) |
| Chen 2017 [48] | 292 | OS, DFS | low | moderate | moderate | low | moderate | moderate | SII (600), MLR (0.17), NLR (1.65), PLR (133) |
| Guo 2018 [49] | 1058 | OS | low | moderate | high | moderate | moderate | moderate | SII (521.6), NLR (2.5), PLR (152) |
| Liu 2017 [50] | 1056 | OS | low | moderate | moderate | moderate | moderate | low | NLR (2), PLR (130) |
| Shi 2018 [51] | 688 | OS | low | moderate | moderate | moderate | moderate | low | SII (320), MLR (0.23), NLR (1.30), PLR (135) |
| Wang 2017 [52] | 444 | OS | moderate | moderate | moderate | moderate | moderate | moderate | SII (660), NLR (2.1), PLR (120) |
| Lu 2018 [53] | 401 | DFS | low | moderate | moderate | low | unclear | low | SII (784.7), NLR (3.1), PLR (133.2) |
| Hirahara 2020 [54] | 412 | OS | low | moderate | moderate | moderate | moderate | moderate | SII (661.9), NLR (2.529), PLR (212.1) |
| Lin 2020 [55] | 2257 | OS | moderate | moderate | moderate | moderate | high | moderate | SII (569.93) |
| Chen 2017 [56] | 91 | OS, DFS | moderate | moderate | moderate | low | low | moderate | MLR (0,27) |
| Feng 2017 [57] | 1621 | OS | moderate | moderate | moderate | moderate | moderate | moderate | MLR (0.19), NLR (2,6), PLR (130.7) |
| Li 2017 [58] | 455 | DFS | low | moderate | moderate | moderate | moderate | moderate | MLR (0.22), NLR (2.10) |
| Chen 2017 [59] | 91 | OS, DFS | low | moderate | moderate | low | moderate | moderate | NLR (2.17) |
| Ghidini 2019 [60] | 186 | OS | moderate | high | high | moderate | high | moderate | NLR (2.54) |
| Gong 2017 [61] | 91 | OS | low | moderate | moderate | high | moderate | moderate | NLR (1.44), PLR (161) |
| Kim 2015 [62] | 1986 | OS | low | high | moderate | moderate | moderate | moderate | NLR (1.99), PLR (126) |
| Lian 2015 [63] | 162 | OS, DFS | low | high | low | moderate | high | moderate | NLR (4.02), PLR (208) |
| Lin 2019 [64] | 1167 | OS | low | low | moderate | moderate | moderate | low | NLR (2.6), PLR (160.7) |
| Min 2017 [65] | 734 | OS, OR | low | high | moderate | moderate | high | low | NLR (3) |
| Mohri 2010 [66] | 357 | OS, OR | low | high | low | moderate | low | moderate | NLR (2.2) |
| Mohri 2016 [67] | 404 | OS | moderate | moderate | moderate | low | high | moderate | NLR (3) |
| Shimada 2010 [68] | 1028 | OS, OR | moderate | moderate | moderate | high | high | moderate | NLR (4) |
| Sun 2016 [69] | 873 | OS | low | moderate | moderate | moderate | moderate | moderate | NLR (2.3), PLR (117) |
| Szor 2018 [70] | 383 | OS, DFS | low | high | moderate | high | moderate | moderate | NLR (2,44) |
| Ubukata 2010 [71] | 157 | OS, OR | low | high | moderate | moderate | moderate | moderate | NLR (5) |
| Yamamoto 2019 [72] | 666 | OS, DFS, OR | moderate | high | moderate | moderate | high | moderate | NLR (2,5) |
| Zhang 2018 [73] | 904 | OS, OR | moderate | moderate | moderate | high | high | moderate | NLR (2), PLR (160) |
| Zhou 2018 [74] | 103 | OS, DFS | moderate | moderate | moderate | moderate | moderate | moderate | NLR (2,76) |
| Zhou 2016 [75] | 451 | OS | moderate | high | moderate | high | moderate | moderate | NLR (2,76), PLR (167) |
| Fang 2017 [76] | 190 | OR | high | low | moderate | low | moderate | high | NLR (2) |
| Graziosi 2015 [77] | 156 | OR | low | moderate | moderate | low | high | high | NLR (2.34) |
| Hsu 2015 [78] | 1030 | OR | moderate | moderate | moderate | moderate | high | moderate | NLR (3.44), PLR (132) |
| Jiang 2014 [79] | 377 | OR | low | moderate | moderate | moderate | low | moderate | NLR (1.44), PLR (184) |
| Lee 2013 [80] | 220 | OR | moderate | high | moderate | high | high | high | NLR (2.15) |
| Miyatani 2017 [81] | 280 | OR | moderate | high | high | high | high | moderate | NLR (2,7) |
| Qiu 2015 [82] | 706 | OR | moderate | high | high | moderate | moderate | moderate | NLR (3) |
| Saito 2017 [83] | 453 | OR | moderate | high | moderate | moderate | high | moderate | NLR (2.43) |
| Yu 2015 [84] | 291 | OR | low | moderate | moderate | moderate | moderate | moderate | NLR (3,5) |
| Liu 2015 [85] | 455 | OS | low | high | moderate | moderate | high | moderate | SII (660), PLR (180) |
| Saito 2018 [86] | 453 | OR | moderate | high | moderate | moderate | high | moderate | PLR (173.3) |
| OS | DFS | 5-Year Survival Rate | |
|---|---|---|---|
| PNI | |||
| Significant studies | 10/12 (83%) | 5/5 (100%) | 10/10 (100%) |
| Used cut-offs | 50, 48 (1 sign., 1 not sign.), 47.3, 46.7, 46, 45 (4 sign., 1 not sign.), 41.25 | 50, 47.3, 46.7, 45, 41.25 | 52, 51.81, 49.7, 48.2, 47.3, 46.7, 46, 45 (2x) |
| Meta-regression for cut-off | p = 0.026 | p = 0.032 | p = 0.284 |
| SROC | not possible | ||
| Suggested cut-off based on this analysis | 45 | ||
| LMR | |||
| Significant studies/ total studies (%) | 6/6 (100%) | 3/3 (100%) | 3/3 (100%) |
| Used cut-offs | 5.43, 4.8, 3.91, 3.4, 3.15 (2x) | 3.37, 3.15 (2x) | 5.43, 4.8, 3.37 |
| Meta-regression for cut-off | p = 0.253 | p = 0.853 | p = 0.020 |
| SROC | not possible | ||
| Suggested cut-off based on this analysis | 5.43 | ||
| SII | |||
| Significant studies/ total studies (%) | 7/7 (100%) | 2/2 (100%) | n/a |
| Used cut-offs | 320, 521.6, 569.93, 600, 660 (2x), 661.9, | 600, 784.7 | n/a |
| Meta-regression for cut-off | p = 0.171 | n/a | n/a |
| SROC | not possible | ||
| Suggested cut-off based on this analysis | 320 | ||
| MLR | |||
| Significant studies/ total studies (%) | 2/4 (50%) | 1/3 (33%) | n/a |
| Used cut-offs | 0.17, 0.19, 0.23, 0.27 | 0.17, 0.22, 0.27 | n/a |
| Meta-regression for cut-off | p = 0.695 | p = 0.660 | n/a |
| SROC | not possible | ||
| Suggested cut-off based on this analysis | 0.9 | ||
| NLR | |||
| Significant studies/ total studies (%) | 27/30 (90%) | 9/11 (82%) | 15/18 (83%) |
| Used cut-offs | 1.3, 1.44 (1 sign., 1 not sign.), 1.65, 1.99, 2 (2x), 2.1, 2.17, 2.2, 2.3, 2.44, 2.5 (2x), 2.529, 2.54, 2.6 (3x), 2.76, 3 (2x), 3.32, 4 (2x), 4.02, 5 (2x) | 1.65, 2.1, 2.17, 2.44, 2.5, 2.76, 3.1, 3.22, 3.32, 4.02, 5 | 1.44 (2x), 2 (1 sign, 1 not sign.), 2.15, 2.2, 2.34, 2.43, 2.5, 2.7, 3 (1 sign, 1 not sign,), 3.22, 3.44, 3.5, 4, 5 |
| Meta-regression for cut-off | p = 0.002 | p = 0.006 | p = 0.001 |
| SROC | Optimal cut-off of 4.506 | ||
| Suggested cut-off based on this analysis | 4.5 | ||
| PLR | |||
| Significant studies/ total studies (%) | 18/19 (94%) | 3/5 (60%) | 4/4 (100%) |
| Used cut-offs | 115, 117, 120, 126, 130, 130.7, 133, 135, 141.3, 152, 160, 160.7, 161, 161.3 167, 180, 185.8, 208, 212,1 | 126, 133, 133.2, 185.8, 208 | 115, 132, 173.3, 184 |
| Meta-regression for cut-off | p = 0.144 | p = 0.659 | p = 0.629 |
| SROC | Optimal cut-off of 152.47 | ||
| Suggested cut-off based on this analysis | 152 | ||
| Blood Cell Ratio | Recommended Cut-Off | Grade of Recommendation |
|---|---|---|
| PNI | 45 | HIGH |
| LMR | 5.43 | MODERATE |
| SII | 320 | MODERATE |
| MLR | 0.19 | LOW |
| NLR | 4.5 | HIGH |
| PLR | 152 | HIGH |
Publisher’s Note: MDPI stays neutral with regard to jurisdictional claims in published maps and institutional affiliations. |
© 2022 by the authors. Licensee MDPI, Basel, Switzerland. This article is an open access article distributed under the terms and conditions of the Creative Commons Attribution (CC BY) license (https://creativecommons.org/licenses/by/4.0/).
Share and Cite
Schiefer, S.; Wirsik, N.M.; Kalkum, E.; Seide, S.E.; Nienhüser, H.; Müller, B.; Billeter, A.; Büchler, M.W.; Schmidt, T.; Probst, P. Systematic Review of Prognostic Role of Blood Cell Ratios in Patients with Gastric Cancer Undergoing Surgery. Diagnostics 2022, 12, 593. https://doi.org/10.3390/diagnostics12030593
Schiefer S, Wirsik NM, Kalkum E, Seide SE, Nienhüser H, Müller B, Billeter A, Büchler MW, Schmidt T, Probst P. Systematic Review of Prognostic Role of Blood Cell Ratios in Patients with Gastric Cancer Undergoing Surgery. Diagnostics. 2022; 12(3):593. https://doi.org/10.3390/diagnostics12030593
Chicago/Turabian StyleSchiefer, Sabine, Naita Maren Wirsik, Eva Kalkum, Svenja Elisabeth Seide, Henrik Nienhüser, Beat Müller, Adrian Billeter, Markus W. Büchler, Thomas Schmidt, and Pascal Probst. 2022. "Systematic Review of Prognostic Role of Blood Cell Ratios in Patients with Gastric Cancer Undergoing Surgery" Diagnostics 12, no. 3: 593. https://doi.org/10.3390/diagnostics12030593