
Designing an Interpretability-Based Model to Explain the Artificial Intelligence Algorithms in Healthcare


Abstract
:1. Introduction
2. Motivation
3. Background: Statistics and Probability Techniques
3.1. Locally Interpretable Model-Agnostic Explanations (LIME)
3.2. Deep Learning Important FeaTures or DeepLIFT
3.3. Definition of Concepts
4. State of the Art
4.1. Related Works
4.2. Bayesian Nonparametric Approach
4.2.1. GAM
4.2.2. MAPLE
4.2.3. Anchors
4.2.4. SHAP
4.2.5. Perturbation-Based Methods
4.2.6. Attention Based
4.2.7. Concept Vectors
4.2.8. Similar Images
4.2.9. Textual Justification
4.2.10. Intrinsic Explainability
4.2.11. Recurrent Neural Network (RNN)
4.3. Limits of the Existing Solutions
5. The Interpretability-Based Model


5.1. Dataset Requirements
5.2. Defining the Variables
5.3. Relative Weights as Ranking
5.4. Creating the Explanations
6. Validating the Interpretability-Based Model
6.1. Validating Our Model to Interpret the Predictions of the Neural-Networks Model
- (1)
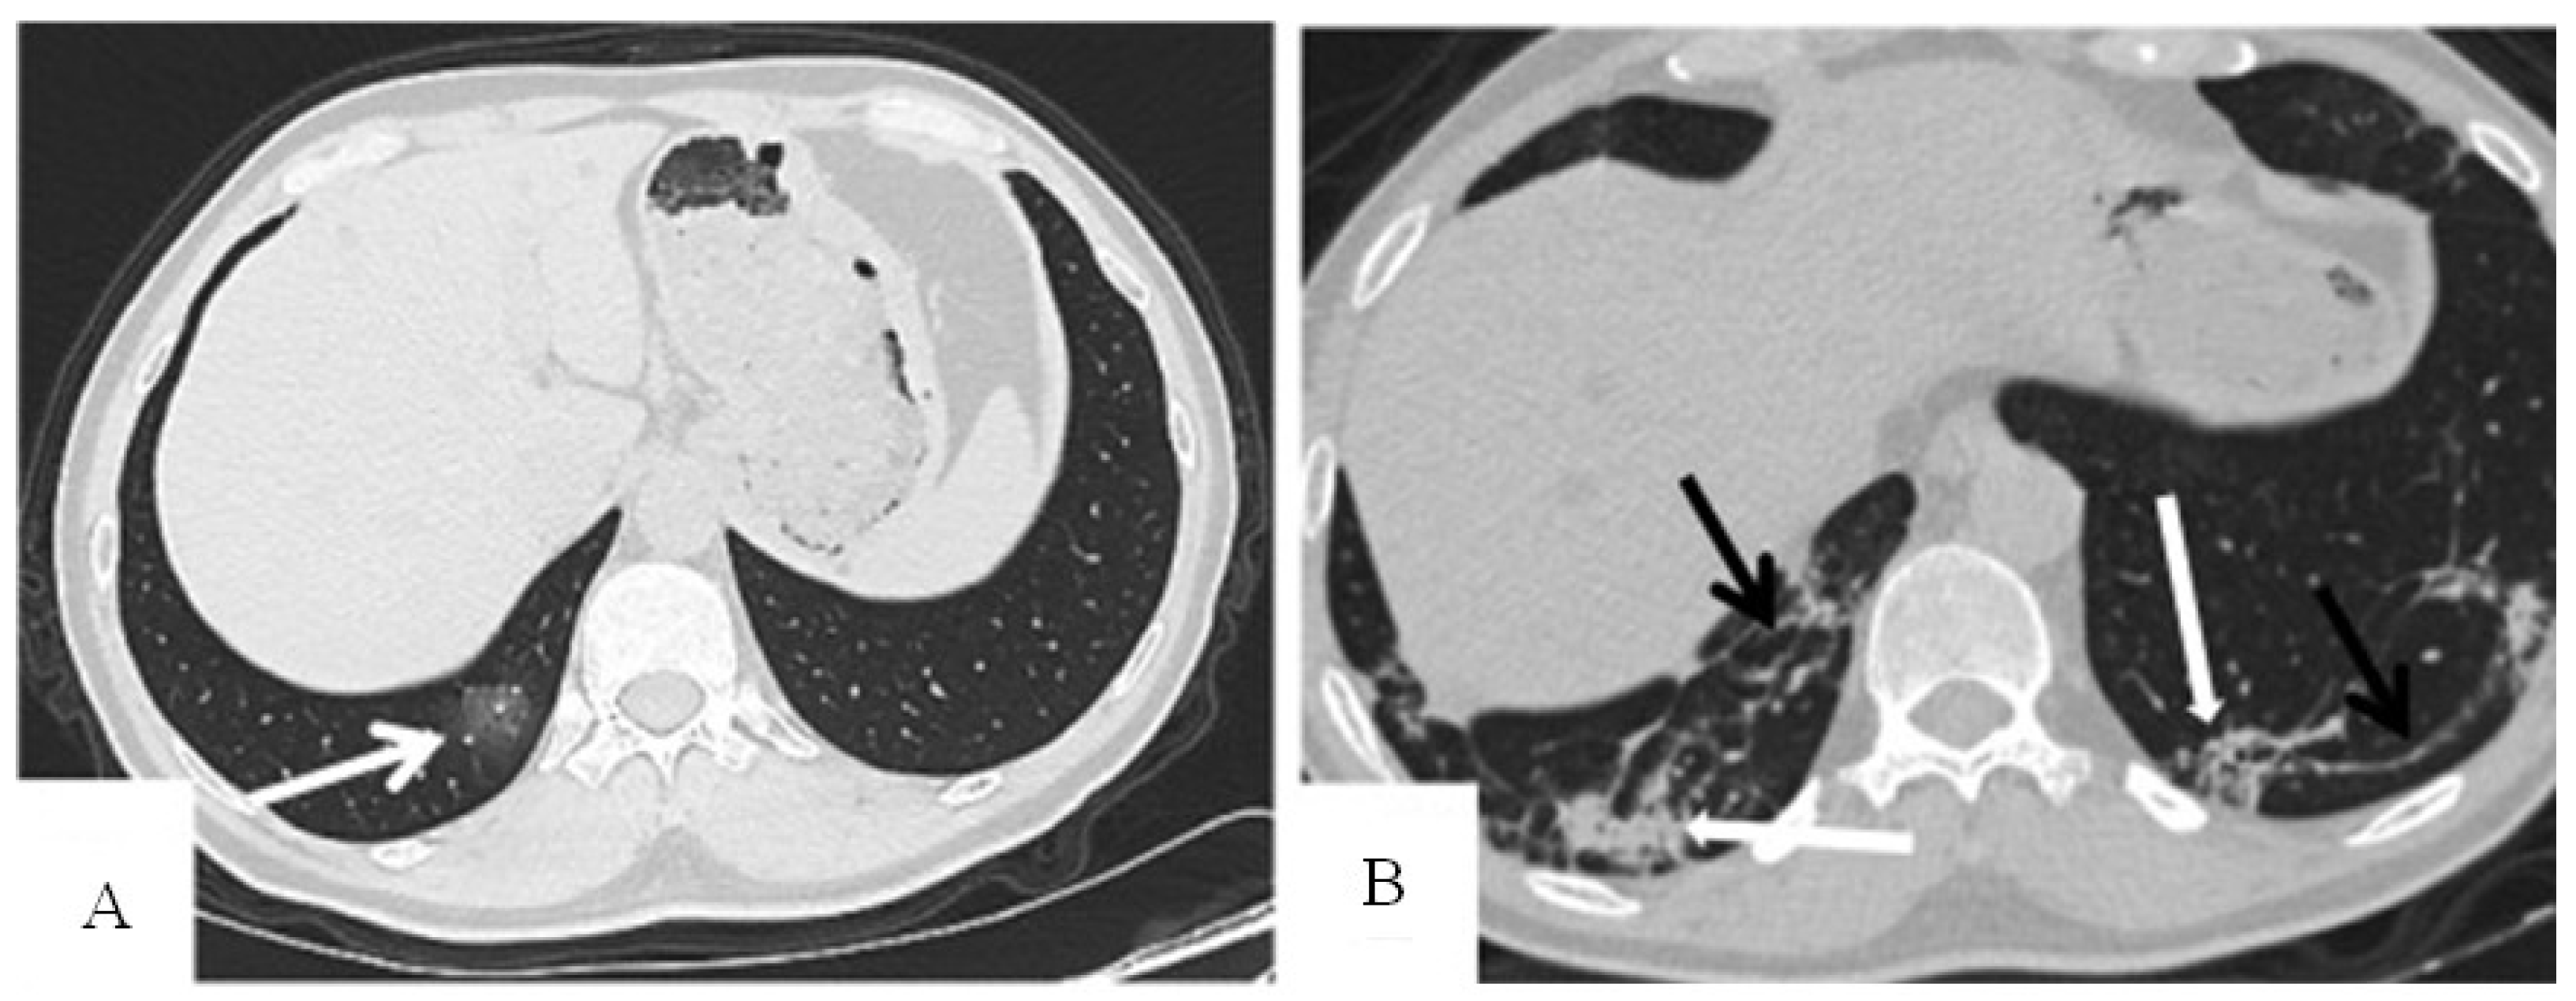
- Define the variables of the explanation set: distribution of pulmonary lesions (no lesion, peripheral, central, diffuse), involvement of the lung (no involvement, single lobe, unilateral multilobe, bilateral multilobe), GGO, crazy-paving pattern, consolidation, linear opacities, air bronchogram, cavitation, bronchiectasis, pleural effusion, pericardial effusion, lymphadenopathy, and pneumothorax.
- (2)
- Train the dataset by finding the relative weights of the variables as shown in Table 4 and generating all the probable explanations for the patient by finding the sum of the related relative weights and calculating the positive and negative probabilities using the following formulas:

| Variable or Feature | Relative Weight (= |
|---|---|
| Distribution of pulmonary lesions | |
| No lesion | 3.2% |
| Peripheral | 13.1% |
| Central | 0.3% |
| Diffuse | 5.2% |
| Involvement of the lung | |
| No involvement | 3.2% |
| Single lobe | 5% |
| Unilateral multilobe | 0.4% |
| Bilateral multilobe | 13.5% |
| GGO | 18.5% |
| Crazy-paving pattern | 10% |
| Consolidation | 9.4% |
| Linear opacities | 7.3% |
| Air bronchogram | 6.3% |
| Cavitation | 0% |
| Bronchiectasis | 4.4% |
| Pleural effusion | 2.8% |
| Pericardial effusion | 0.3% |
| Lymphadenopathy | 0% |
| Pneumothorax | 0.3% |
6.2. Validating Our Model to Interpret the Predictions of the Rules-Based Models
- 1.
- Define the variables of the explanation model which will be the symptoms: Fever, Dizziness, Palpitation, Throat pain, Nausea and vomiting, Headache, Abdominal pain and diarrhea, Expectoration, Dyspnea, Myalgia, Chest distress, Fatigue, and Dry Cough.
- 2.
- Train the dataset by calculating the relative weights for the variables by dividing the ratio weight of each symptom by the sum of all weights, as shown in Table 6, and generate the explanations for the patient by finding the sum of the related relative weights and the positive and negative probabilities:
- 3.
- −LR + = relative weights of the variables
- 4.
- +LR = 1 − (−LR)
| Variable or Symptom | Relative Weight (= |
|---|---|
| Dizziness | 0.7% |
| Palpitation | 0.7% |
| Throat pain | 1.4% |
| Nausea and vomiting | 1.4% |
| High-grade fever (>39.0) | 2.5% |
| Headache | 2.9% |
| Abdominal pain and diarrhea | 5% |
| Expectoration | 5.4% |
| Dyspnea | 6.5% |
| Myalgia | 6.5% |
| Chest distress | 8.6% |
| Moderate-grade fever (38.1–39.0) | 11.1% |
| Fatigue | 13.6% |
| Low-grade fever (37.3–38.0) | 16.5% |
| Dry Cough | 17.2% |
| Algorithm 1: Interpretability algorithm for training the dataset of the neural-network models |
| 1. Input: the characteristics of the affected parts of the organ as per the medical image |
| 2. Variables = the set of the characteristics of the affected parts of the organ |
| /*3. For each variable assign a relative weight*/ |
| /*4. Generate the probabilities of having the disease*/ |
| −LR + = relative weights of the variables |
| +LR = 1 − (−LR) |
| 5. Output: the positive and negative probabilities in addition to the relative weights of the variable |
| End |
| Algorithm 2: Interpretability algorithm for training the dataset of the rules-based models |
| 1. Input: the symptoms of the patient variable |
| 2. Variables = the set of symptoms |
| /*3. For each symptom assign a relative weight*/ |
| /*4. Generate the probabilities of having the disease*/ |
| −LR + = relative weights of the variables |
| +LR = 1 − (−LR) |
| 5. Output: the positive and negative probabilities in addition to the relative weights of the variable |
| End |
7. Discussion
8. Conclusions and Future Works
Author Contributions
Funding
Institutional Review Board Statement
Informed Consent Statement
Data Availability Statement
Conflicts of Interest
References
- Sun, Y.; Liang, D.; Wang, X.; Tang, X. DeepID3: Face Recognition with Very Deep Neural Networks. arXiv 2015, arXiv:1502.00873. [Google Scholar]
- Taigman, Y.; Yang, M.; Ranzato, M.; Wolf, L. DeepFace: Closing the Gap to Human-Level Performance in Face Verification. In Proceedings of the 2014 IEEE Conference on Computer Vision and Pattern Recognition Workshops, Columbus, OH, USA, 23–28 June 2014; pp. 1701–1708. [Google Scholar]
- Tobiyama, S.; Yamaguchi, Y.; Shimada, H.; Ikuse, T.; Yagi, T. Malware Detection with Deep Neural Network Using Process Behavior. In Proceedings of the 2016 IEEE 40th Annual Computer Software and Applications Conference, Atlanta, GA, USA, 10–14 June 2016; pp. 577–582. [Google Scholar] [CrossRef]
- Ibrahim, M.; Louie, M.; Modarres, C.; Paisley, J.W. Global Explanations of Neural Networks: Mapping the Landscape of Predictions. In Proceedings of the 2019 AAAI/ACM Conference on AI, Ethics, and Society, Honolulu, HI, USA, 27–28 January 2019. [Google Scholar]
- Kästner, C. Interpretability and Explainability. Available online: https://ckaestne.medium.com/interpretability-and-explainability-a80131467856 (accessed on 2 April 2022).
- Loyola-González, O. Black-Box vs. White-Box: Understanding Their Advantages and Weaknesses from a Practical Point of View. IEEE Access 2019, 7, 154096–154113. [Google Scholar] [CrossRef]
- Cao, N.; Yan, X.; Shi, Y.; Chen, C. AI-Sketcher: A Deep Generative Model for Producing High-Quality Sketches. In Proceedings of the AAAI Conference on Artificial Intelligence, Honolulu, HI, USA, 27 January–1 February 2019; Volume 33, pp. 2564–2571. [Google Scholar] [CrossRef]
- Shouling, J.; Jinfeng, L.; Tianyu, D.; Bo, L. Survey on Techniques, Applications and Security of Machine Learning Interpretability. J. Comput. Res. Dev. 2019, 56, 2071. [Google Scholar]
- Likelihood Ratio (Medicine): Basic Definition, Interpretation. Available online: https://www.statisticshowto.com/likelihood-ratio/ (accessed on 30 March 2022).
- Ahmad, M.A.; Eckert, C.; Teredesai, A. Interpretable Machine Learning in Healthcare. In Proceedings of the 2018 ACM International Conference on Bioinformatics, Computational Biology, and Health Informatics, Washington, DC, USA, 29 August–1 September 2018; pp. 559–560. [Google Scholar]
- Hleg, A. Ethics Guidelines for Trustworthy AI. B-1049 Brussels 2019. Available online: https://digital-strategy.ec.europa.eu/en/library/ethics-guidelines-trustworthy-ai (accessed on 3 April 2022).
- Junjie, W.U.; Guannan, L.I.U.; Jingyuan, W.; Yuan, Z.U.O.; Hui, B.U.; Hao, L.I.N. Data Intelligence: Trends and Challenges. Syst. Eng. Theory Pract. 2020, 40, 2116–2149. [Google Scholar] [CrossRef]
- Ribeiro, M.T.; Singh, S.; Guestrin, C. “Why Should I Trust You?”: Explaining the Predictions of Any Classifier. In Proceedings of the 22nd ACM SIGKDD International Conference on Knowledge Discovery and Data Mining, San Francisco, CA, USA, 13–17 August 2016; Association for Computing Machinery: New York, NY, USA, 2016; pp. 1135–1144. [Google Scholar]
- Shrikumar, A.; Greenside, P.; Kundaje, A. Learning Important Features Through Propagating Activation Differences. arXiv 2017, arXiv:1704.02685. [Google Scholar]
- Nurminen, J.; Rusanen, A.-M. Chapter 4: Should We Know How AI Works. Available online: https://ethics-of-ai.mooc.fi/chapter-4/2-what-is-transparency (accessed on 3 April 2022).
- Yanhong, L. Research on the Interpretability of Artificial Intelligence and the Legal Liability of AI. Available online: https://practiceguides.chambers.com/practice-guides/artificial-intelligence-2022/china/trends-and-developments/O10958 (accessed on 1 April 2022).
- Doshi-Velez, F.; Kim, B. Towards A Rigorous Science of Interpretable Machine Learning. arXiv 2017, arXiv:1702.08608. [Google Scholar]
- Guidotti, R.; Monreale, A.; Ruggieri, S.; Turini, F.; Giannotti, F.; Pedreschi, D. A Survey of Methods for Explaining Black Box Models. ACM Comput. Surv. 2018, 51. [Google Scholar] [CrossRef] [Green Version]
- Wu, M.; Parbhoo, S.; Hughes, M.; Kindle, R.; Celi, L.; Zazzi, M.; Roth, V.; Doshi-Velez, F. Regional Tree Regularization for Interpretability in Deep Neural Networks. In Proceedings of the AAAI Conference on Artificial Intelligence, New York, NY, USA, 7–12 February 2020; Volume 34, pp. 6413–6421. [Google Scholar] [CrossRef]
- Deng, H. Interpreting Tree Ensembles with InTrees. Int. J. Data Sci. Anal. 2014, 7, 277–287. [Google Scholar] [CrossRef] [Green Version]
- Puri, N.; Gupta, P.; Agarwal, P.; Verma, S.; Krishnamurthy, B. MAGIX: Model Agnostic Globally Interpretable Explanations. arXiv 2017, arXiv:1706.07160. [Google Scholar]
- El Shawi, R.; Sherif, Y.; Al-Mallah, M.; Sakr, S. Interpretability in HealthCare A Comparative Study of Local Machine Learning Interpretability Techniques. In Proceedings of the 2019 IEEE 32nd International Symposium on Computer-Based Medical Systems (CBMS), Cordoba, Spain, 5–7 June 2019; pp. 275–280. [Google Scholar]
- Ribeiro, M.T.; Singh, S.; Guestrin, C. Anchors: High-Precision Model-Agnostic Explanations. In Proceedings of the AAAI Conference on Artificial Intelligence, New Orleans, LA, USA, 2–7 February 2018; Volume 32. [Google Scholar] [CrossRef]
- Shapley, L.S. A Value for n-Person Games. In Contributions to the Theory of Games (AM-28); Kuhn, H.W., Tucker, A.W., Eds.; Princeton University Press: Princeton, NJ, USA, 2016; Volume II, pp. 307–318. [Google Scholar]
- Strumbelj, E.; Kononenko, I. A General Method for Visualizing and Explaining Black-Box Regression Models. In Proceedings of the International Conference on Adaptive and Natural Computing Algorithms, Ljubljana, Slovenia, 14–16 April 2011; Volume 6594, pp. 21–30. [Google Scholar]
- Singh, A.; Sengupta, S.; Lakshminarayanan, V. Explainable Deep Learning Models in Medical Image Analysis. J. Imaging 2020, 6, 52. [Google Scholar] [CrossRef] [PubMed]
- Ivanovs, M.; Kadikis, R.; Ozols, K. Perturbation-Based Methods for Explaining Deep Neural Networks: A Survey. Pattern Recognit. Lett. 2021, 150, 228–234. [Google Scholar] [CrossRef]
- Li, A.; Xiao, F.; Zhang, C.; Fan, C. Attention-Based Interpretable Neural Network for Building Cooling Load Prediction. Appl. Energy 2021, 299, 117238. [Google Scholar] [CrossRef]
- Kim, B.; Wattenberg, M.; Gilmer, J.; Cai, C.; Wexler, J.; Viegas, F.; Sayres, R. Interpretability Beyond Feature Attribution: Quantitative Testing with Concept Activation Vectors (TCAV). arXiv 2017, arXiv:1711.11279. [Google Scholar]
- Stano, M.; Benesova, W.; Martak, L.S. Explainable 3D convolutional neural network using GMM encoding. Proc. SPIE 2020, 11433, 507–513. [Google Scholar] [CrossRef]
- Lee, H.; Kim, S.T.; Ro, Y.M. Generation of Multimodal Justification Using Visual Word Constraint Model for Explainable Computer-Aided Diagnosis. arXiv 2019, arXiv:1906.03922. [Google Scholar]
- Ai, Q.; Narayanan, R.L. Model-agnostic vs. Model-intrinsic Interpretability for Explainable Product Search. In Proceedings of the 30th ACM International Conference on Information & Knowledge Management, Queensland, Australia, 15 November 2021; pp. 5–15. [Google Scholar]
- Choi, E.; Bahadori, M.T.; Schuetz, A.; Stewart, W.F.; Sun, J. RETAIN: Interpretable Predictive Model in Healthcare Using Reverse Time Attention Mechanism. arXiv 2016, arXiv:1608.05745. [Google Scholar]
- Molnar, C. Interpretable Machine Learning; Lulu Press: Morrisville, NC, USA, 2022. [Google Scholar]
- Modarres, C.; Ibrahim, M.; Louie, M.; Paisley, J.W. Towards Explainable Deep Learning for Credit Lending: A Case Study. arXiv 2018, arXiv:1811.06471. [Google Scholar]
- Ding, X.; Xu, J.; Zhou, J.; Long, Q. Chest CT Findings of COVID-19 Pneumonia by Duration of Symptoms. Eur. J. Radiol. 2020, 127, 109009. [Google Scholar] [CrossRef] [PubMed]
- What Is Explainable AI? 6 Benefits of Explainable AI. Available online: https://www.engati.com/blog/explainable-ai (accessed on 24 April 2022).
| Method | Feature Importance | Model-Independent | Individualized Feature Importance | Identifying the Set of Relevant Features for Each Instance |
|---|---|---|---|---|
| LIME | √ | √ | ||
| DeepLIFT | √ | √ | ||
| SHAP | √ | √ | ||
| Recurrent Neural Network (RNN) | √ | √ | ||
| MAPLE | √ | √ | ||
| GAM | √ | √ | √ | |
| Rules-based interpretation models | √ | |||
| Anchors | √ | |||
| Textual justification | √ | √ | ||
| Bayesian nonparametric approach | √ | √ | √ | |
| Intrinsic explainability | √ | |||
| Similar images | √ | √ |
| Variable (Feature) | Number of Patients (Min Weight of the Variable = | Number of Patients (Max Weight of the Variable = |
|---|---|---|
| Distribution of pulmonary lesions | ||
| No lesion | 1 (1.7%) | 10 (21.2%) |
| Peripheral | 31 (52.4%) | 30 (63.8%) |
| Central | 0 (0%) | 1 (2.1%) |
| Diffuse | 26 (44.1%) | 6 (12.7%) |
| Involvement of the lung | ||
| No involvement | 1 (1.7%) | 10 (21.2%) |
| Single lobe | 1 (1.5%) | 16 (34.0%) |
| Unilateral multilobe | 0 (0%) | 2 (2.9%) |
| Bilateral multilobe | 65 (95.6%) | 20 (42.5%) |
| GGO | 52 (98.1%) | 36 (76.5%) |
| Crazy-paving pattern | 42 (62.7%) | 17 (36.1%) |
| Consolidation | 51 (75.0%) | 12 (25.5%) |
| Linear opacities | 49 (83.1%) | 3 (6.3%) |
| Air bronchogram | 27 (50.0%) | 8 (17.0%) |
| Cavitation | 0 (0%) | 0 (0%) |
| Bronchiectasis | 24 (45.2%) | 3 (6.3%) |
| Pleural effusion | 19 (27.9%) | 2 (4.2%) |
| Pericardial effusion | 3 (4.4%) | 0 (0%) |
| Lymphadenopathy | 0 (0%) | 0 (0%) |
| Pneumothorax | 2 (3.8%) | 0 (0%) |
| Variable or Symptom | No. of Patients | Relative Weight ( |
|---|---|---|
| Fever-low (37.3–38.0) | 46 | 41.1% |
| Fever-moderate (38.1–39.0) | 31 | 27.6% |
| Fever-high (>39.0) | 7 | 6.2% |
| Dizziness | 2 | 1.7% |
| Palpitation | 2 | 1.7% |
| Nausea and vomiting | 4 | 3.5% |
| Throat pain | 4 | 3.5% |
| Headache | 8 | 7.1% |
| Abdominal pain and diarrhea | 14 | 12.5% |
| Expectoration | 15 | 13.3% |
| Dyspnea | 18 | 16.1% |
| Myalgia | 18 | 16.1% |
| Chest distress | 24 | 21.4% |
| Fatigue | 38 | 33.9% |
| Dry Cough | 48 | 42.8% |
| Explanation | Distribution of Pulmonary Lesions | Involvement of the Lung | |||||||||||||||||||
|---|---|---|---|---|---|---|---|---|---|---|---|---|---|---|---|---|---|---|---|---|---|
| Number | No Lesion | Peripheral | Central | Diffuse | No Involvement | Single Lobe | Unilateral Multilobe | Bilateral Multilobe | GGO | Crazy–Paving Pattern | Consolidation | Linear Opacities | Air Bronchogram | Cavitation | Bronchiectasis | Pleural Effusion | Pericardial Effusion | Lymphadenopathy | Pneumothorax | +LR (%) | −LR (%) |
| 1 | + | + | + | + | + | + | + | + | + | + | + | + | + | + | + | + | + | + | + | 100 | 0 |
| 2 | + | − | + | + | + | + | + | + | + | + | + | + | + | + | + | + | + | + | + | 86.9 | 13.1 |
| 3 | + | + | − | + | + | + | + | + | + | + | + | + | + | + | + | + | + | + | + | 99.7 | 0.3 |
| 4 | + | − | − | + | + | + | + | + | + | + | + | + | + | + | + | + | + | + | + | 94.5 | 5.5 |
| . | . | . | . | . | . | . | . | . | . | . | . | . | . | . | . | . | . | . | . | . | . |
| . | . | . | . | . | . | . | . | . | . | . | . | . | . | . | . | . | . | . | . | . | . |
| 524,287 | − | + | − | − | − | − | − | − | − | − | − | − | − | − | − | − | − | − | − | 13.1 | 86.9 |
| 524,288 | − | − | − | − | − | − | − | − | − | − | − | − | − | − | − | − | − | − | 0 | 100 | |
| Explanation Number | Fever (37.3–38.0) | Fever (38.1–39.0) | Fever (>39.0) | Dry Cough | Expectoration | Throat Pain | Chest Distress | Dyspnea | Fatigue | Nausea and Vomiting | Palpitation | Dizziness | Headache | Myalgia | Abdominal Pain and Diarrhea | +LR (%) | −LR (%) |
|---|---|---|---|---|---|---|---|---|---|---|---|---|---|---|---|---|---|
| 1 | + | + | + | + | + | + | + | + | + | + | + | + | + | + | + | 100 | 0 |
| 2 | + | - | + | + | + | + | + | + | + | + | + | + | + | + | + | 88.9 | 11.1 |
| 3 | + | + | - | + | + | + | + | + | + | + | + | + | + | + | + | 97.5 | 2.5 |
| 4 | + | - | - | + | + | + | + | + | + | + | + | + | + | + | + | 86.4 | 13.6 |
| 5 | + | + | + | - | + | + | + | + | + | + | + | + | + | + | + | 82.8 | 17.2 |
| 6 | + | - | + | - | + | + | + | + | + | + | + | + | + | + | + | 71.7 | 28.3 |
| . | . | . | . | . | . | . | . | . | . | . | . | . | . | . | . | . | . |
| . | . | . | . | . | . | . | . | . | . | . | . | . | . | . | . | . | . |
| . | . | . | . | . | . | . | . | . | . | . | . | . | . | . | . | . | . |
| . | . | . | . | . | . | . | . | . | . | . | . | . | . | . | . | . | . |
| 8191 | - | + | - | - | - | - | - | - | - | - | - | - | - | - | - | 11.1 | 88.9 |
| 8192 | - | - | - | - | - | - | - | - | - | - | - | - | - | - | - | 0 | 100 |
Publisher’s Note: MDPI stays neutral with regard to jurisdictional claims in published maps and institutional affiliations. |
© 2022 by the authors. Licensee MDPI, Basel, Switzerland. This article is an open access article distributed under the terms and conditions of the Creative Commons Attribution (CC BY) license (https://creativecommons.org/licenses/by/4.0/).
Share and Cite
Ennab, M.; Mcheick, H. Designing an Interpretability-Based Model to Explain the Artificial Intelligence Algorithms in Healthcare. Diagnostics 2022, 12, 1557. https://doi.org/10.3390/diagnostics12071557
Ennab M, Mcheick H. Designing an Interpretability-Based Model to Explain the Artificial Intelligence Algorithms in Healthcare. Diagnostics. 2022; 12(7):1557. https://doi.org/10.3390/diagnostics12071557
Chicago/Turabian StyleEnnab, Mohammad, and Hamid Mcheick. 2022. "Designing an Interpretability-Based Model to Explain the Artificial Intelligence Algorithms in Healthcare" Diagnostics 12, no. 7: 1557. https://doi.org/10.3390/diagnostics12071557
APA StyleEnnab, M., & Mcheick, H. (2022). Designing an Interpretability-Based Model to Explain the Artificial Intelligence Algorithms in Healthcare. Diagnostics, 12(7), 1557. https://doi.org/10.3390/diagnostics12071557