
Features Found in Indocyanine Green-Based Fluorescence Optical Imaging of Inflammatory Diseases of the Hands

 ,
,
Abstract
:
1. Introduction
2. Materials and Methods
3. Results
3.1. Healthy Individual—Reference
3.2. Rheumatoid Arthritis
3.3. Osteoarthritis (with Tendinitis)
3.4. Fibromyalgia
3.5. Collagenosis-CREST Syndrome
3.6. Acrodermatitis Chronica Atrophicans
3.7. Psoriatic Arthritis and Psoriasis Vulgaris
3.8. Summary of Selected Features
4. Discussion
5. Conclusions
Author Contributions
Funding
Institutional Review Board Statement
Informed Consent Statement
Data Availability Statement
Acknowledgments
Conflicts of Interest
References
- Ammitzbøll-Danielsen, M.; Glinatsi, D.; Terslev, L.; Østergaard, M. A novel fluorescence optical imaging scoring system for hand synovitis in rheumatoid arthritis-validity and agreement with ultrasound. Rheumatology 2022, 61, 636–647. [Google Scholar] [CrossRef] [PubMed]
- Hirano, F.; Yokoyama-Kokuryo, W.; Yamazaki, H.; Tsutsumino, M.; Sakai, R.; Satoh, S.; Kimura, T.; Tojo, N.; Kohsaka, H.; Harigai, M. Comparison of fluorescence optical imaging, ultrasonography, and clinical examination with magnetic resonance imaging as a reference in active rheumatoid arthritis patients. Immunol. Med. 2018, 41, 75–81. [Google Scholar] [CrossRef] [PubMed]
- Glimm, A.-M.; Werner, S.G.; Burmester, G.R.; Backhaus, M.; Ohrndorf, S. Analysis of distribution and severity of inflammation in patients with osteoarthitis compared to rheumatoid arthritis by ICG-enhanced fluorescence optical imaging and musculoskeletal ultrasound: A pilot study. Ann. Rheum. Dis. 2016, 75, 566–570. [Google Scholar] [CrossRef] [PubMed]
- Maugesten, Ø.; Mathiessen, A.; Hammer, H.B.; Hestetun, S.V.; Kvien, T.K.; Uhlig, T.; Ohrndorf, S.; Haugen, I.K. Validity and diagnostic performance of fluorescence optical imaging measuring synovitis in hand osteoarthritis: Baseline results from the Nor-Hand cohort. Arth. Res. Ther. 2020, 22, 98. [Google Scholar] [CrossRef] [PubMed]
- Granzow, N.; Werner, S.; Ohrndorf, S.; Schmittat, G.; Burmester, G.; Backhaus, M. Deskriptive Analyse der ICG-gestützten fluoreszenzoptischen Bildgebung bei Patienten mit Kollagenosen. Z. Rheumatol. 2013, 72 (Suppl. 2), 20–21. [Google Scholar]
- Friedrich, S.; Lüders, S.; Werner, S.G.; Glimm, A.-M.; Burmester, G.R.; Riemekasten, G.; Backhaus, M.; Ohrndorf, S. Disturbed microcirculation in the hands of patients with systemic sclerosis detected by fluorescence optical imaging: A pilot study. Arth. Res. Ther. 2017, 19, 87. [Google Scholar] [CrossRef] [PubMed]
- Erdmann-Keding, M.; Ohrndorf, S.; Werner, S.G.; Glimm, A.-M.; Burmester, G.R.; Kokolakis, G.; Zuberbier, T.; Sterry, W.; Backhaus, M.; Philipp, S. Fluorescence optical imaging for the detection of potential psoriatic arthritis in comparison to musculoskeletal ultrasound. J. Ger. Soc. Derm. 2019, 17, 913–921. [Google Scholar] [CrossRef]
- Köhm, M.; Zerweck, L.; Nguyen, P.H.; Burkhardt, H.; Behrens, F. Innovative Imaging Technique for Visualization of Vascularization and Established Methods for Detection of Musculoskeletal Inflammation in Psoriasis Patients. Front. Med. 2020, 7, 468. [Google Scholar] [CrossRef]
- Kisten, Y.; Györi, N.; af Klint, E.; Rezaei, H.; Levitsky, A.; Karlsson, A.; van Vollenhoven, R. Detection of clinically manifest and silent synovitis in the hands and wrists by fluorescence optical imaging. RMD Open 2015, 1, e000106. [Google Scholar] [CrossRef]
- Neumann, J.; Schmaderer, C.; Finsterer, S.; Zimmermann, A.; Steubl, D. Noninvasive quantitative assessment of microcirculatory disorders of the upper extremities with 2D fluorescence optical imaging. Clin. Hemorheol. Microcirc. 2018, 70, 69–81. [Google Scholar] [CrossRef]
- Klein, A.; Just, G.W.; Werner, S.G.; Oommen, P.T.; Minden, K.; Becker, I.; Langer, H.-E.; Klee, D.; Horneff, G. Fluorescence optical imaging and musculoskeletal ultrasonography in juvenile idiopathic polyarticular disease before and during antirheumatic treatment—A multicenter non-interventional diagnostic evaluation. Arth. Res. Ther. 2017, 19, 147. [Google Scholar] [CrossRef] [PubMed]
- Ohrndorf, S.; Glimm, A.-M.; Ammitzbøll-Danielsen, M.; Ostergaard, M.; Burmester, G.R. Fluorescence optical imaging: Ready for prime time? RMD Open 2021, 7, e001497. [Google Scholar] [CrossRef] [PubMed]
- Friedrich, S.; Lüders, S.; Glimm, A.-M.; Werner, S.G.; Schmittat, G. Association between baseline clinical and imaging findings and the development of digital ulcers in patients with systemic sclerosis. Arth. Res. Ther. 2019, 21, 96. [Google Scholar] [CrossRef] [PubMed]
- Werner, S.G.; Ohrndorf, S. Inflammation assessment in patients with arthritis using a novel in vivo fluorescence optical imaging technology. Ann. Rheum. Dis. 2012, 71, 504–510. [Google Scholar] [CrossRef] [PubMed]
- Hermann, K.G.A.; Ohrndorf, S.; Werner, S.G.; Finzel, S.; Backhaus, M. Bildgebende Verfahren bei Psoriasisarthritis. Z. Rheumathol. 2013, 72, 771–778. [Google Scholar] [CrossRef]
- Chatelain, R.; Wiemann, O.; Werner, S.G.; Langer, H.-E. ICG-gestützte fluoreszenzoptische Bildgebung: Ein neues diagnostisches Verfahren zur Früherkennung und Therapiekontrolle bei Psoriasis-Arthritis. Akt. Dermatol. 2016, 42, 398–405. [Google Scholar] [CrossRef]
- Wiemann, O.; Werner, S.G.; Langer, H.-E.; Backhaus, M.; Chatelain, R. The “green nail” phenomenon in ICG-enhanced fluorescence optical imaging—A potential tool for the differential diagnosis of psoriatic arthritis. J. Ger. Soc. Derm. 2019, 17, 138–147. [Google Scholar] [CrossRef]
- Xiralite. Diagnostics2022. Available online: https://osf.io/bqwa3 (accessed on 30 May 2022).
- Hammer, H.B.; Kvien, T.K.; Terslev, L. Tenosynovitis in rheumatoid arthritis patients on biologic treatment: Involvement and sensitivity to change compared to joint inflammation. Clin. Exp. Rheumatol. 2017, 35, 959–965. [Google Scholar]
- Brumm, C.; Looser, M.; Kissling, R.O. Is open synovectomy of the metacarpophalangeal joint in chronic polyarthritis worthwhile? Z. Orthop. 2000, 138, 496–500. [Google Scholar] [CrossRef]
- Kiesel, D.; Berger, J.; Gedat, E.; Ohrndorf, S.; Briel, A.; Failli, V.; Welker, P. Near infrared fluorescense optical imaging (NIR-FOI) can support the differential diagnosis of connective tissue diseases. Ann. Rheum. Dis. 2022, 81 (Suppl. 1), 291. [Google Scholar]
- Stumper, N.; Berger, J.; Schmittat, G.; Briel, A.; Vogler, D.; Burmester, G.R.; Hoff, P.; Ohrndorf, S. Image pattern analysis in fluorescence optical imaging for differential diagnosis in rheumatic joint diseases. Ann. Rheum. Dis. 2022, 81 (Suppl. 1), 1787. [Google Scholar] [CrossRef]


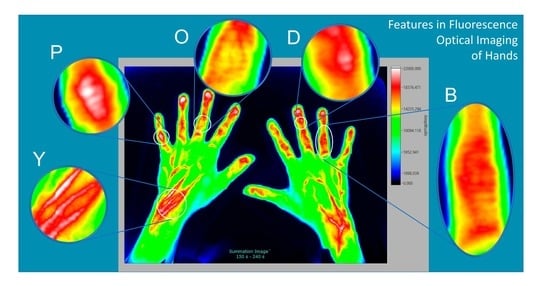
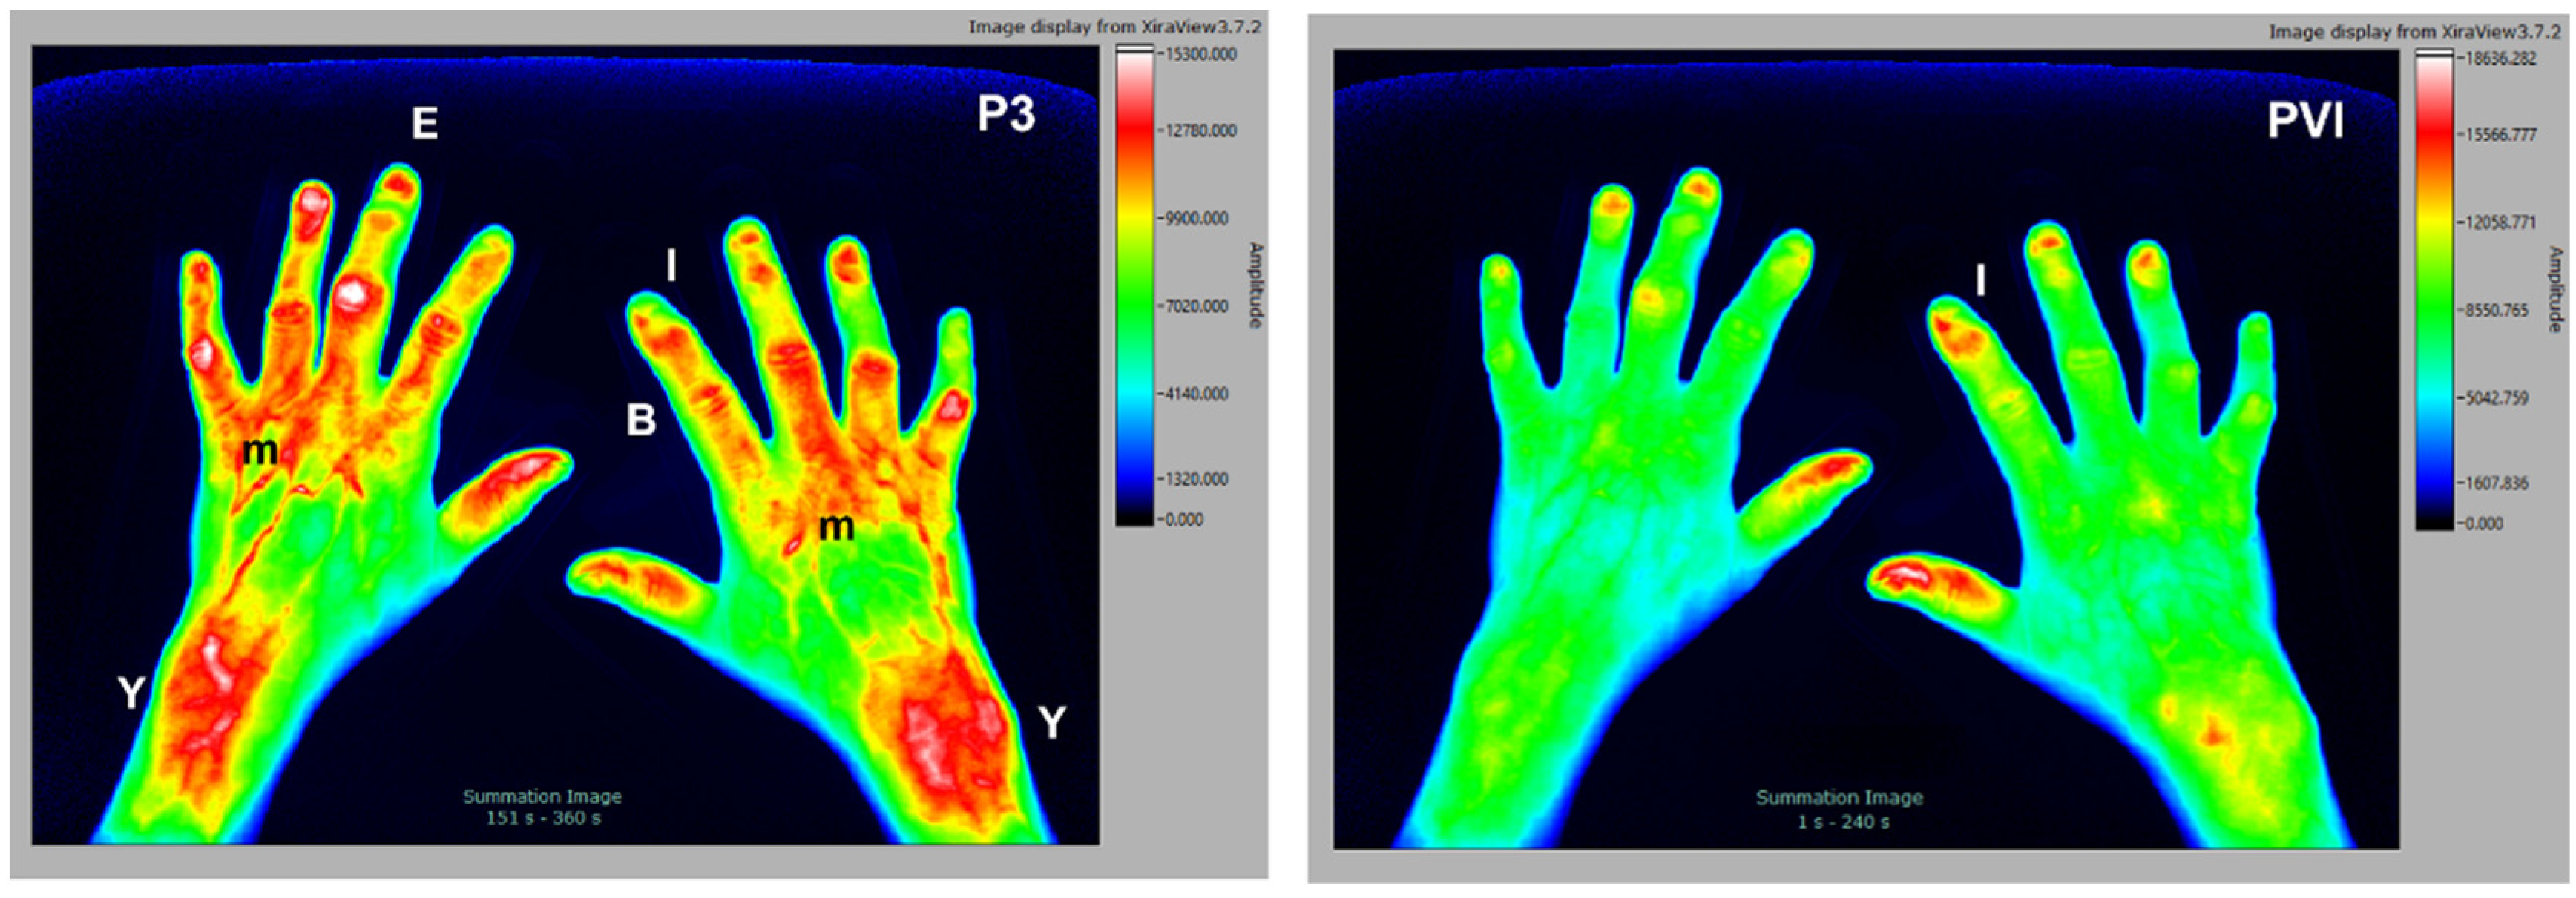
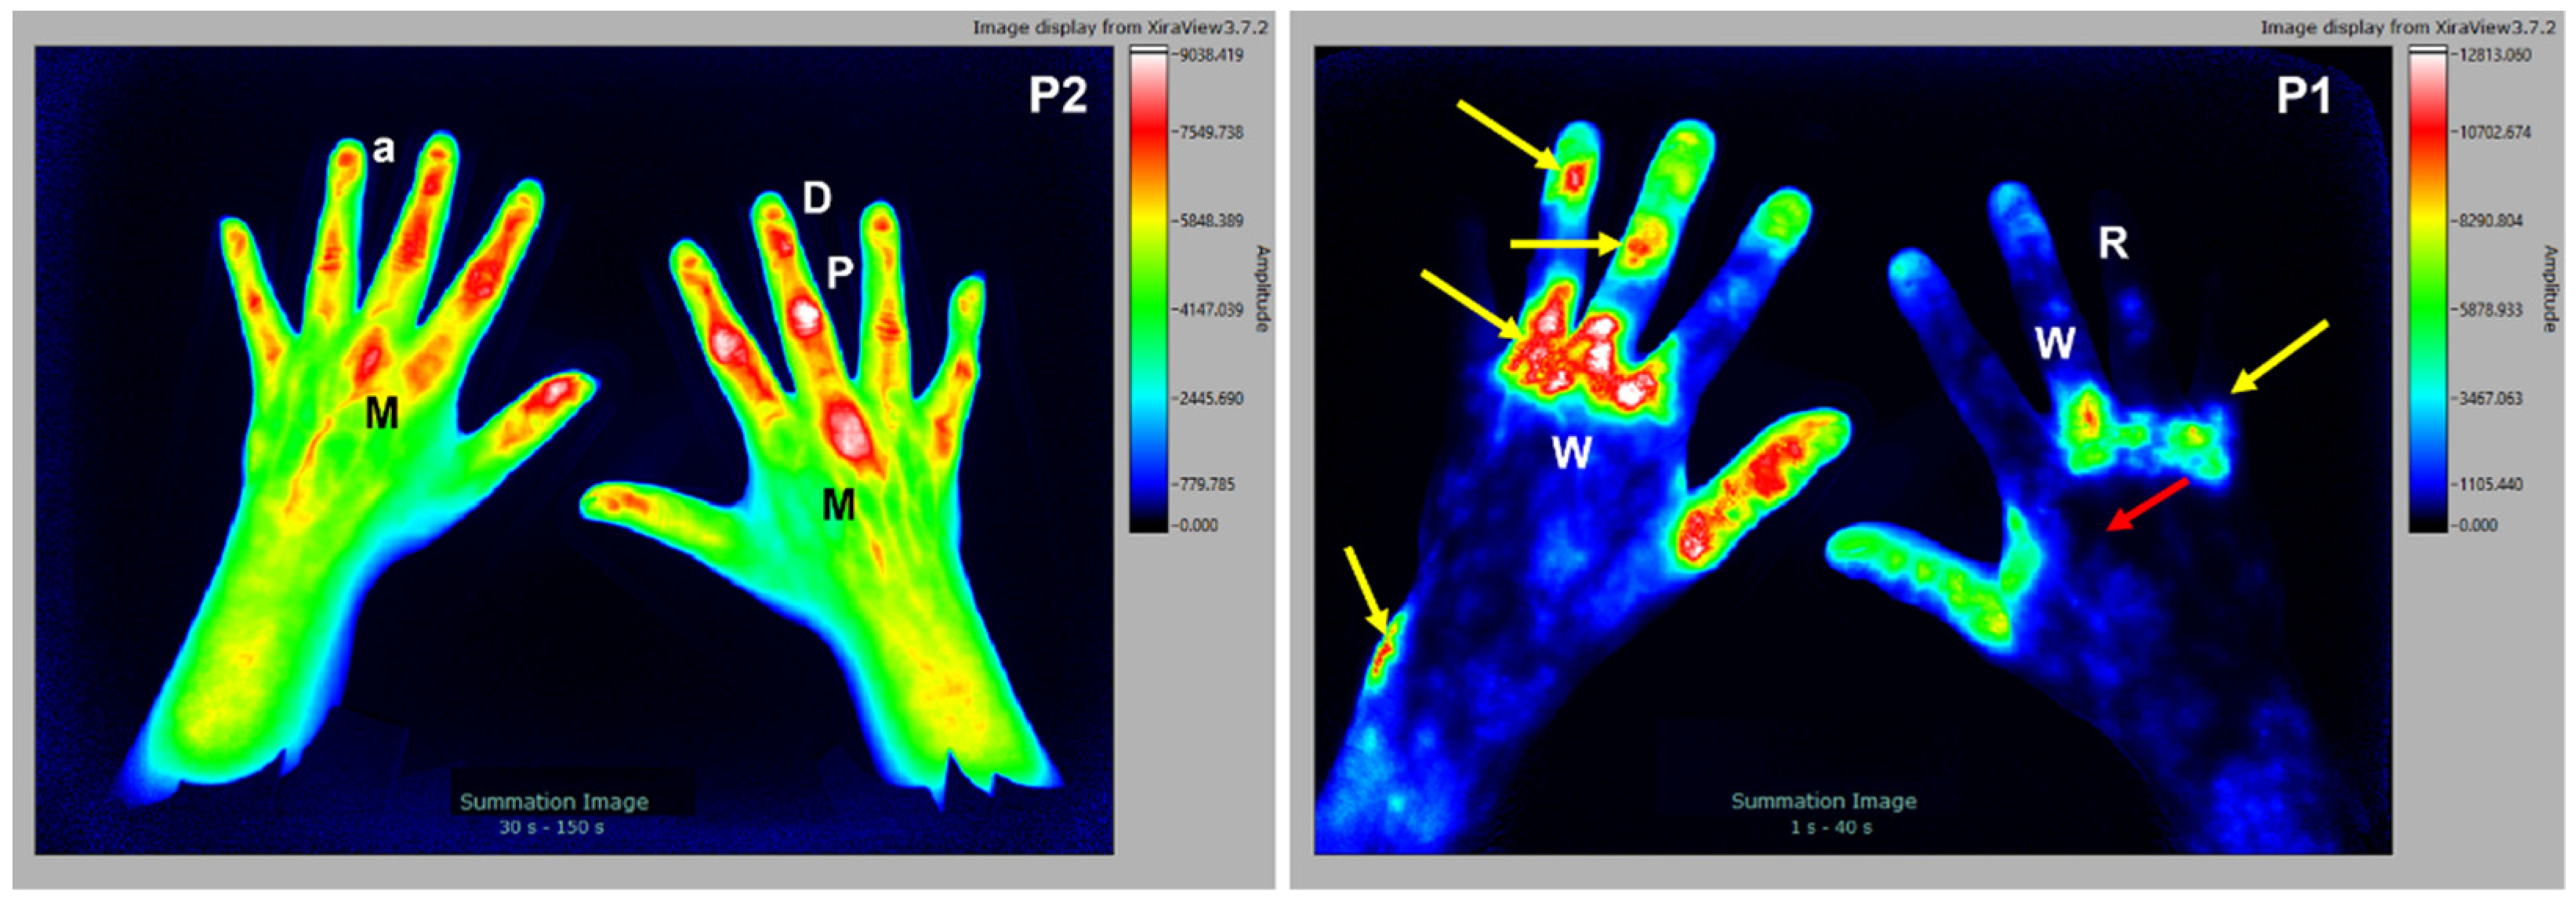
| Region | Name | Description | Figure |
|---|---|---|---|
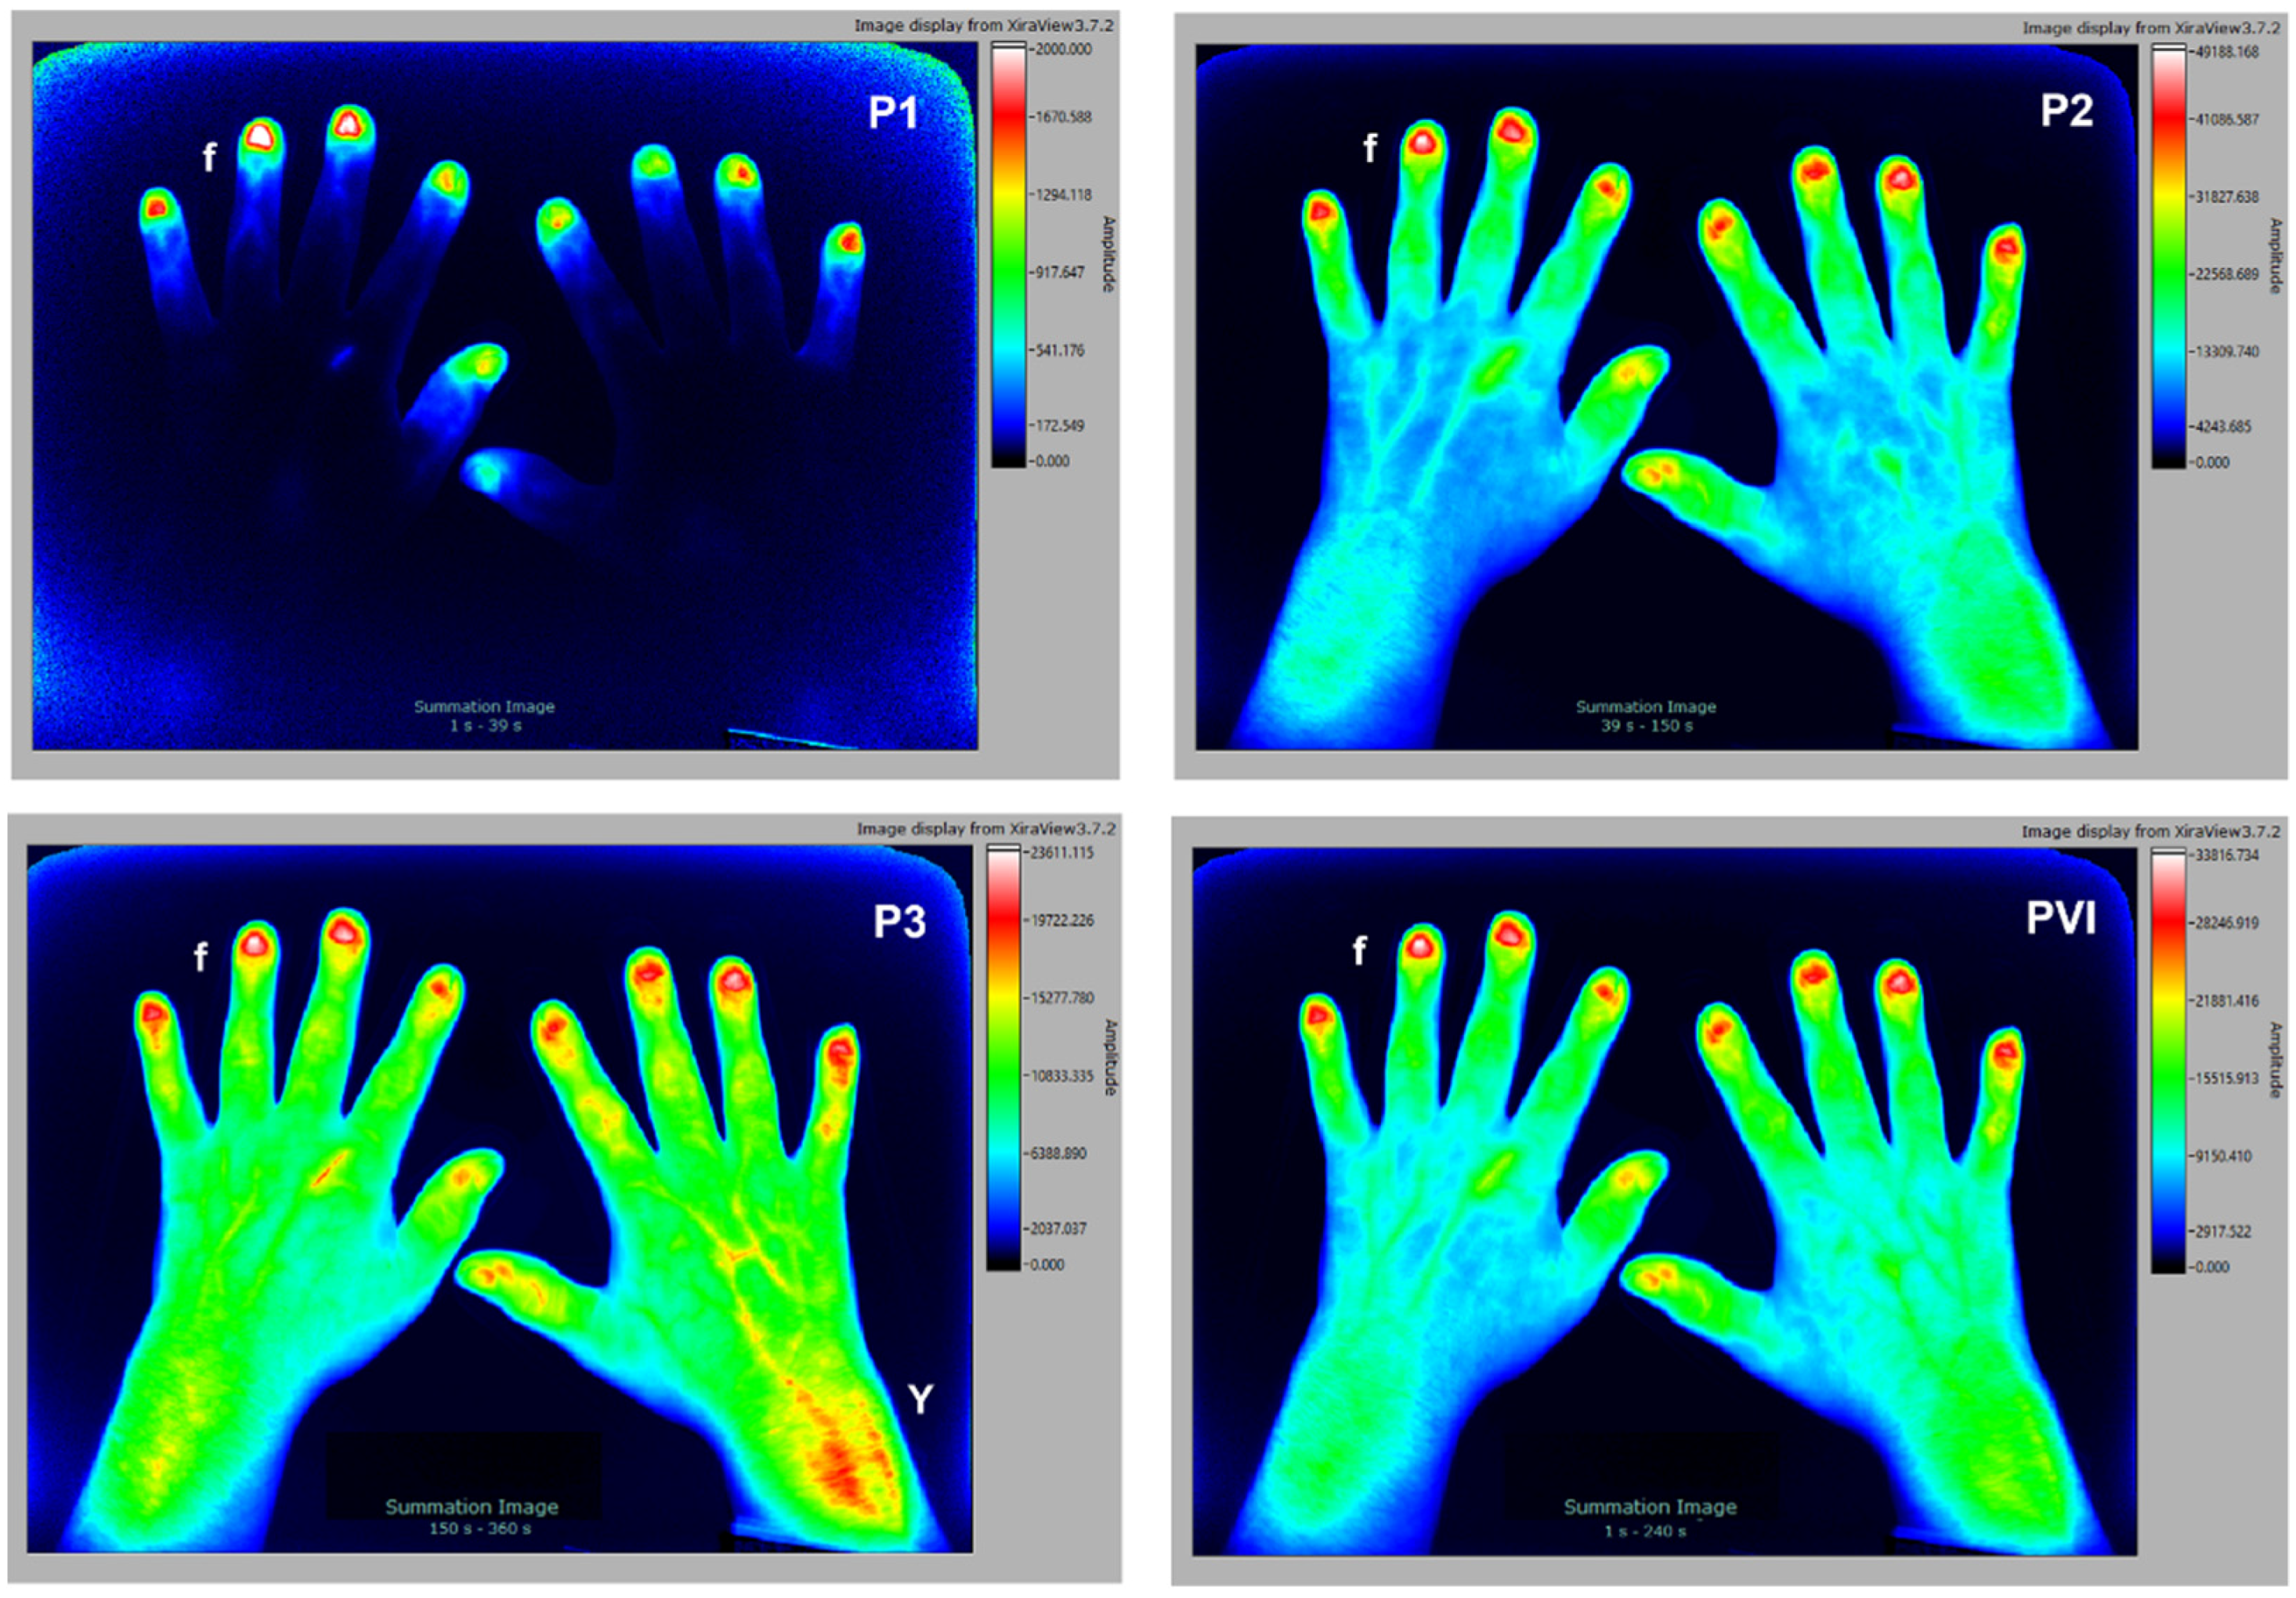
| Fingers | f | Round or slightly oval signal in fingertips, physiological | Figure 1 |
| r | Delayed inflow in all fingertips (in both hands) | Figure 5 | |
| R | Diminished or non-existent flow of the dye into one or more fingers (Raynaud syndrome) | Figure 5 and Figure 7 | |
| Nails | a | Sigmoid outflow of the dye from the nailbed | Figure 7 |
| I | Irregular (inhomogeneous) signal in the nail bed | Figure 4 and Figure 6 | |
| Joints | D | Round, oval, mostly regularly shaped signal (DIP joints) | Figure 7 |
| P | Round, oval, mostly regularly shaped (PIP joints) | Figure 2 and Figure 7 | |
| M | Round, oval, o mostly regularly shaped (MCP joints) | Figure 2 and Figure 7 | |
| C | Round, oval, mostly regularly shaped (Intercarpal joints) | Figure 2 | |
| O | Signal around joints, most likely the fibrous membrane, or aponeurosis | Figure 3 | |
| Venous vessels | V | Signal on the back of the hand, in the area of superficial venous structures | Figure 2 |
| Connectivetissue | E | Triangle shaped signal enhancement below nail | Figure 3, Figure 4 and Figure 6 |
| B | Broad, pronounced signals in the area of dorsal tendons | Figure 3 and Figure 4 | |
| Y | Increased signals in the area of muscle tendon junction of wrist | Figure 1, Figure 3 and Figure 4 | |
| e | Increased signals in the extensor carpi ulnaris region | Figure 2 | |
| Muscle | m | Varying intensity and signal sharpness depending on the depth | Figure 4 |
| Skin, connective tissue with blood vessels | W | Cloudy, “unsharp” signal | Figure 5, Figure 6 and Figure 7 |
| F | Punctual, “sharp” signal, or irregularly shaped | Figure 5 and Figure 6 |
| Region | Name | Tissue | Visible in Phase | Depth of Location | Perfusion |
|---|---|---|---|---|---|
| Fingers | f, I | Capillary network in the nail bed | Phase 1 | Superficial | High |
| R | Sclerosed or necrotic tissue, keratinized plaques | Phases 2 and 3 | Superficial | Low | |
| Joints | D, P, M, C | Capillary network of the synovial membrane | Phases 1 and 2 | Superficial/Deep | High |
| Vessels | V | Large veins on the back of the hand | Phases 2 and 3 | Superficial | High |
| Connectivetissue | E, B | Tight connective tissue of dorsal entheses, tendons, aponeuroses | Phases 2 and 3 | Deep | Low |
| Y | Connective tissue/muscle | Phases 2 and 3 | Superficial | Low/High | |
| e | ECU tendon | Phases 1 and 2 | Superficial | Low | |
| a | Entheses and tendons between nailbed and DIP | Phases 2 and 3 | Deep | Low | |
| Muscle | m | Muscle tissue | Phase 3 | Deep | High |
| Skin, connective tissue | W, F | Arteries/capillaries | Phase 1 | Superficial/Deep | High |
Publisher’s Note: MDPI stays neutral with regard to jurisdictional claims in published maps and institutional affiliations. |
© 2022 by the authors. Licensee MDPI, Basel, Switzerland. This article is an open access article distributed under the terms and conditions of the Creative Commons Attribution (CC BY) license (https://creativecommons.org/licenses/by/4.0/).
Share and Cite
Gedat, E.; Berger, J.; Kiesel, D.; Failli, V.; Briel, A.; Welker, P. Features Found in Indocyanine Green-Based Fluorescence Optical Imaging of Inflammatory Diseases of the Hands. Diagnostics 2022, 12, 1775. https://doi.org/10.3390/diagnostics12081775
Gedat E, Berger J, Kiesel D, Failli V, Briel A, Welker P. Features Found in Indocyanine Green-Based Fluorescence Optical Imaging of Inflammatory Diseases of the Hands. Diagnostics. 2022; 12(8):1775. https://doi.org/10.3390/diagnostics12081775
Chicago/Turabian StyleGedat, Egbert, Jörn Berger, Denise Kiesel, Vieri Failli, Andreas Briel, and Pia Welker. 2022. "Features Found in Indocyanine Green-Based Fluorescence Optical Imaging of Inflammatory Diseases of the Hands" Diagnostics 12, no. 8: 1775. https://doi.org/10.3390/diagnostics12081775
APA StyleGedat, E., Berger, J., Kiesel, D., Failli, V., Briel, A., & Welker, P. (2022). Features Found in Indocyanine Green-Based Fluorescence Optical Imaging of Inflammatory Diseases of the Hands. Diagnostics, 12(8), 1775. https://doi.org/10.3390/diagnostics12081775