
Automated Diabetic Retinopathy Detection Using Horizontal and Vertical Patch Division-Based Pre-Trained DenseNET with Digital Fundus Images

 ,
,  ,
,  , , ,
, , , 
Abstract
:1. Introduction
- A new DR image dataset was collected, on which the developed model was tested.
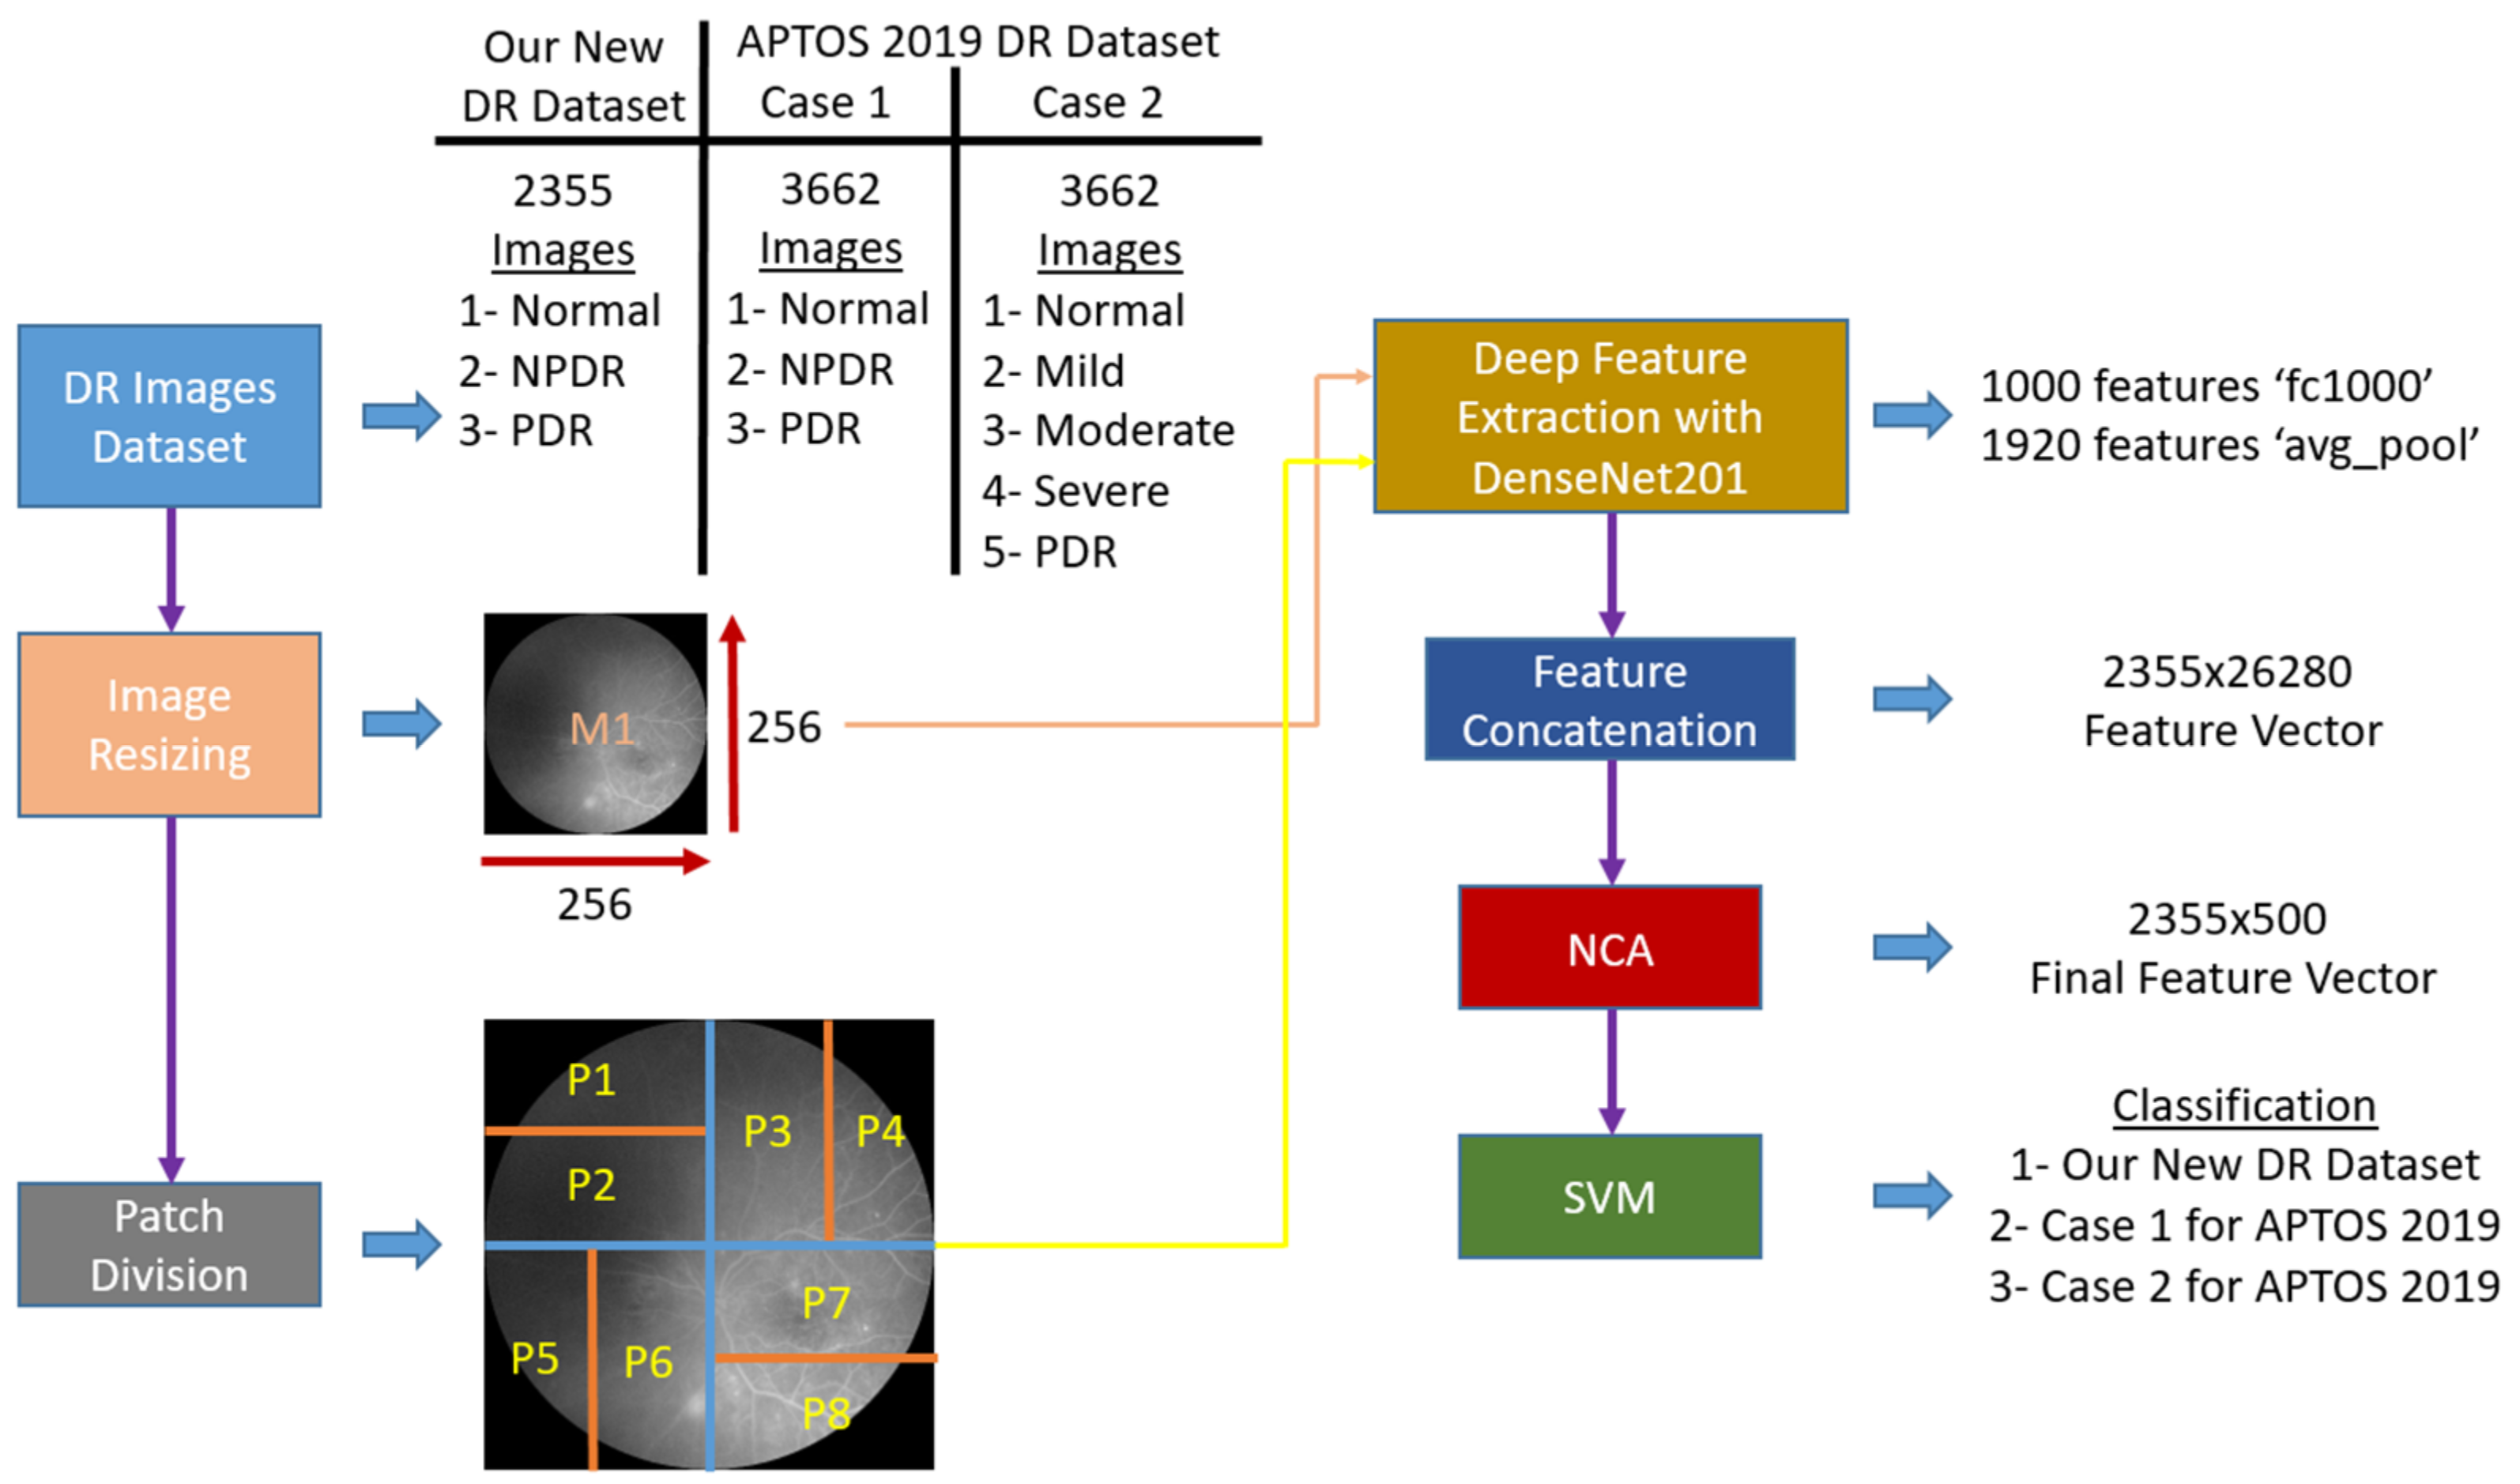
- Novel division of the image into horizontal and vertical patches enabled downstream multilevel deep-feature extraction.
- Feature extraction was performed at the last fully connected, and global average pooling layers of DenseNet201, a deep network architecture, and the most discriminative features were selected with NCA.
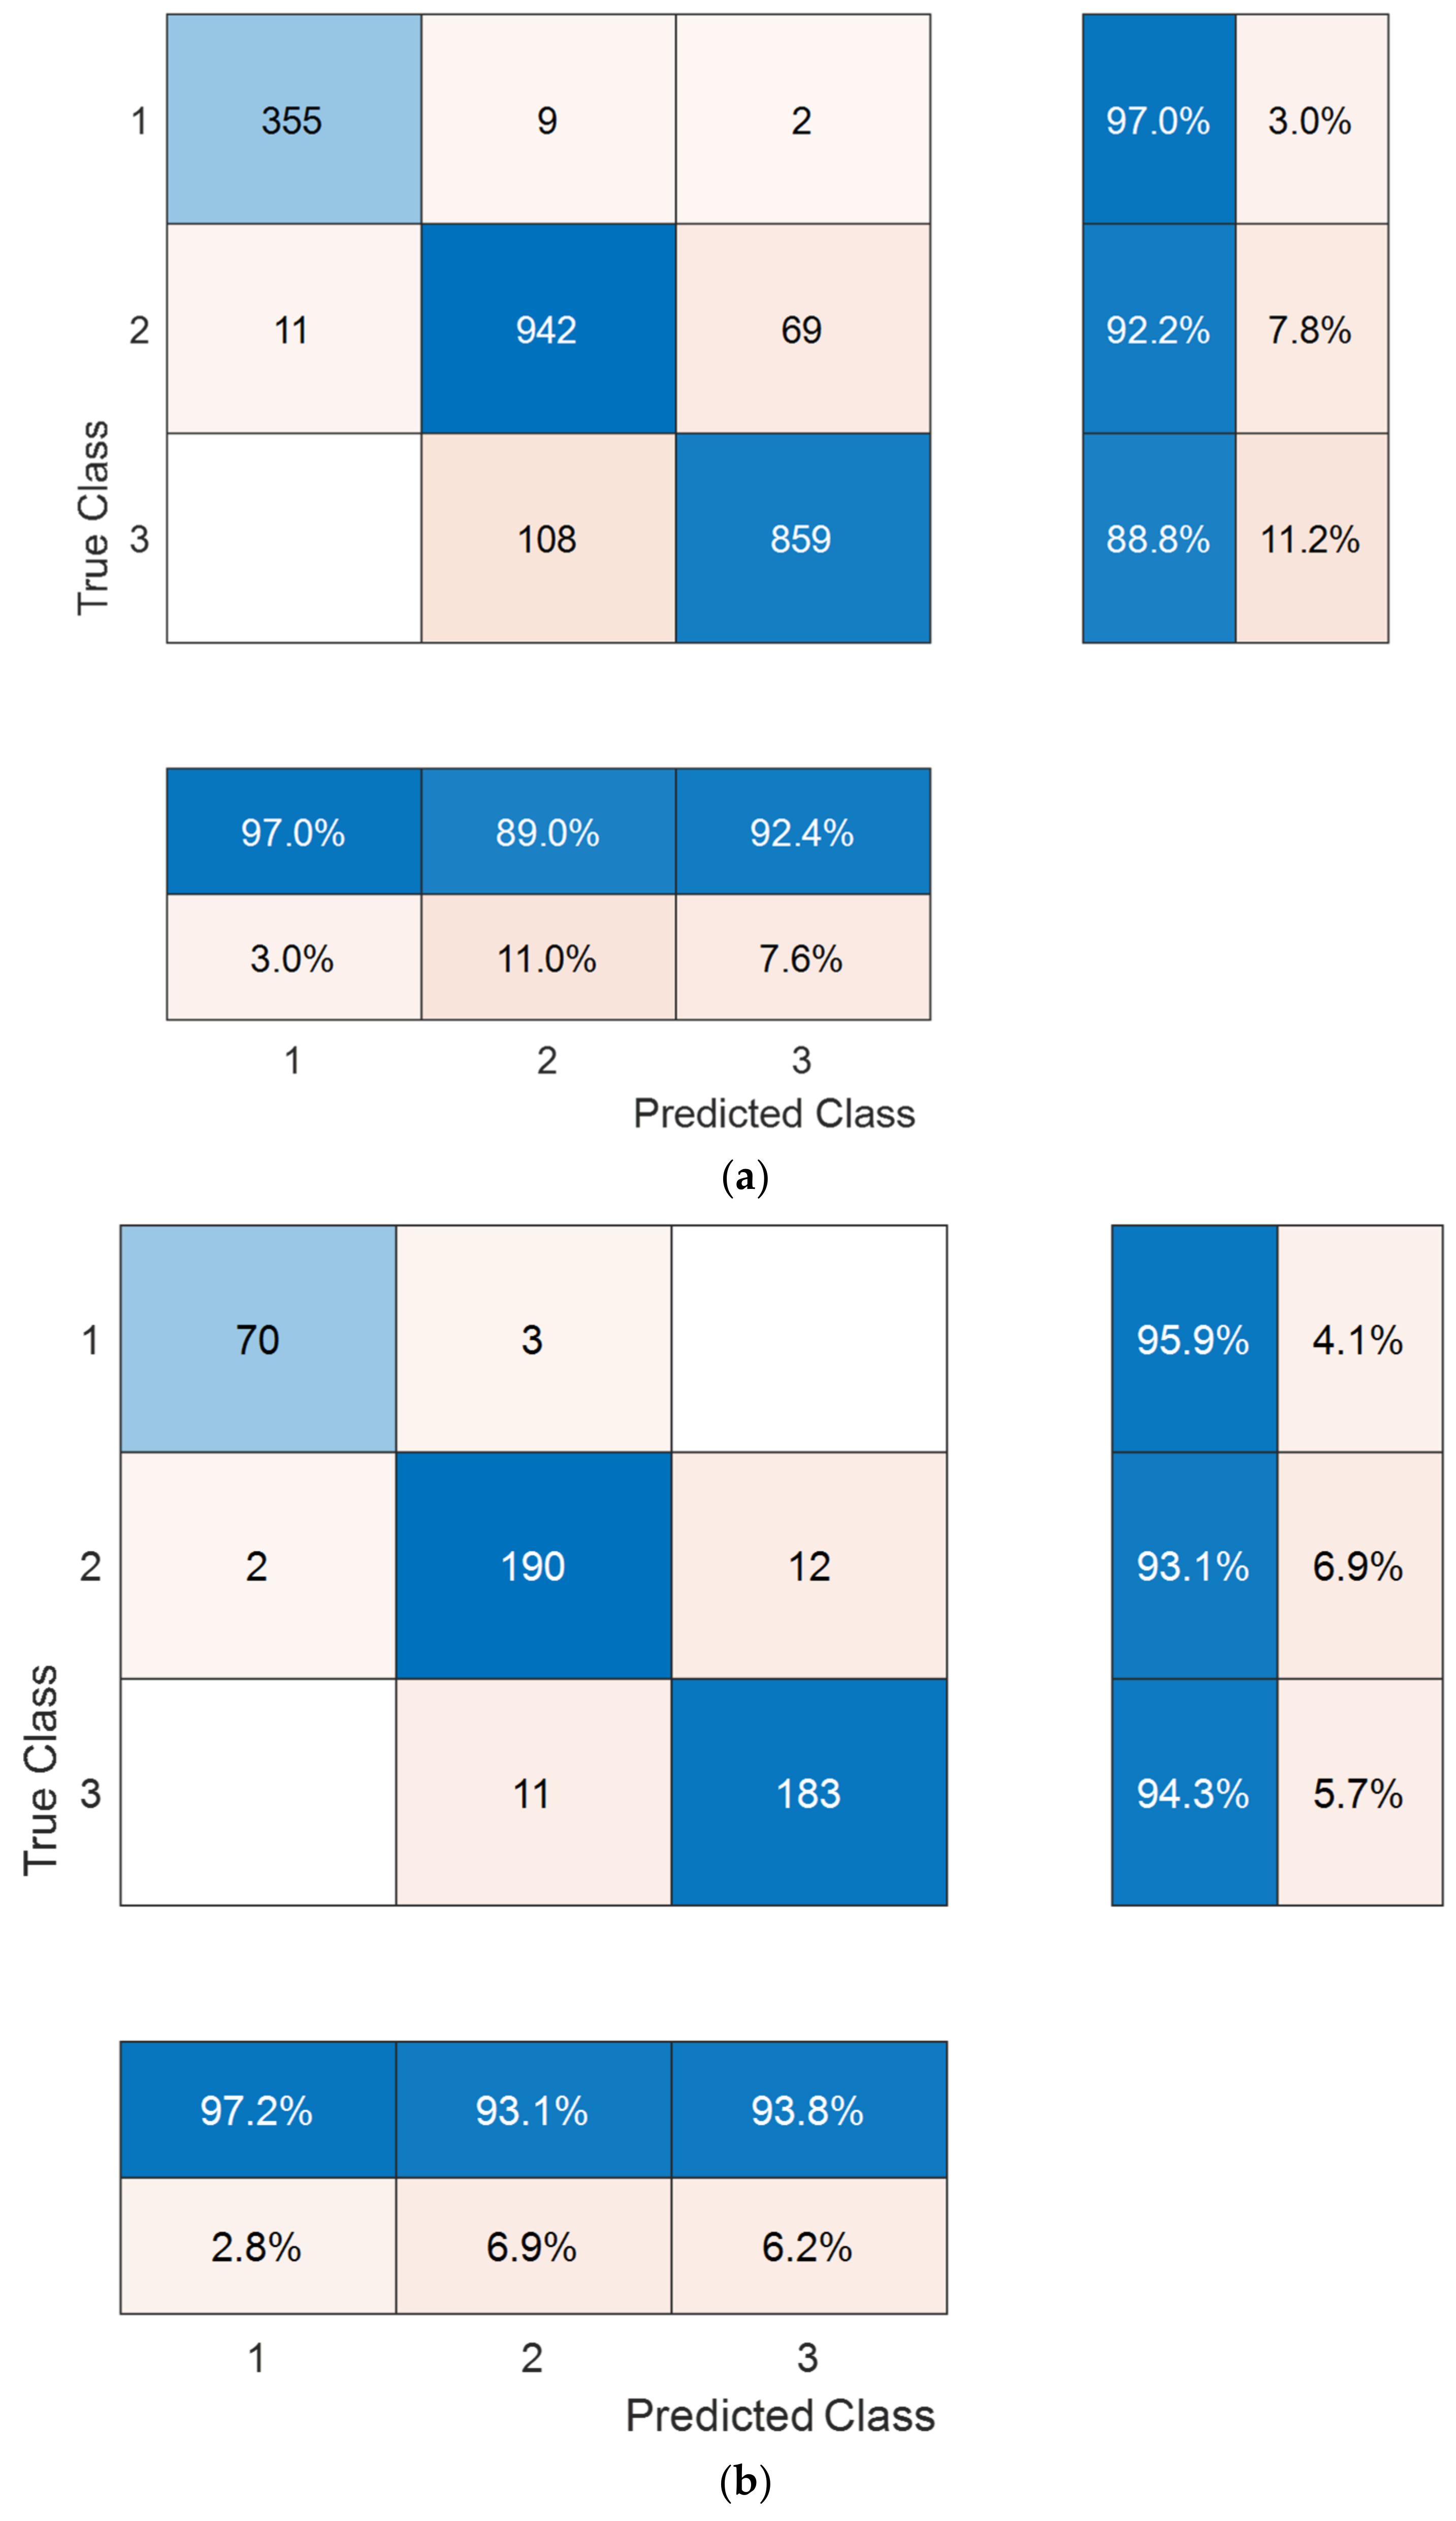
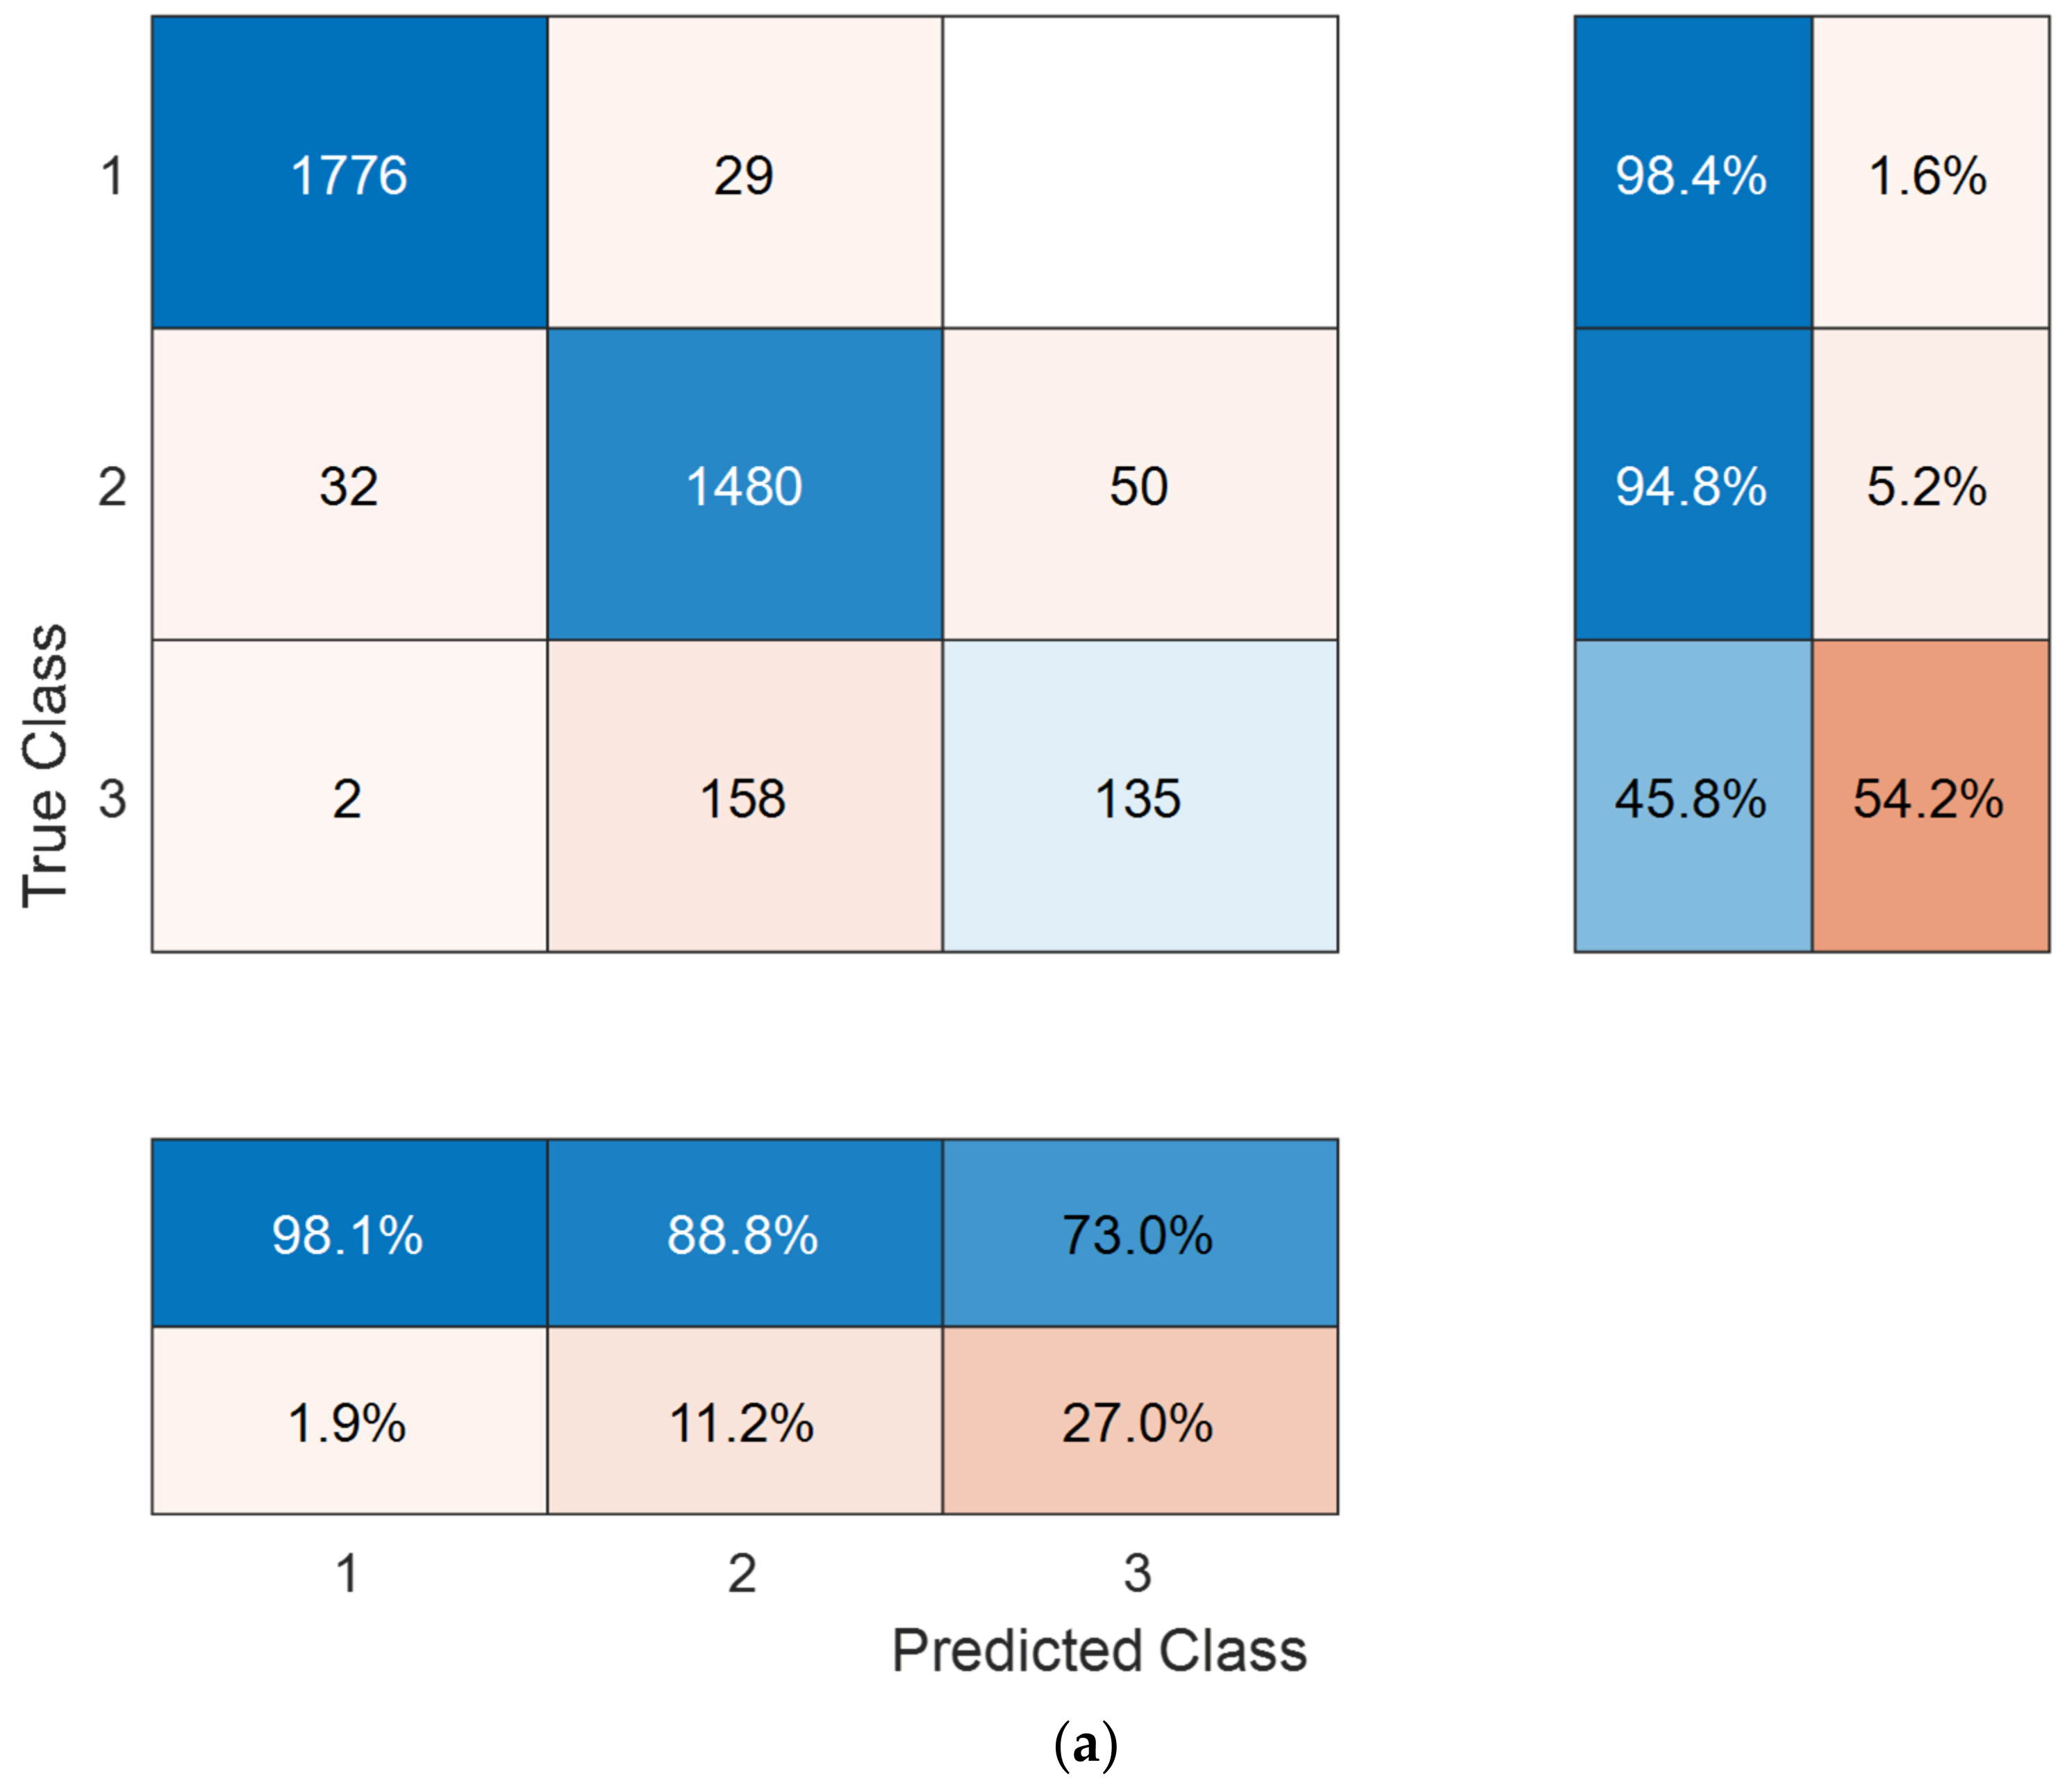
- The model was trained and tested on our new dataset and the established open-access Asia Pacific Tele-Ophthalmology Society (APTOS) dataset [35]. As a result, the model attained excellent 94.06% and 91.55% classification accuracy rates on our new dataset using robust 80:20 hold-out validation and 10-fold cross-validation (CV) strategies, respectively.
2. Material and Method
2.1. Material
2.1.1. New Diabetic Retinopathy Dataset
2.1.2. APTOS 2019 Diabetic Retinopathy Dataset
2.2. Method
| Algorithm 1. Pseudocode of the proposed patch-based model |
| Input: DR image dataset (). Output: Classification results () |
| 00: Load . 01: for k = 1 to do // Herein, is the number of images 02: // Read each image () from dataset 03: Resize the image to 256 × 256. 04: // Generate deep features from the main image // using “fc1000” and “avg_pool” layers 05: Divide DR image into horizontal and vertical patches // Herein, is patches 06: // Counter for patches 07: for i = 1 to 8 do // There are 8 patches 08: 09: 10: end for i 11: end for k 12: Normalize using min-max normalization 13: Apply NCA to and calculate indexes () 14: Select the top 500 features using 15: Export selected features to the cubic SVM classifier. 16: Obtain classification results () with 10-fold CV and 80:20 hold-out validation |
2.2.1. Feature Extraction
2.2.2. Feature Selection
2.2.3. Classification
3. Results
3.1. Experimental Setup
3.2. Results
3.3. Computational Complexity
4. Discussion
- A new DR image dataset collected comprised of three classes: normal, NPDR, and PDR.
- A new patch-based deep-feature extraction method was proposed that used pretrained DenseNet201 architecture to generate many deep features.
- The optimal number of top features was selected by applying NCA, which were fed to a shallow cubic SVM classifier.
5. Conclusions
Author Contributions
Funding
Institutional Review Board Statement
Informed Consent Statement
Data Availability Statement
Acknowledgments
Conflicts of Interest
References
- Gupta, A.; Behl, T.; Sachdeva, M. Key milestones in the diabetes research: A comprehensive update. Obes. Med. 2020, 17, 100183. [Google Scholar] [CrossRef]
- Singh, A.; Kukreti, R.; Saso, L.; Kukreti, S. Mechanistic Insight into Oxidative Stress-Triggered Signaling Pathways and Type 2 Diabetes. Molecules 2022, 27, 950. [Google Scholar] [CrossRef] [PubMed]
- Mustafa, W.A.; Abdul-Nasir, A.S.; Yazid, H. Diabetic retinopathy (DR) on retinal image: A pilot study. J. Phys. Conf. Ser. 2018, 1019, 012021. [Google Scholar] [CrossRef]
- Wykoff, C.C.; Khurana, R.N.; Nguyen, Q.D.; Kelly, S.P.; Lum, F.; Hall, R.; Abbass, I.M.; Abolian, A.M.; Stoilov, I.; To, T.M. Risk of blindness among patients with diabetes and newly diagnosed diabetic retinopathy. Diabetes Care 2021, 44, 748–756. [Google Scholar] [CrossRef]
- Kumar, P.; Bhargava, S.; Agarwal, P.K.; Garg, A.; Khosla, A. Association of serum magnesium with type 2 diabetes mellitus and diabetic retinopathy. J. Fam. Med. Prim. Care 2019, 8, 1671. [Google Scholar] [CrossRef]
- Kulkarni, S.; Kondalkar, S.; Mactaggart, I.; Shamanna, B.R.; Lodhi, A.; Mendke, R.; Kharat, J.; Kapse, R.; Dole, K.; Deshpande, M. Estimating the magnitude of diabetes mellitus and diabetic retinopathy in an older age urban population in Pune, western India. BMJ Open Ophthalmol. 2019, 4, e000201. [Google Scholar] [CrossRef] [PubMed]
- Voigt, M.; Schmidt, S.; Lehmann, T.; Köhler, B.; Kloos, C.; Voigt, U.A.; Meller, D.; Wolf, G.; Müller, U.A.; Müller, N. Prevalence and progression rate of diabetic retinopathy in type 2 diabetes patients in correlation with the duration of diabetes. Exp. Clin. Endocrinol. Diabetes 2018, 126, 570–576. [Google Scholar] [PubMed]
- Ong, J.X.; Fawzi, A.A. Perspectives on diabetic retinopathy from advanced retinal vascular imaging. Eye 2022, 36, 319–327. [Google Scholar] [CrossRef] [PubMed]
- Scianmarello, N.E. Oxygen Transporter and Generator Devices to Treat Diabetic Retinopathy. PhD Thesis, California Institute of Technology, Pasadena, CA, USA, 2019. [Google Scholar]
- Cai, X.; Chen, Y.; Yang, W.; Gao, X.; Han, X.; Ji, L. The association of smoking and risk of diabetic retinopathy in patients with type 1 and type 2 diabetes: A meta-analysis. Endocrine 2018, 62, 299–306. [Google Scholar] [CrossRef]
- Vujosevic, S.; Muraca, A.; Alkabes, M.; Villani, E.; Cavarzeran, F.; Rossetti, L.; De Cilla, S. Early microvascular and neural changes in patients with type 1 and type 2 diabetes mellitus without clinical signs of diabetic retinopathy. Retina 2019, 39, 435–445. [Google Scholar] [CrossRef] [PubMed]
- Safi, H.; Safi, S.; Hafezi-Moghadam, A.; Ahmadieh, H. Early detection of diabetic retinopathy. Surv. Ophthalmol. 2018, 63, 601–608. [Google Scholar] [CrossRef]
- Ishtiaq, U.; Abdul Kareem, S.; Abdullah, E.R.M.F.; Mujtaba, G.; Jahangir, R.; Ghafoor, H.Y. Diabetic retinopathy detection through artificial intelligent techniques: A review and open issues. Multimed. Tools Appl. 2020, 79, 15209–15252. [Google Scholar] [CrossRef]
- Mateen, M.; Wen, J.; Hassan, M.; Nasrullah, N.; Sun, S.; Hayat, S. Automatic detection of diabetic retinopathy: A review on datasets, methods and evaluation metrics. IEEE Access 2020, 8, 48784–48811. [Google Scholar] [CrossRef]
- Arunkumar, R.; Karthigaikumar, P. Multi-retinal disease classification by reduced deep learning features. Neural Comput. Appl. 2017, 28, 329–334. [Google Scholar] [CrossRef]
- Farnell, D.J.J.; Hatfield, F.N.; Knox, P.; Reakes, M.; Spencer, S.; Parry, D.; Harding, S.P. Enhancement of blood vessels in digital fundus photographs via the application of multiscale line operators. J. Frankl. Inst. 2008, 345, 748–765. [Google Scholar] [CrossRef]
- Abbas, Q.; Fondon, I.; Sarmiento, A.; Jiménez, S.; Alemany, P. Automatic recognition of severity level for diagnosis of diabetic retinopathy using deep visual features. Med. Biol. Eng. Comput. 2017, 55, 1959–1974. [Google Scholar] [CrossRef]
- Kälviäinen, R.; Uusitalo, H. DIARETDB1 diabetic retinopathy database and evaluation protocol. In Medical image understanding and analysis. Med. Image Underst. Anal. 2007, 2007, 61. [Google Scholar]
- Krause, J.; Gulshan, V.; Rahimy, E.; Karth, P.; Widner, K.; Corrado, G.S.; Peng, L.; Webster, D.R. Grader variability and the importance of reference standards for evaluating machine learning models for diabetic retinopathy. Ophthalmology 2018, 125, 1264–1272. [Google Scholar] [CrossRef] [PubMed]
- Decencière, E.; Zhang, X.; Cazuguel, G.; Lay, B.; Cochener, B.; Trone, C.; Gain, P.; Ordonez, R.; Massin, P.; Erginay, A. Feedback on a publicly distributed image database: The Messidor database. Image Anal. Stereol. 2014, 33, 231–234. [Google Scholar] [CrossRef]
- Abràmoff, M.D.; Folk, J.C.; Han, D.P.; Walker, J.D.; Williams, D.F.; Russell, S.R.; Massin, P.; Cochener, B.; Gain, P.; Tang, L. Automated analysis of retinal images for detection of referable diabetic retinopathy. JAMA Ophthalmol. 2013, 131, 351–357. [Google Scholar] [CrossRef]
- Chetoui, M.; Akhloufi, M.A.; Kardouchi, M. Diabetic retinopathy detection using machine learning and texture features. In Proceedings of the IEEE Canadian Conference on Electrical & Computer Engineering (CCECE), Quebec, QC, Canada, 13–16 May 2018; pp. 1–4. [Google Scholar]
- Orlando, J.I.; Prokofyeva, E.; Del Fresno, M.; Blaschko, M.B. An ensemble deep learning based approach for red lesion detection in fundus images. Comput. Methods Programs Biomed. 2018, 153, 115–127. [Google Scholar] [CrossRef] [PubMed]
- Zeng, X.; Chen, H.; Luo, Y.; Ye, W. Automated diabetic retinopathy detection based on binocular siamese-like convolutional neural network. IEEE Access 2019, 7, 30744–30753. [Google Scholar] [CrossRef]
- Foundation, C.H. Diabetic Retinopathy Detection. Available online: https://www.kaggle.com/competitions/diabetic-retinopathy-detection/overview (accessed on 11 June 2022).
- Ali, A.; Qadri, S.; Khan Mashwani, W.; Kumam, W.; Kumam, P.; Naeem, S.; Goktas, A.; Jamal, F.; Chesneau, C.; Anam, S. Machine learning based automated segmentation and hybrid feature analysis for diabetic retinopathy classification using fundus image. Entropy 2020, 22, 567. [Google Scholar] [CrossRef]
- Gayathri, S.; Gopi, V.P.; Palanisamy, P. Diabetic retinopathy classification based on multipath CNN and machine learning classifiers. Phys. Eng. Sci. Med. 2021, 44, 639–653. [Google Scholar] [CrossRef] [PubMed]
- Porwal, P.; Pachade, S.; Kamble, R.; Kokare, M.; Deshmukh, G.; Sahasrabuddhe, V.; Meriaudeau, F. Indian diabetic retinopathy image dataset (IDRiD): A database for diabetic retinopathy screening research. Data 2018, 3, 25. [Google Scholar] [CrossRef]
- Mahmoud, M.H.; Alamery, S.; Fouad, H.; Altinawi, A.; Youssef, A.E. An automatic detection system of diabetic retinopathy using a hybrid inductive machine learning algorithm. Pers. Ubiquitous Comput. 2021, 1–15. [Google Scholar] [CrossRef]
- Fraz, M.M.; Remagnino, P.; Hoppe, A.; Uyyanonvara, B.; Rudnicka, A.R.; Owen, C.G.; Barman, S.A. An ensemble classification-based approach applied to retinal blood vessel segmentation. IEEE Trans. Biomed. Eng. 2012, 59, 2538–2548. [Google Scholar] [CrossRef]
- Math, L.; Fatima, R. Adaptive machine learning classification for diabetic retinopathy. Multimed. Tools Appl. 2021, 80, 5173–5186. [Google Scholar] [CrossRef]
- Huang, G.; Liu, Z.; Van Der Maaten, L.; Weinberger, K.Q. Densely connected convolutional networks. In Proceedings of the IEEE Conference on Computer Vision and Pattern Recognition (CVPR), Honolulu, HI, USA, 21–26 July 2017; pp. 4700–4708. [Google Scholar]
- Goldberger, J.; Hinton, G.E.; Roweis, S.; Salakhutdinov, R.R. Neighbourhood components analysis. Adv. Neural Inf. Processing Syst. 2004, 17, 513–520. [Google Scholar]
- Noble, W.S. What is a support vector machine? Nat. Biotechnol. 2006, 24, 1565–1567. [Google Scholar] [CrossRef]
- APTOS. APTOS 2019 Blindness Detection. Available online: https://www.kaggle.com/competitions/aptos2019-blindness-detection/rules (accessed on 1 August 2021).
- Dosovitskiy, A.; Beyer, L.; Kolesnikov, A.; Weissenborn, D.; Zhai, X.; Unterthiner, T.; Dehghani, M.; Minderer, M.; Heigold, G.; Gelly, S. An image is worth 16 × 16 words: Transformers for image recognition at scale. arXiv 2020, arXiv:2010.11929. [Google Scholar]
- Tolstikhin, I.O.; Houlsby, N.; Kolesnikov, A.; Beyer, L.; Zhai, X.; Unterthiner, T.; Yung, J.; Steiner, A.; Keysers, D.; Uszkoreit, J. Mlp-mixer: An all-mlp architecture for vision. Adv. Neural Inf. Processing Syst. 2021, 34, 1–16. [Google Scholar]
- Deng, J.; Dong, W.; Socher, R.; Li, L.-J.; Li, K.; Fei-Fei, L. Imagenet: A large-scale hierarchical image database. In Proceedings of the 2009 IEEE Conference on Computer Vision and Pattern Recognition, Miami, FL, USA, 20–25 June 2009; pp. 248–255. [Google Scholar]
- Taufiqurrahman, S.; Handayani, A.; Hermanto, B.R.; Mengko, T.L.E.R. Diabetic retinopathy classification using a hybrid and efficient MobileNetV2-SVM model. In Proceedings of the 2020 IEEE REGION 10 CONFERENCE (TENCON), Osaka, Japan, 16–19 November 2020; pp. 235–240. [Google Scholar]
- Majumder, S.; Kehtarnavaz, N. Multitasking deep learning model for detection of five stages of diabetic retinopathy. IEEE Access 2021, 9, 123220–123230. [Google Scholar] [CrossRef]
- Bodapati, J.D.; Naralasetti, V.; Shareef, S.N.; Hakak, S.; Bilal, M.; Maddikunta, P.K.R.; Jo, O. Blended multi-modal deep convnet features for diabetic retinopathy severity prediction. Electronics 2020, 9, 914. [Google Scholar] [CrossRef]
- Kassani, S.H.; Kassani, P.H.; Khazaeinezhad, R.; Wesolowski, M.J.; Schneider, K.A.; Deters, R. Diabetic retinopathy classification using a modified xception architecture. In Proceedings of the 2019 IEEE International Symposium on Signal Processing and Information Technology (ISSPIT), Ajman, United Arab Emirates, 10–12 December 2019; pp. 1–6. [Google Scholar]
- Gangwar, A.K.; Ravi, V. Diabetic retinopathy detection using transfer learning and deep learning. In Evolution in Computational Intelligence; Springer: Singapore, 2021; pp. 679–689. [Google Scholar]


| Study | Method | Dataset | Classes (Validation) | Results (%) |
|---|---|---|---|---|
| Arunkumar and Karthigaikumar 2017 [15] | DBN-based feature extraction, SVM | ARIA [16] | Normal; DR, age-related macular degeneration | Acc 96.73 Sen 79.32 Spe 97.89 |
| Abbas et al., 2017 [17] | GLOH, principal component analysis, deep neural network | DIARETDB1 [18] | Normal, mild NPDR, moderate NPDR, severe NPDR, PDR (10-fold CV) | AUC 92.4 Sen 92.18 Spe 94.5 |
| Krause et al., 2018 [19] | Custom CNN | Own dataset, Messidor-2 [20,21] | Not available | AUC 98.6 |
| Chetoui et al., 2018 [22] | LTP, LESH, and SVM | Messidor [20,21] | DR, non-DR (10-fold CV) | Acc 90.04 AUC 93.1 |
| Orlando et al., 2018 [23] | CNN and handcrafted feature extraction, random forest | Messidor [20,21] | Lesion detection | AUC 93.47 Sen 97.21 |
| Zeng et al., 2019 [24] | InceptionV3-based CNN | Kaggle [25] | DR, non-DR (80:20 hold-out) | AUC 95.1 |
| Ali et al., 2020 [26] | Texture analysis (histogram, wavelet, co-occurrence, run-length matrix), logistic model tree | Own dataset | Normal, mild NPDR, moderate NPDR, severe NPDR, PDR (10-fold CV) | Acc 99.73 Cohen’s kappa 99.67 |
| Gayathri et al., 2021 [27] | Multipath CNN, ResNet-50, and VGG-16-based feature extraction, classifiers (SVM, random forest, J48) | 3 datasets: IDRiD [28], Kaggle [25], Messidor [20,21] | IDRiD: Normal, mild NPDR, moderate NPDR, severe NPDR, PDR; Kaggle: Normal, mild NPDR, moderate NPDR, severe NPDR, PDR Messidor: Normal, mild DR, moderate DR, severe DR (10-fold CV) | Overall Acc 99.62 Cohen’s kappa 99.5 |
| Mahmoud et al., 2021 [29] | HIMLA (preprocessing, segmentation, feature extraction, and classification) | Chase_DB1 [30] | DR, non-DR | Acc 96.62 Sen 95.31 Spe 96.88 |
| Math and Fatima 2021 [31] | Custom CNN | Kaggle [25], DIARETDB1 [18] | Normal, mild, moderate, NPDR, PDR | AUC 96.3 Sen 96.37 Spe 96.37 |
| Results (%) | ||
|---|---|---|
| Performance Metric | 10-Fold CV | 80:20 Hold-Out Validation |
| Accuracy | 91.55 | 94.06 |
| Unweighted average recall | 92.67 | 94.45 |
| Unweighted average precision | 92.77 | 94.74 |
| Average F1 | 92.70 | 94.59 |
| Cohen’s kappa | 86.34 | 90.38 |
| Geometric mean | 92.61 | 94.45 |
| Results (%) | ||
|---|---|---|
| Performance Metric | 10-Fold CV | 80:20 Hold-Out Validation |
| Accuracy | 92.60 | 93.85 |
| Unweighted average recall | 79.64 | 80.60 |
| Unweighted average precision | 86.63 | 90.90 |
| Average F1 | 82.06 | 83.78 |
| Cohen’s kappa | 86.74 | 88.94 |
| Geometric mean | 75.28 | 76.04 |
| Results (%) | ||
|---|---|---|
| Performance Metric | 10-Fold CV | 80:20 Hold-Out Validation |
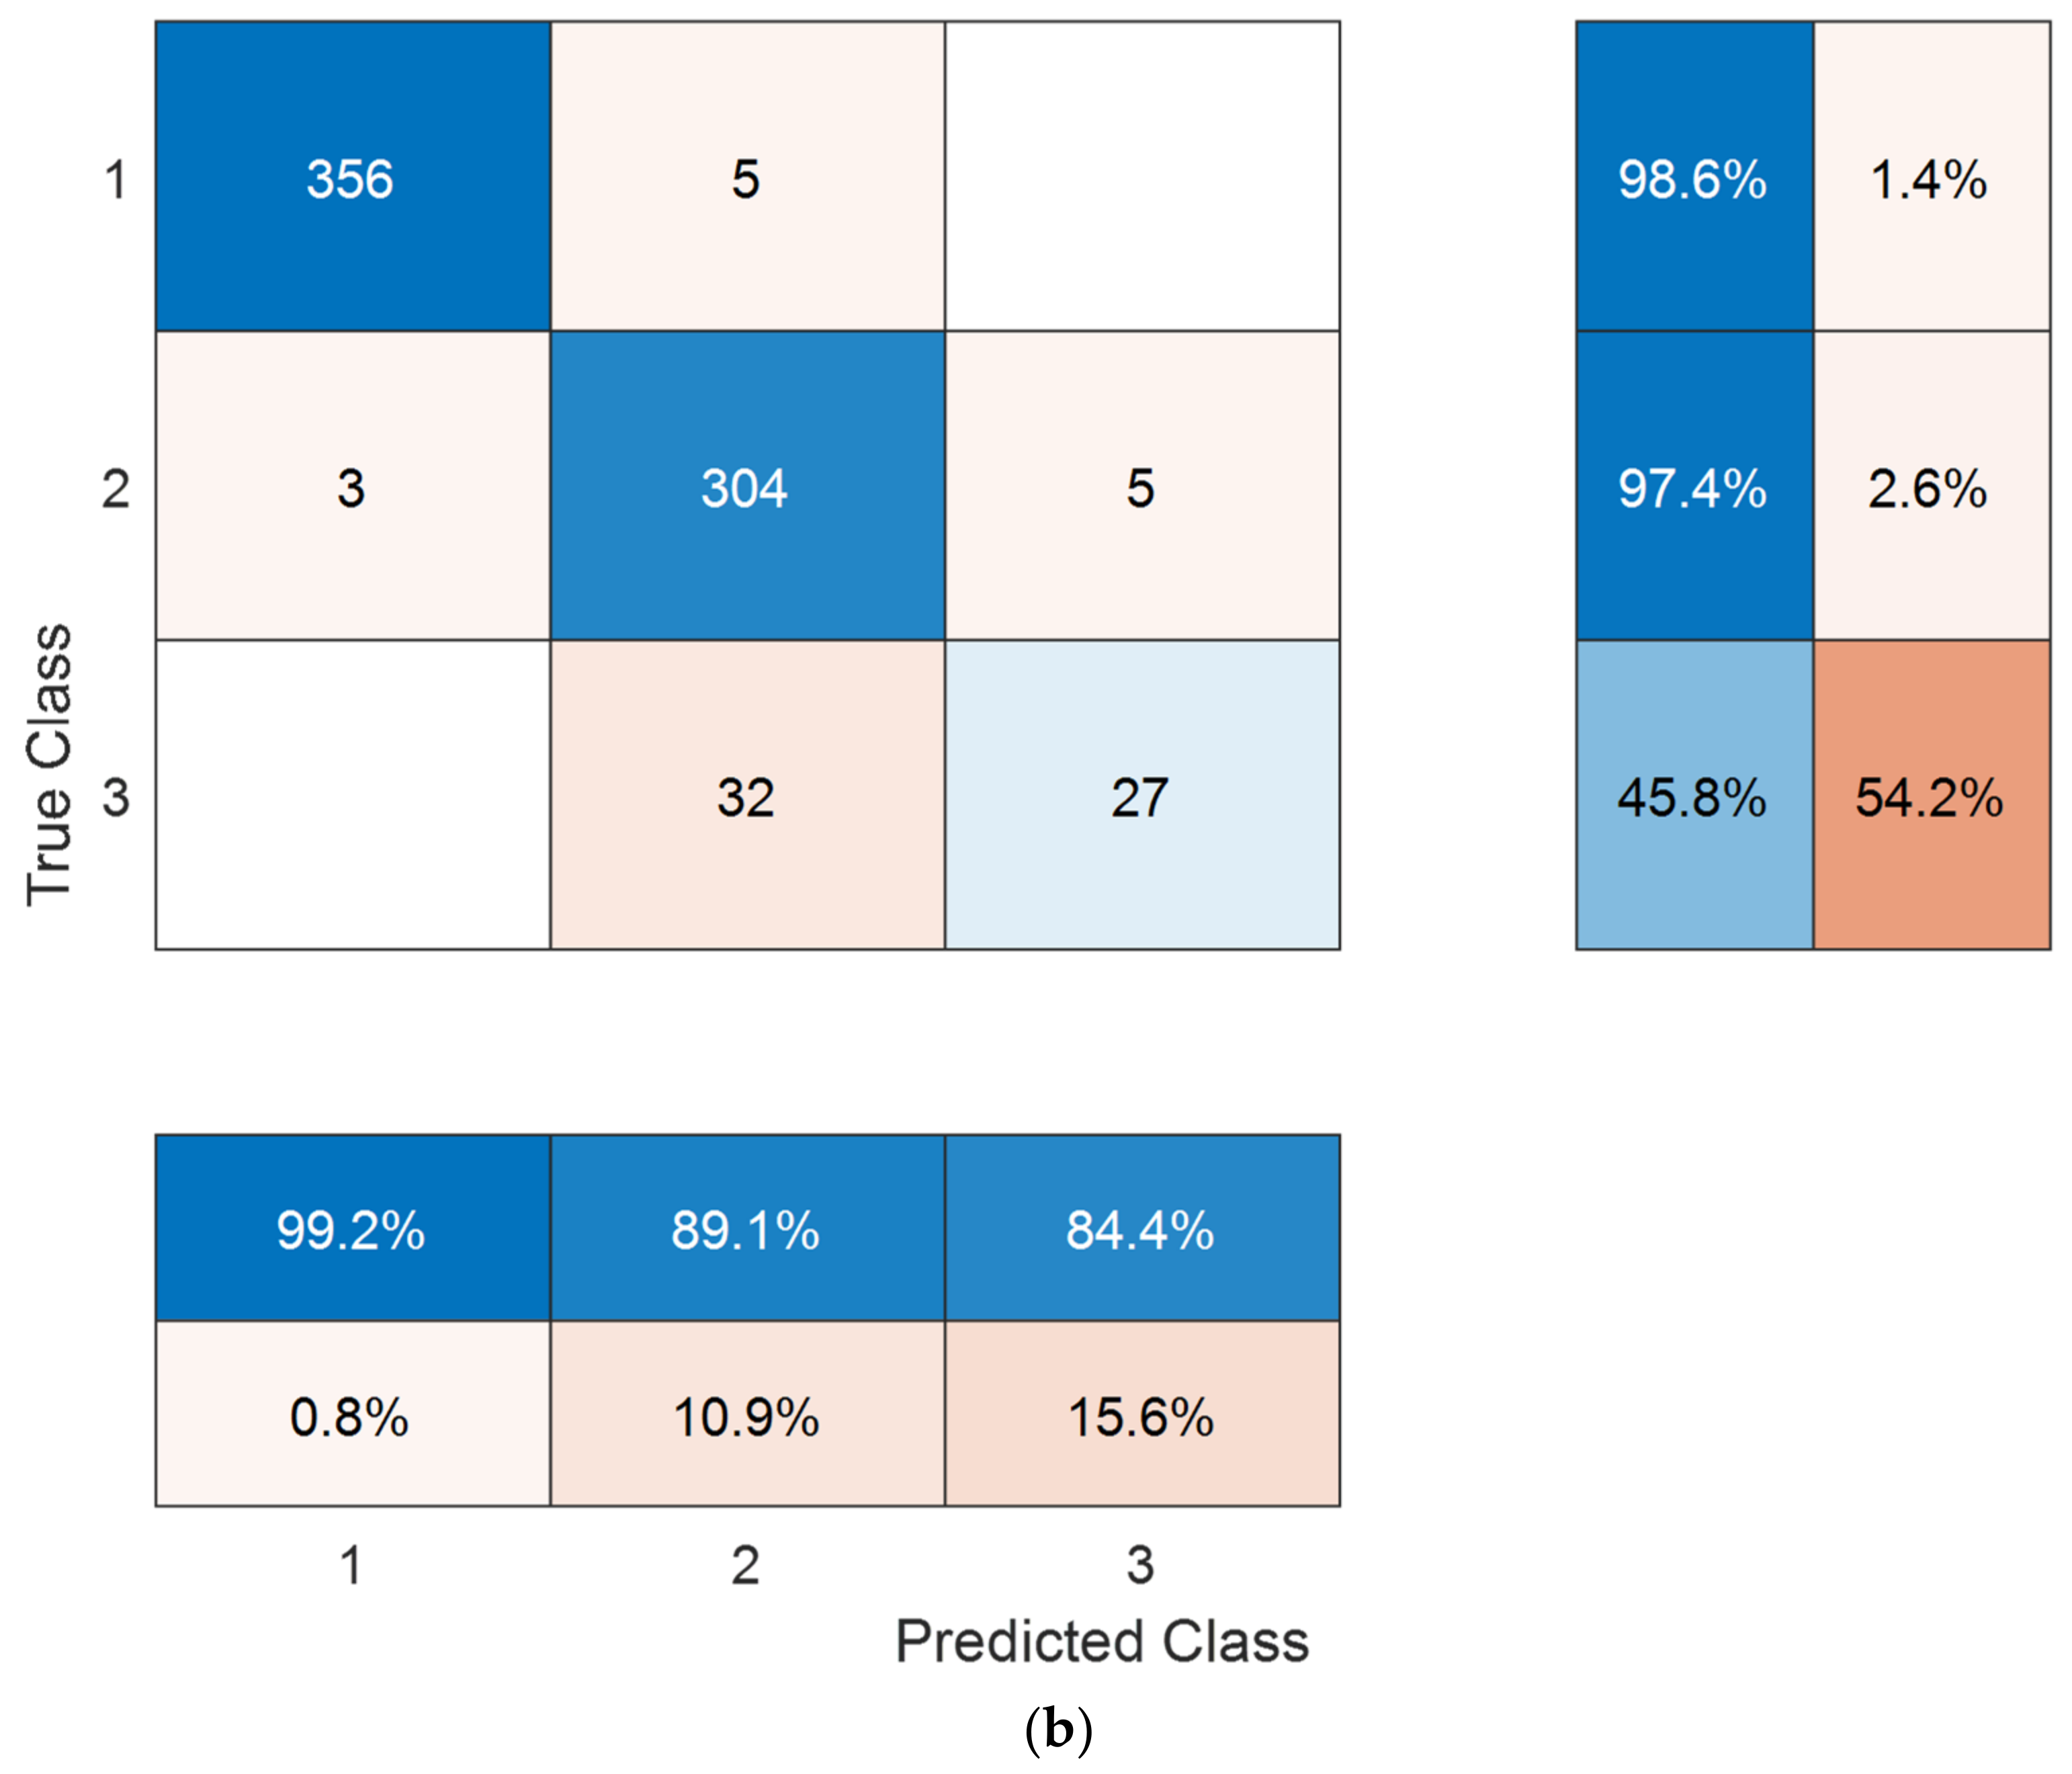
| Accuracy | 84.90 | 85.93 |
| Unweighted average recall | 68.53 | 69.72 |
| Unweighted average precision | 74.32 | 77.11 |
| Average F1 | 70.75 | 72.51 |
| Cohen’s kappa | 76.91 | 78.37 |
| Geometric mean | 65.25 | 66.61 |
| Automated Diabetic Retinopathy Detection Model | ||||
|---|---|---|---|---|
| Our New DR Dataset | Case 1 Created Using APTOS 2019 | |||
| Dataset Information | 3 Class: PDR/NPDR/Normal 2355 Images | 3 Class: Normal/NPDR/PDR 3662 Images | ||
| Performance Metric | 10-Fold CV | 80:20 Hold-Out | 10-Fold CV | 80:20 Hold-Out |
| Accuracy | 91.55 | 94.06 | 92.60 | 93.85 |
| Unweighted average recall | 92.67 | 94.45 | 79.64 | 80.60 |
| Unweighted average precision | 92.77 | 94.74 | 86.63 | 90.90 |
| Average F1 | 92.70 | 94.59 | 82.06 | 83.78 |
| Cohen’s kappa | 86.34 | 90.38 | 86.74 | 88.94 |
| Geometric mean | 92.61 | 94.45 | 75.28 | 76.04 |
| Author(s) | Method | Key Points | Results (%) |
|---|---|---|---|
| Majumder and Kehtarnavaz 2021 [40] | Modified DenseNet-based squeeze excitation densely connected multitasking network (MSEDenseNet) |
| Acc 81.0 Pre 67.0 Rec 59.0 F1 61.0 Kap 84.0 |
| Podapati et al., 2020 [41] | Feature extraction using VGG16′s fc1 and fc2 layers and XCeption’s global average pooling layers, deep neural network |
| Acc 80.96 Kap 71.1 |
| Kassani et al., 2019 [42] | Xception CNN architecture |
| Acc 83.09 Sen 88.24 Spe 87.0 |
| Taufiqurrahman et al., 2020 [39] | MobileNetV2 CNN architecture, SVM |
| Acc 79.0 Kap 88.0 |
| Gangwar and Ravi 2021 [43] | Inception and ResNet-based custom CNN |
| Acc 82.18 |
| Our model, Case 2 | Feature extraction with DenseNet, feature selection with neighborhood component analysis, cubic SVM classifier |
| 10-fold CV |
| Acc 84.90 UAR 68.53 UAP 74.32 F1 70.75 Kap 76.91 GM 65.25 | |||
| 80:20 hold-out | |||
| Acc 85.93 UAR 69.72 UAP 77.11 F1 72.51 Kap 78.37 GM 66.61 |
Publisher’s Note: MDPI stays neutral with regard to jurisdictional claims in published maps and institutional affiliations. |
© 2022 by the authors. Licensee MDPI, Basel, Switzerland. This article is an open access article distributed under the terms and conditions of the Creative Commons Attribution (CC BY) license (https://creativecommons.org/licenses/by/4.0/).
Share and Cite
Kobat, S.G.; Baygin, N.; Yusufoglu, E.; Baygin, M.; Barua, P.D.; Dogan, S.; Yaman, O.; Celiker, U.; Yildirim, H.; Tan, R.-S.; et al. Automated Diabetic Retinopathy Detection Using Horizontal and Vertical Patch Division-Based Pre-Trained DenseNET with Digital Fundus Images. Diagnostics 2022, 12, 1975. https://doi.org/10.3390/diagnostics12081975
Kobat SG, Baygin N, Yusufoglu E, Baygin M, Barua PD, Dogan S, Yaman O, Celiker U, Yildirim H, Tan R-S, et al. Automated Diabetic Retinopathy Detection Using Horizontal and Vertical Patch Division-Based Pre-Trained DenseNET with Digital Fundus Images. Diagnostics. 2022; 12(8):1975. https://doi.org/10.3390/diagnostics12081975
Chicago/Turabian StyleKobat, Sabiha Gungor, Nursena Baygin, Elif Yusufoglu, Mehmet Baygin, Prabal Datta Barua, Sengul Dogan, Orhan Yaman, Ulku Celiker, Hakan Yildirim, Ru-San Tan, and et al. 2022. "Automated Diabetic Retinopathy Detection Using Horizontal and Vertical Patch Division-Based Pre-Trained DenseNET with Digital Fundus Images" Diagnostics 12, no. 8: 1975. https://doi.org/10.3390/diagnostics12081975