Figure 1.
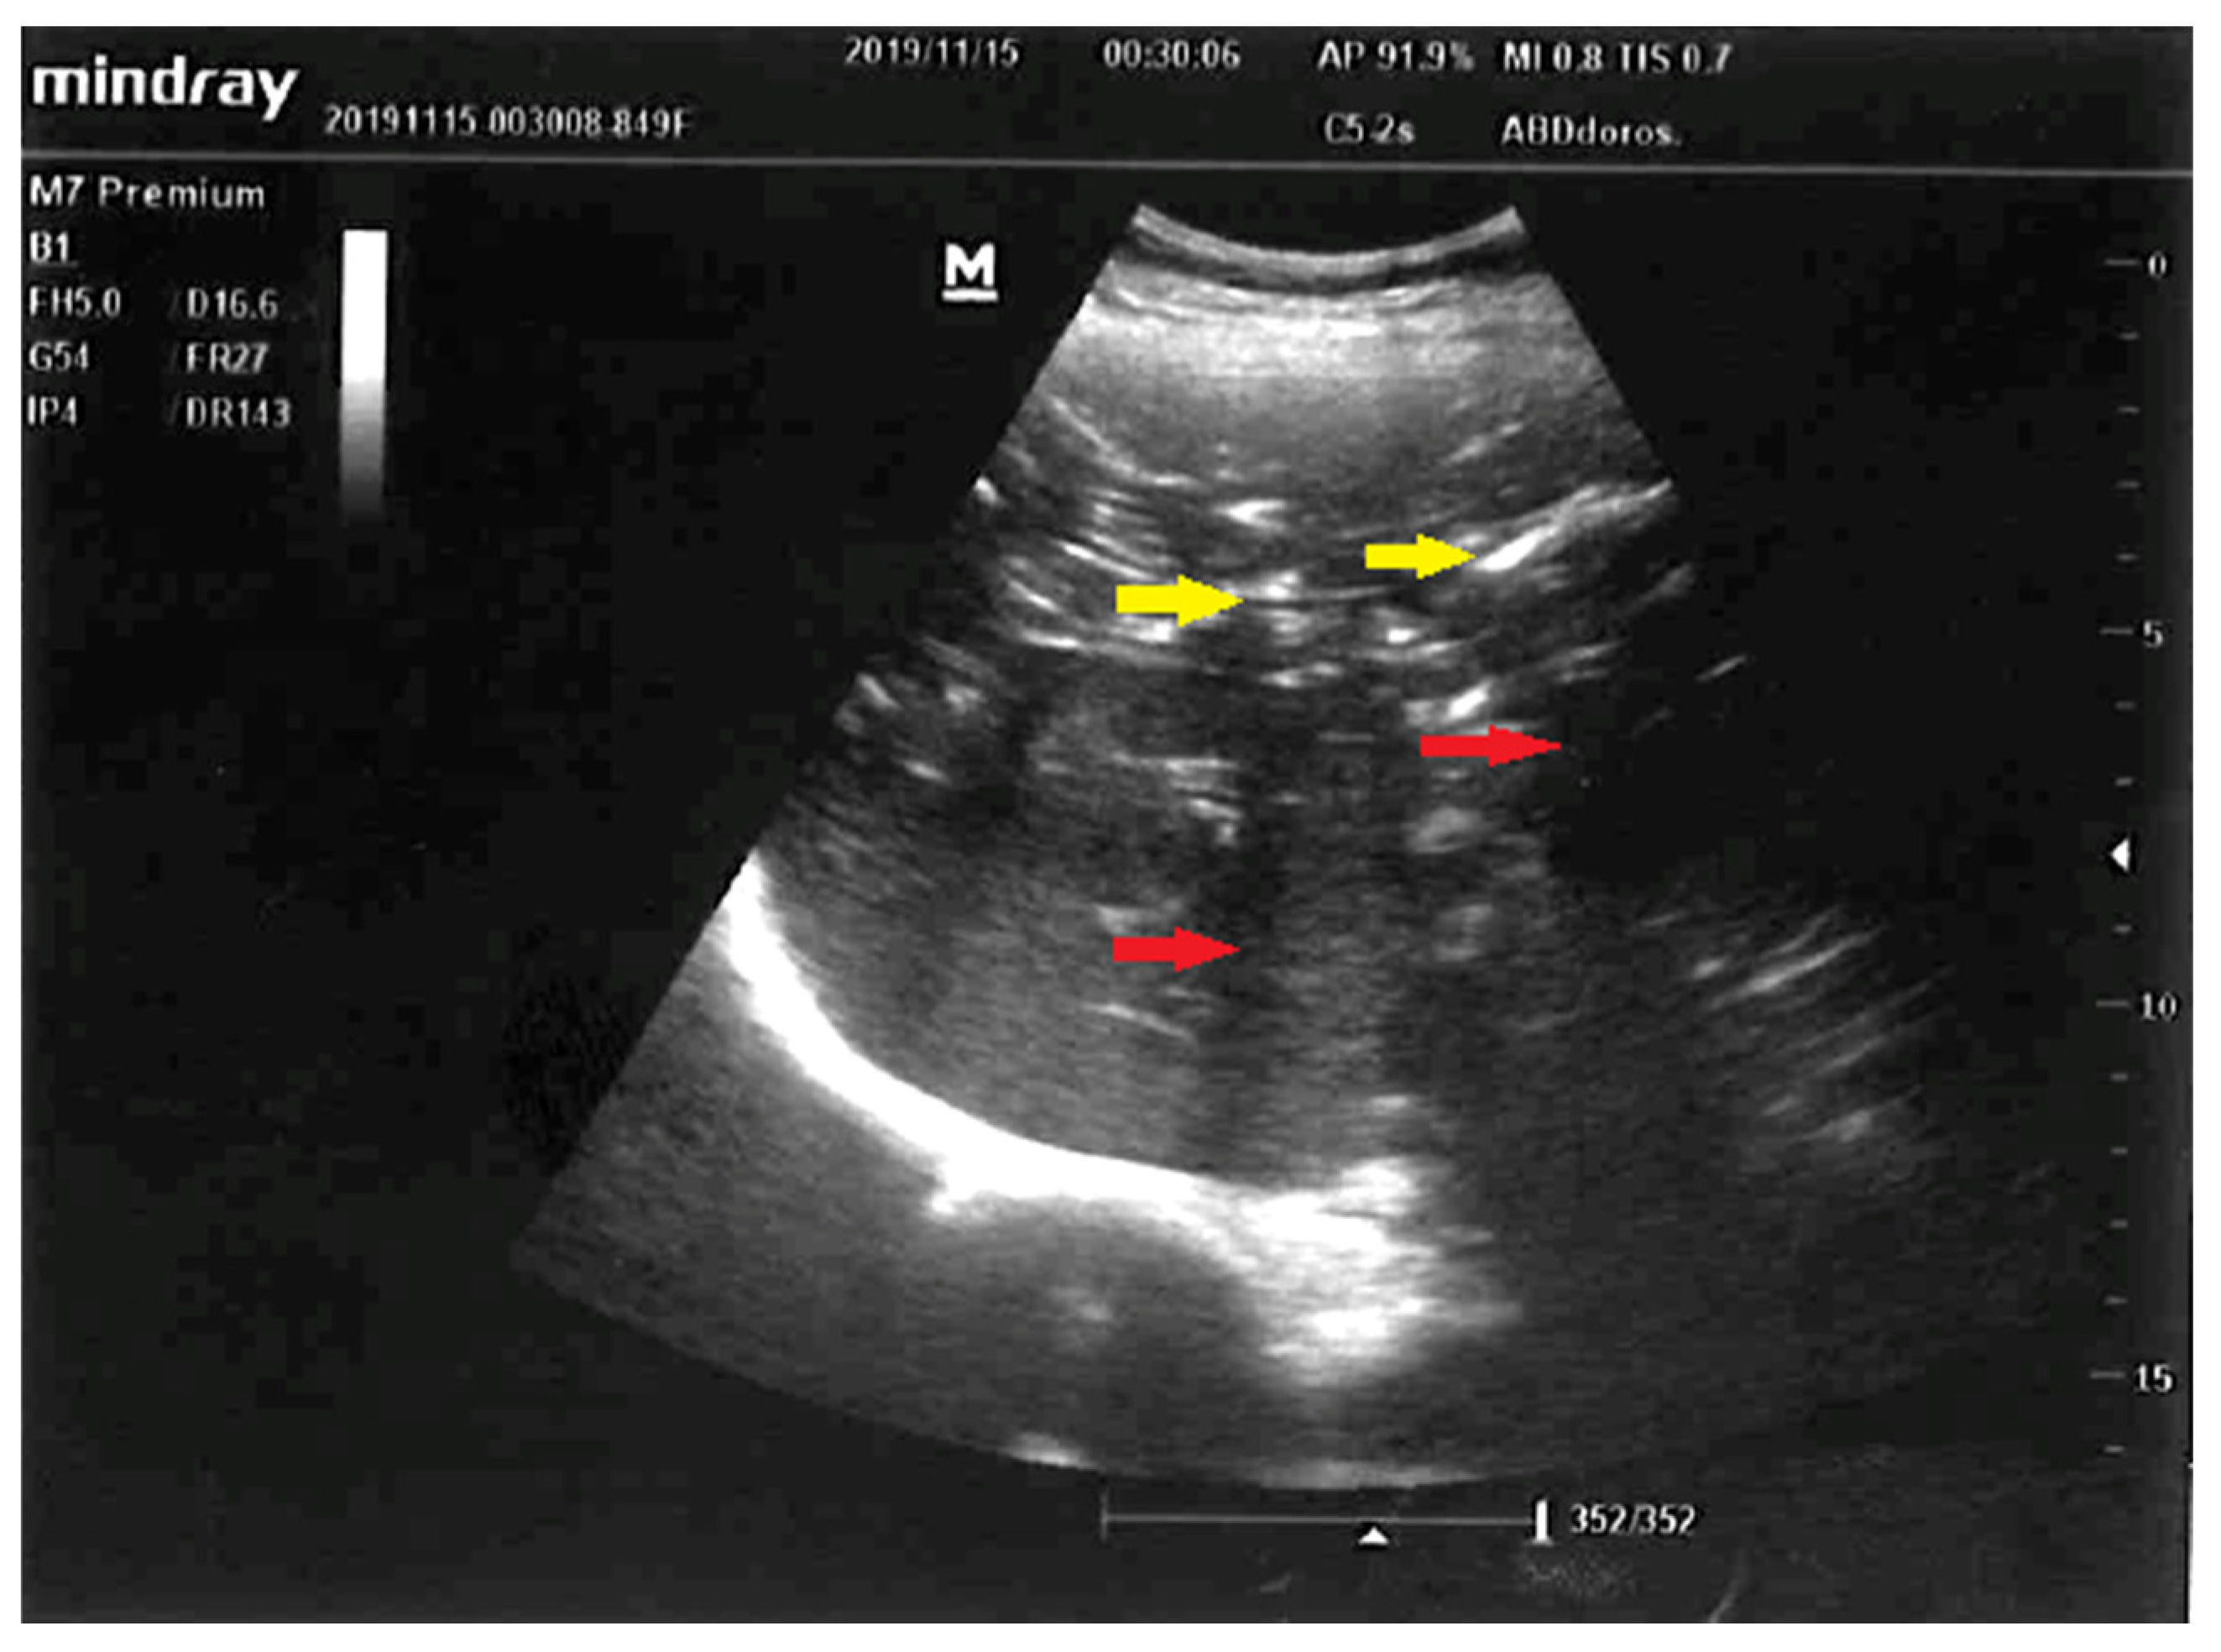
Early liver ultrasound (US) performed to find a source of sepsis in a 52-year-old female suspected to have developed intraabdominal sepsis. Visualized here are: normal-sized liver, punctuated hyperechoic foci with anti-gravitational distribution (yellow arrows) casting acoustic shadows (red arrows). Due to characteristic appearance on liver US, the most likely diagnosis was hepatic portal venous gas (HPVG) [
1,
2]. Other less likely diagnoses were: pneumobilia due to cholangitis, hepatic micro-abscesses, and punctuate calcifications. Hepatic portal venous gas detected by US following liver transplantation or in suppurative cholangitis were described previously [
3,
4]. Although presence of mesenteric ischemia and gas in the portal venous circulation was previously revealed with computed tomography [
5,
6], in our case early abdominal US was performed, what expedited definite diagnosis and targeted treatment: choice of empiric broad-spectrum antibiotics and explorative laparotomy. This is the first time, to the best of our knowledge, that HPVG was visualized with US in the setting of acute mesenteric ischemia.
Figure 1.
Early liver ultrasound (US) performed to find a source of sepsis in a 52-year-old female suspected to have developed intraabdominal sepsis. Visualized here are: normal-sized liver, punctuated hyperechoic foci with anti-gravitational distribution (yellow arrows) casting acoustic shadows (red arrows). Due to characteristic appearance on liver US, the most likely diagnosis was hepatic portal venous gas (HPVG) [
1,
2]. Other less likely diagnoses were: pneumobilia due to cholangitis, hepatic micro-abscesses, and punctuate calcifications. Hepatic portal venous gas detected by US following liver transplantation or in suppurative cholangitis were described previously [
3,
4]. Although presence of mesenteric ischemia and gas in the portal venous circulation was previously revealed with computed tomography [
5,
6], in our case early abdominal US was performed, what expedited definite diagnosis and targeted treatment: choice of empiric broad-spectrum antibiotics and explorative laparotomy. This is the first time, to the best of our knowledge, that HPVG was visualized with US in the setting of acute mesenteric ischemia.
![Diagnostics 12 02034 g001]()
Figure 2.
(
A,
B) Multi-phase abdominal computed tomography performed immediately after liver US. No oral contrast was administered due to urgency–the stomach is filled with accidental content making it isodense to the liver parenchyma. Therefore it is difficult to distinguish this from liver parenchyma in (
A). Routine amount of intravenous contrast agent was administered. (
A)–coronal reconstruction, portal-venous phase, slice showing the portal vein was selected, minimum intensity projection with 3.7 mm thickness was used in order to better show gas in the portal circulation. Visualized are: gas in the wall of the small intestine (red arrow), gas in the portal vein (blue arrow) and most of its branches-on the picture visible mostly in segments V and VIII, gas in the wall of stomach-lesser curvature (yellow arrow), and distended small intestine filled with fluid (width 33 mm). (
B)–axial plane, portal-venous phase, at the level of pancreas, adrenal glands and portal vein, minimum intensity projection with 2.4 mm thickness was used for the same reason as in the (
A). Visualized are: gas in the portal vein (visible gas-blood level) and most of its branches (blue arrow), paring of hepatic segment VI portal branches due to anti-gravitational distribution, gas in the wall of stomach (yellow arrow). No gas was present in the hepatic vein circulation as an aquarium sign [
7], the celiac trunk and superior mesenteric artery were narrow but patent, there were single gas microbubbles present in the spleen and in superior mesenteric vein, intra- and extrahepatic ducts were not dilated, and no pneumobilia was present.
![Diagnostics 12 02034 g002]()
Figure 3.
Intraoperative image taken during an explorative laparotomy. The photograph reveals necrosis of the stomach and small intestine. Due to the severity of necrosis, surgical treatment was abandoned. The patient died the following day from multi-organ failure.
Figure 3.
Intraoperative image taken during an explorative laparotomy. The photograph reveals necrosis of the stomach and small intestine. Due to the severity of necrosis, surgical treatment was abandoned. The patient died the following day from multi-organ failure.


