

Detecting Coronary Artery Disease from Computed Tomography Images Using a Deep Learning Technique


Abstract
:1. Introduction
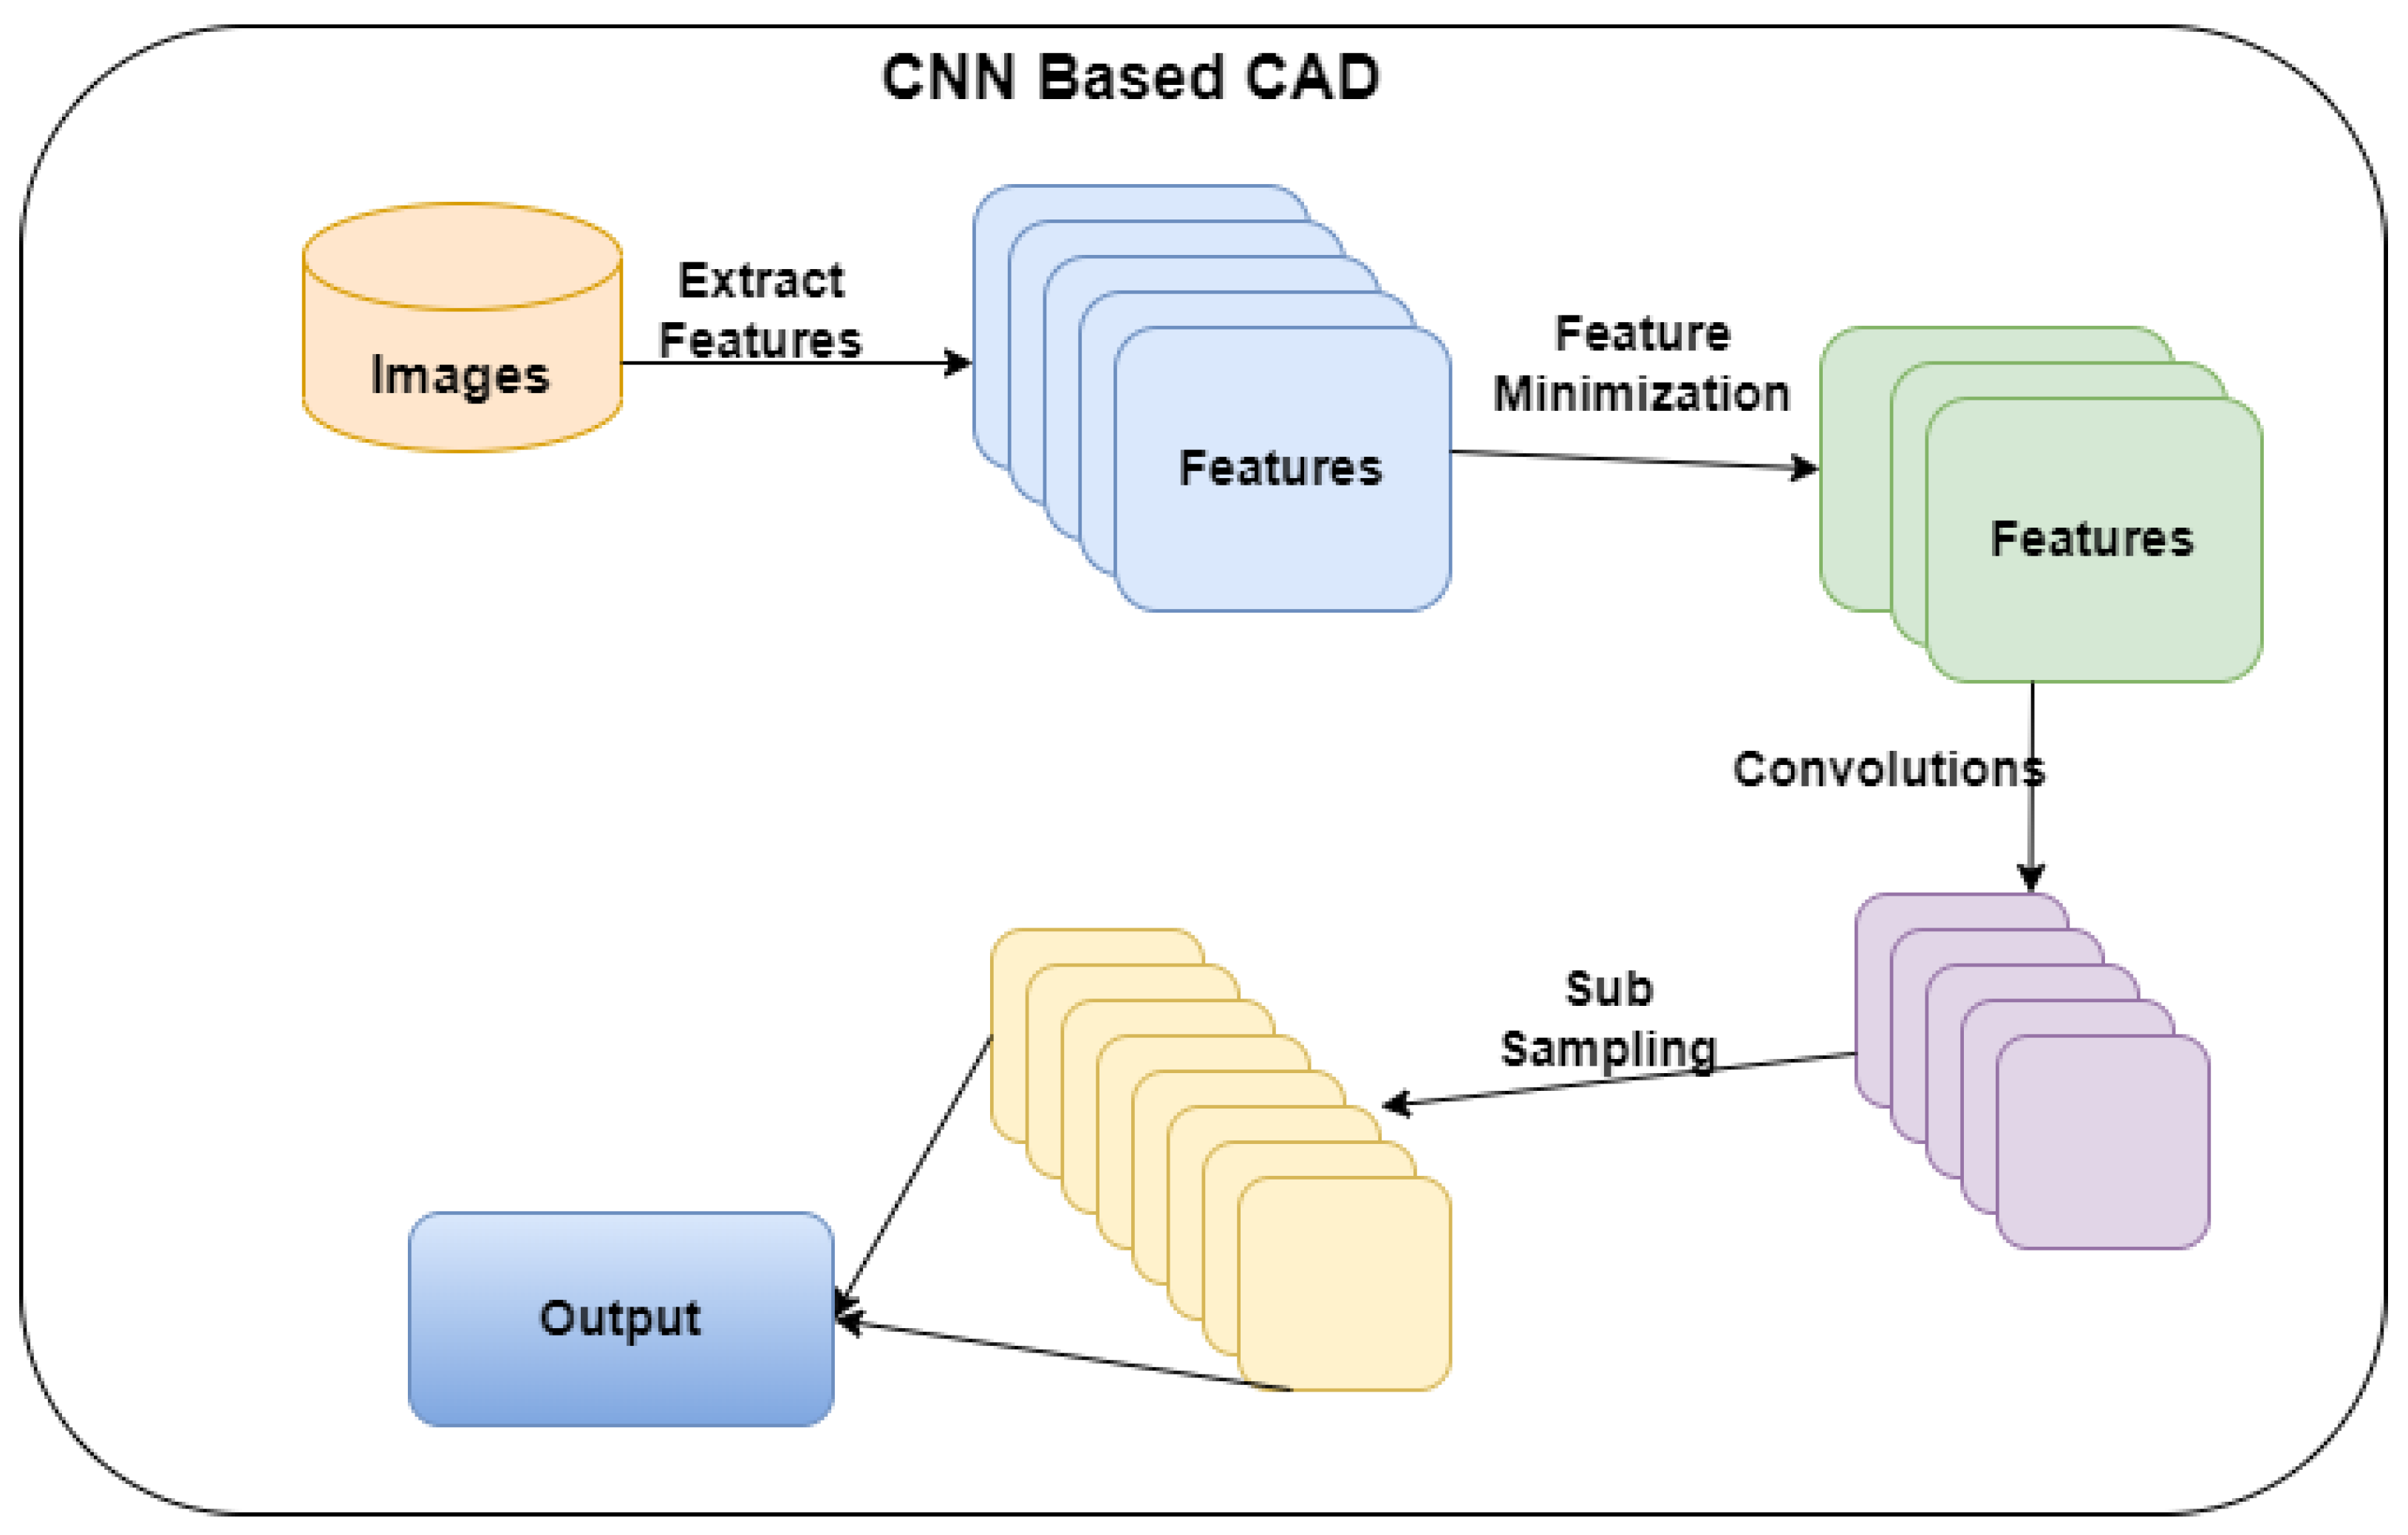
- To build a CNN model to predict CAD from CT images.
- To improve the performance of CNN by reducing the number of features.
2. Literature Review
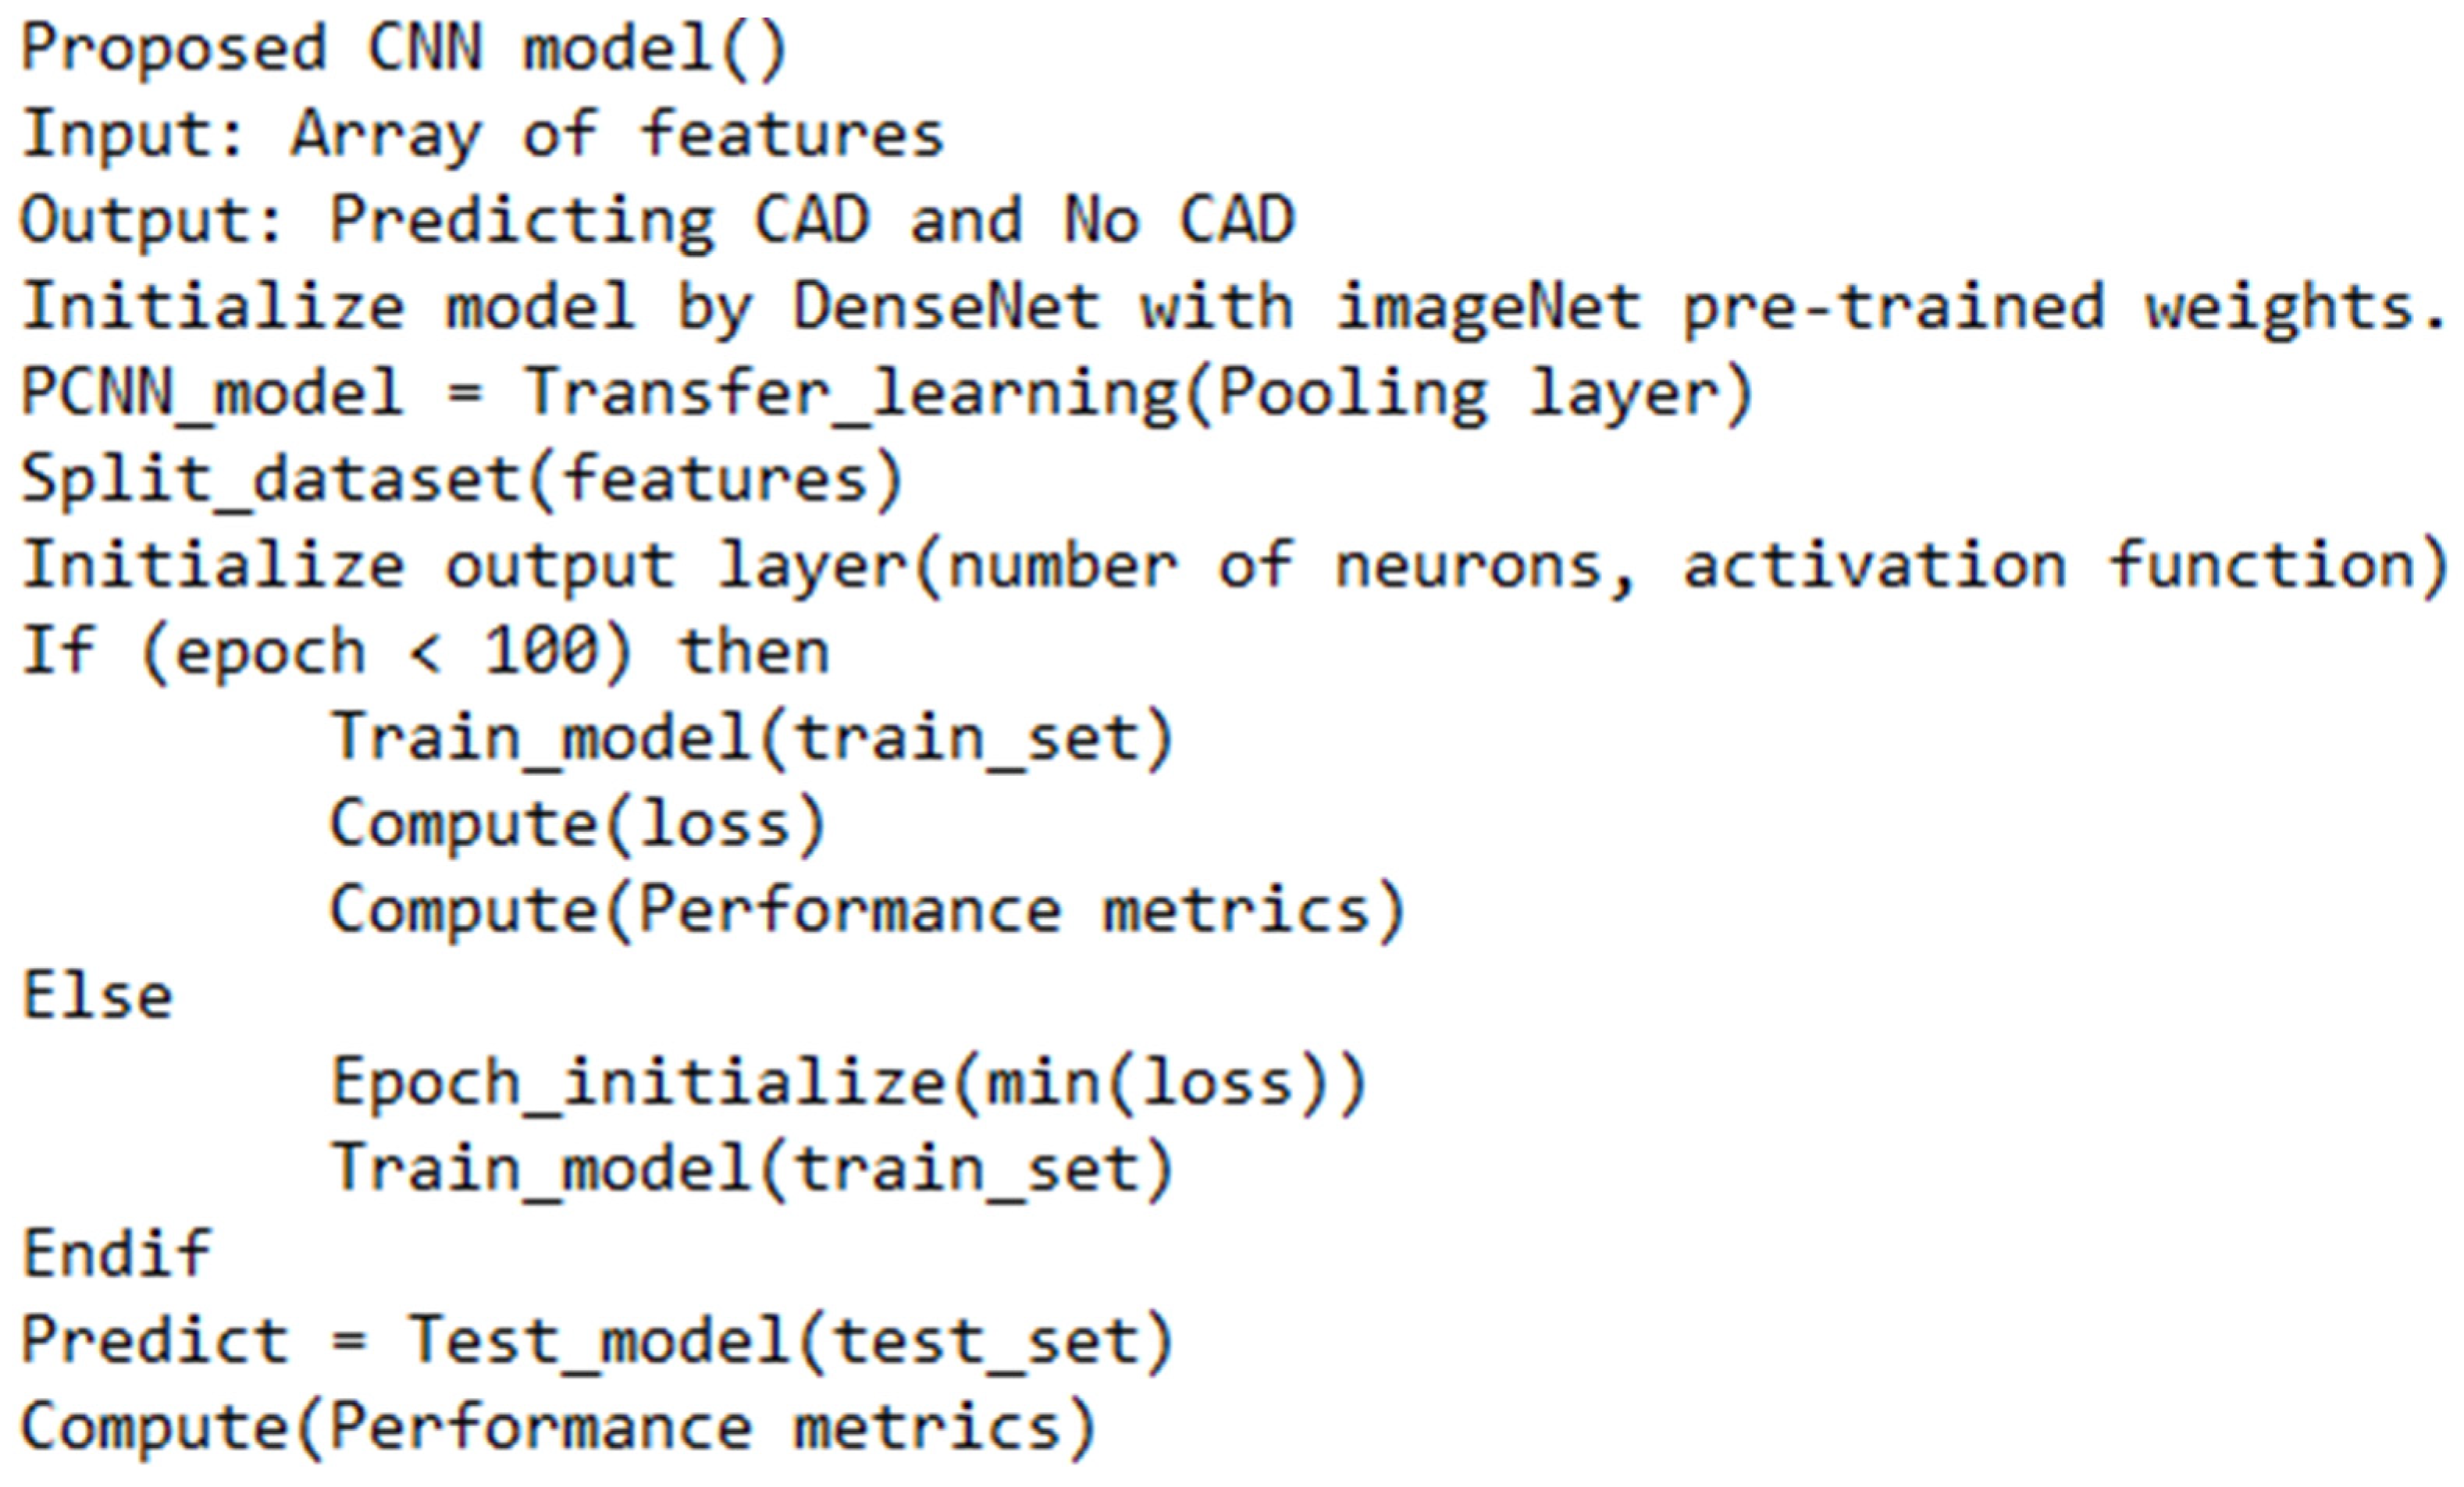
3. Research Methodology
4. Experiment and Results
4.1. Uncertainty Estimation
4.2. Clinical Insights and Limitations
5. Conclusions
Author Contributions
Funding
Institutional Review Board Statement
Informed Consent Statement
Data Availability Statement
Conflicts of Interest
References
- Lin, S.; Li, Z.; Fu, B.; Chen, S.; Li, X.; Wang, Y.; Wang, X.; Lv, B.; Xu, B.; Song, X.; et al. Feasibility of using deep learning to detect coronary artery disease based on facial photo. Eur. Heart J. 2020, 41, 4400–4411. [Google Scholar] [PubMed]
- Betancur, J.; Hu, L.H.; Commandeur, F.; Sharir, T.; Einstein, A.J.; Fish, M.B.; Ruddy, T.D.; Kaufmann, P.A.; Sinusas, A.J.; Miller, E.J.; et al. Deep learning analysis of upright-supine high-efficiency SPECT myocardial perfusion imaging for prediction of obstructive coronary artery disease: A multicenter study. J. Nucl. Med. 2019, 60, 664–670. [Google Scholar] [CrossRef] [PubMed]
- Abdolmanafi, A.; Duong, L.; Dahdah, N.; Adib, I.R.; Cheriet, F. Characterization of coronary artery pathological formations from OCT imaging using deep learning. Biomed. Opt. Express 2018, 9, 4936–4960. [Google Scholar] [CrossRef]
- Demirer, M.; Gupta, V.; Bigelow, M.; Erdal, B.; Prevedello, L.; White, R. Image Dataset for a CNN Algorithm Development to Detect Coronary Atherosclerosis in Coronary CT Angiography. Mendeley Data, V1. Available online: https://data.mendeley.com/datasets/fk6rys63h9/1 (accessed on 2 November 2021).
- Hong, Y.; Commandeur, F.; Cadet, S.; Goeller, M.; Doris, M.K.; Chen, X.; Kwiecinski, J.; Berman, D.S.; Slomka, P.J.; Chang, H.J.; et al. Deep learning-based stenosis quantification from coronary CT angiography. Proc. SPIE Int. Soc. Opt. Eng. 2019, 10949, 109492I. [Google Scholar]
- Zreik, M.; Lessmann, N.; van Hamersvelt, R.W.; Wolterink, J.M.; Voskuil, M.; Viergever, M.A.; Leiner, T.; Išgum, I. Deep learning analysis of the myocardium in coronary CT angiography for identification of patients with functionally significant coronary artery stenosis. Med. Image Anal. 2018, 1, 72–85. [Google Scholar] [CrossRef]
- Lih, O.S.; Jahmunah, V.; San, T.R.; Ciaccio, E.J.; Yamakawa, T.; Tanabe, M.; Kobayashi, M.; Faust, O.; Acharya, U.R. Comprehensive electrocardiographic diagnosis based on deep learning. Artif. Intell. Med. 2020, 103, 101789. [Google Scholar] [CrossRef]
- Hampe, N.; Wolterink, J.M.; Van Velzen, S.G.M.; Leiner, T.; Išgum, I. Machine Learning for Assessment of Coronary Artery Disease in Cardiac CT: A Survey. Front. Cardiovasc. Med. 2019, 6, 172. [Google Scholar] [CrossRef]
- Xu, X.; Lin, J.; Tao, Y.; Wang, X. An Improved DenseNet Method Based on Transfer Learning for Fundus Medical Images. In Proceedings of the 7th International Conference on Digital Home (ICDH), Guilin, China, 30 November–1 December 2018; pp. 137–140. [Google Scholar]
- Zhang, J.; Wu, C.; Yu, X.; Lei, X. A Novel DenseNet Generative Adversarial Network for Heterogenous Low-Light Image Enhancement. Front. Neurorobotics 2021, 15, 700011. [Google Scholar] [CrossRef]
- Wang, Z.Q.; Zhou, Y.J.; Zhao, Y.X.; Shi, D.M.; Liu, Y.Y.; Liu, W.; Liu, X.L.; Li, Y.P. Diagnostic accuracy of a deep learning approach to calculate FFR from coronary CT angiography. J. Geriatr. Cardiol. 2019, 16, 42–48. [Google Scholar]
- Zreik, M.; van Hamersvelt, R.W.; Khalili, N.; Wolterink, J.M.; Voskuil, M.; Viergever, M.A. Deep learning analysis of coronary arteries in cardiac CT angiography for detection of patients requiring invasive coronary angiography. IEEE Trans. Med. Imaging 2019, 39, 1545–1557. [Google Scholar] [CrossRef]
- Abdar, M.; Książek, W.; Acharya, U.R.; Tan, R.; Makarenkov, V.; Pławiak, P. A new machine learning technique for an accurate diagnosis of coronary artery disease. Comput. Methods Programs Biomed. 2019, 179, 104992. [Google Scholar] [PubMed]
- Huang, W.; Huang, L.; Lin, Z.; Huang, S.; Chi, Y.; Zhou, J.; Zhang, J.; Tan, R.S.; Zhong, L. Coronary artery segmentation by deep learning neural networks on computed tomographic coronary angiographic images. In Proceedings of the 40th Annual International Conference of the IEEE Engineering in Medicine and Biology Society (EMBC), Honolulu, Hawaii, 18–21 July 2018; pp. 608–611. [Google Scholar]
- Tatsugami, F.; Higaki, T.; Nakamura, Y.; Yu, Z.; Zhou, J.; Lu, Y.; Fujioka, C.; Kitagawa, T.; Kihara, Y.; Iida, M.; et al. Deep learning–based image restoration algorithm for coronary CT angiography. Eur. Radiol. 2019, 29, 5322–5329. [Google Scholar] [CrossRef] [PubMed]
- Yang, S.; Kweon, J.; Roh, J.H.; Lee, J.H.; Kang, H.; Park, L.J.; Kim, D.J.; Yang, H.; Hur, J.; Kang, D.Y.; et al. Deep learning segmentation of major vessels in X-ray coronary angiography. Sci. Rep. 2019, 9, 16897. [Google Scholar] [PubMed]
- Cardiovascular Diseases. 2021. Available online: https://www.who.int/health-topics/cardiovascular-diseases (accessed on 1 November 2021).
- Banerjee, R.; Ghose, A.; Mandana, K.M. A hybrid CNN-LSTM architecture for detection of coronary artery disease from ECG. In Proceedings of the International Joint Conference on Neural Networks (IJCNN), Glasgow, UK, 19–24 July 2020; pp. 1–8. [Google Scholar]
- Zreik, M.; van Hamersvelt, R.W.; Wolterink, J.M.; Leiner, T.; Viergever, M.A.; Isgum, I. A recurrent CNN for automatic detection and classification of coronary artery plaque and stenosis in coronary CT angiography. IEEE Trans. Med. Imaging 2018, 38, 1588–1598. [Google Scholar]
- Wolterink, J.M.; van Hamersvelt, R.W.; Viergever, M.A.; Leiner, T.; Išgum, I. Coronary artery centerline extraction in cardiac CT angiography using a CNN-based orientation classifier. Med. Image Anal. 2019, 51, 46–60. [Google Scholar]
- Papandrianos, N.; Papageorgiou, E. Automatic Diagnosis of Coronary Artery Disease in SPECT Myocardial Perfusion Imaging Employing Deep Learning. Appl. Sci. 2021, 11, 6362. [Google Scholar] [CrossRef]
- Khan Mamun, M.M.R.; Alouani, A. FA-1D-CNN Implementation to Improve Diagnosis of Heart Disease Risk Level. In Proceedings of the 6th World Congress on Engineering and Computer Systems and Sciences, Virtual Conference, 13–15 August 2020; pp. 122-1–122-9. [Google Scholar]
- Sharma, M.; Acharya, U.R. A new method to identify coronary artery disease with ECG signals and time-Frequency concentrated antisymmetric biorthogonal wavelet filter bank. Pattern Recognit. Lett. 2019, 125, 235–240. [Google Scholar] [CrossRef]
- Alizadehsani, R.; Abdar, M.; Roshanzamir, M.; Khosravi, A.; Kebria, P.M.; Khozeimeh, F.; Nahavandi, S.; Sarrafzadegan, N.; Acharya, U.R. Machine learning-based coronary artery disease diagnosis: A comprehensive review. Comput. Biol. Med. 2019, 111, 103346. [Google Scholar] [CrossRef]
- Gülsün, M.A.; Funka-Lea, G.; Sharma, P.; Rapaka, S.; Zheng, Y. Coronary centerline extraction via optimal flow paths and CNN path pruning. In Proceedings of the International Conference on Medical Image Computing and Computer-Assisted Intervention, Athens, Greece, 17–21 October 2016; pp. 317–325. [Google Scholar]
- Liu, X.; Mo, X.; Zhang, H.; Yang, G.; Shi, C.; Hau, W.K. A 2-year investigation of the impact of the computed tomography–derived fractional flow reserve calculated using a deep learning algorithm on routine decision-making for coronary artery disease management. Eur. Radiol. 2021, 31, 7039–7046. [Google Scholar] [CrossRef]
- Nishi, T.; Yamashita, R.; Imura, S.; Tateishi, K.; Kitahara, H.; Kobayashi, Y.; Yock, P.G.; Fitzgerald, P.J.; Honda, Y. Deep learning-based intravascular ultrasound segmentation for the assessment of coronary artery disease. Int. J. Cardiol. 2021, 333, 55–59. [Google Scholar] [CrossRef]
- Liu, C.Y.; Tang, C.X.; Zhang, X.L.; Chen, S.; Xie, Y.; Zhang, X.Y.; Qiao, H.Y.; Zhou, C.S.; Xu, P.P.; Lu, M.J.; et al. Deep learning powered coronary CT angiography for detecting obstructive coronary artery disease: The effect of reader experience, calcification and image quality. Eur. J. Radiol. 2021, 142, 109835. [Google Scholar] [PubMed]
- Lin, A.; Kolossváry, M.; Motwani, M.; Išgum, I.; Maurovich-Horvat, P.; Slomka, P.J.; Dey, D. Artificial Intelligence in Cardiovascular Imaging for Risk Stratification in Coronary Artery Disease. Radiol. Cardiothorac. Imaging 2021, 3, e200512. [Google Scholar] [CrossRef] [PubMed]
- Cho, H.; Kang, S.; Min, H.; Lee, J.; Kim, W.; Kang, S.H.; Kang, D.; Lee, P.H.; Ahn, J.; Park, D.; et al. Intravascular ultrasound-based deep learning for plaque characterization in coronary artery disease. Atherosclerosis 2021, 324, 69–75. [Google Scholar] [PubMed]
- Alizadehsani, R.; Khosravi, A.; Roshanzamir, M.; Abdar, M.; Sarrafzadegan, N.; Shafie, D.; Khozeimeh, F.; Shoeibi, A.; Nahavandi, S.; Panahiazar, M.; et al. Coronary artery disease detection using artificial intelligence techniques: A survey of trends, geographical differences and diagnostic features 1991–2020. Comput. Biol. Med. 2021, 128, 104095. [Google Scholar] [PubMed]
- Rim, T.H.; Lee, C.J.; Tham, Y.; Cheung, N.; Yu, M.; Lee, G.; Kim, Y.; Ting, D.S.W.; Chong, C.C.Y.; Choi, Y.S.; et al. Deep-learning-based cardiovascular risk stratification using coronary artery calcium scores predicted from retinal photographs. Lancet Digit. Health 2021, 3, e306–e316. [Google Scholar] [CrossRef]
- Morris, S.A.; Lopez, K.N. Deep learning for detecting congenital heart disease in the fetus. Nat. Med. 2021, 27, 764–765. [Google Scholar]
- Cheung, W.K.; Bell, R.; Nair, A.; Menezes, L.J.; Patel, R.; Wan, S.; Chou, K.; Chen, J. A computationally efficient approach to segmentation of the aorta and coronary arteries using deep learning. IEEE Access 2021, 9, 108873–108888. [Google Scholar]
- Li, G.; Wang, H.; Zhang, M.; Tupin, S.; Qiao, A.; Liu, Y.; Ohta, M.; Anzai, H. Prediction of 3D Cardiovascular hemodynamics before and after coronary artery bypass surgery via deep learning. Commun. Biol. 2021, 4, 99. [Google Scholar]
- Krittanawong, C.; Virk, H.U.H.; Kumar, A.; Aydar, M.; Wang, Z.; Stewart, M.P.; Halperin, J.L. Machine learning and deep learning to predict mortality in patients with spontaneous coronary artery dissection. Sci. Rep. 2021, 11, 1–10. [Google Scholar] [CrossRef]
- Doppala, B.P.; Bhattacharyya, D.; Janarthanan, M.; Baik, N. A Reliable Machine Intelligence Model for Accurate Identification of Cardiovascular Diseases Using ensemble Techniques. J. Heal. Eng. 2022, 2022, 2585235. [Google Scholar]
- Ali, M.M.; Paul, B.K.; Ahmed, K.; Bui, F.M.; Quinn, J.M.W.; Moni, M.A. Heart disease prediction using supervised machine learning algorithms: Performance analysis and comparison. Comput. Biol. Med. 2021, 136, 104672. [Google Scholar] [CrossRef] [PubMed]
- Khanna, A.; Selvaraj, P.; Gupta, D.; Sheikh, T.H.; Pareek, P.K.; Shankar, V. Internet of things and deep learning enabled healthcare disease diagnosis using biomedical electrocardiogram signals. Expert Syst. 2021, e12864. [Google Scholar] [CrossRef]
- Yan, J.; Zhang, B.; Zhou, M.; Kwok, H.F.; Siu, S.W.I. Multi-Branch-CNN: Classification of ion channel interacting peptides using multi-branch convolutional neural network. Comput. Biol. Med. 2022, 147, 105717. [Google Scholar] [CrossRef] [PubMed]


| Authors | Methodology | Features | Limitations |
|---|---|---|---|
| Lin. S et al. [1] | Conducted a cross-sectional study of CAD patients for validating CNN-based CAD. | The findings showed that the deep learning algorithm could support physicians in detecting cardiovascular diseases. | The findings are based on the specific location and lack of a benchmark dataset for evaluating the CNN model. |
| Jingsi Z et al. [10] | Proposed a low-light image enhancement method. | The DenseNet framework has reduced the noise in the images. | Lack of discussion of the application of bright images. |
| Abdar M et al. [13] | Integrated genetic algorithm and support vector machine for feature extraction. | The outcome showed that N2Genetic-nuSVM showed a better accuracy. | Lack of comparison with the recent techniques. |
| Wolterink J.M. et al. [20] | A 3D-dilated CNN is developed to predict the radius of an artery from CCTA images. | Results show that the method extracted 92% of clinically relevant coronary artery segments. | Trained with a small dataset. The outcome may be with the size of the dataset. |
| Papandrianos N. and Papageorgiou E. [21] | Applied CNN model for CAD detection from images. | The method can differentiate the infarction from healthy patients. | The classification accuracy is better. However, there is a lack of benchmark evaluation techniques. |
| Nishi et al. [27] | Developed an image segmentation technique for predicting CAD. | The outcome highlighted that the method could produce effective results. | The performance is based on a single dataset. |
| Cho et al. [30] | Proposed an intravascular ultrasound-based algorithm for classifying attenuation and calcified plaques. | The results outlined that the model achieved 98% accuracy. | The model performance is based on the dataset of 598 patients. |
| Morris S.A. and Lopez K.N. [31] | Developed a detection model for congenital heart disease in the fetus. | The outcome showed that the model’s performance is better than the recent models. | The authors evaluated the model using 1326 fetal echocardiograms. |
| Cheung et al. [36] | Proposed an image segmentation approach using Unet model. | The model achieved 91,320% of dice similarity coefficient. | The lack of discussion of the image quality used in the study. |
| Bhanu Prakash Doppala et al. [37] | Developed an ensemble model for cardiovascular disease detection. | The model achieves an accuracy of 96.75%. | The model is based on the voting mechanisms, which may lead to a larger computation time. |
| Ali Md Mamun et al. [38] | Proposed an ML algorithm for heart disease detection. | The outcome shows that the model has achieved a 100% of accuracy with the Kaggle dataset. | There is a lack of experimentation with the model with different datasets. |
| Khanna, Ashish et al. [39] | Developed an ML technique for heart disease detection from ECG. | Employed regression model to predict heart disease from ECG. | Limited discussion on the model uncertainty. |
| Yan, Jielu et al. [40] | Proposed an ML technique for predicting ion channel peptides. | The outcome shows that the model achieves high accurate results. | The dataset is relatively small. |
| Dataset | Number of Patients | Number of Images | Classification |
|---|---|---|---|
| 1 | 500 | 2637 | 2 |
| 2 | 200 | 716 | 2 |
| Fold(s) | Accuracy | Precision | Recall | F-Measure | Specificity |
|---|---|---|---|---|---|
| 1 | 98.6 | 97.4 | 98.4 | 97.9 | 98.5 |
| 2 | 98.2 | 98.2 | 97.9 | 98.05 | 97.8 |
| 3 | 99.1 | 97.7 | 98.3 | 98 | 98.8 |
| 4 | 99.3 | 98.6 | 98.7 | 98.65 | 98.8 |
| 5 | 99.6 | 99.1 | 99.3 | 99.2 | 99.6 |
| Average | 98.96 | 98.2 | 98.52 | 98.36 | 98.7 |
| Fold(s) | Accuracy | Precision | Recall | F-Measure | Specificity |
|---|---|---|---|---|---|
| 1 | 98.4 | 97.8 | 98.2 | 98 | 98.1 |
| 2 | 97.8 | 99.3 | 99.1 | 99.2 | 99.3 |
| 3 | 99.1 | 98.7 | 98.7 | 98.7 | 98.6 |
| 4 | 98.9 | 98.2 | 98.6 | 98.4 | 98.2 |
| 5 | 99.1 | 99.3 | 98.7 | 99 | 98.9 |
| Average | 98.66 | 98.66 | 98.66 | 98.66 | 98.62 |
| Fold(s) | CI (%) @95% | SD | Entropy |
|---|---|---|---|
| 1 | [97.92–97.99] | 0.0012 | 0.0049 |
| 2 | [98.12–98.19] | 0.0019 | 0.0329 |
| 3 | [98.79–98.87] | 0.0021 | 0.0319 |
| 4 | [98.84–98.91] | 0.0020 | 0.0281 |
| 5 | [99.08–99.11] | 0.0017 | 0.0091 |
| Average | [98.55–98.61] | 0.0017 | 0.0213 |
| Fold(s) | CI (%) @95% | SD | Entropy |
|---|---|---|---|
| 1 | [98.11–98.18] | 0.0021 | 0.0041 |
| 2 | [97.41–97.49] | 0.0018 | 0.0312 |
| 3 | [98.42–98.46] | 0.0014 | 0.0187 |
| 4 | [99.12–99.17] | 0.0011 | 0.0093 |
| 5 | [99.21–99.26] | 0.0009 | 0.0089 |
| Average | [98.45–98.51] | 0.0014 | 0.0144 |
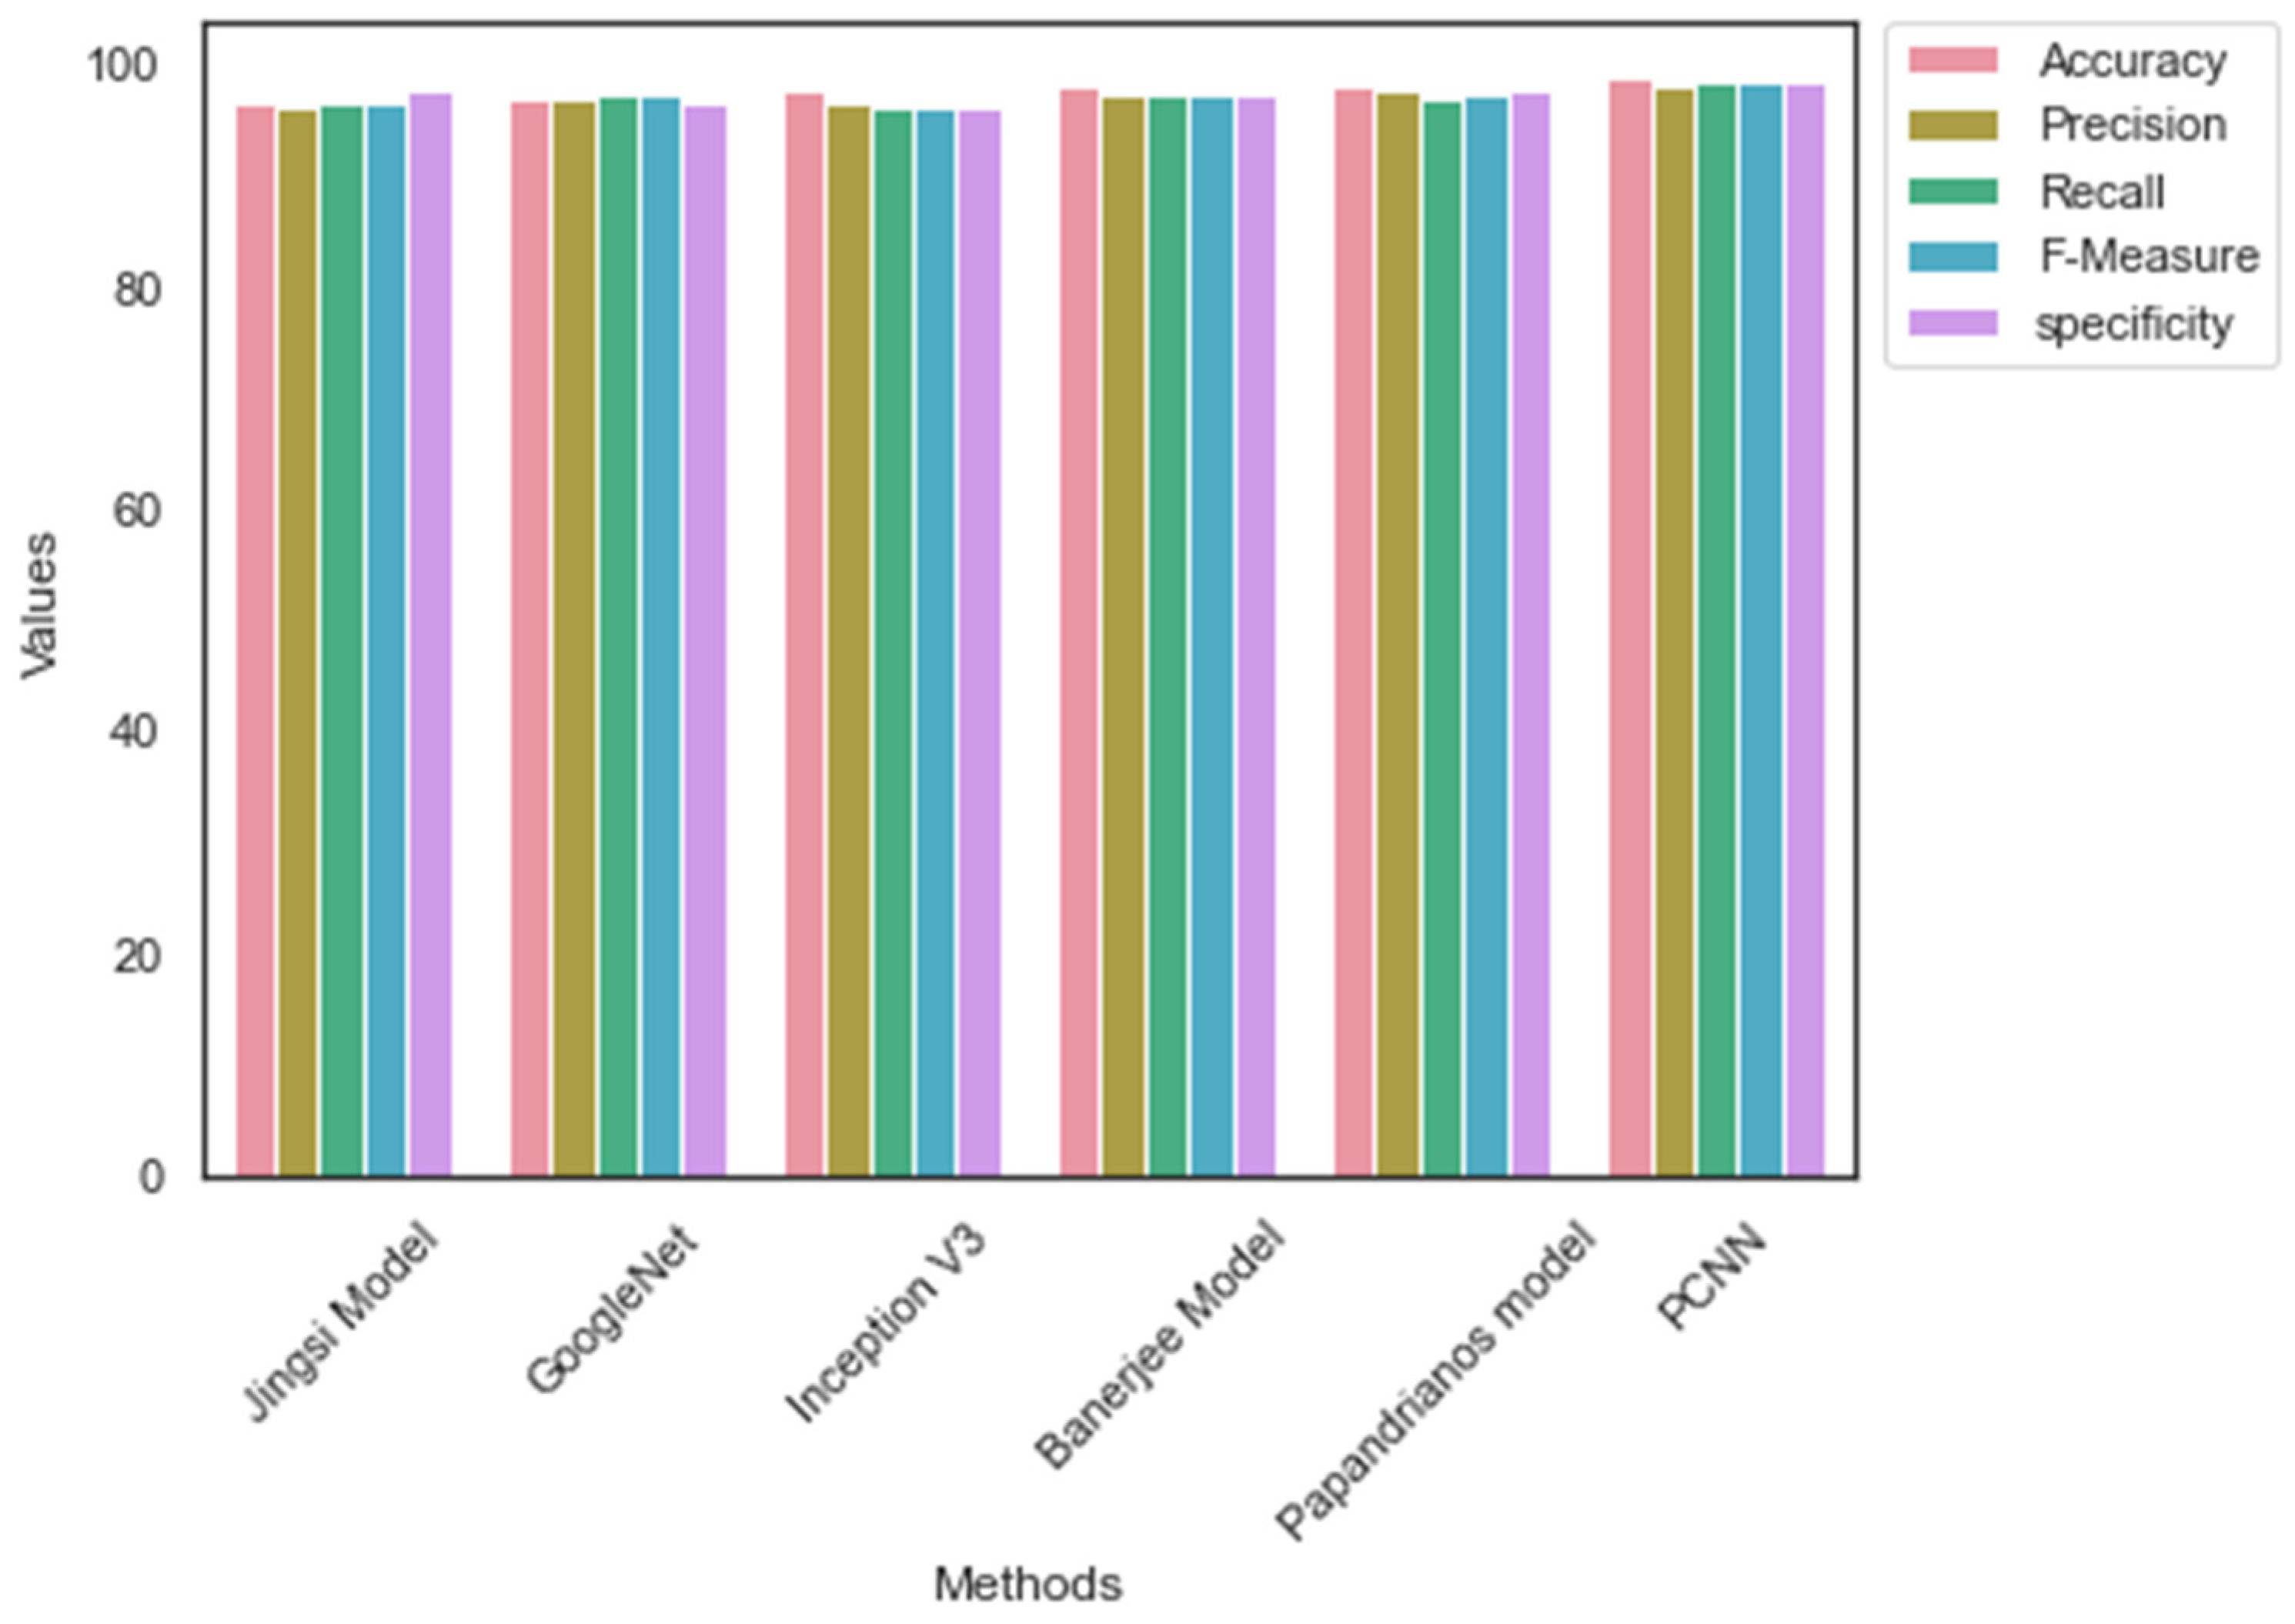
| Methods/ Measures | Accuracy | Precision | Recall | F-Measure | Specificity |
|---|---|---|---|---|---|
| Jingsi model [10] | 96.7 | 96.2 | 96.7 | 96.45 | 97.65 |
| GoogleNet | 96.9 | 97.1 | 97.4 | 97.25 | 96.5 |
| Inception V3 | 97.8 | 96.7 | 96.1 | 96.4 | 96.2 |
| Banerjee model [18] | 98.1 | 97.3 | 97.5 | 97.4 | 97.57 |
| Papandrianos model [21] | 98.3 | 97.6 | 97.1 | 97.35 | 97.69 |
| PCNN | 98.96 | 98.2 | 98.52 | 98.36 | 98.7 |
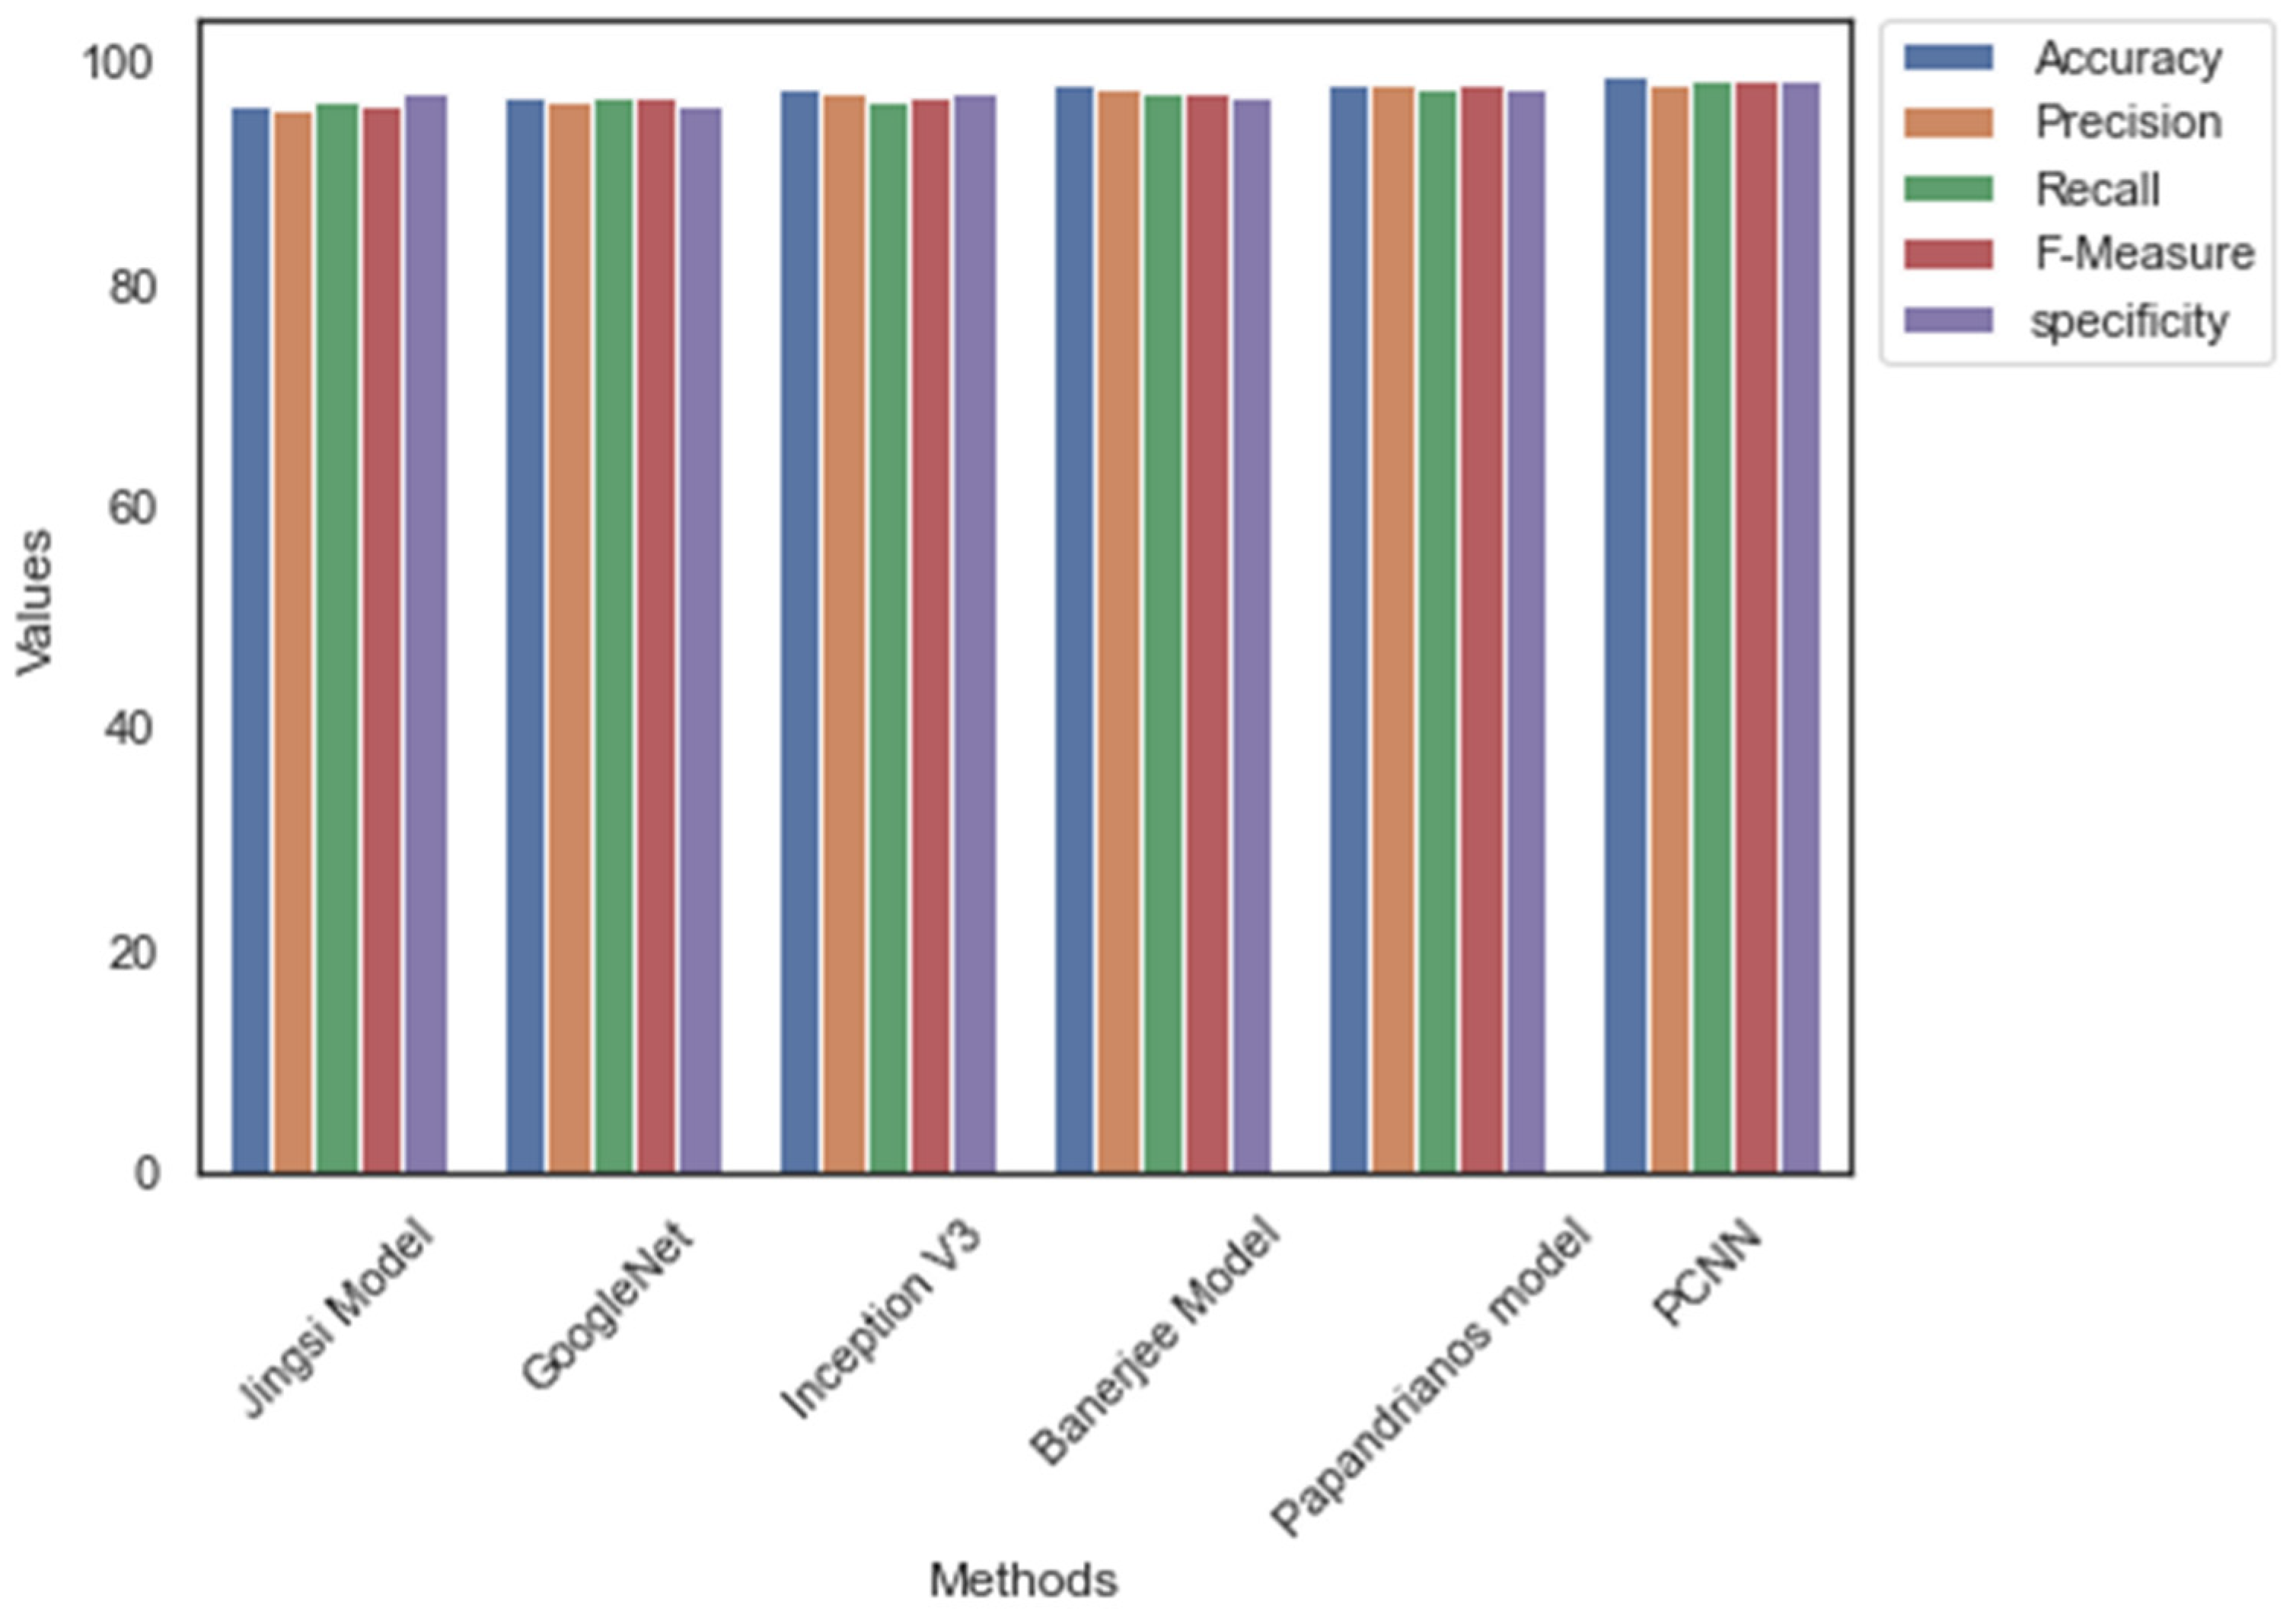
| Methods/ Measures | Accuracy | Precision | Recall | F-Measure | Specificity |
|---|---|---|---|---|---|
| Jingsi model | 96.3 | 95.8 | 96.7 | 96.25 | 97.2 |
| GoogleNet | 97.1 | 96.7 | 97.1 | 96.9 | 96.4 |
| Inception V3 | 97.6 | 97.2 | 96.8 | 97 | 97.3 |
| Banerjee model | 98.1 | 97.6 | 97.5 | 97.55 | 97.1 |
| Papandrianos model | 98.3 | 98.2 | 97.9 | 98.05 | 97.8 |
| PCNN | 98.96 | 98.2 | 98.52 | 98.36 | 98.7 |
| Methods/Datasets | Dataset_1 (MB) | Dataset_2 (MB) | Dataset_1 Time (Minutes) | Dataset_2 Time (Minutes) |
|---|---|---|---|---|
| Jingsi model | 279.21 | 189.32 | 105.26 | 101.25 |
| GoogleNet | 175.69 | 159.27 | 102.26 | 101.36 |
| Inception V3 | 138.14 | 142.58 | 134.56 | 129.71 |
| Banerjee model | 128.54 | 143.96 | 116.32 | 107.25 |
| Papandrianos model | 129.65 | 137.89 | 101.45 | 103.59 |
| PCNN | 119.25 | 124.26 | 100.56 | 98.89 |
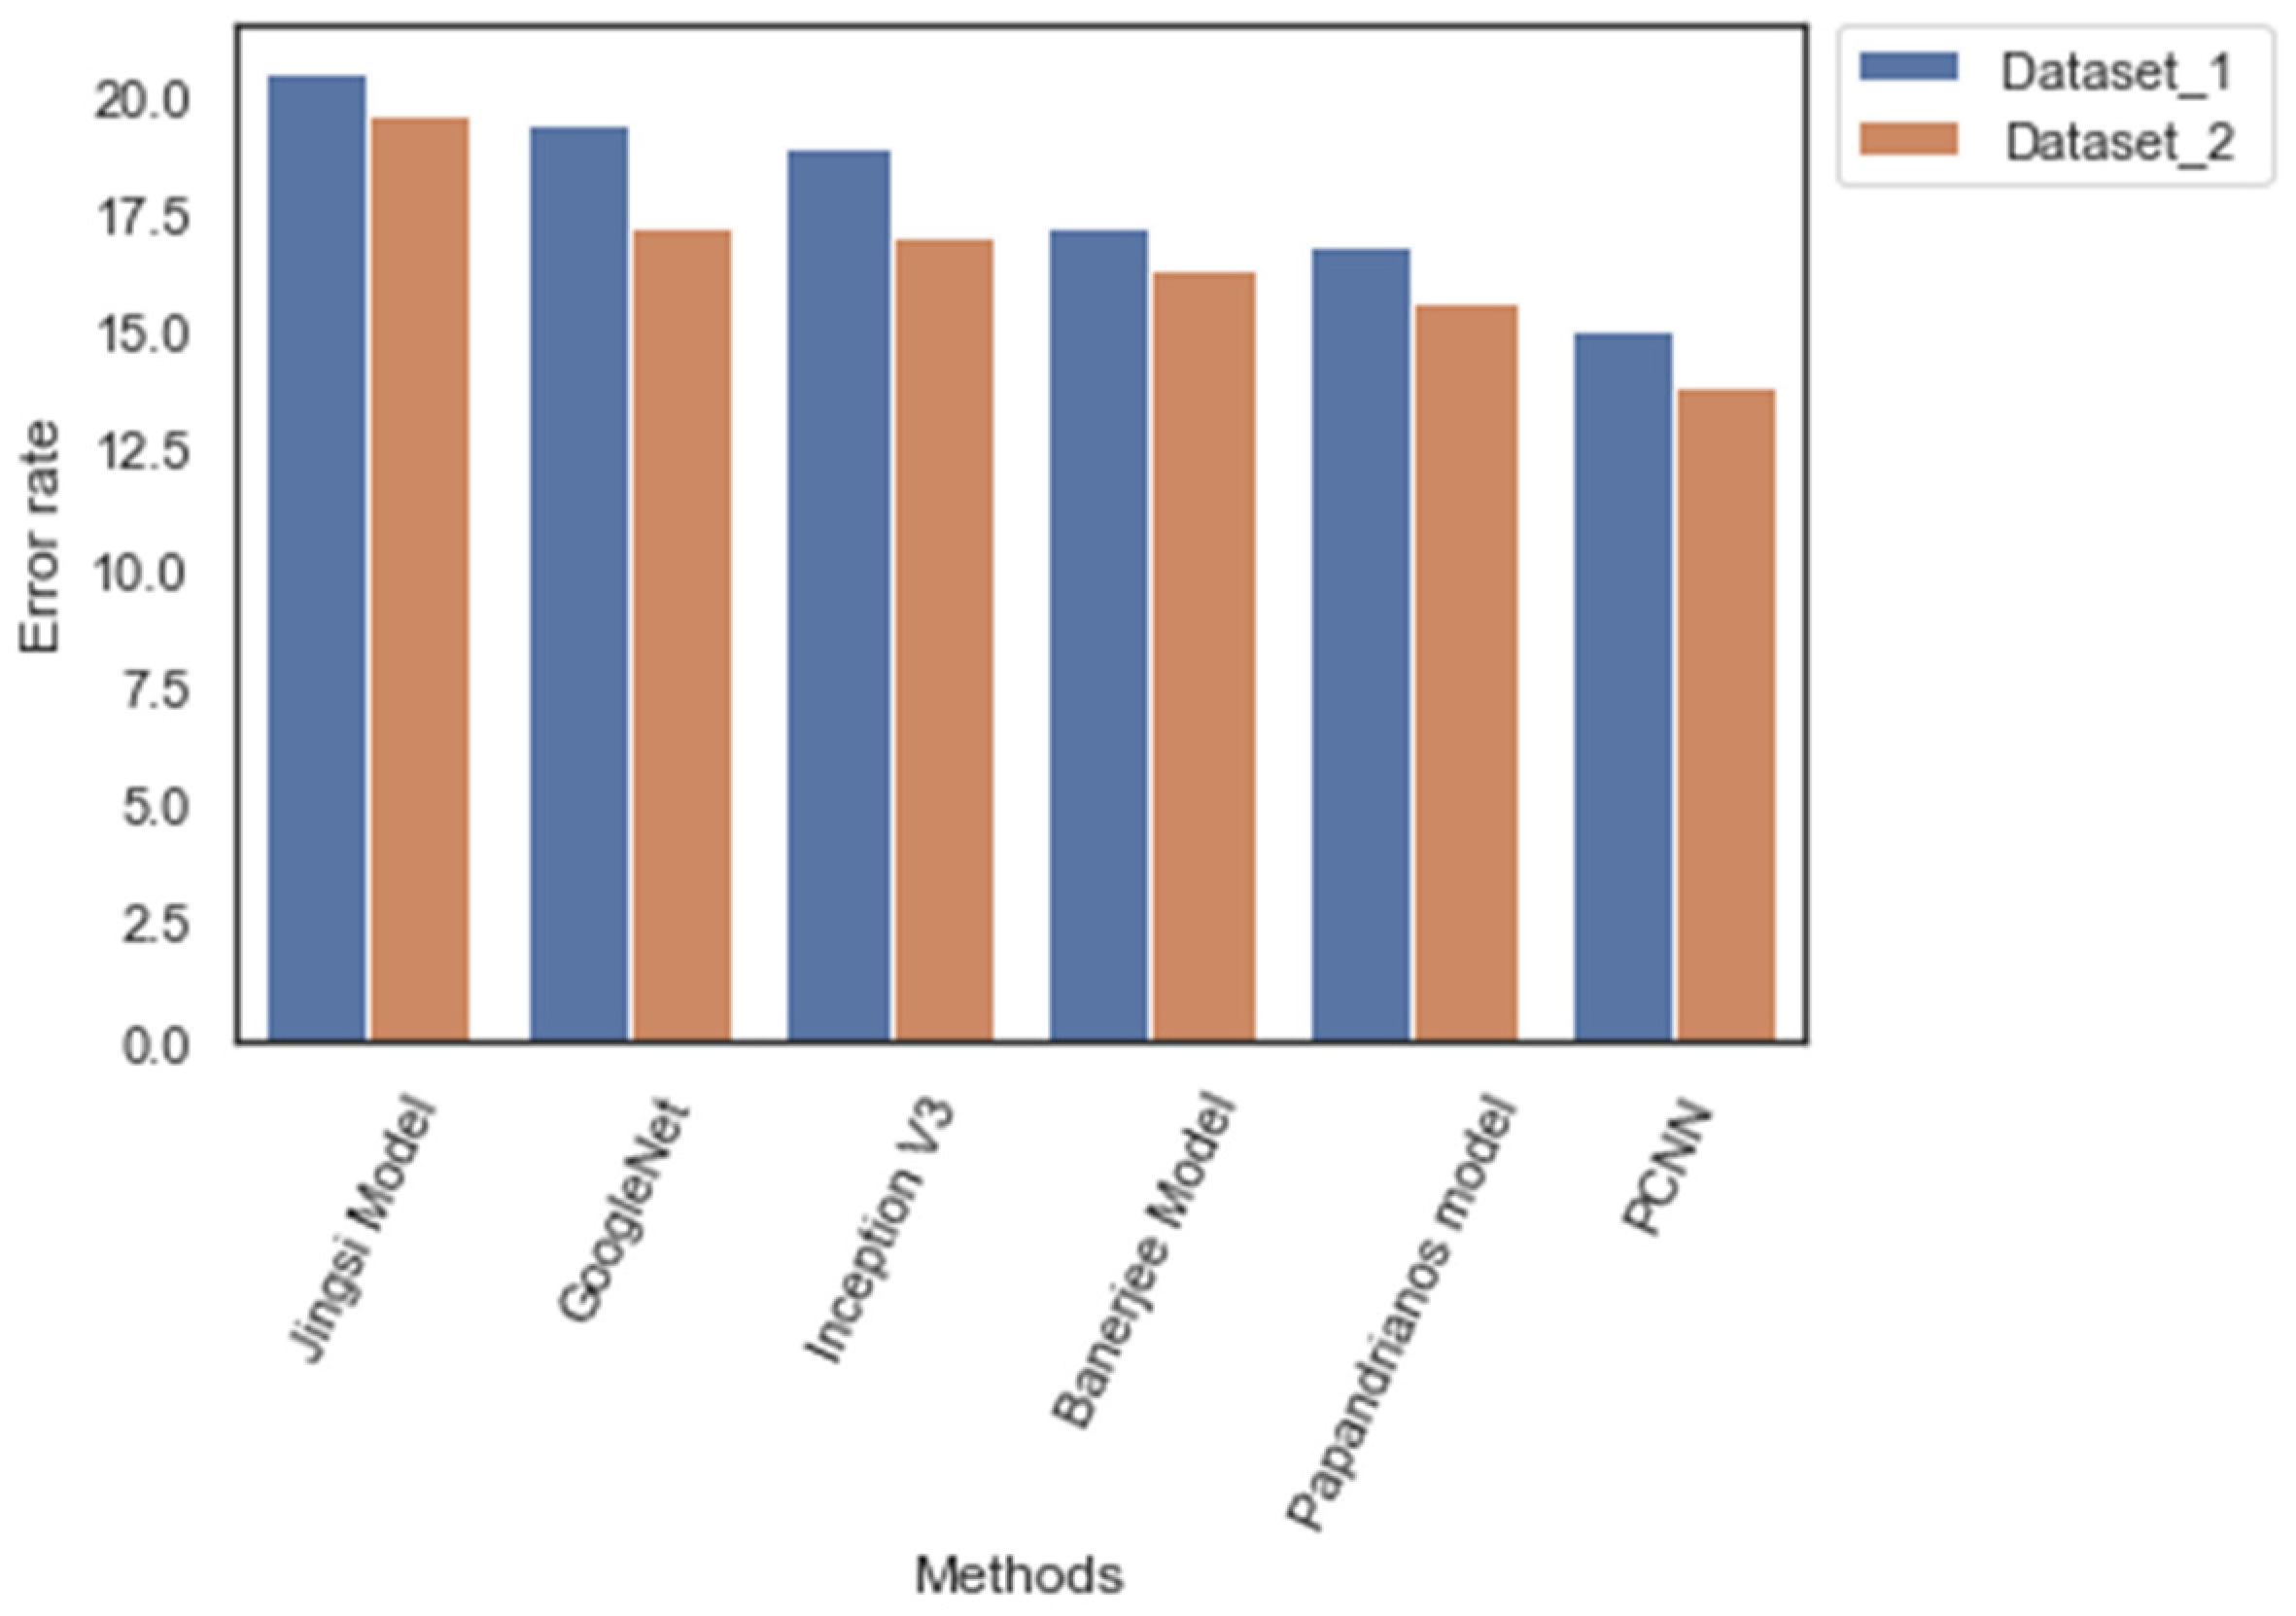
| Methods/Measures | Dataset_1 (%) | Dataset_2 (%) |
|---|---|---|
| Jingsi model | 20.5 | 19.6 |
| GoogleNet | 19.4 | 17.3 |
| Inception V3 | 18.94 | 17.1 |
| Banerjee model | 17.3 | 16.4 |
| Papandrianos model | 16.9 | 15.7 |
| PCNN | 15.1 | 13.9 |
| Methods/Measures | Number of Parameters | Learning Rate | Number of Flops | Testing Time (s) |
|---|---|---|---|---|
| Jingsi model | 5.1 M | 1 × 10⁻³ | 565 M | 2.5 |
| GoogleNet | 6.7 M | 1 × 10⁻³ | 624 M | 2.36 |
| Inception V3 | 7.4 M | 1 × 10⁻⁴ | 594 M | 2.7 |
| Banerjee model | 14.6 M | 1 × 10⁻³ | 1421 M | 2.3 |
| Papandrianos model | 11.2 M | 1 × 10⁻² | 1530 M | 2.1 |
| PCNN | 4.3 M | 1 × 10⁻⁴ | 563 M | 1.92 |
| Methods/Measures | Number of Parameters | Learning Rate | Number of Flops | Computation Time (s) |
|---|---|---|---|---|
| Jingsi model | 4.3 M | 1 × 10⁻³ | 436 M | 1.91 |
| GoogleNet | 5.6 M | 1 × 10⁻³ | 512 M | 1.72 |
| Inception V3 | 6.3 M | 1 × 10⁻⁵ | 402 M | 1.86 |
| Banerjee model | 9.4 M | 1 × 10⁻⁴ | 921 M | 1.98 |
| Papandrianos model | 10.3 M | 1 × 10⁻³ | 430 M | 1.36 |
| PCNN | 3.7 M | 1 × 10⁻⁵ | 403 M | 1.15 |
Publisher’s Note: MDPI stays neutral with regard to jurisdictional claims in published maps and institutional affiliations. |
© 2022 by the authors. Licensee MDPI, Basel, Switzerland. This article is an open access article distributed under the terms and conditions of the Creative Commons Attribution (CC BY) license (https://creativecommons.org/licenses/by/4.0/).
Share and Cite
AlOthman, A.F.; Sait, A.R.W.; Alhussain, T.A. Detecting Coronary Artery Disease from Computed Tomography Images Using a Deep Learning Technique. Diagnostics 2022, 12, 2073. https://doi.org/10.3390/diagnostics12092073
AlOthman AF, Sait ARW, Alhussain TA. Detecting Coronary Artery Disease from Computed Tomography Images Using a Deep Learning Technique. Diagnostics. 2022; 12(9):2073. https://doi.org/10.3390/diagnostics12092073
Chicago/Turabian StyleAlOthman, Abdulaziz Fahad, Abdul Rahaman Wahab Sait, and Thamer Abdullah Alhussain. 2022. "Detecting Coronary Artery Disease from Computed Tomography Images Using a Deep Learning Technique" Diagnostics 12, no. 9: 2073. https://doi.org/10.3390/diagnostics12092073
APA StyleAlOthman, A. F., Sait, A. R. W., & Alhussain, T. A. (2022). Detecting Coronary Artery Disease from Computed Tomography Images Using a Deep Learning Technique. Diagnostics, 12(9), 2073. https://doi.org/10.3390/diagnostics12092073