The cardiovascular damage diagnosis approach is different in each article, varying not only in the clinical analysis approach but also in the deep learning techniques, datasets, strategies, etc. Therefore, we propose a classification of the articles in the following subsets:
4.1. Automated Methods for Extracting Biomarkers
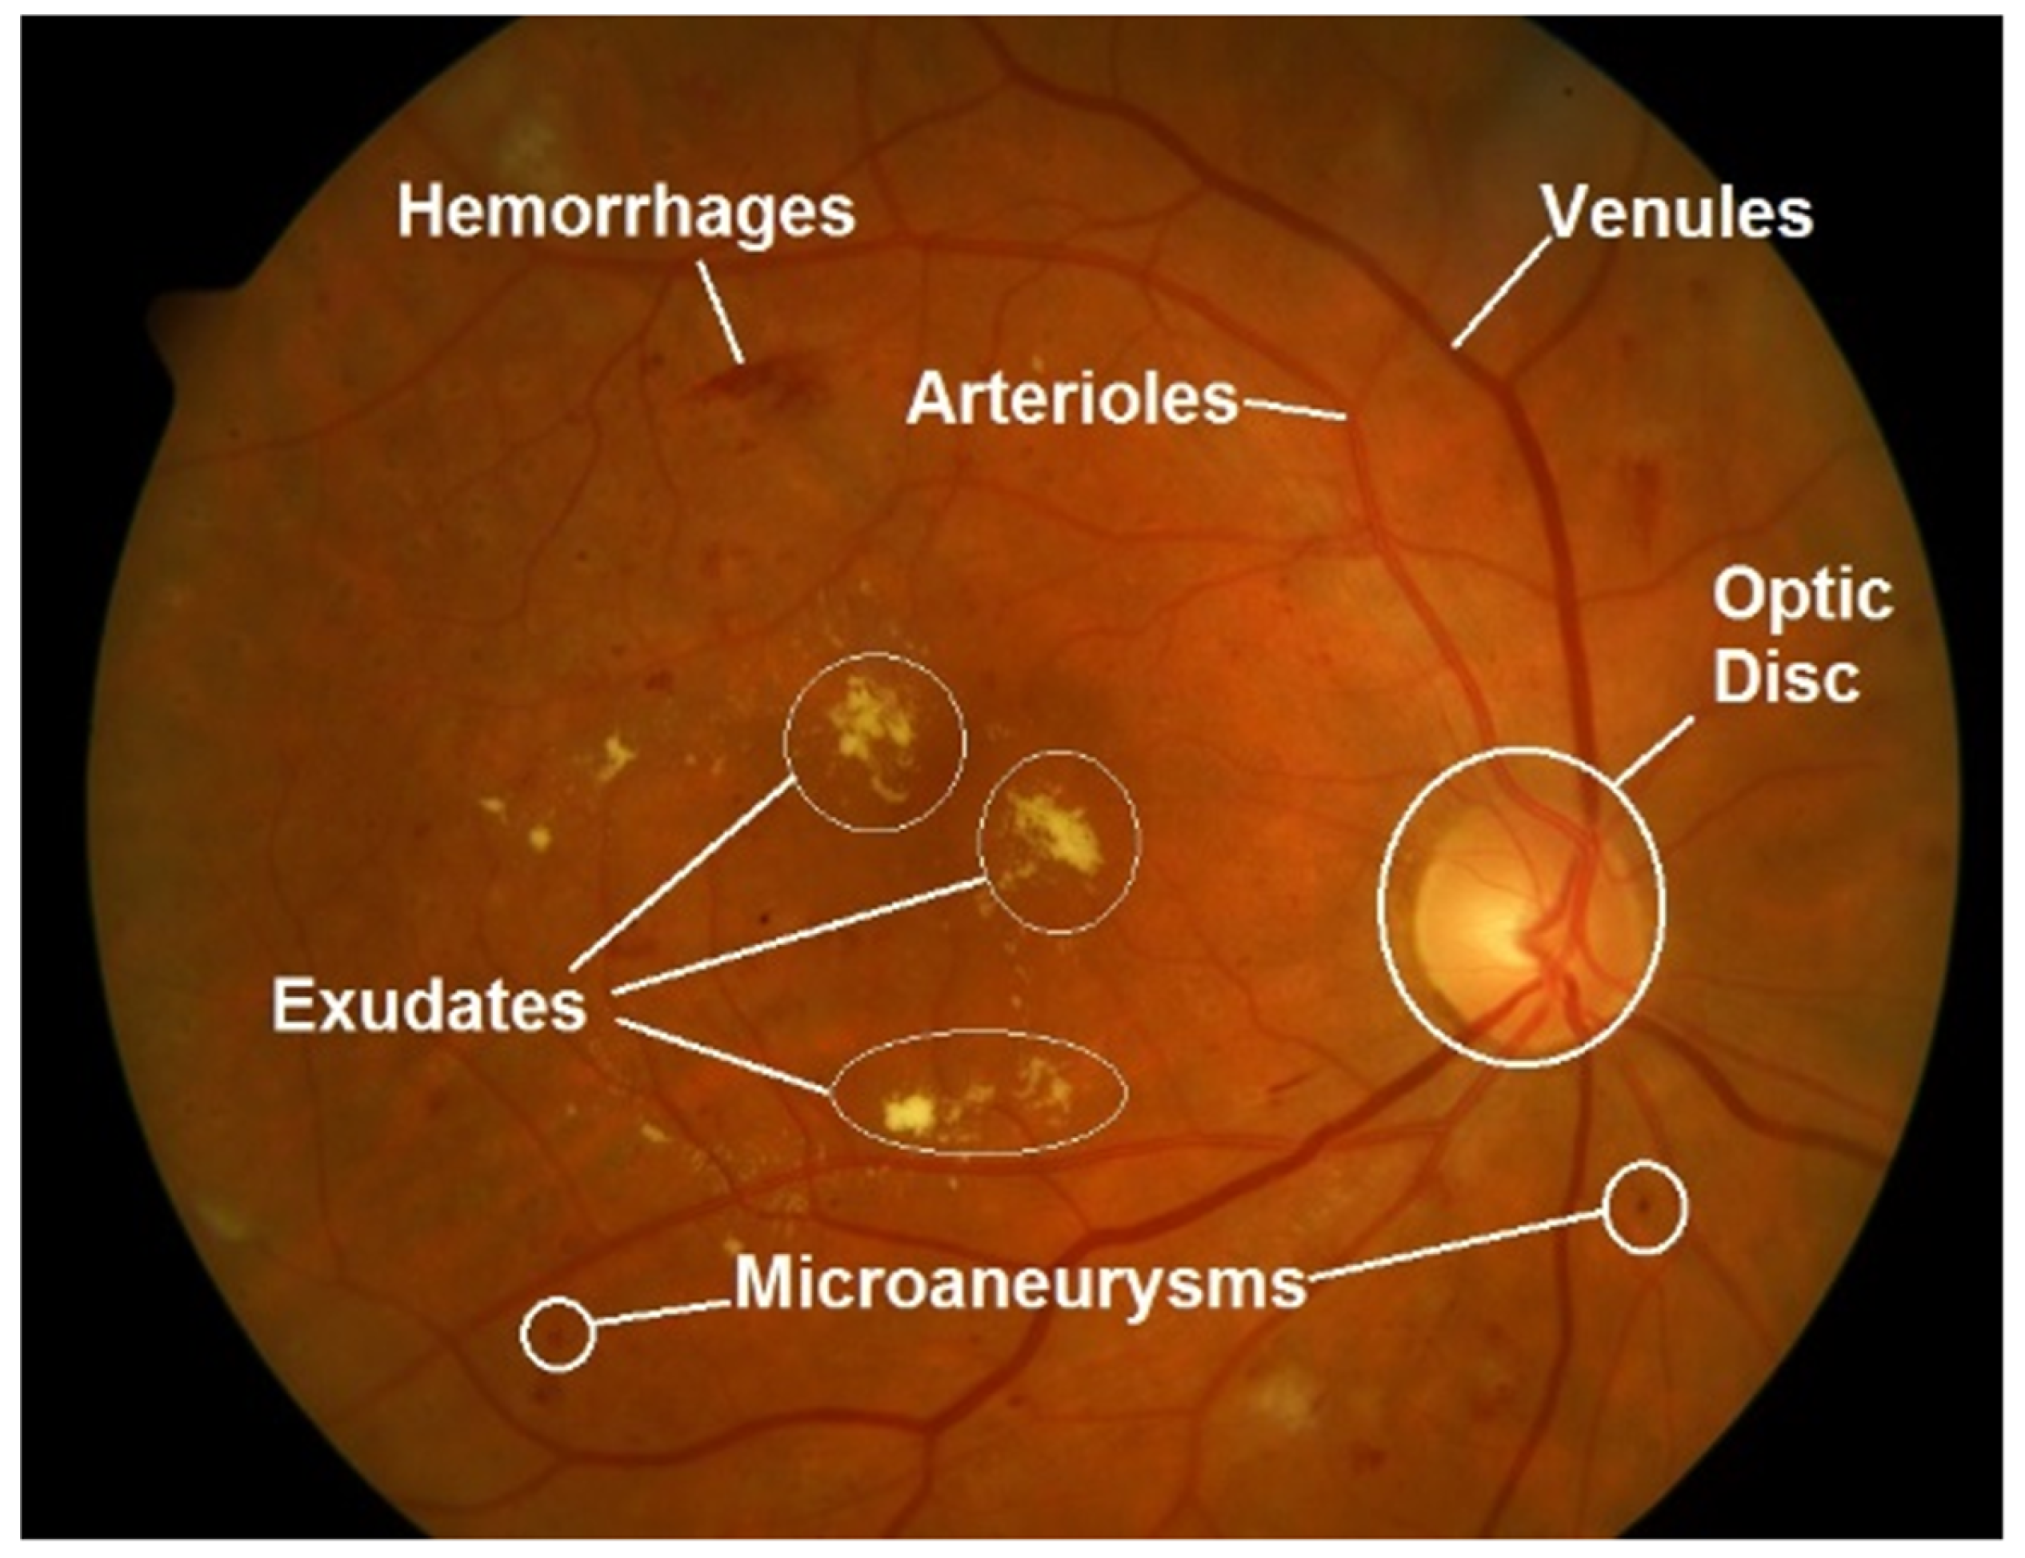
Relevant deep-learning approaches regarding vascular feature segmentation are detailed in this section. The quantitative measurement of retinal vessels is important for the diagnosis, prevention and therapeutic evaluation of cardiovascular system-related diseases. Retinal vessels are composed of arteries, arterioles, venules and capillaries. Certain abnormalities in vessel function and geometry, such as vasoconstriction, narrowing and refraction of small arteries and arterioles, have been related to cardiovascular events (left ventricular failure, stroke) and nephropathy, such as hypertension [
36]. These retinal vascular changes can be measured from the point of view of different parameters, as can be seen in
Table 3.
A proposal for a deep-learning method to quantify retinal microvasculature and vessel segmentation is given in [
37]. They extended a U-net architecture into multiple branches in order to simultaneously segment the vein, artery and optic disc. The U-net architecture was proposed in [
38] and is based on a symmetrical encoder and decoder structure used for image segmentation. The first is responsible for extracting features from input images, while the decoder reconstructs the images for the final output. The performance of the model achieved an AUC of over 90% for both vein and artery segmentation in different datasets.
Motivated by the challenging problems when segmenting coronary arteries, [
39] tries to mitigate the low performance in classic unsupervised methods and the time-consuming need for manual annotation. They propose a transfer learning approach based on Generative Adversarial Networks (GAN) [
40]. A GAN architecture is based on two neural networks that compete with each other to be more accurate in their predictions. They run unsupervised and use a zero-sum cooperative game framework to learn. After training the GAN mode for coronary artery segmentation, they were also able to transfer the knowledge to an unlabeled digital subtraction angiography (DSA) dataset by using a U-Net architecture. The GAN-proposed network reported an accuracy of 0.953 compared to a classical U-Net performance of 0.921.
Another contribution of retinal vessel segmentation is described in [
41]. This paper proposes a complex model based on U-net and an attention mechanism, which through this mechanism, the network can recalibrate the features, selectively emphasize the useful features and suppress the bad ones. The model was able to report over 0.98% AUC in the DRIVE and STARE datasets.
Further, also based on U-Net architecture, paper [
42] proposed a method to measure vascular branching complexity using an ensemble model of U-Nets to segment the microvasculature and thus calculate vascular density and fractal dimension (FD). On the test set, the model achieved an 82.1% Dice similarity coefficient, 97.4% pixel-wise accuracy, 0.99% AUC for FD and 0.88 for vascular density.
A contribution to retinal vessel detection has been made in [
43]. The main motivation is to have available retinal microvasculature for further analysis, such as vessel diameter and bifurcation angle quantification. They propose a custom implementation called Faster Region-based Convolutional Neural Network (Faster-RCNN). Briefly, this architecture is composed of three modules: A feature network to generate feature maps from the input image. A separately trained network, Region Proposal Network (RPN), generates bounding boxes that contain different features or objects extracted from feature maps, and a Detection Network, which takes input from both the RPN and feature network to detect the expected features. They report a capability of extracting the true vessels of the retina with a sensitivity of 92.81% and 62.34% Positive Predictive Value (PPV).
A list of the main characteristics of the reviewed methods is shown in
Table 4.
4.2. Automated Prediction of Cardiovascular Risk Factors
There are certain health conditions, not only at the metabolic level but also at the individual level, such as age or lifestyle, that are indicators of cardiovascular risk. These biomarkers are considered a proxy and are essential in the diagnosis of cardiovascular disease. One of the most successful predictors of cardiopathies is the presence and degree of DR. Recent studies show that age (
), gender (
) and DR (
) are significantly different in patients with a high CAC score (
, considered the proper predictive tool according to the American College of Cardiology [
44]) with respect to patients with a CAC score below 400 [
45].
Consequently, one of the first proxies used for assessing CVD with deep learning was diabetic retinopathy disease prediction. It often appears from type 1 and 2 diabetes complications due to retinal blood vessel deterioration and might be a potential risk factor.
In [
46], the authors applied a deep learning model based on the InceptionV3 architecture [
47] for the detection of DR and also diabetic macular edema reporting an AUC of 0.991 tested on EyePACS and 0.990 in MESSIDOR-2. Later on, in [
48], the authors proposed a hybrid model combining a custom CNN model for future extraction feeding a decision tree classification model [
49] to predict DR. The classification method discriminated between healthy fundus images and having DR, identifying relevant cases for medical referral. They reported testing results on the MESSIDOR-2 and E-Ophtha databases of 0.94 and 0.95 AUC scores, respectively. They used heat maps to provide what areas in the image influenced the model to produce the output. Moreover, in study [
50], the authors proposed a custom CNN model for binary classification (YES/NO) to predict DR from RFI, where they achieved an accuracy of 89%. Another contribution in article [
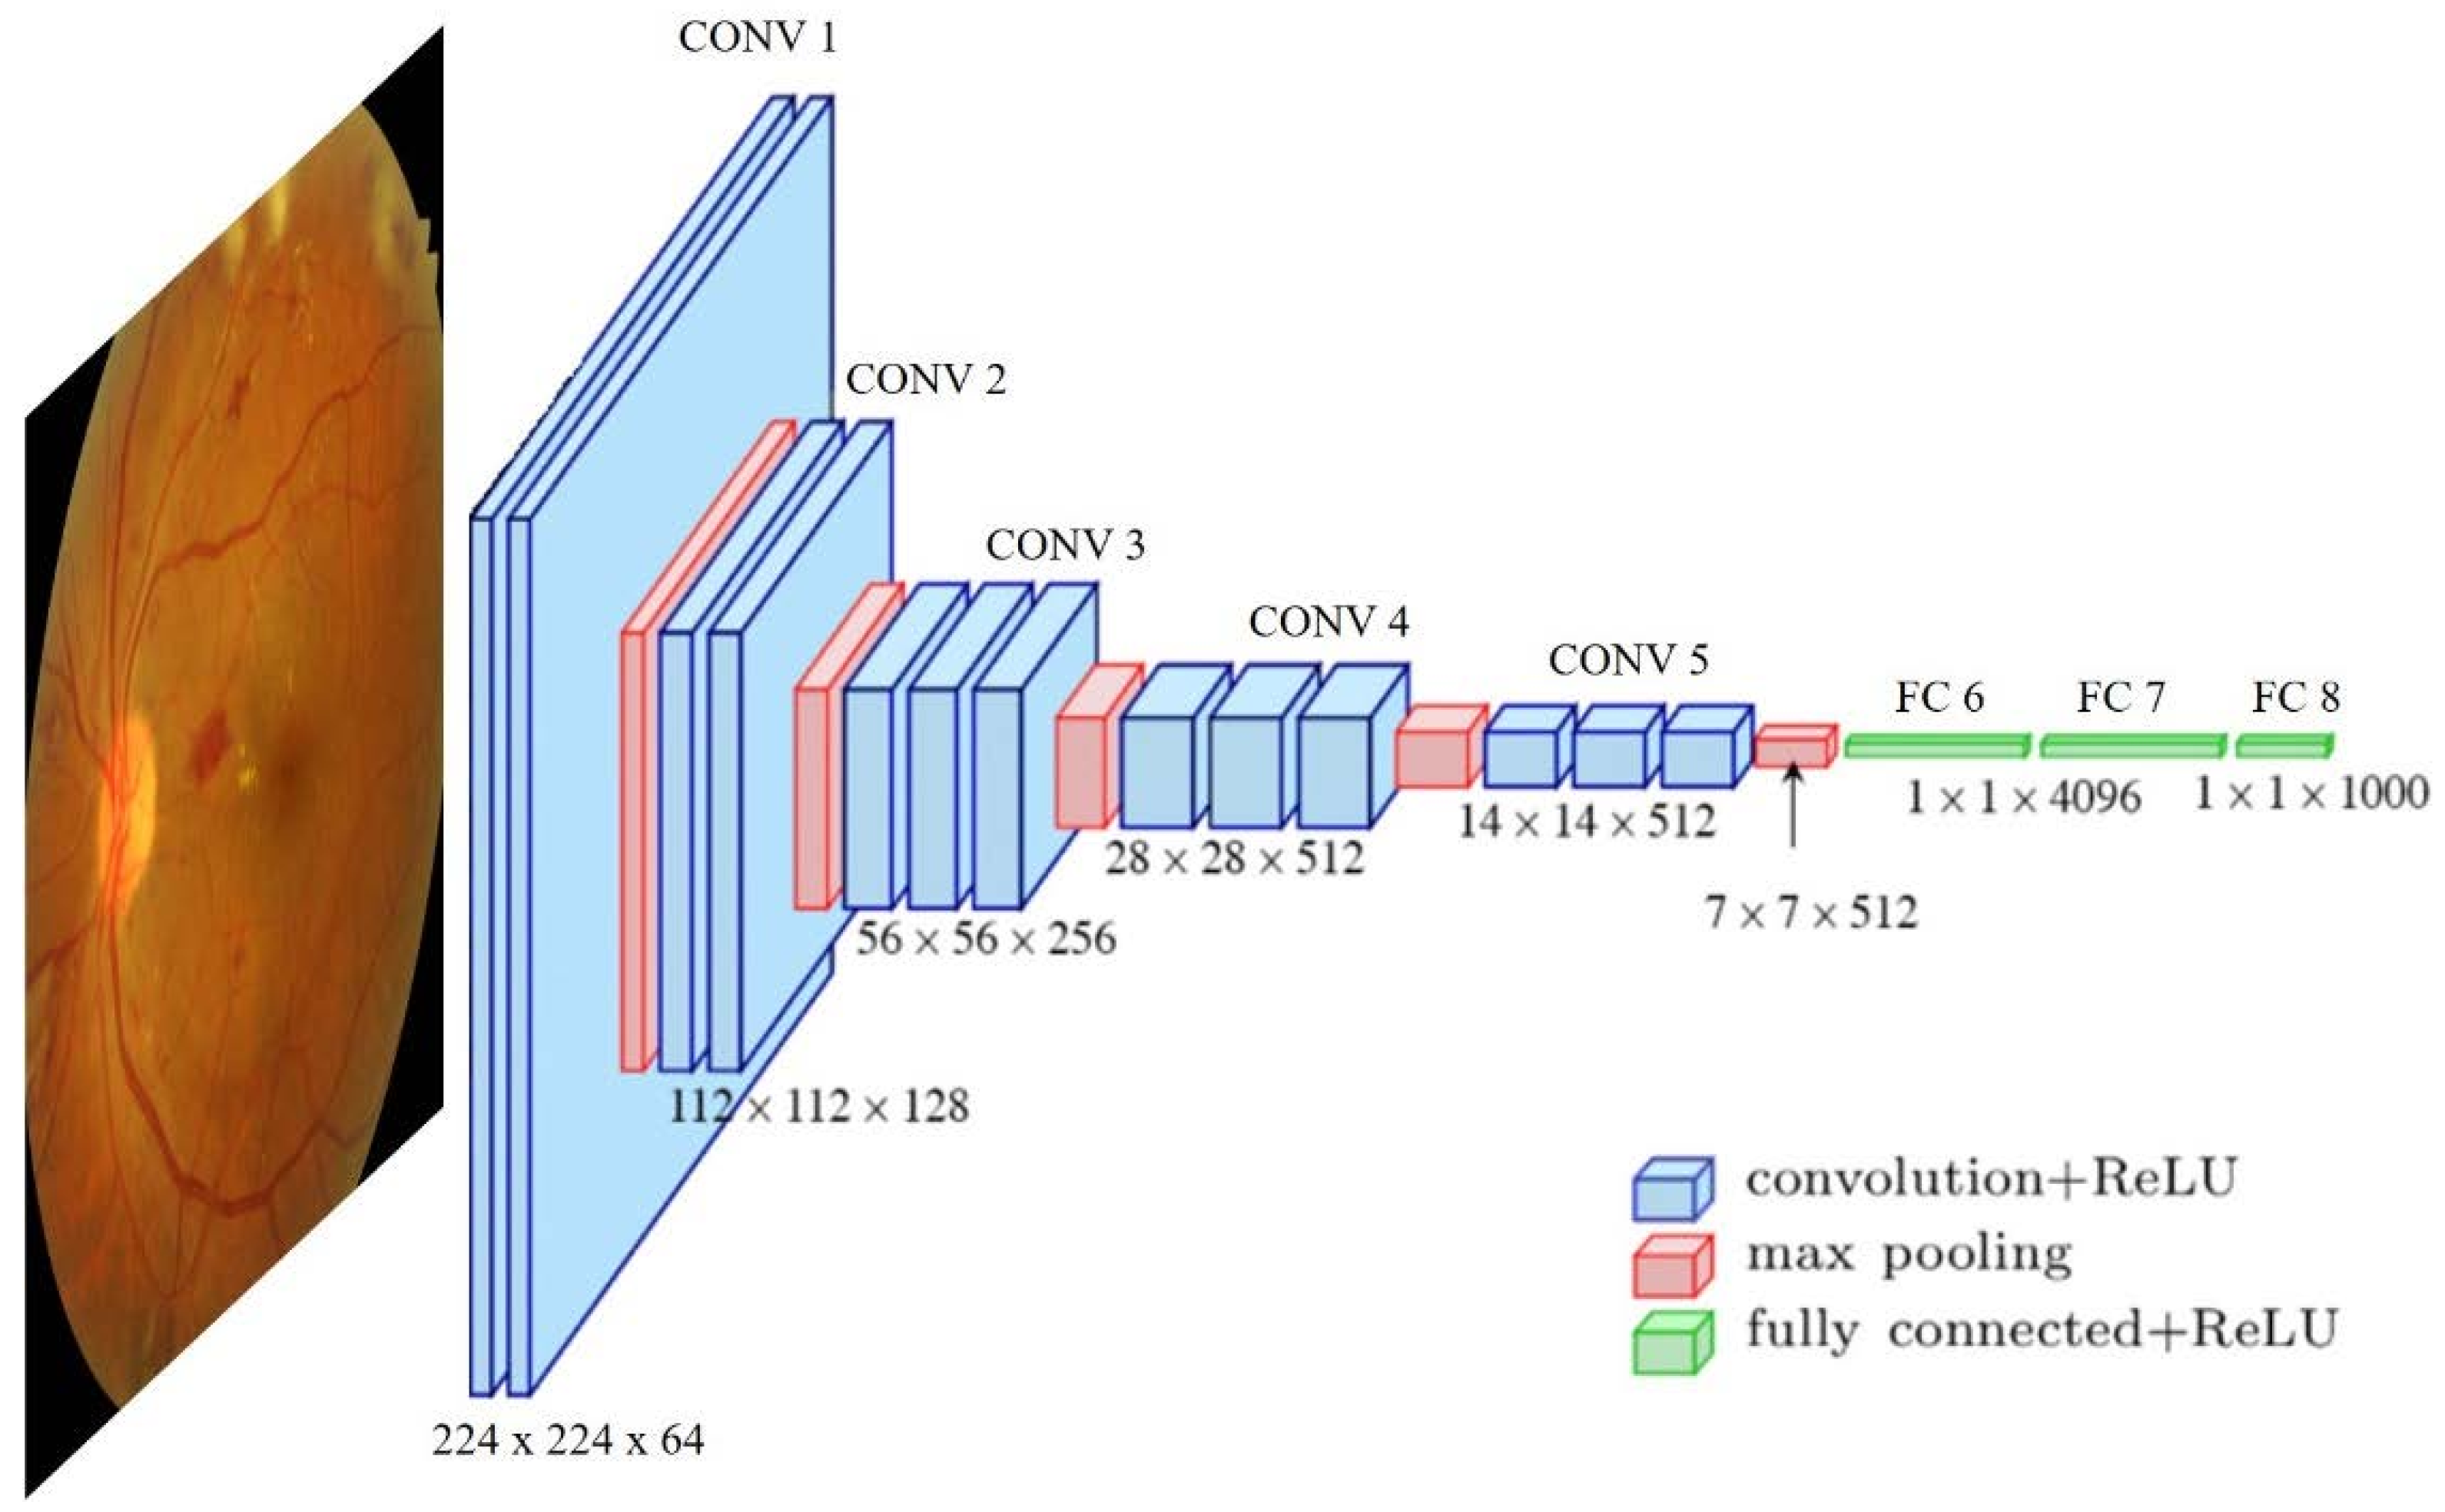
51] proposed a deep learning method to detect referable/vision-threatening DR, in addition to possible glaucoma and age-related macular degeneration (AMD). By adapting a Visual Geometry Group (VGG) architecture [
20], they report an AUC of referable DR of 0.93%. For vision-threatening DR, the AUC was 0.958%; for possible glaucoma, the AUC was 0.942%; and for AMD, the AUC was 0.931%. Focused on DR screening and other eye-related diseases, the work proposed in paper [
52] trained a deep learning algorithm pointing out the multi-ethnic nature of the patients contributing to all the datasets used during training and validation. The architecture used consisted of eight modified variants of the VGG-19 CNN, two for DR, two for AMD, two for glaucoma, one for assessing quality images and one for rejecting invalid non-retinal images. They report over 0.93% AUC for any retinal disease. In the work proposed in article [
53], the authors combined the use of a U-Net for semantic segmentation of the blood vessels and a deep residual network (ResNet-101 [
54]) for severity classification on both vascular and full images. Vessel reconstruction through harmonic descriptors is also used as a smoothing and de-noising tool. They report that at least 93.8% of DR (No-Refer vs. Refer) classification can be related to vasculature defects. In [
55], the authors implement a DL method to asses Retinopathy of Prematurity (ROP), being a leading cause of child vision loss and possible future cardiovascular complications. They established an ROP scale of 1-9 to score the retinal vascular abnormality, reporting an AUC of 0.96% for ROP-1 on the test set. They use two DL models in a row: the first a U-net to segment the vessels over the original RFI. The second one to classify disease severity by an InceptionV1 net [
56].
Retinal change detection is useful for predicting biomarkers related to cardiovascular and chronic disease. The evaluated studies have shown that retinal photography-based deep-learning methods can be implemented for biomarker estimation. Poplin and colleagues proposed a DL model to predict cardiovascular risk factors with reasonable accuracy: age (within 3.26 years), gender (0.97 AUC), smoking status (0.71 AUC), HbA1c (within 1.39%) and systolic blood pressure (within 11.23 mmHg) [
57]. Given the good results, they tried to also predict future major cardiac events (within 5 years) with an AUC of 0.70. They draw attention maps for each risk factor to identify the anatomical regions that the algorithm might have been using to make its predictions. Similar studies were reported in paper [
58]. They use a deep learning model to predict cardiometabolic risk factors: age, sex, blood pressure, HbA1c, lipid panel, sex steroid hormones and bioimpedance measurements. The architecture proposed was MobileNet-V2 [
59], known to be a light and fast DL model boosted by transfer learning with ImageNet [
60]. Another contribution was made in [
61], where the authors proposed a DL method to measure the retinal-vessel caliber with RFI. The model achieved comparable estimations with expert practitioners relating vessel caliber and CVD evidence, including biomarkers such as BMI, blood pressure, glycated hemoglobin and total cholesterol. Deep learning model measurements agreed with high similarity with experts having correlation coefficients between 0.82 and 0.95.
A DL-based biomarker predictor model is proposed in article [
62]. They independently trained 47 VGG16 models to predict 47 systemic biomarkers: demographic factors (age and sex), relevance to CVD (blood pressure, body composition, renal function, lipid profile, diabetes-related measures and C-reactive protein), the predictable capability from hematological parameters and blood data, such as biochemical, liver and thyroid markers. Moreover, they used saliency maps to provide algorithm attention information.
When it comes to cardiovascular disease, age is undoubtedly a factor to be taken into account. The work in [
63] contributed to predicting biological age from RFI and evaluated the performance of this marker in the risk stratification of mortality and major morbidity in general populations. They used a VGG classifier to implement this approach to measure aging with experimental results (c-index = 0.70, sensitivity = 0.76, specificity = 0.55). Their analysis includes saliency maps to provide regions of model attention. In the same line, in article [
64], the authors proposed the use of retinal age gap as a predictive biomarker (predicted - chronological age) for CVD using Xception [
65] implementation, reporting a correlation of 0.80 (
p < 0.001) and a mean absolute error (MSA) of 3.55. Additionally, they related RAG to regression models with arterial stiffness and incident CVD, ensuring an increased risk when age reached 1.21.
Past studies showed that coronary artery calcium (CAC) had a low ability to predict cardiovascular events [
66]. In practice, it could be a good predictor, but these study showed that 2% of the sampled population had a cardiovascular event, and one-third of the middle-aged and 100% of the older individuals of the total population had coronary calcification. However, later studies claim CAC scoring is a significant method for predicting cardiovascular events [
67], especially among individuals without diabetes [
45]. To mitigate the presence of coronary calcification in a large part of the population, CAC score stratification is performed by Agatston units (AU), where a CAC score lower than 100 AU involves low risk, between 100 and 400 AU is moderate risk and greater than 400 AU is high risk. Automated prediction DL-based methods using RFI are of special interest since CAC score measurement needs the use of Computed Tomography (CT) scans, which are expensive and involve radiation risks. These methods intend to predict cardiovascular risk by stratifying the CAC score.
The work described in [
68] used InceptionV3 architecture to evaluate the high accumulation of CAC using RFI. Fundus images and CAC scans were taken on the same day. They discriminate no CAC vs. CAC>100 with an AUC of 82.3% and 83.2% using unilateral and bilateral RFI, respectively. They also used a setting combining DL prediction with other risk factors, such as age, gender and hypertension, and combined them into a regression model to increase the prediction. They tested the algorithm with different inputs: fovea inpainted, vessels inpainted, unilateral RFI and bilateral RFI, where the last one provided better results. Heat maps are provided to show areas of interest in the input data. The RetiCAC framework was proposed in [
69]. They implement a DL method to predict the presence of CAC from fundus images. They found that the CAC score assessment model performed better than the prediction of other risk factors alone (AUC 0.742). From here, they proposed a CV risk stratification system with comparable performance to a CT scan: RetiCAC score (based on a probability score derived from the DL model). Another contribution of CAC assessment is detailed in article [
70]. The authors proposed an automated hybrid method to predict, from fundus images, whether the CAC score surpasses a threshold set to 400 defined by experts. They defined a pipeline combining independent results from both a VGG16 model (trained on RFI) and classic machine learning classifiers (trained on clinical data: age and presence of DR) to predict (CAC < 400/CAC > 400). They reported complementary results, proposing two applications that can benefit from the combination of image analysis and clinical data: an application for clinical diagnosis (75% Recall) and an application for image retrieval of large databases (91% Precision).
Abnormalities of the retinal vasculature may reflect the degree of microvascular damage due to hypertension, atherosclerosis or both, which may end up in cerebrovascular and cardiovascular complications [
71]. With this motivation, the authors of [
72] proposed a prediction model to evaluate biomarkers, such as hypertension, hyperglycemia and dyslipidemia. They trained an InceptionV3 architecture achieving promising results: an AUC of 0.88 for predicting hyperglycemia, of 0.766 for predicting hypertension and of 0.703 for predicting dyslipidemia. Moreover, they also trained the network to predict other risk factors (age, gender, drinking/smoking habits, BMI, etc.) directly related to CVD, reporting AUCs over 0.68 in all of them. Another contribution predicting hypertensive patients was proposed in [
73]. They implemented a custom deep learning architecture called Deep Neuro-Fuzzy network (DNFN), where the input data are based on a feature vector previously extracted from the RFI images. The structure of the DNFN is based on two stages: in the initial one, a deep neural network where the input and hidden layers are in charge of learning the output layer for classifying, and in the second stage, where a fuzzy logic optimization process computes the system objective. The classification accuracy reported by the model was 91.6%.
Coronary artery disease, also known as atherosclerosis, was used in article [
74] as a biomarker related to CVD. The purpose of this study was to develop a deep learning model based on Xception architecture, which predicted atherosclerosis by using RFI. The model was validated in two phases: First, participants with RFI plus carotid artery sonography were used to train the deep model for the prediction of atherosclerosis. Predictions are independently made with one RFI at a time. A custom DL-FAS metric was obtained from the final averaged prediction on each eye. DL-FAS was used for validation if future CVDs can be predicted from subjects with only RFI (carotid artery sonography unavailable). The final results showed an AUC of 0.713 and an accuracy of 0.583. Attention maps are provided to reflect the main interest image region of the model. Later on, a coronary artery disease prediction model was developed in article [
75]. They use retinal vascular biomarkers to predict coronary artery disease using CAD-RADS as a proxy for cardiovascular disease. They do not use the RFI to directly feed the network. Instead, they extract features from the pre-processing stage that were the inputs of the model as a feature vector. They compare the performance of the net over traditional machine learning (ML) methods outperforming the results, obtaining above AUC 0.692 in all the cases.
Table 5 lists the above-mentioned works.
4.3. Automated Prediction of Cardiovascular Events
Retinal fundus photography has been proposed for stroke risk assessment due to its similarity between retinal and cerebral microcirculations [
76]. A binary DL-based classification method was developed to predict stroke event risk, achieving the best performance with AUC ≥ 0.966. From a previous RFI pre-processing process, they fed the model with two different input images: A templated image based on contrast normalization and median-filtering transformations and a vessel image obtained from a U-Net segmentation model. VGG19 architecture was used as a classification method. They also provide heat maps with the predictions.
Stroke prediction has been another application of retinal image analysis with deep learning algorithms. The authors of paper [
77] proposed an Inception-Resnet-v2 [
78] to predict 10-year ischemic cardiovascular diseases (ICVD) from a Chinese population dataset. The algorithm was able to achieve an AUC of 0.971 and 0.976 in internal validation and 0.859 and 0.876 in external validation.
In [
79], the authors implemented an ensemble-based framework, the architecture of which was composed of a Generative Adversarial Network (GAN) that uses a U-Net model as a generator to synthesize the images with high resolution. Afterward, an IncepcionV3 model was applied to predict the severity level of the CVD. The results show that an ensemble classifier with a CNN model had the best performance, with an improved accuracy of 91% for the different types of heart disease.
Multimodal approaches to predict CVD are also proposed. The work described in [
80] used a combination of source data integrating information from RFI and dual-energy X-ray absorptiometry (DXA), demonstrating the improved use of combined information. A DL-based technique based on ResNet architecture was used to distinguish the CVD group from the control group with 75.6% accuracy. Independently, classical machine learning classifiers achieved 77.4% accuracy on DXA data. The combination of both classifiers plus a custom CNN achieved 78.3% accuracy.
Another deep-learning pipeline for CVD prediction was proposed in [
81]. The study presents a hybrid system that estimates cardiac indices, such as left ventricular mass (LVM) and left ventricular end-diastolic volume (LVEDV), and predicts future myocardial infarction events. The system is composed of two main components: a multichannel variational autoencoder (mcVAE) [
82] and a ResNet architecture. First, the mcVAE is designed with two pairs of encoders/decoders that train the network from RFI and cardiac magnetic resonance (CMR) with a shared latent space. Second, the learned latent space is used to train the ResNet model from CMR images reconstructed from the retinal images plus the demographic data (age, gender, HbA1c, systolic and diastolic blood pressure, smoking/alcohol habits, glucose and BMI) to estimate LVM and LVEDV. Finally, they predict the myocardial infarction risk using logistic regression with 0.80 AUC, 0.74 sensitivity and 0.71 specificity.
In the table below (
Table 6), the list of reviewed methods is shown.


