
Peritumoural Strain Elastography of Newly Diagnosed Breast Tumours: Does Maximum Peritumoural Halo Depth Correlate with Tumour Differentiation and Grade?
 , , , and
Abstract
:1. Introduction
2. Materials and Methods
2.1. Approval by the Ethical Review Board (ERB)
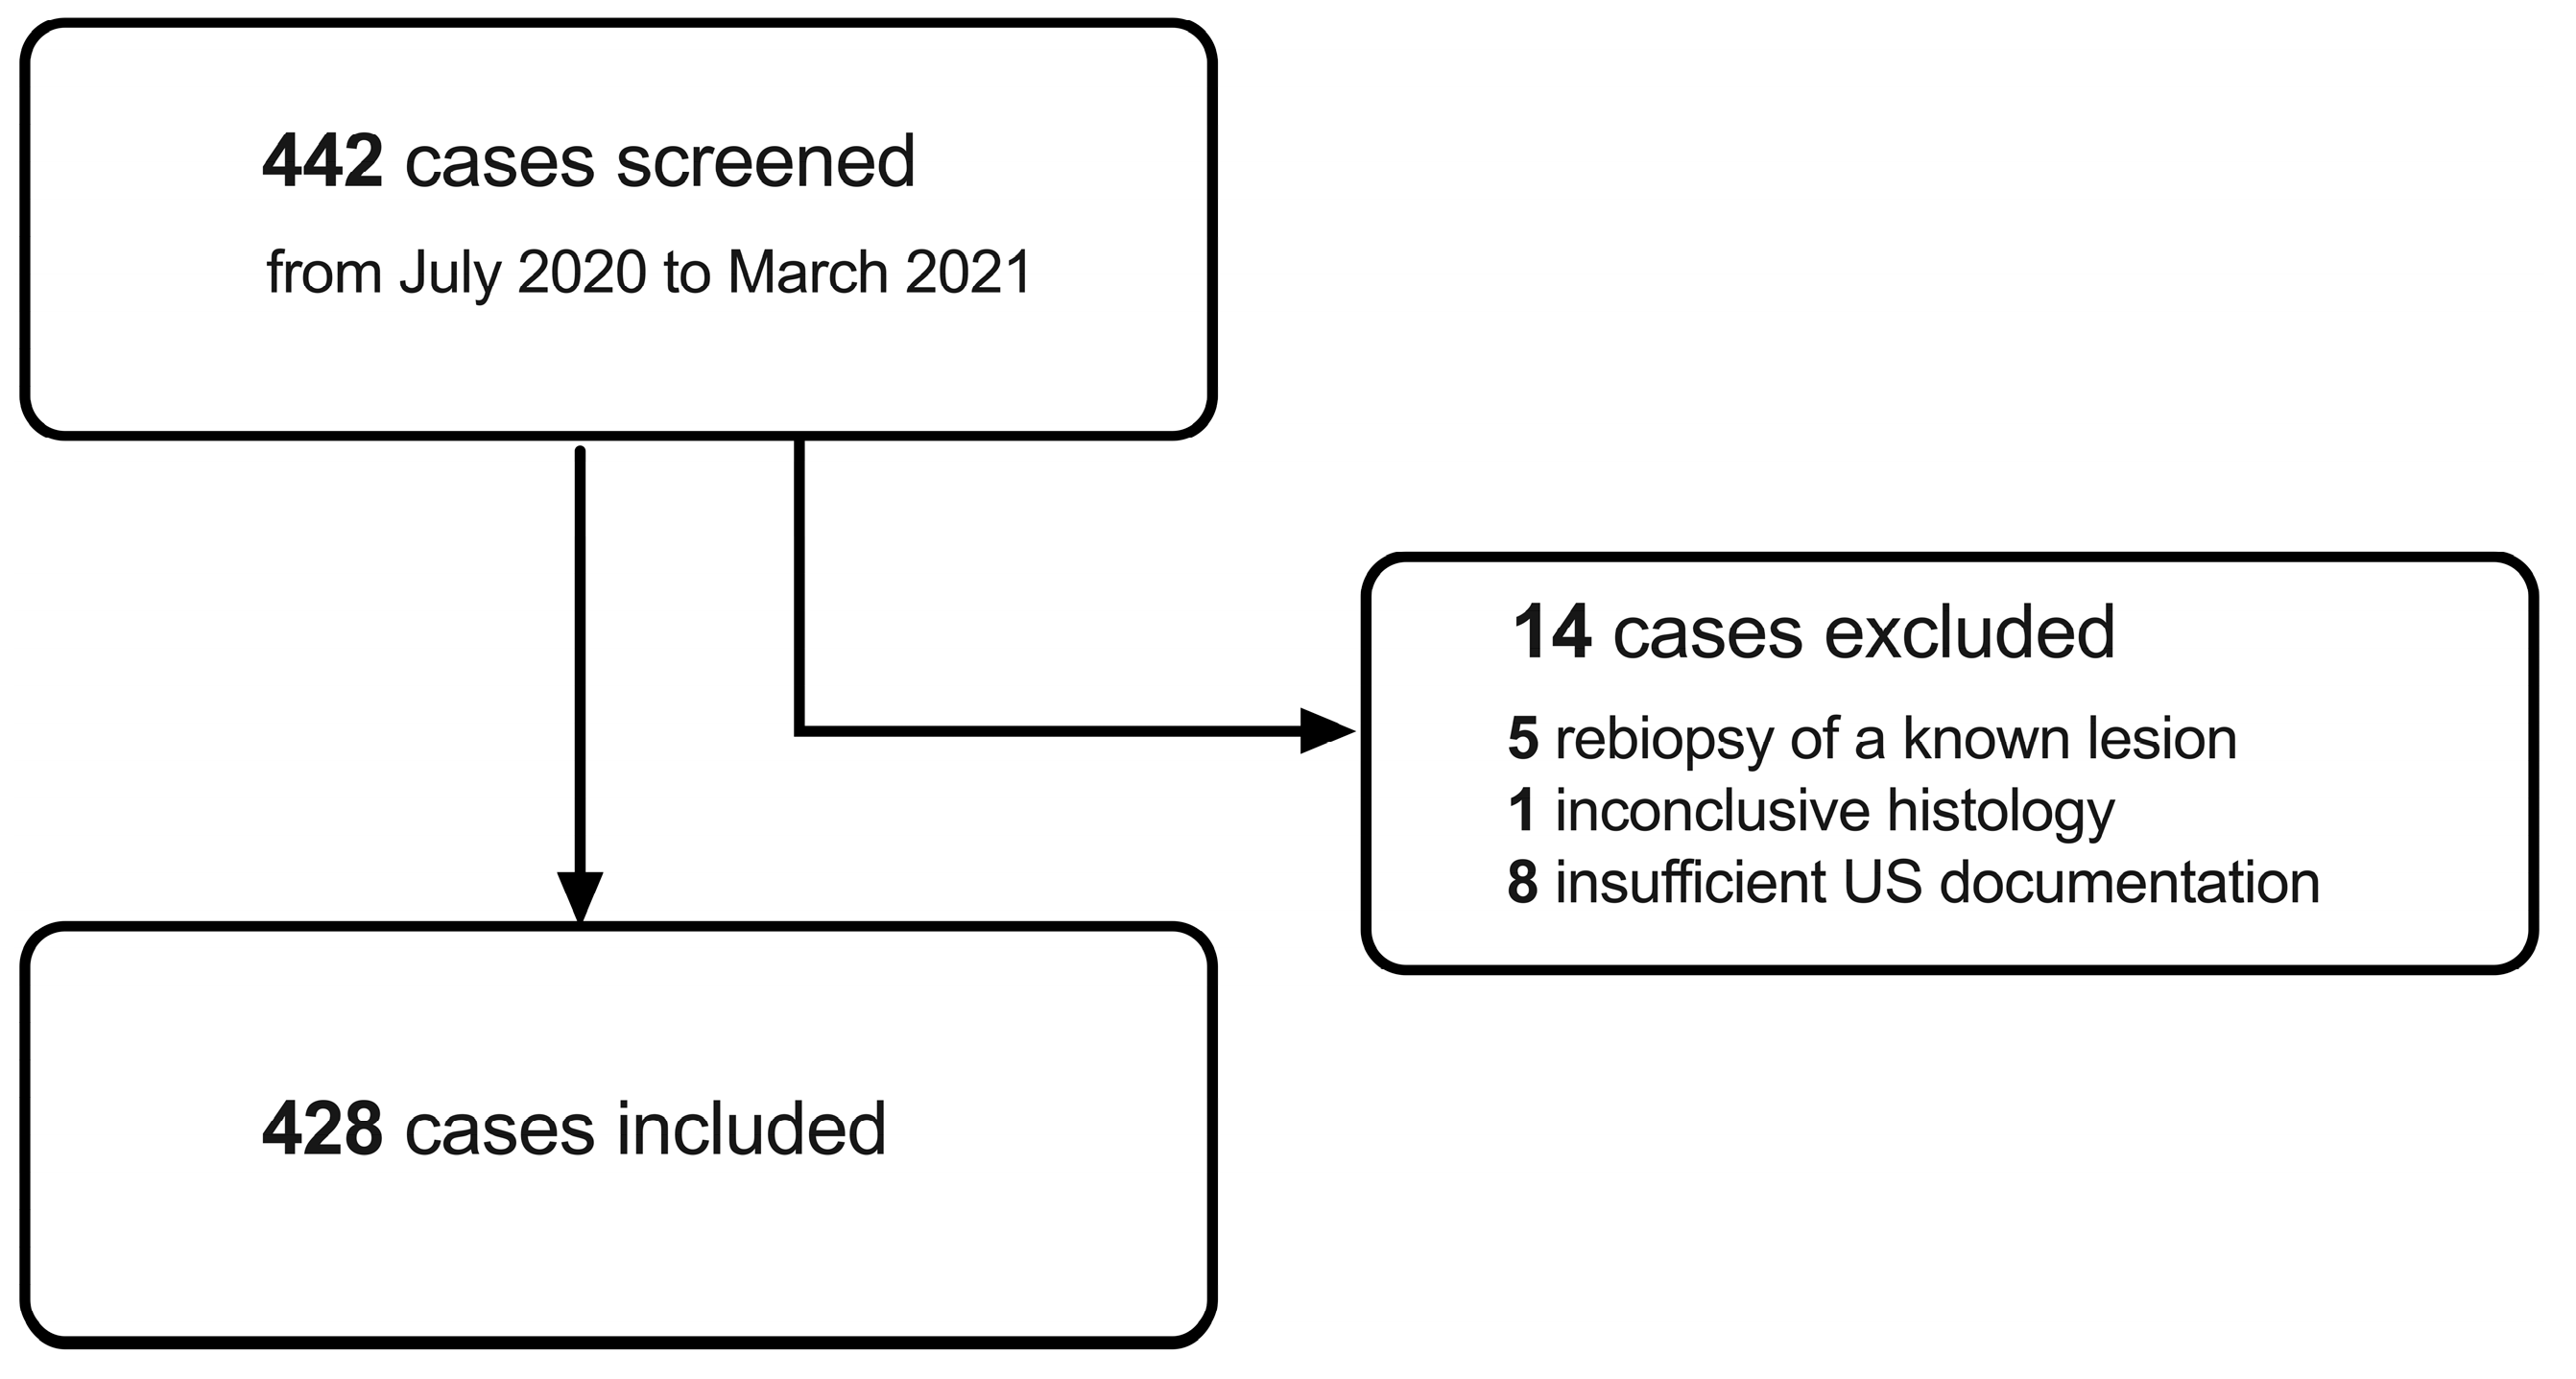
2.2. Inclusion Criteria and Screening Procedure
2.3. Ultrasound Examination Procedure
2.4. Ultrasound-Guided Biopsy
2.5. Histological Evaluation and Immunohistochemistry
2.6. Maximum Elastographic Peritumoural Halo Depth (SEPHmax) Measurement
2.7. Statistics
3. Results
3.1. Patient Demographics and Lesion Characteristics
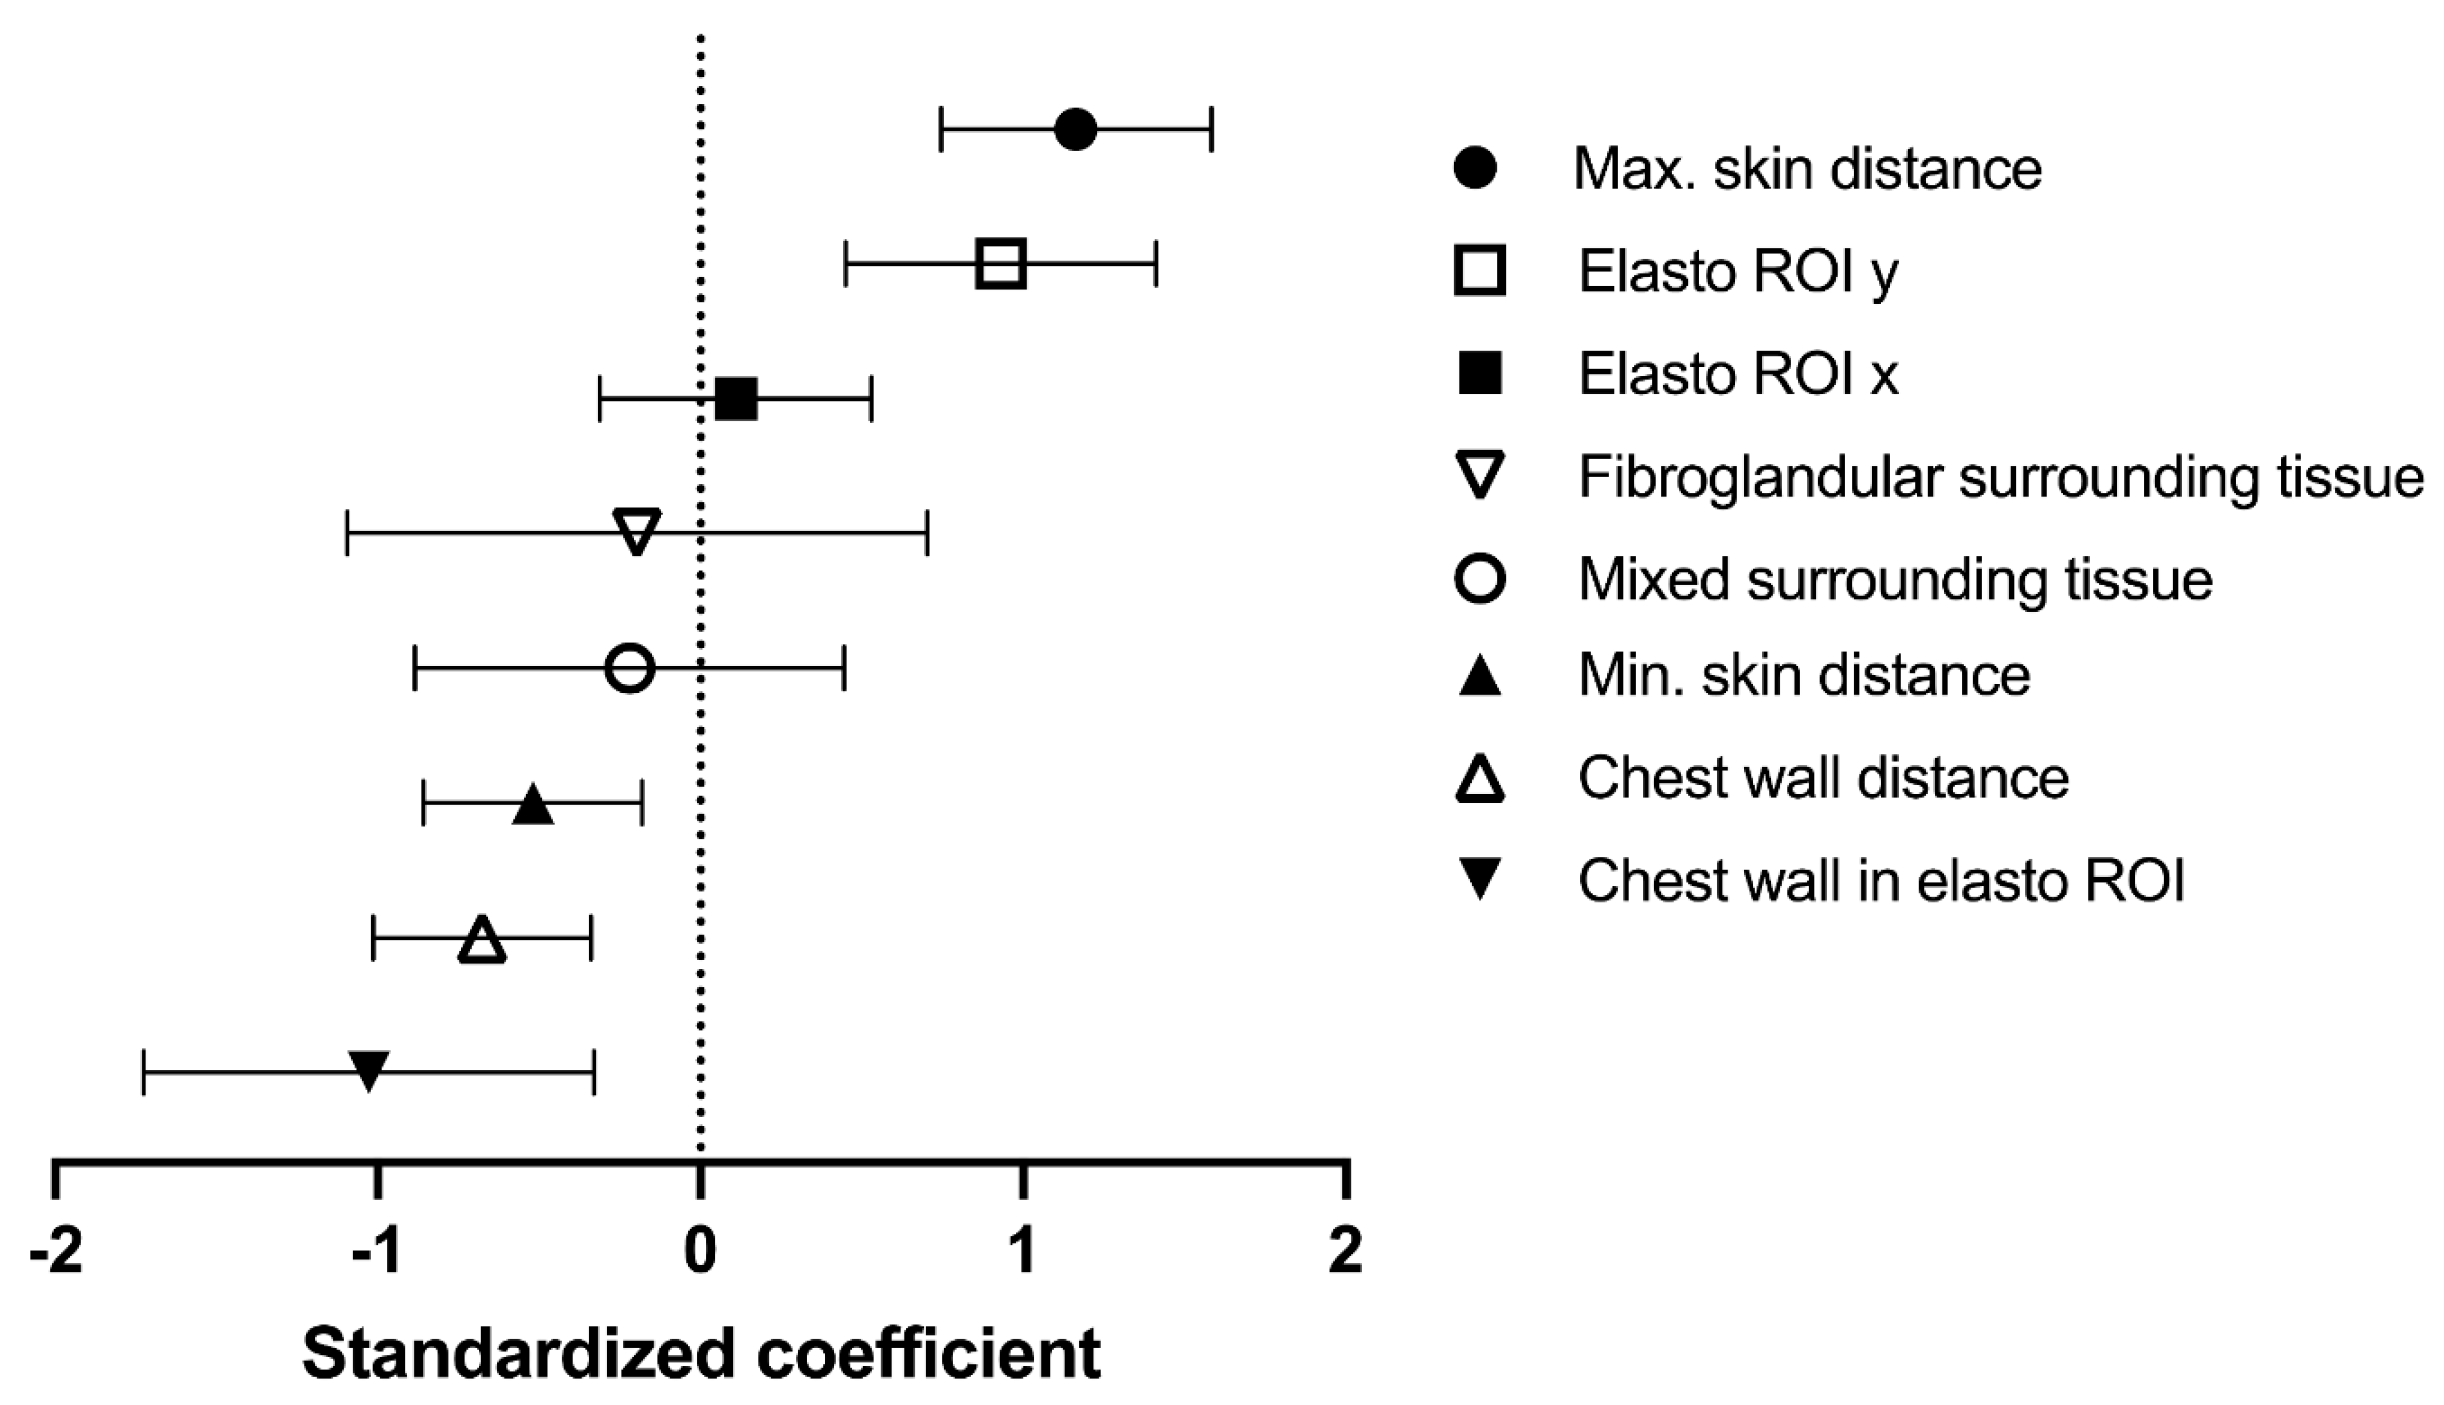
3.2. Covariates for Maximum Elastographic Peritumoural Halo Depth
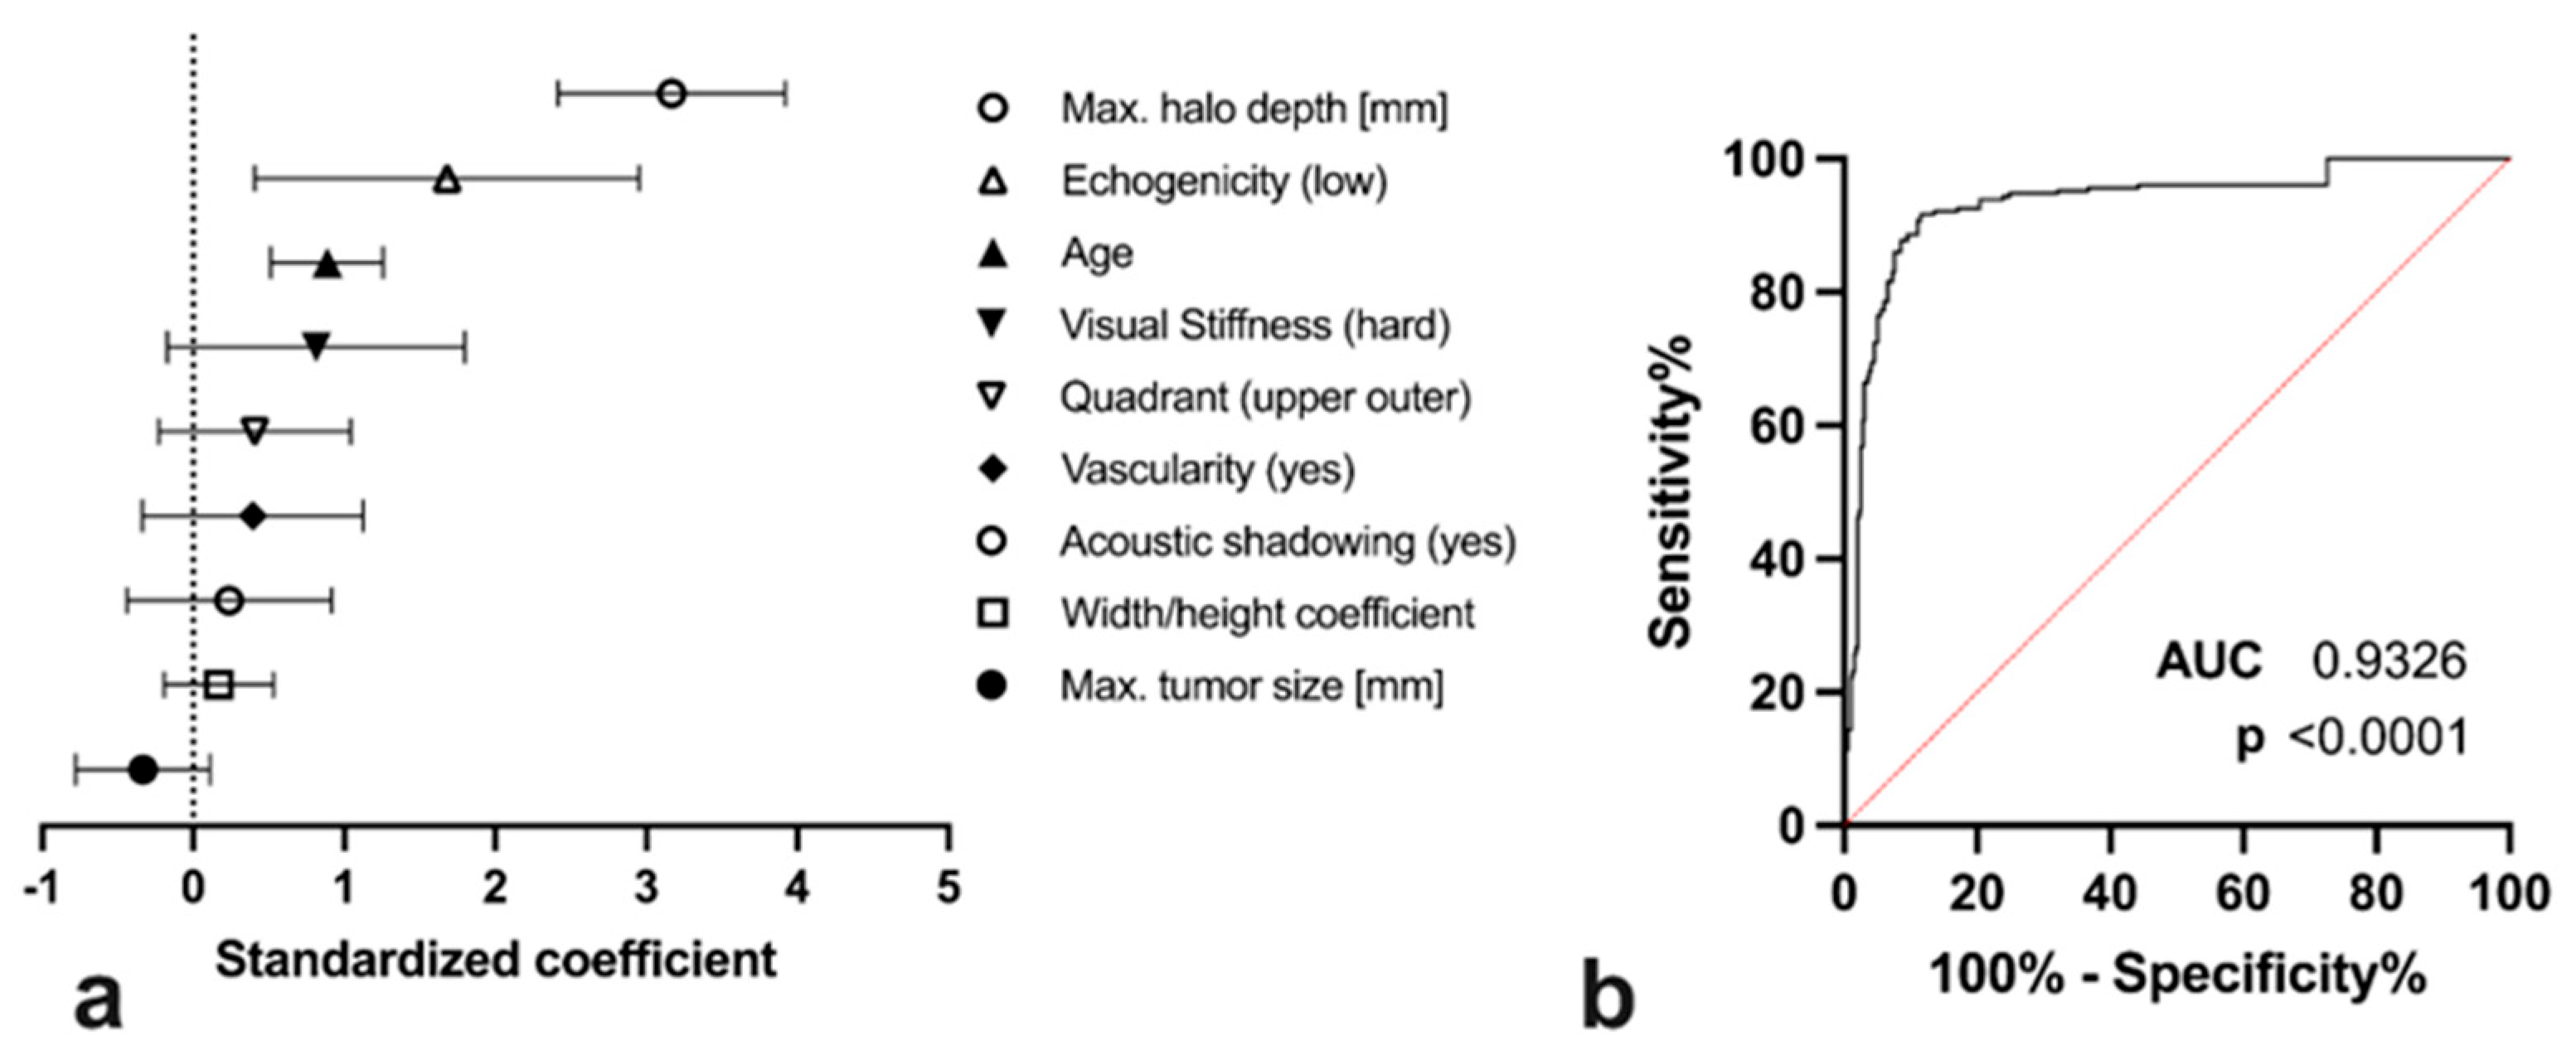
3.3. Diagnostic Utility of SEPHmax Assessment
3.4. Comparison of SEPHmax to Other Demographic and Sonographic Tumour Properties
4. Discussion
Limitations
5. Conclusions
Author Contributions
Funding
Institutional Review Board Statement
Informed Consent Statement
Data Availability Statement
Conflicts of Interest
Abbreviations
| SE | strain elastography |
| SEPHmax | maximum strain elastography peritumoural halo |
| NST | no special type |
| ILC | invasive lobular cancer |
| DCIS | ductal carcinoma in situ |
| US | ultrasound |
| ROI | region-of-interest |
References
- Torre, L.A.; Siegel, R.L.; Ward, E.M.; Jemal, A. Global Cancer Incidence and Mortality Rates and Trends—An Update. Cancer Epidemiol. Biomark. Prev. 2016, 25, 16–27. [Google Scholar] [CrossRef] [PubMed] [Green Version]
- Harbeck, N.; Penault-Llorca, F.; Cortes, J.; Gnant, M.; Houssami, N.; Poortmans, P.; Ruddy, K.; Tsang, J.; Cardoso, F. Breast cancer. Nat. Rev. Dis. Prim. 2019, 5, 66. [Google Scholar] [CrossRef] [PubMed]
- Independent UK Panel on Breast Cancer Screening. The benefits and harms of breast cancer screening: An independent review. Lancet 2012, 380, 1778–1786. [Google Scholar] [CrossRef] [PubMed]
- Suhrke, P.; Maehlen, J.; Schlichting, E.; Jørgensen, K.J.; Gøtzsche, P.C.; Zahl, P.-H. Effect of mammography screening on surgical treatment for breast cancer in Norway: Comparative analysis of cancer registry data. BMJ 2011, 343, d4692. [Google Scholar] [CrossRef] [Green Version]
- Cantisani, V.; David, E.; Barr, R.G.; Radzina, M.; de Soccio, V.; Elia, D.; De Felice, C.; Pediconi, F.; Gigli, S.; Occhiato, R.; et al. US-Elastography for Breast Lesion Characterization: Prospective Comparison of US BIRADS, Strain Elastography and Shear wave Elastography. Ultraschall Med. Eur. J. Ultrasound 2020, 42, 533–540. [Google Scholar] [CrossRef]
- Moss, H.A.; Britton, P.D.; Flower, C.D.; Freeman, A.H.; Lomas, D.J.; Warren, R.M. How reliable is modern breast imaging in differentiating benign from malignant breast lesions in the symptomatic population? Clin. Radiol. 1999, 54, 676–682. [Google Scholar] [CrossRef]
- Ricci, P.; Cantisani, V.; Ballesio, L.; Pagliara, E.; Sallusti, E.; Drudi, F.; Trippa, F.; Calascibetta, F.; Erturk, S.; Modesti, M.; et al. Benign and Malignant Breast Lesions: Efficacy of Real Time Contrast-Enhanced Ultrasound vs. Magnetic Resonance Imaging. Ultraschall Med. Eur. J. Ultrasound 2007, 28, 57–62. [Google Scholar] [CrossRef]
- Au, F.W.-F.; Ghai, S.; Moshonov, H.; Kahn, H.; Brennan, C.; Dua, H.; Crystal, P. Diagnostic Performance of Quantitative Shear Wave Elastography in the Evaluation of Solid Breast Masses: Determination of the Most Discriminatory Parameter. Am. J. Roentgenol. 2014, 203, W328–W336. [Google Scholar] [CrossRef]
- Papageorgiou, I.; Valous, N.A.; Hadjidemetriou, S.; Teichgräber, U.; Malich, A. Quantitative Assessment of Breast-Tumor Stiffness Using Shear-Wave Elastography Histograms. Diagnostics 2022, 12, 3140. [Google Scholar] [CrossRef]
- Barr, R.G. Sonographic Breast Elastography. J. Ultrasound Med. 2012, 31, 773–783. [Google Scholar] [CrossRef]
- Lam, A.C.L.; Pang, S.W.A.; Ahuja, A.T.; Bhatia, K.S.S. The influence of precompression on elasticity of thyroid nodules estimated by ultrasound shear wave elastography. Eur. Radiol. 2015, 26, 2845–2852. [Google Scholar] [CrossRef]
- Carlsen, J.F.; Ewertsen, C.; Lönn, L.; Nielsen, M.B. Strain Elastography Ultrasound: An Overview with Emphasis on Breast Cancer Diagnosis. Diagnostics 2013, 3, 117–125. [Google Scholar] [CrossRef] [Green Version]
- Barr, R.G.; Nakashima, K.; Amy, D.; Cosgrove, D.; Farrokh, A.; Schafer, F.; Bamber, J.C.; Castera, L.; Choi, B.I.; Chou, Y.-H.; et al. WFUMB Guidelines and Recommendations for Clinical Use of Ultrasound Elastography: Part 2: Breast. Ultrasound Med. Biol. 2015, 41, 1148–1160. [Google Scholar] [CrossRef] [Green Version]
- Dietrich, C.F.; Barr, R.G.; Farrokh, A.; Dighe, M.; Hocke, M.; Jenssen, C.; Dong, Y.; Saftoiu, A.; Havre, R.F. Strain Elastography—How to Do It? Ultrasound Int. Open 2017, 3, E137–E149. [Google Scholar] [CrossRef] [Green Version]
- Evans, A.; Whelehan, P.; Thomson, K.; McLean, D.; Brauer, K.; Purdie, C.; Jordan, L.; Baker, L.; Thompson, A. Quantitative shear wave ultrasound elastography: Initial experience in solid breast masses. Breast Cancer Res. 2010, 12, R104. [Google Scholar] [CrossRef] [Green Version]
- Evans, A.; Whelehan, P.; Thomson, K.; McLean, D.; Brauer, K.; Purdie, C.; Baker, L.; Jordan, L.; Rauchhaus, P.; Thompson, A. Invasive Breast Cancer: Relationship between Shear-wave Elastographic Findings and Histologic Prognostic Factors. Radiology 2012, 263, 673–677. [Google Scholar] [CrossRef]
- Martinez, J.; Smith, P.C. The Dynamic Interaction between Extracellular Matrix Remodeling and Breast Tumor Progression. Cells 2021, 10, 1046. [Google Scholar] [CrossRef]
- Zhou, J.; Zhan, W.; Chang, C.; Zhang, X.; Jia, Y.; Dong, Y.; Zhou, C.; Sun, J.; Grant, E.G. Breast Lesions: Evaluation with Shear Wave Elastography, with Special Emphasis on the “Stiff Rim” Sign. Radiology 2014, 272, 63–72. [Google Scholar] [CrossRef]
- D’Orsi, C.J.; Sickles, E.A.; Mendelson, E.B.; Morris, E.A.; Helbich, T.H. ACR BI-RADS® Atlas, Breast Imaging Reporting and Data System; American College of Radiology: Reston, VA, USA, 2013. [Google Scholar]
- Guidelines for Ultrasound Guided Breast Biopsy. Ultraschall Med. Eur. J. Ultrasound 2005, 26, 241–244. [CrossRef]
- Burstein, H.; Curigliano, G.; Thürlimann, B.; Weber, W.; Poortmans, P.; Regan, M.; Senn, H.; Winer, E.; Gnant, M.; Aebi, S.; et al. Customizing local and systemic therapies for women with early breast cancer: The St. Gallen International Consensus Guidelines for treatment of early breast cancer 2021. Ann. Oncol. 2021, 32, 1216–1235. [Google Scholar] [CrossRef]
- Radiology, A.C. ACR BI-RADS®-Atlas der Mammadiagnostik: Richtlinien zu Befundung, Handlungsempfehlungen und Monitoring; Springer: New York, NY, USA, 2016; Volume 529. [Google Scholar]
- Blaichman, J.; Marcus, J.C.; Alsaadi, T.; El-Khoury, M.; Meterissian, S.; Mesurolle, B. Sonographic Appearance of Invasive Ductal Carcinoma of the Breast According to Histologic Grade. Am. J. Roentgenol. 2012, 199, W402–W408. [Google Scholar] [CrossRef] [PubMed]
- Grajo, J.R.; Barr, R.G. Strain elastography for prediction of breast cancer tumor grades. J. Ultrasound. Med. 2014, 33, 129–134. [Google Scholar] [CrossRef] [PubMed]
- Zhou, W.; Sollie, T.; Tot, T.; Pinder, S.E.; Amini, R.-M.; Blomqvist, C.; Fjällskog, M.-L.; Christensson, G.; Abdsaleh, S.; Wärnberg, F. Breast Cancer with Neoductgenesis: Histopathological Criteria and Its Correlation with Mammographic and Tumour Features. Int. J. Breast Cancer 2014, 2014, 581706. [Google Scholar] [CrossRef] [PubMed] [Green Version]
- Pan, H.-B.; Yang, T.-L.; Chou, C.-P.; Huang, J.-S.; Liang, H.-L.; Tseng, H.-H. Mucinous Carcinoma of the Breast: Diagnostic Criteria Based on Ultrasonography. J. Med. Ultrasound 2005, 13, 18–25. [Google Scholar] [CrossRef] [Green Version]
- Bojanic, K.; Katavic, N.; Smolic, M.; Peric, M.; Kralik, K.; Sikora, M.; Vidačić, K.; Pacovski, M.; Stimac, D.; Ivanac, G. Implementation of Elastography Score and Strain Ratio in Combination with B-Mode Ultrasound Avoids Unnecessary Biopsies of Breast Lesions. Ultrasound Med. Biol. 2017, 43, 804–816. [Google Scholar] [CrossRef] [Green Version]
- Dalton, L.W.; Pinder, S.E.; Elston, C.E.; Ellis, I.O.; Page, D.L.; Dupont, W.D.; Blamey, R.W. Histologic Grading of Breast Cancer: Linkage of Patient Outcome with Level of Pathologist Agreement. Mod. Pathol. 2000, 13, 730–735. [Google Scholar] [CrossRef] [Green Version]
- Frierson, J.H.F.; Wolber, R.A.; Berean, K.W.; Franquemont, D.W.; Gaffey, M.J.; Boyd, J.C.; Wilbur, D.C. Interobserver Reproducibility of the Nottingham Modification of the Bloom and Richardson Histologic Grading Scheme for Infiltrating Ductal Carcinoma. Am. J. Clin. Pathol. 1995, 103, 195–198. [Google Scholar] [CrossRef]
- Nielsen, T.O.; Leung, S.C.Y.; Rimm, D.L.; Dodson, A.; Acs, B.; Badve, S.; Denkert, C.; Ellis, M.J.; Fineberg, S.; Flowers, M.; et al. Assessment of Ki67 in Breast Cancer: Updated Recommendations from the International Ki67 in Breast Cancer Working Group. Gynecol. Oncol. 2020, 113, 808–819. [Google Scholar] [CrossRef]
- Rakha, E.A.; Tun, M.; Junainah, E.; Ellis, I.O.; Green, A. Encapsulated papillary carcinoma of the breast: A study of invasion associated markers. J. Clin. Pathol. 2012, 65, 710–714. [Google Scholar] [CrossRef]
- Hashmi, A.A.; Iftikhar, S.N.; Munawar, S.; Shah, A.; Irfan, M.; Ali, J. Encapsulated Papillary Carcinoma of Breast: Clinicopathological Features and Prognostic Parameters. Cureus 2020, 12, e11282. [Google Scholar] [CrossRef]


| Inclusion Criteria | Exclusion Criteria |
|---|---|
| Ultrasound-guided biopsy of a newly diagnosed lesion with definable borders | Patient age under 18 years |
| Sufficient ultrasound documentation including B-mode, Doppler, and elastography imaging | Prior history of ipsilateral breast cancer |
| Available histological report | Insufficient ultrasound documentation |
| Inconclusive histology |
| Overall | BI-RADS II | BI-RADS III | BI-RADS V | p-Value $ | |
|---|---|---|---|---|---|
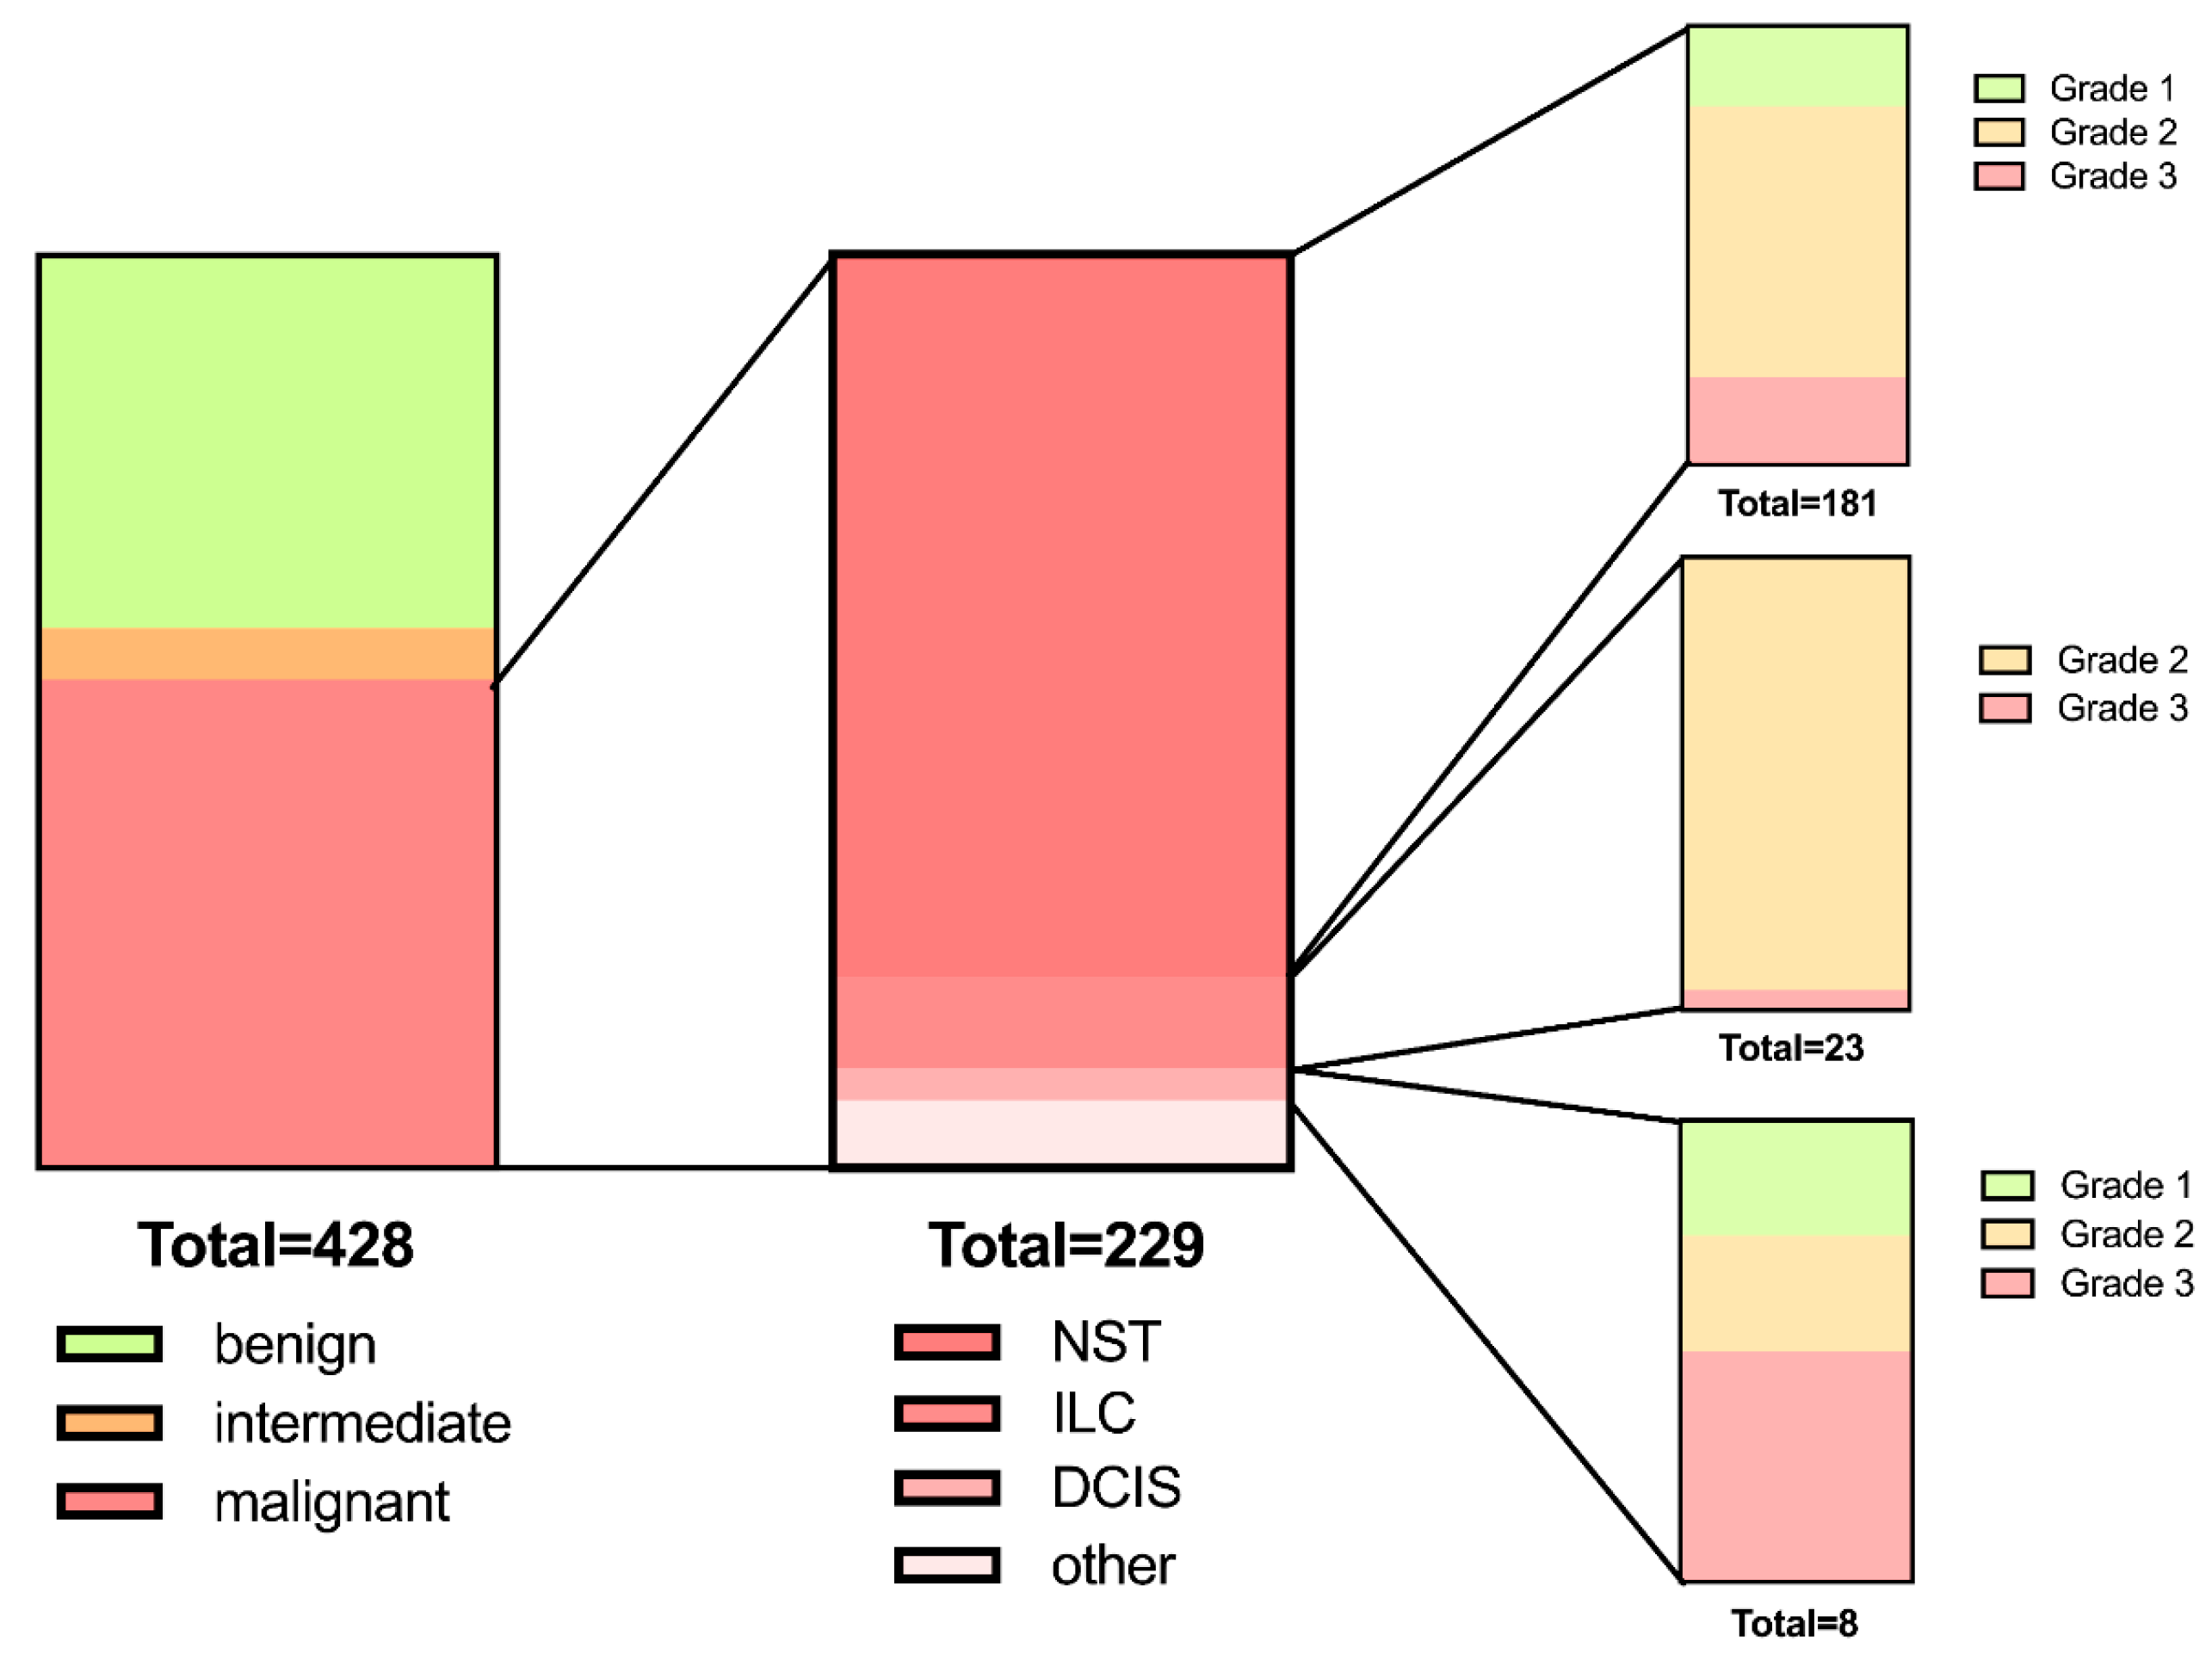
| n | 428 | 175 | 24 | 229 | n/a |
| Age [years] | 56.0 ± 16.5 | 48.3 ± 14.8 | 54.2 ± 16.3 | 62.2 ± 15.3 | 0.284/<0.0001/0.066 # |
| Side, right (%/n) | 47.9 (205) | 48.6 (85) | 25.0 (6) | 49.8 (114) | 0.067 § |
| Maximum diameter (mm) | 15.4 ± 9.0 | 14.9 ± 9.4 | 16.4 ± 10.8 | 15.7 ± 8.6 | >0.999/0.316/>0.999 # |
| Grade 1/2/3 (%/n) | - | - | - | G1: 23.8% (43) G2: 78.5% (142) G3: 24.3% (44) | n/a |
| Quadrant UI/ LI/ LO/ UO/ C (%/n) | 16.6% (71)/ 8.9% (38)/ 19.2% (82)/ 48.8% (209)/ 6.5% (28) | 17.1% (30)/ 9.7% (17)/ 21.7% (38)/ 42.3% (74)/ 9.1% (16) | 12.5% (3)/ 12.5% (3)/ 16.7% (4)/ 41.7% (10)/ 16.7% (4) | 16.6% (38)/ 7.9% (18)/ 17.5% (40)/ 54.6% (125)/ 3.5% (8) | 0.076 § |
| Lymph node metastasis (%/n) | - | - | - | 18.3% (42) | n/a |
| BI-RADS | Benign (BI-RADS II) | Intermediate (BI-RADS III) | Malignant (BI-RADS V) | p-Values $ |
|---|---|---|---|---|
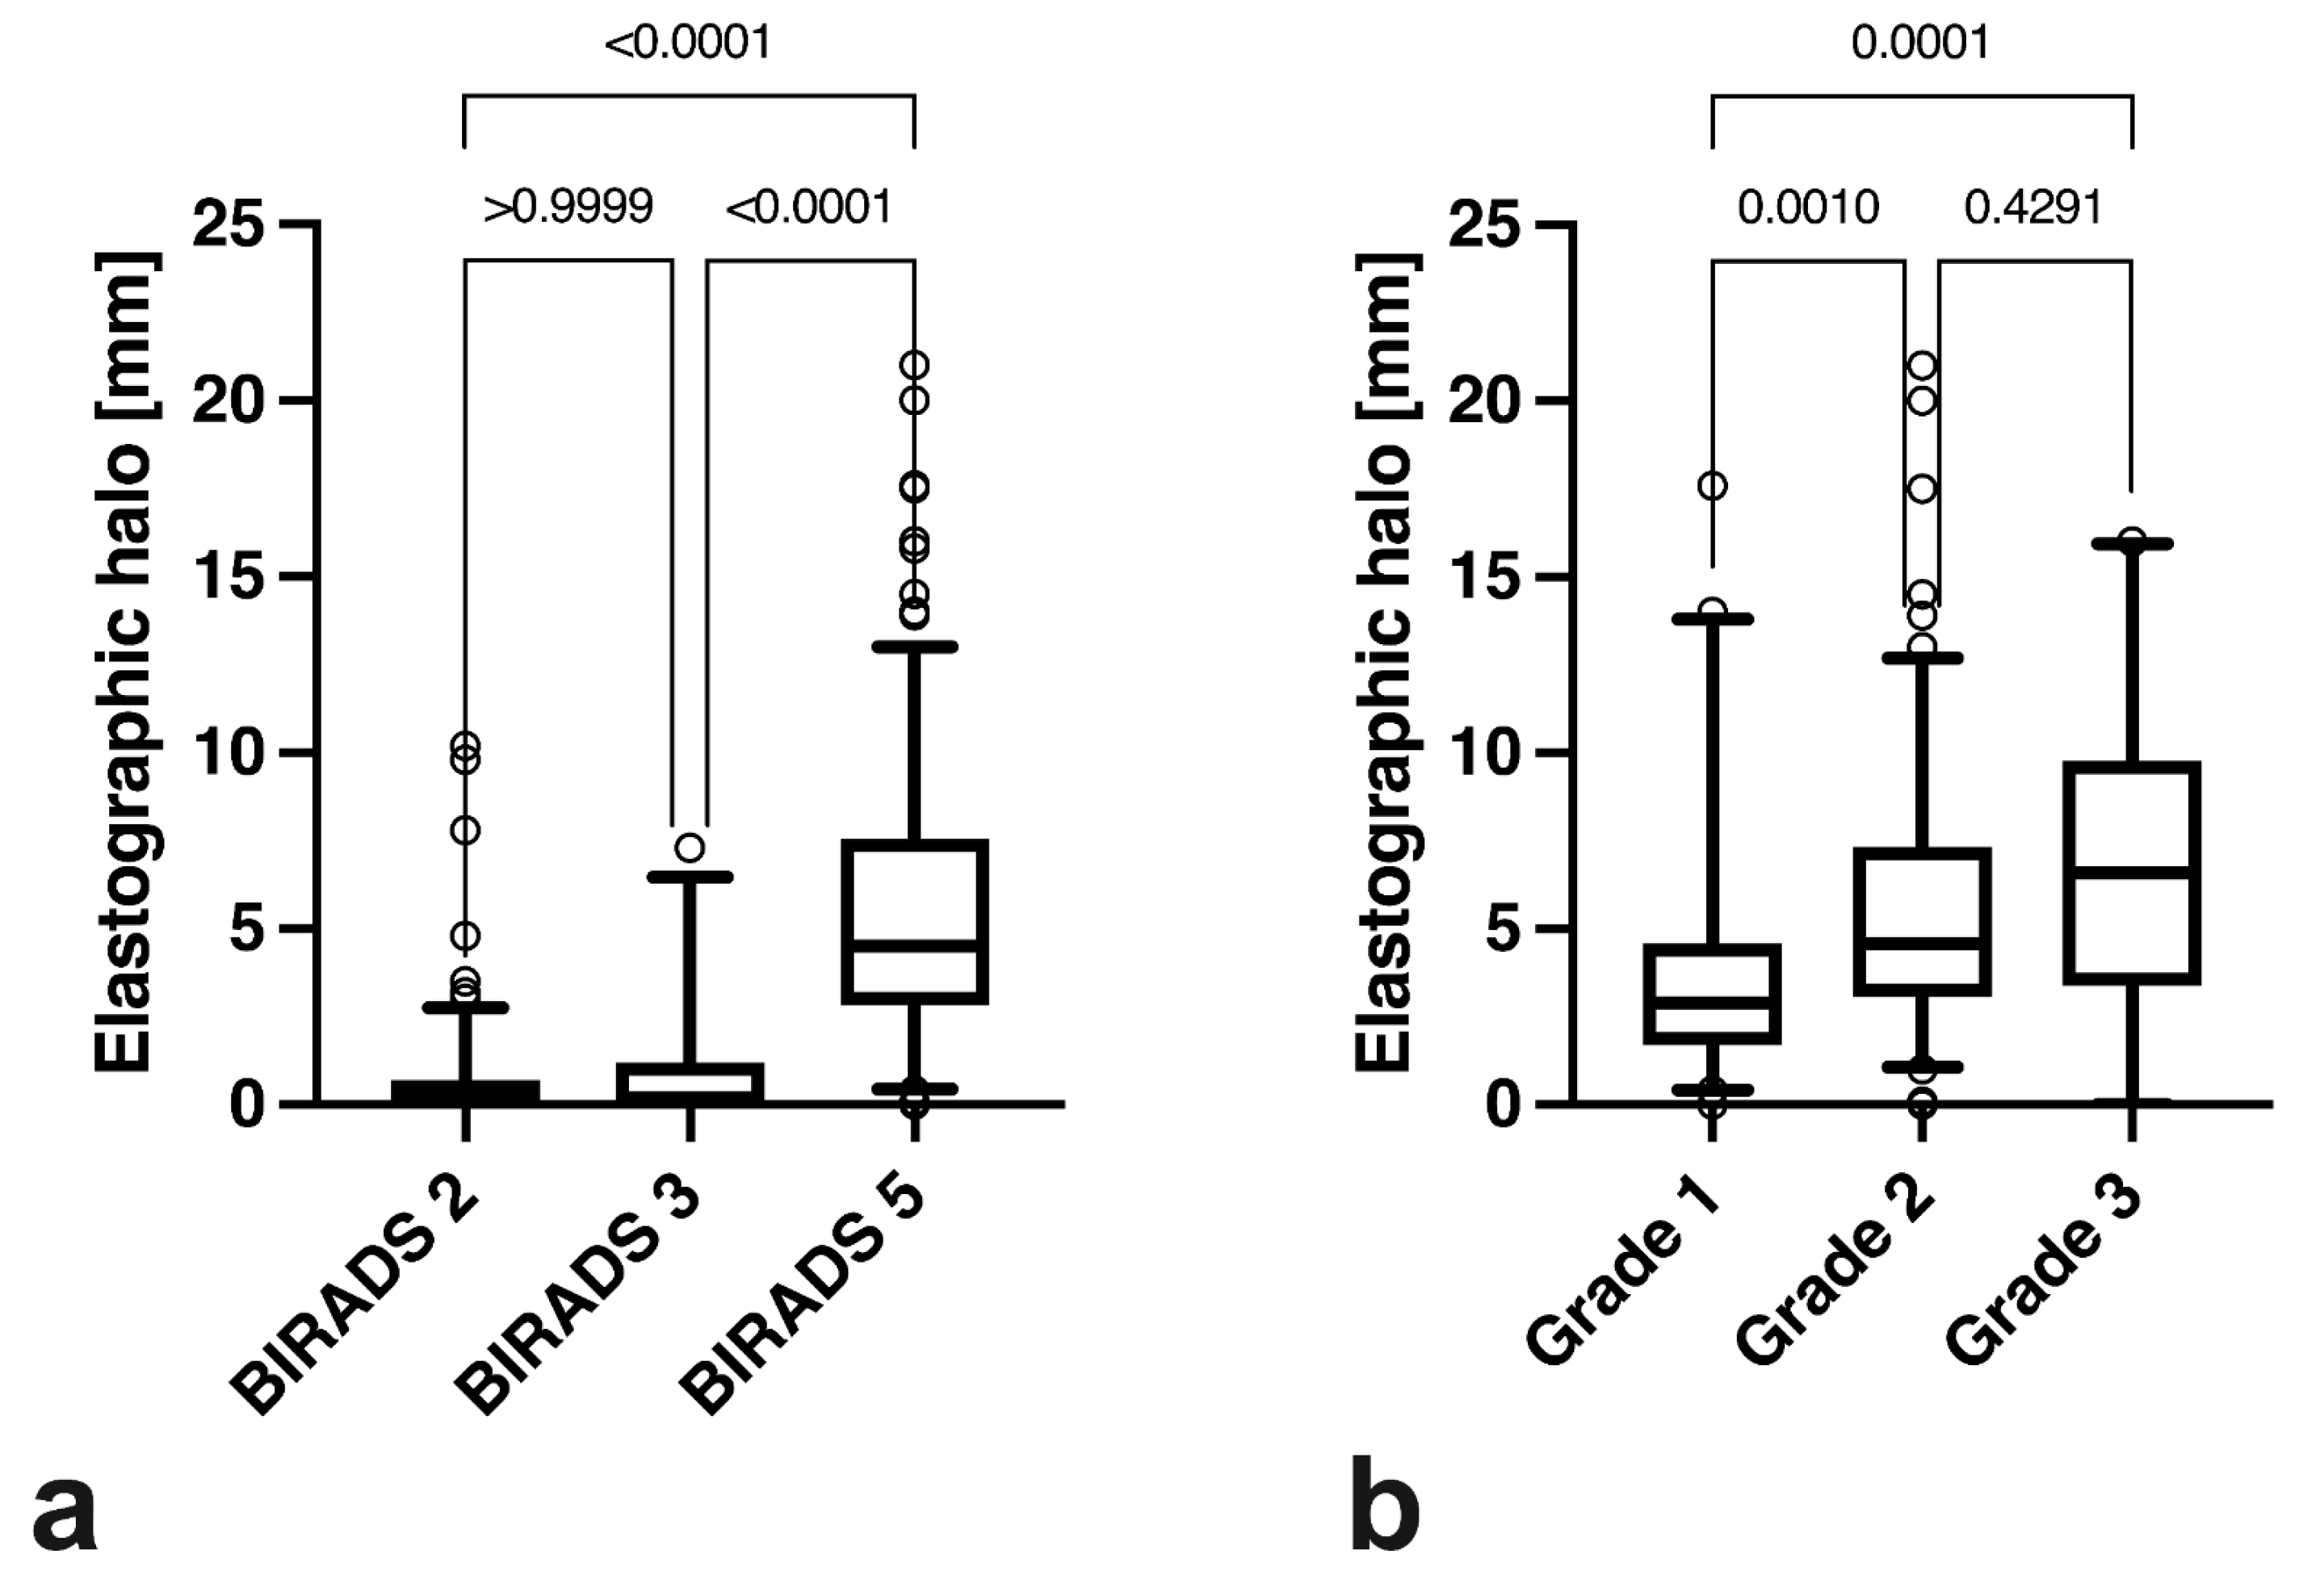
| SEPHmax | 0.6 ± 1.4 mm | 0.9 ± 1.4 mm | 5.5 ± 3.9 mm | >0.9999/<0.0001/<0.0001 |
| Tumour grade | Grade I | Grade 2 | Grade 3 | p-values $ |
| SEPHmax | 4.0 ± 3.9 mm | 5.6 ± 3.6 mm | 6.8 ± 4.2 mm | 0.001/0.0001/0.4291 |
Disclaimer/Publisher’s Note: The statements, opinions and data contained in all publications are solely those of the individual author(s) and contributor(s) and not of MDPI and/or the editor(s). MDPI and/or the editor(s) disclaim responsibility for any injury to people or property resulting from any ideas, methods, instructions or products referred to in the content. |
© 2023 by the authors. Licensee MDPI, Basel, Switzerland. This article is an open access article distributed under the terms and conditions of the Creative Commons Attribution (CC BY) license (https://creativecommons.org/licenses/by/4.0/).
Share and Cite
Gruber, L.; Deeg, J.; Egle, D.; Soleiman, A.; Ladenhauf, V.; Luger, A.; Amort, B.; Daniaux, M. Peritumoural Strain Elastography of Newly Diagnosed Breast Tumours: Does Maximum Peritumoural Halo Depth Correlate with Tumour Differentiation and Grade? Diagnostics 2023, 13, 2064. https://doi.org/10.3390/diagnostics13122064
Gruber L, Deeg J, Egle D, Soleiman A, Ladenhauf V, Luger A, Amort B, Daniaux M. Peritumoural Strain Elastography of Newly Diagnosed Breast Tumours: Does Maximum Peritumoural Halo Depth Correlate with Tumour Differentiation and Grade? Diagnostics. 2023; 13(12):2064. https://doi.org/10.3390/diagnostics13122064
Chicago/Turabian StyleGruber, Leonhard, Johannes Deeg, Daniel Egle, Afschin Soleiman, Valentin Ladenhauf, Anna Luger, Birgit Amort, and Martin Daniaux. 2023. "Peritumoural Strain Elastography of Newly Diagnosed Breast Tumours: Does Maximum Peritumoural Halo Depth Correlate with Tumour Differentiation and Grade?" Diagnostics 13, no. 12: 2064. https://doi.org/10.3390/diagnostics13122064