Systematic Review

The Diagnostic Performance of Tumor Stage on MRI for Predicting Prostate Cancer-Positive Surgical Margins: A Systematic Review and Meta-Analysis

1
Department of Radiology, Sichuan Provincial People’s Hospital, University of Electronic Science and Technology of China, Chengdu 611731, China
2
Institute of Radiation Medicine, Sichuan Provincial People’s Hospital, University of Electronic Science and Technology of China, Chengdu 611731, China
3
Department of Radiology, Affiliated Hospital of North Sichuan Medical College, Nanchong 637000, China
4
Department of Radiology, Huashan Hospital, Fudan University, Shanghai 200032, China
5
Department of Radiology, Affiliated Hospital of Southwest Medical University, Luzhou 646000, China
*
Author to whom correspondence should be addressed.
Diagnostics 2023, 13(15), 2497; https://doi.org/10.3390/diagnostics13152497
Submission received: 21 June 2023 / Revised: 17 July 2023 / Accepted: 22 July 2023 / Published: 27 July 2023
(This article belongs to the Special Issue Advances in Imaging and Diagnosis of Prostate Cancer)

Abstract

:
Purpose: Surgical margin status in radical prostatectomy (RP) specimens is an established predictive indicator for determining biochemical prostate cancer recurrence and disease progression. Predicting positive surgical margins (PSMs) is of utmost importance. We sought to perform a meta-analysis evaluating the diagnostic utility of a high clinical tumor stage (≥3) on magnetic resonance imaging (MRI) for predicting PSMs. Method: A systematic search of the PubMed, Embase databases, and Cochrane Library was performed, covering the interval from 1 January 2000 to 31 December 2022, to identify relevant studies. The Quality Assessment of Diagnostic Accuracy Studies 2 method was used to evaluate the studies’ quality. A hierarchical summary receiver operating characteristic plot was created depicting sensitivity and specificity data. Analyses of subgroups and meta-regression were used to investigate heterogeneity. Results: This meta-analysis comprised 13 studies with 3924 individuals in total. The pooled sensitivity and specificity values were 0.40 (95% CI, 0.32–0.49) and 0.75 (95% CI, 0.69–0.80), respectively, with an area under the receiver operating characteristic curve of 0.63 (95% CI, 0.59–0.67). The Higgins I2 statistics indicated moderate heterogeneity in sensitivity (I2 = 75.59%) and substantial heterogeneity in specificity (I2 = 86.77%). Area, prevalence of high Gleason scores (≥7), laparoscopic or robot-assisted techniques, field strength, functional technology, endorectal coil usage, and number of radiologists were significant factors responsible for heterogeneity (p ≤ 0.01). Conclusions: T stage on MRI has moderate diagnostic accuracy for predicting PSMs. When determining the treatment modality, clinicians should consider the factors contributing to heterogeneity for this purpose.

1. Introduction

According to the latest data for 2021, prostate cancer (PCa) is the most prevalent cancer among men, making it the second leading cause of death [1]. Although radical prostatectomy (RP) is the recommended treatment for prostate cancer, 20% of individuals who have RP surgery experience positive surgical margins (PSMs) that are detected by pathology [2]. This is a recognized negative prognostic indicator for PCa.
PSMs are generally defined as tumor cells reaching the inked surgical margin of the prostatectomy specimen [3]. PSMs are associated with local disease recurrence and distant metastasis, which may necessitate secondary treatment [4,5,6,7]. Therefore, a preoperative test for predicting clinically meaningful PSMs would be important for optimizing patients who require intraoperative frozen analysis or adjuvant treatment for obtaining better tumor control and avoiding unfavorable functional outcomes.
The digital rectal examination (DRE) is a standard procedure for diagnosing and staging PCa. However, the importance of precise DRE staging remains debatable. In recent years, multiparameter magnetic resonance imaging (mpMRI) has been clinically used in the diagnosis of PCa, including in tumor detection, localization, localized staging, and determining tumor aggressiveness. MRI is regarded as the best available imaging tool for assessing tumor stage (T stage) in clinical practice [8,9]. High clinical T stage disease (T3 stage), including extraprostatic extension—namely, extracapsular extension, and seminal vesicle infiltration—determined by MRI has been significantly associated with more prevalent PSMs [10] and frequently linked to a higher risk of biochemical recurrence as well as metastatic disease [11], which might be crucial for planning RP approaches and nerve-sparing surgery.
For this reason, preoperative MRI not only focuses on predicting the T stage, but it is also important for tailoring surgical concepts for patients and guiding surgeons to achieve negative surgical margins [12], which is significant for survival, prognosis, and recurrence. Relevant scoring systems have been developed to predict PSMs [13,14], and the T3 stage on MRI was considered an independent predictor of PSM after RP [14]. However, the association between the T stage on MRI and PSM remains controversial. Furthermore, there has been no systematic evaluation of the diagnostic significance of MRI for predicting PSMs.
Therefore, this meta-analysis aimed to assess the diagnostic performance of the T3 stage as a predictive indicator of PSMs in patients with PCa.

2. Materials and Methods

This meta-analysis was conducted and written according to PRISMA (Preferred Reporting Items for Systematic Reviews and Meta-Analyses) guidelines. The study protocol was registered with INPLASY (INPLASY202370012).

2.1. Literature Search

Two researchers employed a systematic search strategy using PubMed, the Cochrane Library, and Embase to find articles reporting on studies evaluating the value of MRI to predict PSMs. Articles published between 1 January 2000 and 31 December 2022 were included in the searches. We applied the search strategy based on medical topic headings, free words, and their variants. The literature retrieval process had no language restrictions. The detailed retrieval strategy is described in the Supplementary Materials. The reference lists for articles and reviews containing combinations of search strings were checked.

2.2. Inclusion Criteria

We included articles reporting on diagnostic accuracy studies if (1) accuracy was assessed for PSMs using non-organ localized diseases observed on MRI as the index test among PCa patients, (2) if the histopathology of RP specimens served as the reference standard, (3) if studies had enough information to develop a 2 × 2 table to evaluate the diagnostic accuracy, and (4) the if article type was an “original article” or equivalent.

2.3. Exclusion Criteria

The exclusion criteria were (1) studies with a variety of topics, such as the diagnostic usefulness of other MRI findings for PSM prediction, (2) the reference standard was not RP specimen, (3) insufficient necessary data for meta-analytic pooling, and (4) publication type other than the original article.

2.4. Data Extraction

The extracted data include the first author, year of publication, study characteristics, demographic characteristics, imaging characteristics, numbers of true/false positives, and true/false negatives.

2.5. Methodologic Quality Assessment

Study quality was evaluated utilizing the QUADAS-2 (Quality Assessment of Diagnostic Accuracy Studies 2) tool [15]. The risk of bias for each study was assessed in four ways: (1) patient selection, (2) index test, (3) reference standard, and (4) flow and timing. Bias risk was rated as low, high, or unclear.

2.6. Data Synthesis and Analysis

Diagnostic tables including true positives, false negatives, false positives, and true negatives were used to calculate sensitivity and specificity. The bivariate random effects model was used to assess the diagnostic efficacy indices including pooled sensitivity, specificity, and their 95% confidence intervals (CIs) [16]. The hierarchical receiver operating characteristic (HSROC) summary curve analysis with the area under the receiver operating characteristic curve (AUC) was plotted to exhibit the diagnostic precision [17]. Deeks’ funnel plot asymmetry test was used to identify publication bias [18]. Significant heterogeneity was indicated by the following criteria: p < 0.05 in Cochrane’s Q test and an I2 ratio >50%. For evaluation of the heterogeneity between studies, the potential effects of several covariates were investigated by subgroup analysis. The covariates included (1) study design (retrospective vs. prospective), (2) area (Asia vs. non-Asia), (3) use of minimally invasive techniques (laparoscopic vs. non-laparoscopic), and robot assistance (robot-assisted vs. not robot-assisted), (4) prevalence of high Gleason scores (≥7) on the biopsy (≥50% vs. <50%), (5) magnetic field strength (3 T vs. not 3 T), (6) use of endorectal coils (ERCs), (7) functional MRI technology (MRI sequences using apparent diffusion coefficients and dynamic contrast enhancement (DCE) vs. not), (8) the number of radiologists (multiple vs. single), and (9) the number of cases (≥150 vs. <150).
One reviewer (W.Y.) conducted all analyses using Stata 17.0 (StataCorp, College Station, TX, USA), with p < 0.05 denoting statistical significance.

3. Results

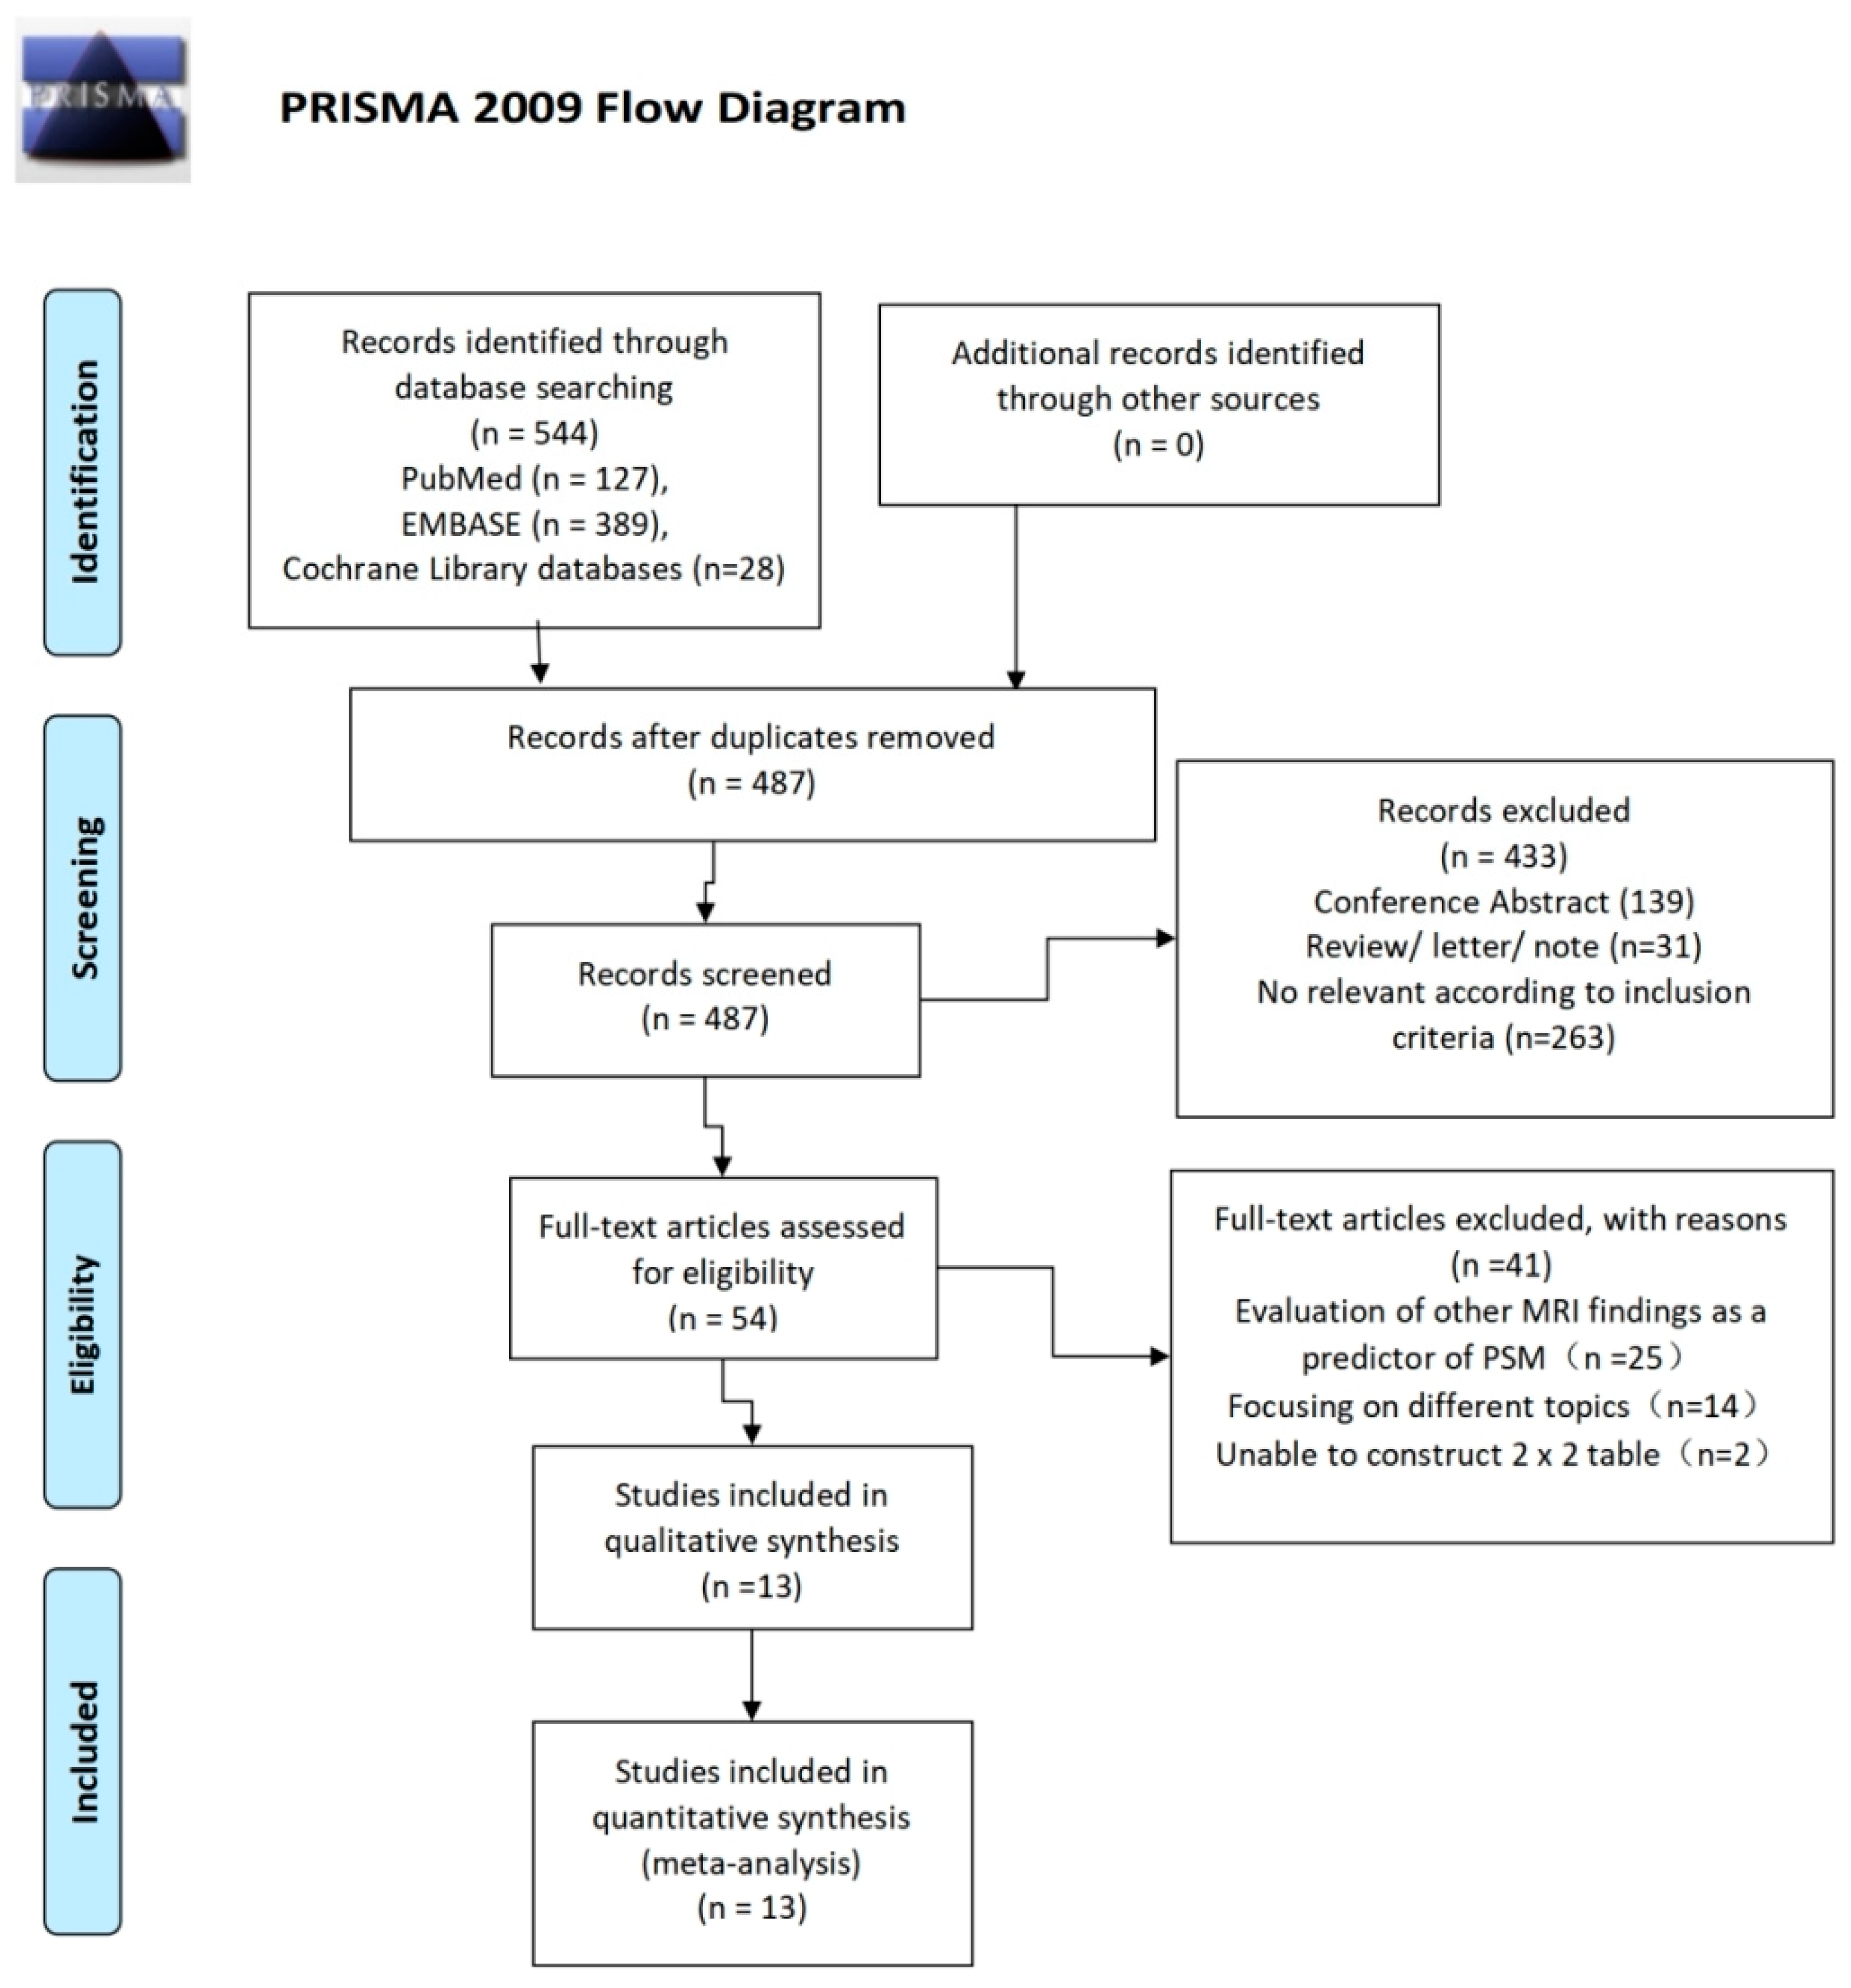
3.1. Literature Search and Article Selection

The PRISMA flow diagram depicts the article screening process, as shown in Figure 1.
Initially, after systematic searching, 544 articles were obtained in the PubMed, Embase, and Cochrane Library databases. Fifty-seven duplicates were removed. The remaining 487 titles and abstracts were filtered, leaving 54 potentially eligible papers for full-text screening. After the full-text review, 13 articles [4,10,12,19,20,21,22,23,24,25,26,27,28] were acceptable for this systematic review. The reasons for exclusion were (1) insufficient data to generate 2 × 2 tables (n = 2), (2) evaluation of other MRI findings as predictors of PSMs (n = 25), and (3) the reported study did not assess the outcomes of interest (n = 14). Ultimately, 13 articles (3924 patients) were included in this meta-analysis.

3.2. Study Characteristics

Table 1 summarizes the demographic characteristics, first author, sample size, year of publication, area, age, prostate-specific antigen levels, number of patients with high biopsy Gleason score and proportion and mode of biopsies, and DRE results. Study characteristics included study design, consecutive patient selection, NeuroSAFE techniques, whether minimally invasive techniques were used, reference standard, the interval between imaging and surgery, and surgeons (Table 2). Table 3 summarizes imaging characteristics including magnetic field strength, number and experience of radiologists, blinding, use of ERCs, MRI vendors, and imaging sequence details, including functional DCE MRI and diffusion-weighted imaging (DWI), as well as T2-weighted imaging (T2WI).
The sample sizes of individual studies ranged from 48 to 1145. One study was prospective in design [25]; the remaining twelve were retrospective. ERCs were used in three studies [19,24,28]. For blinding, two papers reported that the radiologists were aware that patients had biopsy evidence of PCa [19,24], and three articles did not specify blinding [4,12,20]. In four studies, only 1.5 T scanners were used [12,23,24,28], compared with six studies wherein MRI was performed using 3.0 T scanners. One study used both 1.5 T and 3.0 T scanners [10]. The use of the NeuroSAFE technique was mentioned in four studies [12,20,21,24].

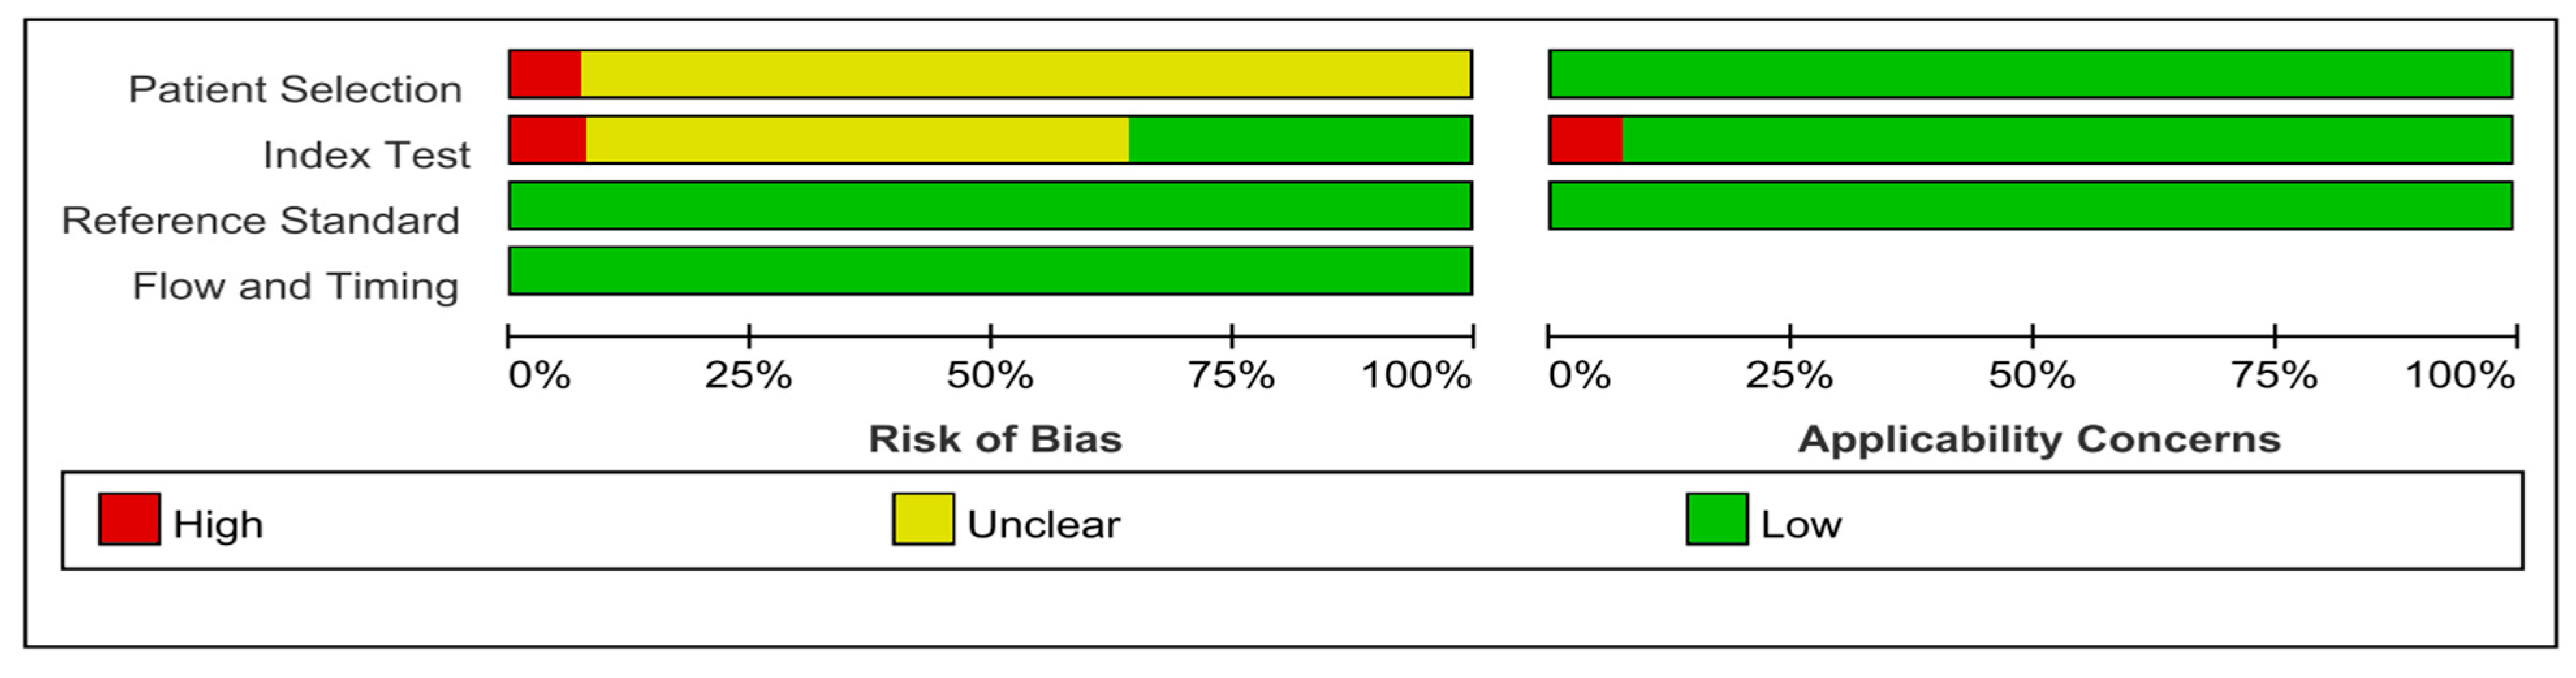
3.3. Quality Assessment

In terms of study quality, the overall quality was moderate. The majority of research in the field of patient selection had retrospective designs, which were seen as having an unclear risk of bias. Due to the reader’s exposure to the reference tests during the interpretation of the index tests in two trials, the index domain was of high concern [19,24]. Six studies were labeled as unclear regarding the applicability of index tests due to a lack of information presented about index test characteristics, interpretation, and blinding [4,10,12,20,22,28]. All studies were deemed to have a low risk of bias in the reference test domain since they all used RP specimens as the reference standard. For the flow and timing domain, all of the included studies were found to have a high risk of bias. The quality of the included investigations determined by QUADAS-2 rules is shown in Figure 2.

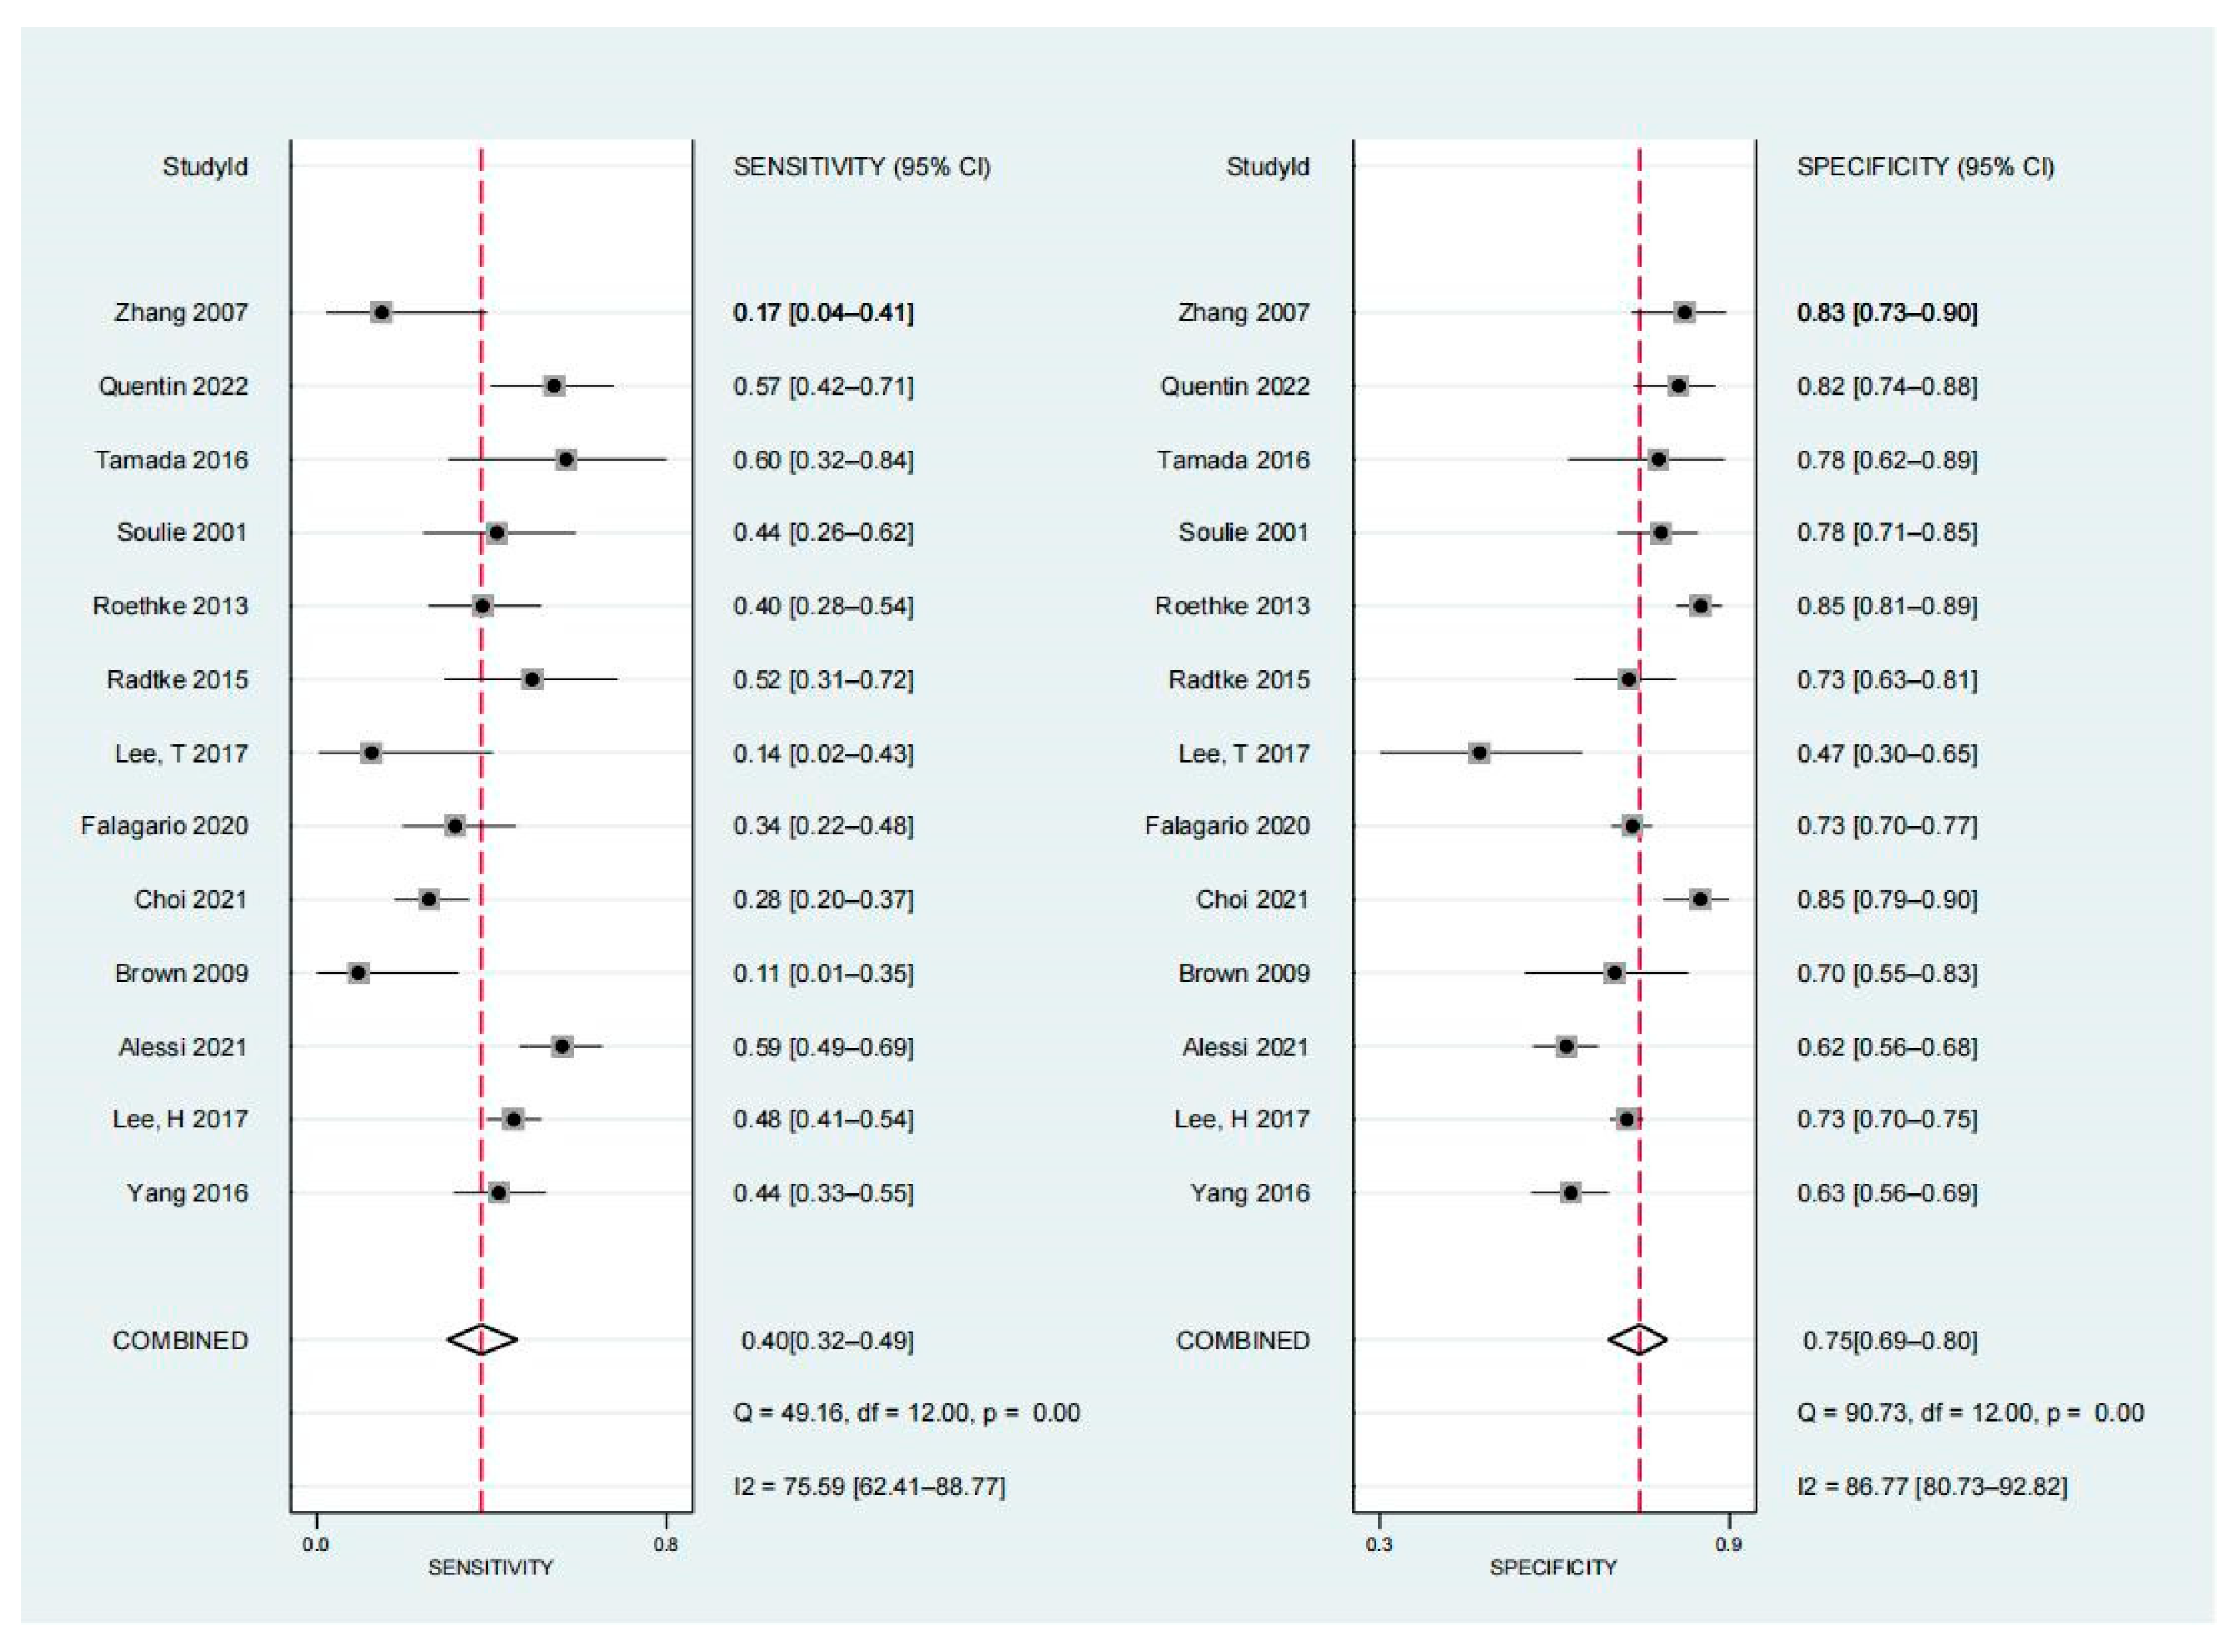
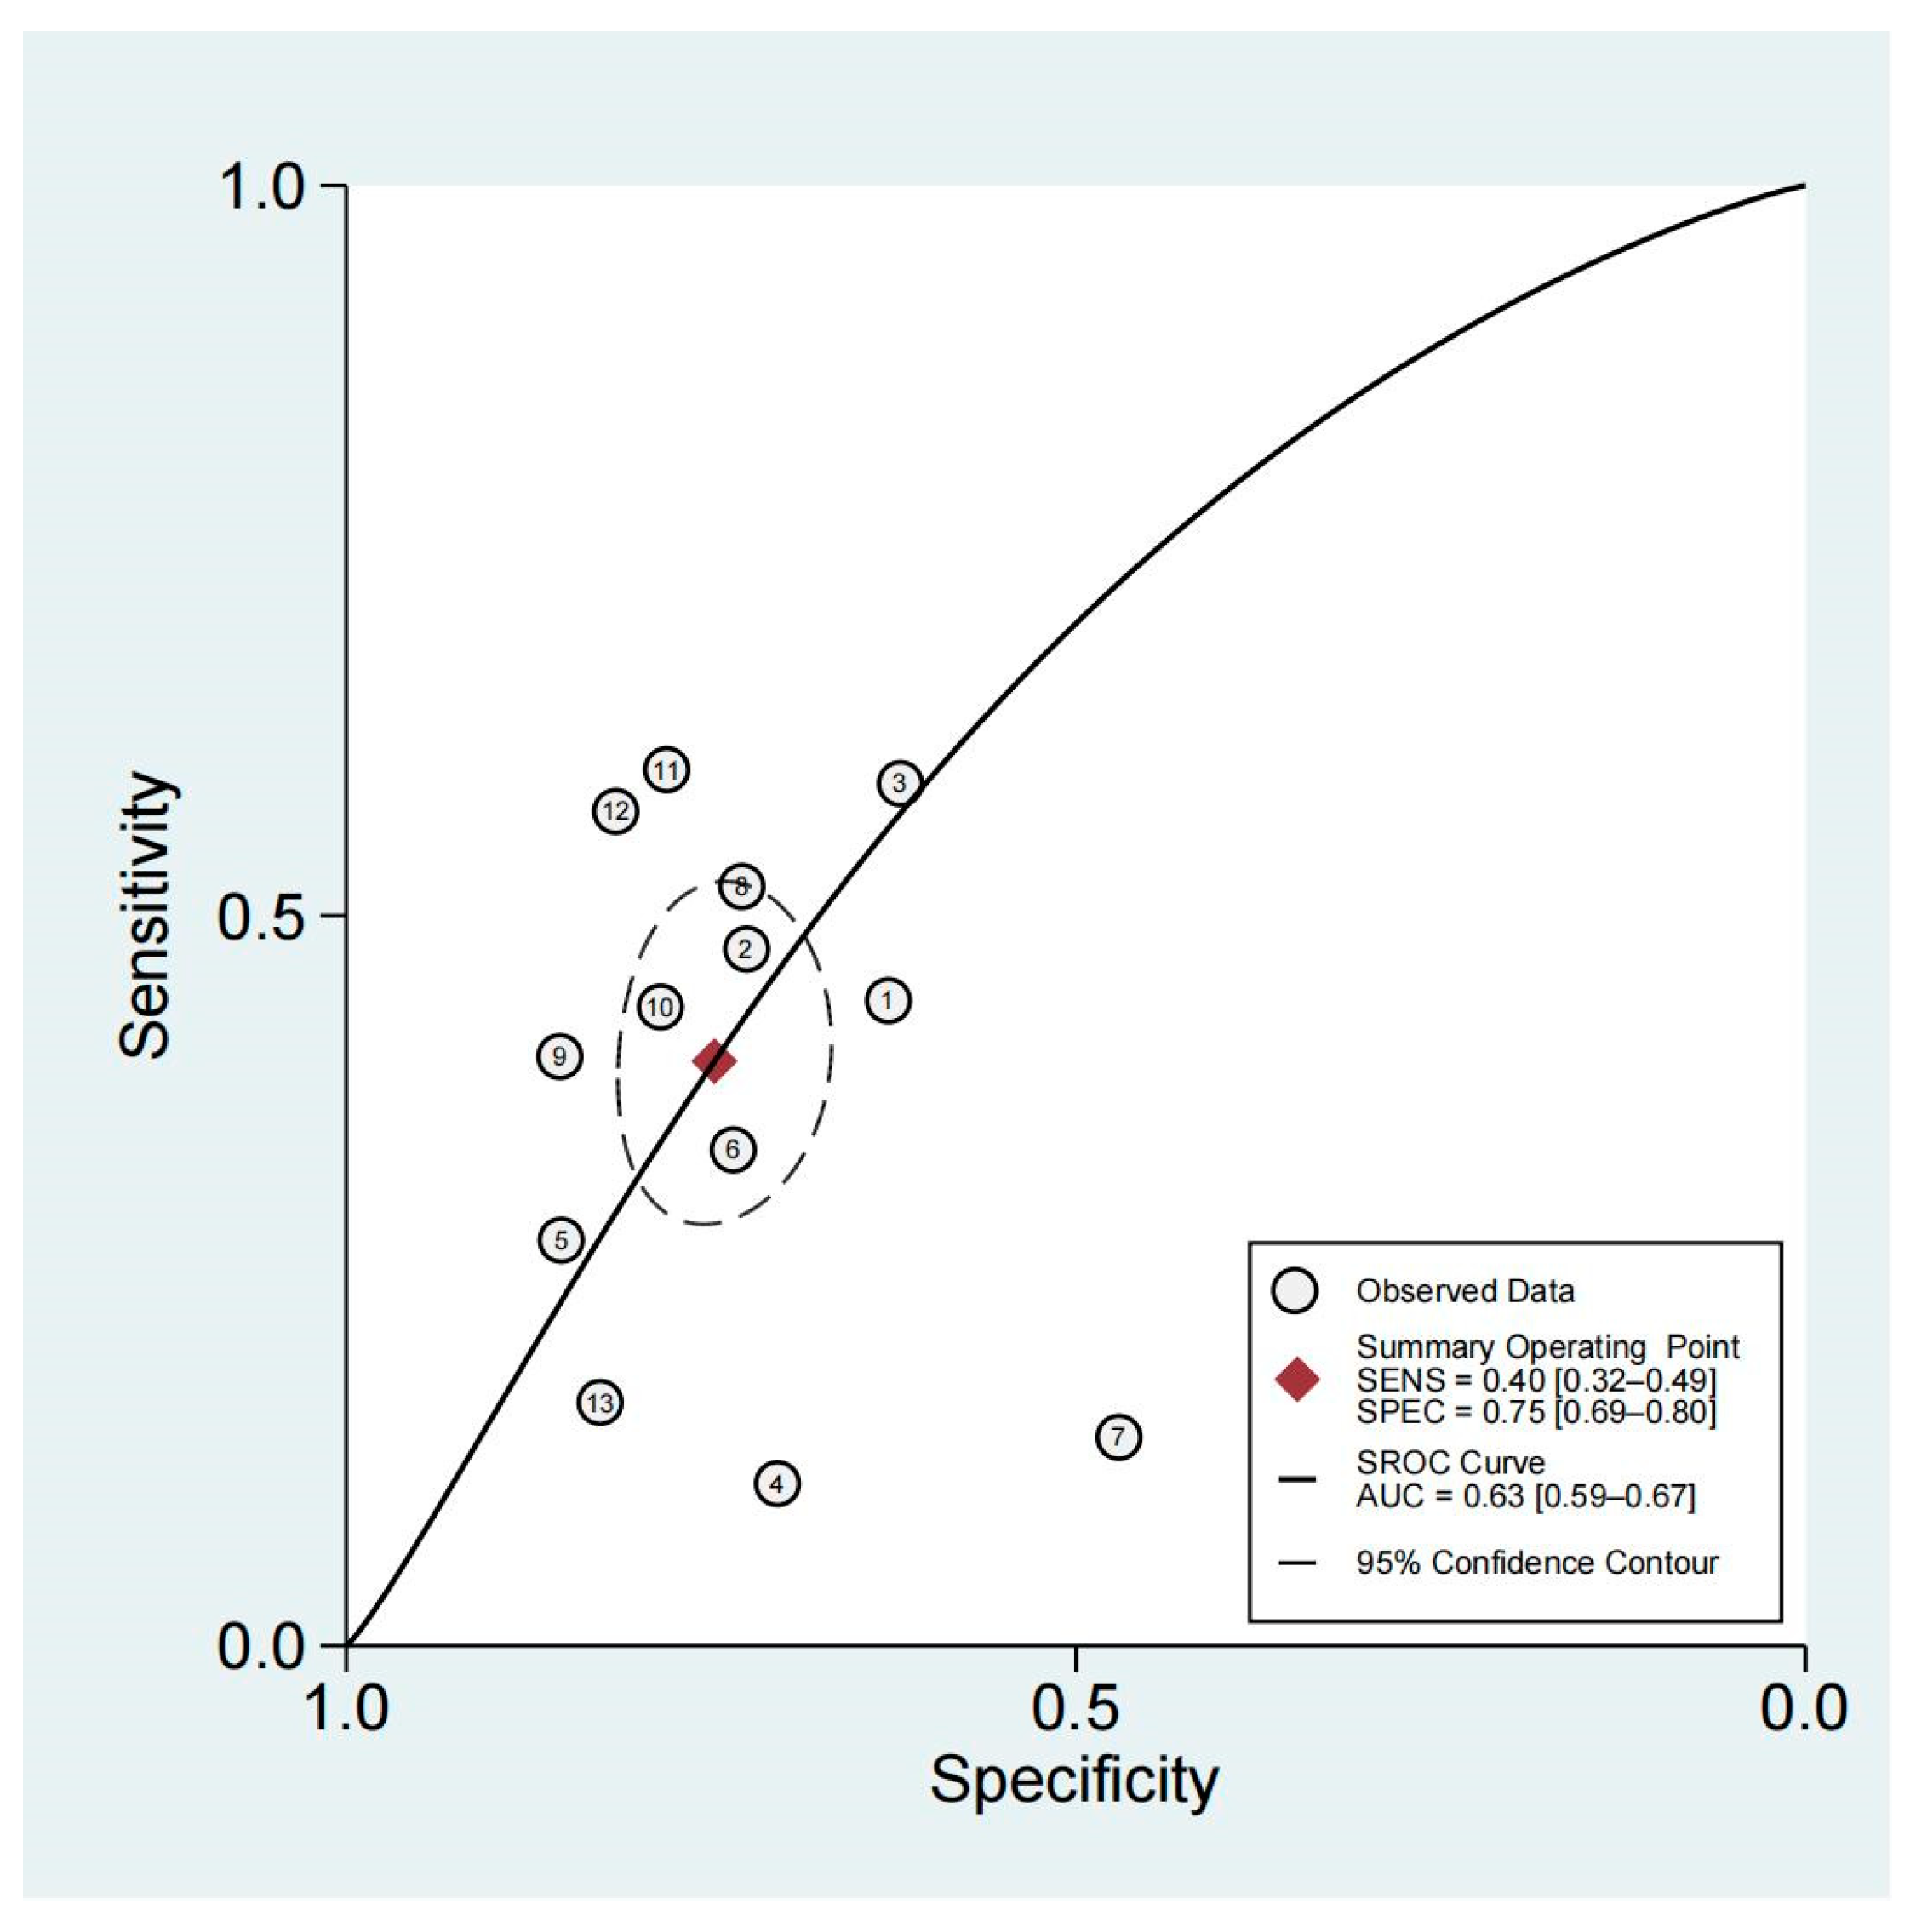
3.4. Diagnostic Performance of Non-Organ-Confined Disease on MRI for the Detection of PSMs

According to forest plots (Figure 3), the pooled sensitivity and specificity were 0.40 (95% CI, 0.32–0.49) and 0.75 (95% CI, 0.69–0.80), respectively. Figure 4 shows HSROC plots with an AUC of 0.63 (95% CI, 0.59–0.67). Heterogeneity was found, according to the Q test (p < 0.05). The Higgins I2 statistics revealed significant heterogeneity for specificity (I2 = 86.77%) and moderate heterogeneity for sensitivity (I2 = 75.59%).

3.5. Subgroup Analysis and Meta-Regression

Table 4 illustrates the results of the investigation of the causes of the pooled variability using subgroup analysis. In general, sensitivity was comparable (I2 = 75.59%), but specificity (I2 = 86.77%) showed significant variations.
Among all the investigated covariates, eight covariates (all but study design and area) were revealed as significant factors contributing to heterogeneity (p < 0.01).
For 12 retrospective studies, the pooled sensitivity and specificity were 0.40 (95% CI, 0.31–0.48) and 0.79 (95% CI, 0.63–0.95), respectively. In eight studies where the races of the participants were non-Asian, the sensitivity and specificity were 0.41 (95% CI, 0.30–0.52) and 0.74 (95% CI, 0.67–0.80), respectively. The pooled sensitivity and specificity were 0.48 (95% CI, 0.38–0.57) and 0.65 (95% CI, 0.58–0.73) when the prevalence of high biopsy Gleason scores was >50%. In nine studies that investigated laparoscopic procedures, the pooled sensitivity and specificity were 0.43 (95% CI, 0.33–0.52) and 0.72 (95% CI, 0.65–0.78), respectively. In six studies investigating robot-assisted procedures, the pooled sensitivity and specificity were 0.44 (95% CI, 0.33–0.56) and 0.72 (95% CI, 0.64–0.81). In seven studies using 3.0 T as the field strength, the pooled sensitivity and specificity were 0.42 (95% CI, 0.29–0.54) and 0.75 (95% CI, 0.68–0.82), respectively. In seven studies that used functional sequences, the pooled sensitivity and specificity were 0.47 (95% CI, 0.36–0.58) and 0.71 (95% CI, 0.65–0.77), respectively. Three studies used ERCs, and among these, the pooled sensitivity and specificity were 0.24 (95% CI, 0.10–0.39) and 0.81 (95% CI, 0.73–0.89), respectively.

3.6. Publication Bias Assessment

Figure 5 shows a p-value of 0.26 for the slope coefficient, indicating a low probability of publication bias.

4. Discussion

We performed a meta-analysis focusing on the diagnostic value of the high clinical T stage on MRI as a predictive indicator for PSMs. As far as we are aware, this is the first assessment of the diagnostic precision of preoperative MRI staging to predict PSMs. There were 13 articles included with a total of 3924 participants. Our meta-analysis demonstrated the T3 stage on MRI to have a moderate diagnostic performance for predicting pathologically positive margins with suboptimal sensitivity but relatively high specificity. The pooled sensitivity and specificity were 0.40 (95% CI, 0.32–0.49) and 0.75 (95% CI, 0.69–0.80), respectively, with an AUC of 0.63 (95% CI, 0.59–0.67). Overall, MRI had a relatively low diagnostic performance for the presence of PSMs on specimens after RP. To some extent, this reflects the resolution limitations of multiparametric MRI pulse sequences and our practice of conservative readings [29]. The T3 stage is a significant pathological characteristic of PCa, which raises the likelihood of PSMs and biochemical recurrence [30]. However, identifying the T3 stage from MRI is often considered to be subjective. The criteria depend on the reader’s expertise, especially the extracapsular extension score—which is mainly based on qualitative and subjective features—so relatively few reproducible imaging criteria are involved [12,31]. A weak interobserver agreement may also contribute to suboptimal diagnostic performance.
Notably, the T3 stage on preoperative MRI is not linearly related to the presence of histopathological PSMs. However, the T3 stage might be important because interpreting these findings for urologists may alter the anatomical plane and surgical approaches. Knowledge of the location and extent of a tumor on MRI may enable a surgeon to more precisely decide the treatment modality. When nerve sparing is the goal, rates of PSMs tend to be higher, so surgeons prefer to perform non-nerve-preserving techniques to achieve negative surgical margins when non-organ-localized diseases are observed on MRI [10,19,24]. Therefore, the benefit of MRI staging lies in the correct selection of patients for neurovascular bundle (NVB)-preserving surgery, rather than technically preventing PSMs [23]. When selecting the best patients for active surveillance or selecting RP candidates, high sensitivity is required to preserve NVBs. On the other hand, taking a conservative approach could result in PCa patients being unnecessarily excluded from NVB-sparing surgery; the relatively high specificity determined by our analysis may provide some auxiliary information for clinicians.
Our meta-analysis demonstrated that prospective experimental designs appear to be more sensitive and specific than retrospective designs. The use of high field strength (3.0 T) appears to be useful for sensitivity improvement. Unsurprisingly, high field strengths may theoretically reflect extracapsular tumors better than low field strengths due to the detection of subtle capsular irregularities or small extraprostatic tumors that demand a high spatial resolution for detection, and this is more available at higher magnetic strengths, despite the claim by May et al. (38) that using ERC can significantly increase the signal-to-noise ratio and may lead to improved discrimination of surgical margin status [26]. Some preliminary studies have shown that MRI with ERC MRI cannot accurately forecast PSM, it is only effective for a small subset of high-risk high-vascular tumors, for which radiological interpretations vary widely [32,33,34]. Similarly, our analysis indicated that ERCs do not appear to be beneficial for increased sensitivity or specificity compared with surface magnets. Among the studies included in our analysis, six of the seven that used field strengths of 3.0 T did not use ERCs. Notably, 3.0 T phased-array MRI has been shown to be equivalent to 1.5 T intrarectal MRI with no significant loss of image quality [35]. Meanwhile, long patient preparation means significant time-to-scan protocols [36]. These factors undermine the utility of ERCs, leading many centers to no longer routinely use ERCs for diagnostic protocols.
We analyzed the influence of MRI-specific functional sequences. When additional functional technology (including DWI and DCE) was used, sensitivity was significantly improved compared with when only T2WI was used (0.47 vs. 0.29). Possible causes might be that mpMRI provides additional details regarding gland anatomy and tumor location and allows for a thorough assessment of anatomical obstacles and unfavorable tumor features that raise the likelihood of PSM [37]. By using a combination of T2W-MRI with functional sequences, the delineation of the tumor and normal prostate boundaries can be improved [31].
Laparoscopic and robot-assisted minimally invasive techniques have grown incredibly popular during the past 10 years. With robot-assisted surgery, the use of high-resolution cameras with three-dimensional imaging and robotic arms, which enable surgeons to execute more precise dissection of anatomic structures, may improve the preservation of functional structures and reduce PSMs [38]. However, when minimally invasive techniques are used, there is a lack of tactile examination of the prostate to assess the degree of aggressiveness of the malignancy, and excision may result in PSMs and lead to an increased reliance on imaging to determine staging. In the absence of tactile feedback, MRI becomes an effective technique for assessing the degree of nerve retention [39]. In the present analysis, minimally invasive techniques were observed to cause significant differences in specificity and sensitivity, which implied positive margins in laparoscopic RP, or robot-assisted RP may differ from the negative prognostic significance of positive margins associated with open RP.
The prevalence of high-risk tumors is another important factor in the causation of heterogeneity. Studies with more high-Gleason tumors (>50%) had significantly higher sensitivity and specificity values compared with those without (<50%). This could be because high-grade PCa was associated with lower prostate volume and longer diameters of lesions on MRI [40,41]. PCa is detected earlier in patients with enlarged prostates because of the elevated levels of prostate-specific antigen produced by the enlarged tissue, and PCa diagnosed in small glands may be more aggressive and associated with more unfavorable histopathological findings. Patients with small prostates had a higher rate of PSMs [42]. More chaotic gland lumen typically occurs in tissues with higher Gleason scores [43]. This means that the higher the Gleason score, the more disrupted the glandular structure will be, resulting in a more disorganized glandular lumen, which can be reflected by ADC and DWI [44].
A recent meta-analysis [45] noted that significantly lower PSM rates were reported after 50–60 cases, reaching a plateau at 150–350 cases. Compared to low-volume centers (cases <150), high-volume centers (cases ≥150) appear to have improved diagnostic sensitivity and specificity. This may prove that high-volume compared to low-volume centers are generally associated with more favorable surgical outcomes.
Our analysis included some drawbacks. First, many studies did not provide enough details about all study characteristics, and we could not adequately account for the heterogeneity. For example, information on blind and image interpretation methods is often not available when interpreting index tests. Second, subjectivity is unavoidable to some extent when interpreting the T3 phase on MRI because it is observer-dependent. Features that are more objective, quantitative, and repeatable might be more appropriate.

5. Conclusions

Despite the poor sensitivity of the T stage on preoperative MRI for predicting pathological PSMs, its relatively high specificity may have additional value in helping to select candidates for active surveillance or function-preserving therapy by avoiding underestimating the disease. Despite the reliability of MRI in identifying cancer lesions and boundaries, determining the aggressiveness of prostate cancer and predicting the outcome of the surgery remains challenging. Therefore, efforts should focus on further refining the characteristics of PSMs to help identify patients who are most prone to disease development and progression. Further studies are warranted to investigate more objective and reproducible variables as potential indicators of surgical margin status.

Supplementary Materials

The following supporting information can be downloaded at https://www.mdpi.com/article/10.3390/diagnostics13152497/s1.

Author Contributions

Conceptualization, Y.W. (Yu Wang) and L.Y.; methodology, Y.W. (Ying Wu) and M.Z.; software, Y.W. (Yu Wang) and M.Z.; validation, Y.W. (Yu Wang) and M.T.; formal analysis, Y.W. (Yu Wang), Y.W. (Ying Wu), and L.L.; data curation, L.L. and M.T.; writing—original draft preparation, Y.W. (Yu Wang); writing—review and editing, Y.W. (Yu Wang) and M.Z.; visualization, Y.W. (Ying Wu); supervision, L.Y.; funding acquisition, L.Y. All authors have read and agreed to the published version of the manuscript.

Funding

This research was funded by the Key Research and Development Project of Sichuan Province Science and Technology Department (No.2023YFS0227) and the Research Project of Sichuan Provincial Cadre Health (No.2023-215).

Institutional Review Board Statement

Not applicable.

Informed Consent Statement

Not applicable.

Data Availability Statement

The original contributions presented in the study are included in the article/Supplementary Materials. Further inquiries can be directed to the corresponding author.

Conflicts of Interest

The authors declare no conflict of interest.

References

  1. Siegel, R.L.; Miller, K.D.; Fuchs, H.E.; Jemal, A. Cancer Statistics, 2021. CA Cancer J. Clin. 2021, 71, 7–33. [Google Scholar] [CrossRef] [PubMed]
  2. Tewari, A.; Sooriakumaran, P.; Bloch, D.A.; Seshadri-Kreaden, U.; Hebert, A.E.; Wiklund, P. Positive surgical margin and perioperative complication rates of primary surgical treatments for prostate cancer: A systematic review and meta-analysis comparing retropubic, laparoscopic, and robotic prostatectomy. Eur. Urol. 2012, 62, 1–15. [Google Scholar] [CrossRef] [PubMed]
  3. Tan, P.H.; Cheng, L.; Srigley, J.R.; Griffiths, D.; Humphrey, P.A.; van der Kwast, T.H.; Montironi, R.; Wheeler, T.M.; Delahunt, B.; Egevad, L.; et al. International Society of Urological Pathology (ISUP) Consensus Conference on Handling and Staging of Radical Prostatectomy Specimens. Working group 5: Surgical margins. Mod. Pathol. 2011, 24, 48–57. [Google Scholar] [CrossRef] [Green Version]
  4. Yang, R.; Cao, K.; Han, T.; Zhang, Y.-F.; Zhang, G.-T.; Xu, L.-F.; Lian, H.-B.; Li, X.-G.; Guo, H.-Q. Perineural invasion status, Gleason score and number of positive cores in biopsy pathology are predictors of positive surgical margin following laparoscopic radical prostatectomy. Asian J. Androl. 2017, 19, 468–472. [Google Scholar] [CrossRef]
  5. Yossepowitch, O.; Briganti, A.; Eastham, J.A.; Epstein, J.; Graefen, M.; Montironi, R.; Touijer, K. Positive surgical margins after radical prostatectomy: A systematic review and contemporary update. Eur. Urol. 2014, 65, 303–313. [Google Scholar] [CrossRef] [PubMed]
  6. Bolla, M.; van Poppel, H.; Tombal, B.; Vekemans, K.; Da Pozzo, L.; de Reijke, T.M.; Verbaeys, A.; Bosset, J.-F.; van Velthoven, R.; Colombel, M.; et al. Postoperative radiotherapy after radical prostatectomy for high-risk prostate cancer: Long-term results of a randomised controlled trial (EORTC trial 22911). Lancet 2012, 380, 2018–2027. [Google Scholar] [CrossRef]
  7. Vis, A.N.; Schröder, F.H.; van der Kwast, T.H. The actual value of the surgical margin status as a predictor of disease progression in men with early prostate cancer. Eur. Urol. 2006, 50, 258–265. [Google Scholar] [CrossRef]
  8. de Rooij, M.; Hamoen, E.H.; Witjes, J.A.; Barentsz, J.O.; Rovers, M.M. Accuracy of Magnetic Resonance Imaging for Local Staging of Prostate Cancer: A Diagnostic Meta-analysis. Eur. Urol. 2016, 70, 233–245. [Google Scholar] [CrossRef] [PubMed]
  9. Valentin, B.; Schimmöller, L.; Ullrich, T.; Klingebiel, M.; Demetrescu, D.; Sawicki, L.M.; Lakes, J.; Mally, D.; Quentin, M.; Esposito, I.; et al. Magnetic resonance imaging improves the prediction of tumor staging in localized prostate cancer. Abdom. Radiol. 2021, 46, 2751–2759. [Google Scholar] [CrossRef]
  10. Lee, H.; Kim, C.K.; Park, B.K.; Sung, H.H.; Han, D.H.; Jeon, H.G.; Jeong, B.C.; Seo, S.I.; Jeon, S.S.; Choi, H.Y.; et al. Accuracy of preoperative multiparametric magnetic resonance imaging for prediction of unfavorable pathology in patients with localized prostate cancer undergoing radical prostatectomy. World J. Urol. 2017, 35, 929–934. [Google Scholar] [CrossRef]
  11. Li, W.; Dong, A.; Hong, G.; Shang, W.; Shen, X. Diagnostic performance of ESUR scoring system for extraprostatic prostate cancer extension: A meta-analysis. Eur. J. Radiol. 2021, 143, 109896. [Google Scholar] [CrossRef] [PubMed]
  12. Alessi, S.; Maggioni, R.; Luzzago, S.; Colombo, A.; Pricolo, P.; Summers, P.E.; Saia, G.; Manzoni, M.; Renne, G.; Marvaso, G.; et al. Apparent Diffusion Coefficient and Other Preoperative Magnetic Resonance Imaging Features for the Prediction of Positive Surgical Margins in Prostate Cancer Patients Undergoing Radical Prostatectomy. Clin. Genitourin. Cancer 2021, 19, e335–e345. [Google Scholar] [CrossRef] [PubMed]
  13. Park, M.Y.; Park, K.J.; Kim, M.-H.; Kim, J.K. Preoperative MRI-based estimation of risk for positive resection margin after radical prostatectomy in patients with prostate cancer: Development and validation of a simple scoring system. Eur. Radiol. 2021, 31, 4898–4907. [Google Scholar] [CrossRef]
  14. Xu, B.; Luo, C.; Zhang, Q.; Jin, J. Preoperative characteristics of the P.R.O.S.T.A.T.E. scores: A novel predictive tool for the risk of positive surgical margin after radical prostatectomy. J. Cancer Res. Clin. Oncol. 2017, 143, 687–692. [Google Scholar] [CrossRef]
  15. Whiting, P.F.; Rutjes, A.W.S.; Westwood, M.E.; Mallett, S.; Deeks, J.J.; Reitsma, J.B.; Leeflang, M.M.G.; Sterne, J.A.C.; Bossuyt, P.M.M.; QUADAS-2 Group. QUADAS-2: A revised tool for the quality assessment of diagnostic accuracy studies. Ann. Intern. Med. 2011, 155, 529–536. [Google Scholar] [CrossRef]
  16. Reitsma, J.B.; Glas, A.S.; Rutjes, A.W.; Scholten, R.J.; Bossuyt, P.M.; Zwinderman, A.H. Bivariate analysis of sensitivity and specificity produces informative summary measures in diagnostic reviews. J. Clin. Epidemiol. 2005, 58, 982–990. [Google Scholar] [CrossRef] [PubMed]
  17. Rutter, C.M.; Gatsonis, C.A. A hierarchical regression approach to meta-analysis of diagnostic test accuracy evaluations. Stat. Med. 2001, 20, 2865–2884. [Google Scholar] [CrossRef]
  18. Deeks, J.J.; Macaskill, P.; Irwig, L. The performance of tests of publication bias and other sample size effects in systematic reviews of diagnostic test accuracy was assessed. J. Clin. Epidemiol. 2005, 58, 882–893. [Google Scholar] [CrossRef]
  19. Brown, J.A.; Rodin, D.M.; Harisinghani, M.; Dahl, D.M. Impact of preoperative endorectal MRI stage classification on neurovascular bundle sparing aggressiveness and the radical prostatectomy positive margin rate. Urol. Oncol. Semin. Orig. Investig. 2009, 27, 174–179. [Google Scholar] [CrossRef] [PubMed]
  20. Choi, S.Y.; Chi, B.H.; Kim, T.-H.; Lim, B.; Lee, W.; You, D.; Kim, C.-S. Does intraoperative frozen section really predict significant positive surgical margins after robot-assisted laparoscopic prostatectomy? A retrospective study. Asian J. Androl. 2021, 23, 74–79. [Google Scholar] [CrossRef]
  21. Falagario, U.G.; Jambor, I.; Ratnani, P.; Martini, A.; Treacy, P.-J.; Wajswol, E.; Lantz, A.; Papastefanou, G.; Weil, R.; Phillip, D.; et al. Performance of prostate multiparametric MRI for prediction of prostate cancer extra-prostatic extension according to NCCN risk categories: Implication for surgical planning. Minerva Urol. E Nefrol. Ital. J. Urol. Nephrol. 2020, 72, 746–754. [Google Scholar] [CrossRef]
  22. Lee, T.; Hoogenes, J.; Wright, I.; Matsumoto, E.D.; Shayegan, B. Utility of preoperative 3 Tesla pelvic phased-array multiparametric magnetic resonance imaging in prediction of extracapsular extension and seminal vesicle invasion of prostate cancer and its impact on surgical margin status: Experience at a Canadian academic tertiary care centre. Can. Urol. Assoc. J. J. L′association Urol. Can. 2017, 11, E174–E178. [Google Scholar] [CrossRef] [Green Version]
  23. Radtke, J.P.; Hadaschik, B.A.; Wolf, M.B.; Freitag, M.T.; Schwab, C.; Alt, C.; Roth, W.; Duensing, S.; Pahernik, S.A.; Roethke, M.C.; et al. The impact of magnetic resonance imaging on prediction of extraprostatic extension and prostatectomy outcome in patients with low-, intermediate- and high-risk prostate cancer: Try to find a standard. J. Endourol. 2015, 29, 1396–1405. [Google Scholar] [CrossRef]
  24. Roethke, M.C.; Lichy, M.P.; Kniess, M.; Werner, M.K.; Claussen, C.D.; Stenzl, A.; Schlemmer, H.-P.; Schilling, D. Accuracy of preoperative endorectal MRI in predicting extracapsular extension and influence on neurovascular bundle sparing in radical prostatectomy. World J. Urol. 2013, 31, 1111–1116. [Google Scholar] [CrossRef] [PubMed]
  25. Soulié, M.; Aziza, R.; Escourrou, G.; Seguin, P.; Tollon, C.; Molinier, L.; Bachaud, J.-M.; Joffre, F.; Plante, P. Assessment of the risk of positive surgical margins with pelvic phased-array magnetic resonance imaging in patients with clinically localized prostate cancer: A prospective study. Urology 2001, 58, 228–232. [Google Scholar] [CrossRef] [PubMed]
  26. Tamada, T.; Sone, T.; Kanomata, N.; Miyaji, Y.; Kido, A.; Jo, Y.; Yamamoto, A.; Ito, K. Value of preoperative 3T multiparametric MRI for surgical margin status in patients with prostate cancer. J. Magn. Reson. Imaging JMRI 2016, 44, 584–593. [Google Scholar] [CrossRef]
  27. Quentin, M.; Schimmöller, L.; Ullrich, T.; Valentin, B.; Demetrescu, D.; Al-Monajjed, R.; Mally, D.; Esposito, I.; Albers, P.; Antoch, G.; et al. Pre-operative magnetic resonance imaging can predict prostate cancer with risk for positive surgical margins. Abdom. Radiol. New York 2022, 47, 2486–2493. [Google Scholar] [CrossRef]
  28. Zhang, J.Q.; Loughlin, K.R.; Zou, K.H.; Haker, S.; Tempany, C.M.C. Role of Endorectal Coil Magnetic Resonance Imaging in Treatment of Patients with Prostate Cancer and in Determining Radical Prostatectomy Surgical Margin Status: Report of a Single Surgeon’s Practice. Urology 2007, 69, 1134–1137. [Google Scholar] [CrossRef]
  29. Petralia, G.; Musi, G.; Padhani, A.R.; Summers, P.; Renne, G.; Alessi, S.; Raimondi, S.; Matei, D.V.; Renne, S.L.; Jereczek-Fossa, B.A.; et al. Robot-assisted radical prostatectomy: Multiparametric MR imaging–directed intraoperative frozen-section analysis to reduce the rate of positive surgical margins. Radiology 2015, 274, 434–444. [Google Scholar] [CrossRef] [Green Version]
  30. Xiang, J.-Y.; Huang, X.-S.; Xu, J.-X.; Huang, R.-H.; Zheng, X.-Z.; Xue, L.-M.; Liu, Y.-L. MRI Extraprostatic Extension Grade: Accuracy and Clinical Incremental Value in the Assessment of Extraprostatic Cancer. BioMed Res. Int. 2022, 2022, 3203965. [Google Scholar] [CrossRef]
  31. Schieda, N.; Lim, C.S.; Idris, M.; Lim, R.S.; Morash, C.; Breau, R.H.; Flood, T.A.; McInnes, M.D.F. MRI assessment of pathological stage and surgical margins in anterior prostate cancer (APC) using subjective and quantitative analysis. J. Magn. Reson. Imaging 2017, 45, 1296–1303. [Google Scholar] [CrossRef]
  32. Bernstein, M.R.; Cangiano, T.; D′Amico, A.; Chittams, J.; Hardy, C.; Whittington, R.D.; Tomaszewski, J.E.; Schnall, M.D.; Wein, A.J.; Malkowicz, S.B. Endorectal coil magnetic resonance imaging and clinicopathologic findings in T1c adenocarcinoma of the prostate. Urol. Oncol. 2000, 5, 104–107. [Google Scholar] [CrossRef]
  33. Cornud, F.; Hamida, K.; Flam, T.; Hélénon, O.; Chrétien, Y.; Thiounn, N.; Correas, J.M.; Casanova, J.M.; Moreau, J.F. Endorectal color doppler sonography and endorectal MR imaging features of nonpalpable prostate cancer: Correlation with radical prostatectomy findings. AJR Am. J. Roentgenol. 2000, 175, 1161–1168. [Google Scholar] [CrossRef]
  34. May, F.; Treumann, T.; Dettmar, P.; Hartung, R.; Breul, J. Limited value of endorectal magnetic resonance imaging and transrectal ultrasonography in the staging of clinically localized prostate cancer. BJU Int. 2001, 87, 66–69. [Google Scholar] [CrossRef]
  35. Park, B.K.; Kim, B.; Kim, C.K.; Lee, H.M.; Kwon, G.Y. Comparison of phased-array 3.0-T and endorectal 1.5-T magnetic resonance imaging in the evaluation of local staging accuracy for prostate cancer. J. Comput. Assist. Tomogr. 2007, 31, 534–538. [Google Scholar] [CrossRef]
  36. Hegde, J.V.; Mulkern, R.V.; Panych, L.P.; Fennessy, F.M.; Fedorov, A.; Maier, S.E.; Tempany, C.M. Multiparametric MRI of prostate cancer: An update on state-of-the-art techniques and their performance in detecting and localizing prostate cancer. J. Magn. Reson. Imaging JMRI 2013, 37, 1035–1054. [Google Scholar] [CrossRef] [PubMed] [Green Version]
  37. McEvoy, S.H.; Raeside, M.C.; Chaim, J.; Ehdaie, B.; Akin, O. Preoperative Prostate MRI: A Road Map for Surgery. AJR Am. J. Roentgenol. 2018, 211, 383–391. [Google Scholar] [CrossRef] [PubMed]
  38. Cao, L.; Yang, Z.; Qi, L.; Chen, M. Robot-assisted and laparoscopic vs open radical prostatectomy in clinically localized prostate cancer: Perioperative, functional, and oncological outcomes: A Systematic review and meta-analysis. Medicine 2019, 98, e15770. [Google Scholar] [CrossRef] [PubMed]
  39. Park, B.H.; Jeon, H.G.; Jeong, B.C.; Seo, S.I.; Lee, H.M.; Choi, H.Y.; Jeon, S.S. Influence of magnetic resonance imaging in the decision to preserve or resect neurovascular bundles at robotic assisted laparoscopic radical prostatectomy. J. Urol. 2014, 192, 82–88. [Google Scholar] [CrossRef]
  40. Sogutdelen, E.; Citamak, B. Is Low-risk Prostate Cancer Really Low-risk? Consider Factors Affecting Biochemical Recurrence and Tumour Upgrade. J. Coll. Physicians Surg. Pak. JCPSP 2023, 33, 193–198. [Google Scholar] [CrossRef]
  41. Freedland, S.J.; Isaacs, W.B.; Platz, E.A.; Terris, M.K.; Aronson, W.J.; Amling, C.L.; Presti, J.C., Jr.; Kane, C.J. Prostate size and risk of high-grade, advanced prostate cancer and biochemical progression after radical prostatectomy: A search database study. J. Clin. Oncol. 2005, 23, 7546–7554. [Google Scholar] [CrossRef] [PubMed]
  42. Çaliskan, S.; Kaba, S.L.; Koca, O.; Öztürk, M.I. Does Small Prostate Predict High Grade Prostate Cancer? J. Coll. Physicians Surg. Pak. JCPSP 2017, 27, 97–100. [Google Scholar] [PubMed]
  43. Epstein, J.I. Update on the Gleason grading system. Ann. Pathol. 2011, 31, S20–S26. [Google Scholar] [CrossRef] [PubMed]
  44. Langer, D.L.; van der Kwast, T.H.; Evans, A.J.; Plotkin, A.; Trachtenberg, J.; Wilson, B.C.; Haider, M.A. Prostate tissue composition and MR measurements: Investigating the relationships between ADC, T2, Ktrans, ve, and corresponding histologic features. Radiology 2010, 255, 485–494. [Google Scholar] [CrossRef] [PubMed]
  45. Grivas, N.; Zachos, I.; Georgiadis, G.; Karavitakis, M.; Tzortzis, V.; Mamoulakis, C. Learning curves in laparoscopic and robot-assisted prostate surgery: A systematic search and review. World J. Urol. 2022, 40, 929–949. [Google Scholar] [CrossRef] [PubMed]
Figure 1. Flow diagram describing the study selection process for the meta-analysis.
Diagnostics 13 02497 g001
Figure 2. Study bias assessment.
Diagnostics 13 02497 g002
Figure 3. Coupled forest plots summary of sensitivity and specificity [4,10,12,19,20,21,22,23,24,25,26,27,28]. Numbers are pooled estimates with 95% CI in parentheses. Corresponding heterogeneity statistics are provided at bottom right corners. Horizontal lines indicate 95% CIs. CIs, confidence intervals.
Diagnostics 13 02497 g003
Figure 4. HSROC curve of the diagnostic performance of MRI for PSM prediction in prostate cancer patients.
Diagnostics 13 02497 g004
Figure 5. Deeks’ funnel plot. The likelihood of publication bias was low with a p-value of 0.26 for the slope coefficient.
Diagnostics 13 02497 g005
Table 1. Demographic characteristics of the included studies.
AuthorYearCountryNAge (Years), Median (Range)PSA (ng/mL), Median (Range)No. of Biopsies with Gleason Score ≥7Proportion and Mode of BiopsiesDRE (+)
Soulie [25]2001France17664.2 *
(49–74)
10.9 *
(1.2–39)
NA97.2%, TRUSNA
Zhang [28]2007China11062.2 * (NA)8.1 * (NA)NAAll, NANA
Alessi [12]2021Italy40065 (NA)6.3 (NA)220All, NANA
Lee, H. [10]2017South Korea114565 (NA)6.1 (NA)594All, NANA
Radtke [23]2015Germany13266 (NA)8.2 (NA)NAAll, MRI/TRUS-fusion28
Yang [4]2016China29670 (51–80)12.6
(2.9–180)
196ALL, TRUSNA
Lee, T. [22]2017Canada4860.9 * (NA)9.7 * (NA)36ALL, TRUSNA
Falagario [21]2020Italy66463 (NA)6 (NA)NAAll, NANA
Tamada [26]2016Japan5669 (54–84)7.26
(4.09–24.5)
49All, NA15
Roethke [24]2013Germany38562.7 *
(42–77)
8.9 *
(0.4–52.5)
NAAll, NANA
Brown [19]2009United States6258 * (42–73)9.3 *
(0.5–30.5)
NAAll, NANA
Quentin [27]2022Germany179NANANAAll, NANA
Choi [20]2021South Korea27164.9 * (NA)7.9 * (NA)78All, NANA
* = mean. Abbreviations: PSA = prostate-specific antigen; NA = not available; TRUS: transrectal ultrasonography; DRE (+): digital rectal examination positive.
Table 2. Study characteristics of the included studies.
First AuthorStudy DesignPatient EnrollmentIndexNeuroSAFE TechniqueRadical Prostatectomy TechniqueInterval between Biopsy and MRINo. of SurgeonsReference
Soulie [25]ProspectiveConsecutiveT3NARRP2 to 9 w2RP
Zhang [28]RetrospectiveConsecutiveT3NANA3 to 10 w1RP
Alessi [12]RetrospectiveConsecutiveECE score ≥4yesRARPNAMultipleRP
Lee, H. [10]RetrospectiveConsecutiveT3NARARP, LRP, ORPNANARP
Radtke [23]RetrospectiveConsecutiveECE score ≥4NARARP, RRPNA4RP
Yang [4]RetrospectiveConsecutiveEPENALRPNA1RP
Lee, T. [22]RetrospectiveConsecutiveECENALRP, RARP, ORPAt least 6 w1RP
Falagario [21]RetrospectiveConsecutiveEPEYesNA4 wMultipleRP
Tamada [26]RetrospectiveConsecutiveECENALRP, RRPNANARP
Roethke [24]RetrospectiveConsecutiveECEYesRRPAt least 6 w1RP
Brown [19]RetrospectiveConsecutiveT3NALRP, ORPAt least 8–10 w2RP
Quentin [27]RetrospectiveConsecutiveEPENARARPNA4RP
Choi [20]RetrospectiveConsecutiveECEYesRALPNA1RP
Abbreviations: RP = radical prostatectomy; RRP = retropubic radical prostatectomy; LRP = laparoscopic radical prostatectomy; RARP = robot-assisted radical prostatectomy; ORP = open retropubic radical prostatectomy; NA = not available; EPE = extraprostatic extension; ECE = extracapsular extension.
Table 3. Magnetic resonance imaging characteristics of the included studies.
AuthorField Strength (T)BlindedNo. of RadiologistExperience of Radiologist (Years/Numbers)Endorectal coilMR TechniquesVendor
Soulie [25]1.0YesSingleNANoT1, T2Siemens
Zhang [28]1.5YesSingleNAYesT1, T2GE
Alessi [12]1.5NAThree10 y, 8 y, 6 y/>500NoT2, DWI, DCESiemens
Lee, H. [10]1.5–3.0YesTwoNANoT2, DWI, ADCPhilips
Radtke [23]3.0YesMultiple7 y, >10 yNoT2, DWI, DCESiemens
Yang [4]NANANANANANANA
Lee, T. [22]3.0YesSingle>10 yNoT2, DWI, DCEPhilips
Falagario [21]3.0NASingleNANoT2, DWI, DCESiemens
Tamada [26]3.0YesTwo7 y, 16 yNoT1, T2, DWI, DCEToshiba
Roethke [24]1.5YesTwo4–14 y/300–1000YesT2Siemens
Brown [19]1.5NoMultiple1–20 yYesT1, T2GE
Quentin [27]3.0YesTwo>10 yNoT1, T2, ADC, DCESiemens
Choi [20]3.0NANANANANANA
DWI = diffusion-weighted (magnetic resonance) imaging; DCE = dynamic contrast-enhanced (magnetic resonance imaging); ADC = apparent diffusion coefficient; NA = not available.
Table 4. Meta-regression analyses stratified by multiple variables.
VariableNo. of StudiesCategorySensitivitySpecificityLRT Chi-SquareP (Joint Model)
Pooled Value (95% CI)pPooled Value (95% CI)p
Study design1Prospective0.44 (0.14–0.74)0.70.79 (0.63–0.95)0.420.030.86
12Retrospective0.40 (0.31–0.48)0.74 (0.69–0.80)
Area8Non-Asian0.41 (0.30–0.52)0.340.74 (0.67–0.80)<0.010.400.82
5Asian0.39 (0.26–0.51)0.77 (0.69–0.84)
Prevalence of biopsy Gleason score (≥7)5>50%0.48 (0.38–0.57)0.020.65 (0.58–0.73)<0.001106.04<0.01
1<50%0.28 (0.13–0.42)0.85 (0.76–0.94)
Robotic-assisted6Yes0.44 (0.33–0.56)0.360.72 (0.64–0.81)0.0129.21<0.01
5No0.40 (0.27–0.53)0.76 (0.68–0.85)
Laparoscopic9Yes0.43 (0.33–0.52)0.670.72 (0.65–0.78)<0.00131.24<0.01
2No0.42 (0.22–0.62)0.82 (0.74–0.91)
Field strength73.0 T0.42 (0.29–0.54)0.280.75 (0.68–0.82)<0.0117.07<0.01
51.5 T or 1 T0.36 (0.22–0.50)0.77 (0.69–0.85)
Functional technology7Yes0.47 (0.36–0.58)0.040.71 (0.65–0.77)<0.00142.2<0.01
4No0.29 (0.15–0.43)0.80 (0.74–0.87)
Endorectal coil3Yes0.24 (0.10–0.39)0.380.81 (0.73–0.89)0.0843.09<0.01
8No0.47 (0.37–0.57)0.72 (0.66–0.78)
No. of radiologists7Multiple0.48 (0.39–0.57)0.020.75 (0.69–0.82)0.0237.3<0.01
4Single0.30 (0.18–0.42)0.73 (0.64–0.82)
No. of cases8≥1500.44 (0.35–0.53)0.040.76 (0.70–0.82)0.033.360.19
5<500.31 (0.18–0.44)0.72 (0.63–0.82)
CI = confidence interval, LRT = likelihood ratio test.
Disclaimer/Publisher’s Note: The statements, opinions and data contained in all publications are solely those of the individual author(s) and contributor(s) and not of MDPI and/or the editor(s). MDPI and/or the editor(s) disclaim responsibility for any injury to people or property resulting from any ideas, methods, instructions or products referred to in the content.

