Abstract
Background: Currently, assessing the diagnostic performance of new laboratory tests assumes a perfect reference standard, which is rarely the case. Wrong classifications of the true disease status will inevitably lead to biased estimates of sensitivity and specificity. Objectives: Using Bayesian’ latent class models (BLCMs), an approach that does not assume a perfect reference standard, we re-analyzed data of a large prospective observational study assessing the diagnostic accuracy of an antigen test for the diagnosis of SARS-CoV-2 infection in clinical practice. Methods: A cohort of consecutive patients presenting to a COVID-19 testing facility affiliated with a Swiss University Hospital were recruited (n = 1465). Two real-time PCR tests were conducted in parallel with the Roche/SD Biosensor rapid antigen test on nasopharyngeal swabs. A two-test (PCR and antigen test), three-population BLCM was fitted to the frequencies of paired test results. Results: Based on the BLCM, the sensitivities of the RT-PCR and the Roche/SD Biosensor rapid antigen test were 98.5% [95% CRI 94.8;100] and 82.7% [95% CRI 66.8;100]. The specificities were 97.7% [96.1;99.7] and 99.9% [95% CRI 99.6;100]. Conclusions: Applying the BLCM, the diagnostic accuracy of RT-PCR was high but not perfect. In contrast to previous results, the sensitivity of the antigen test was higher. Our results suggest that BLCMs are valuable tools for investigating the diagnostic performance of laboratory tests in the absence of perfect reference standard.
1. Introduction
During the COVID-19 pandemic, numerous diagnostic tests for the detection of SARS-CoV-2 in patient samples have been developed. RT-PCR assays were among the first diagnostic tests to be developed [1,2]. Soon, it became evident that false-negative results could occur [3]. Rapid antigen tests were developed to improve the limited laboratory capacities, accessibility, and affordability. The diagnostic accuracy of these newly developed rapid antigen tests has been evaluated numerous times by considering RT-PCR as the gold standard. If the RT-PCR is not 100% sensitive (not classifying all truly infected patients as such) or not 100% specific (not classifying all truly negative patients as such), then evaluating a rapid antigen test by comparing its test results with RT-PCR results inevitably leads to a biased evaluation of the new test [4]. Different RT-PCR sensitivities were also found for in- and outpatients [5]. The classical understanding of diagnostic sensitivities and specificities as “intrinsic” test characteristics has become obsolete as sensitivities and specificities are assumed to vary with external factors [6].
Since the pioneering work from [7]—after whom is named the Hui-Walter paradigm—on estimating diagnostic test accuracies in the absence of a (perfect) gold standard, further developments took place, including Bayesian latent class models (BLCMs) [8] and user-friendly software for MCMC (Markov Chain Monte Carlo) simulation [9]. Specific STARD reporting guidelines for BLCMs have been developed [10]. Although, from a public health perspective, it would be highly relevant to have robust estimates of diagnostic test accuracies in a given population, very few attempts to use BLCMs to assess the diagnostic performance of COVID-19 tests exist, i.e., [11,12,13,14].
This study aimed to re-analyze data from a prospective cohort study evaluating a rapid antigen test in a real-life clinical setting, thus exploring the utility of BLCMs in such a setting [15].
2. Materials and Methods
2.1. Study Design, Patients, and Population
Using a Bayesian latent class approach, we re-analyzed the data [15] of a recent prospective cohort study. This dataset consists of dichotomized test results from two diagnostic tests of 1462 consecutive patients enrolled in a prospective cross-sectional study conducted from January to March 2021. The following inclusion criteria were applied: (1) suspicion of SARS-CoV-2 infection, (2) age 18 years or older, and (3) signed informed consent. The flow of the patients is given in Figure 1. The COVID-19 testing facility, affiliated with Inselspital University Hospital, and a specialized hospital employing high-throughput RT-PCR [16], was one of Switzerland’s largest facilities [17]. Following the instructions of the authorities, patients appeared for three different reasons: (a) symptoms consistent with SARS-CoV-2 infection, (b) contact with infected patients, and (c) other reasons such as travel certificates or intended shortening of quarantine. From the 1465 patients presenting to the testing facility three patients had to be excluded from this analysis as they had insufficient material to perform the antigen test. The local ethics committee reviewed and approved the protocol (Bern Cantonal Ethics Committee #2020-02729). All individuals have signed an informed consent form, and the study was conducted in accordance with the Declaration of Helsinki.
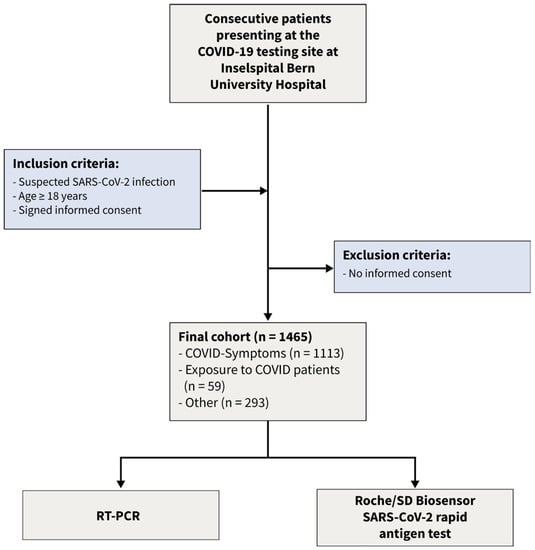
Figure 1.
Flow of the patients.
2.2. Study Processes and Determination of Laboratory Test
Before the consultation, the individuals were informed by trained medical staff. Patients completed a questionnaire that was prepared in accordance with the official requirements in Switzerland. A specially trained physician checked the questionnaire’s answers and followed up in case of doubt. A specially trained nurse performed the nasopharyngeal swabs according to a protocol that follows official guidelines. Liofilchem Viral Transport Medium (Roseto degli Abruzzi, Italy) and iClean Specimen Collection Flocked Swabs (Cleanmo Technology Co., Shenzhen, China) were used. The sample material was at 4 °C and performed within 6 h (antigen test) or 12 h (RT-PCR). The coded clinical data and laboratory test results were kept in different databases and merged only after analysis. All details have been described in detail previously [15].
Both the Roche/SD Biosensor SARS-CoV-2 antigen test (Roche Diagnostics, Mannheim, Germany) and RT-PCR were performed from the same sample material by a trained medical laboratory technician. The manufacturer’s specifications were strictly followed, and internal quality controls were performed daily (package leaflet). Details have been given elsewhere [15]. Two real-time PCRs were performed (Roche cobas® SARS-CoV-2; Seegene Allplex 2019-nCoV), following the manufacturers’ instructions, on a STARlet IVD System or a cobas 8800 system, as has been previously described [16,18]. RT-PCR was performed as part of the daily routine without the laboratory technicians knowing the antigen test result. Commercial internal quality controls were carried out with each run. A cycle threshold of 40 was considered positive. The frequencies of the dichotomized test results of the antigen test and the PCR are displayed in Table 1.

Table 1.
Frequencies of the respective dichotomized test results (Roche/SD Biosensor antigen test, RT-PCR) cross-classified in patients with symptoms with exposition to COVID-19 cases and patients being tested for other reasons. − negative test results; + positive test results.
2.3. Bayesian Latent Class Modeling
In the absence of a gold standard test, a Bayesian latent class model (BLCM) was fitted to the data to obtain estimates of sensitivity and specificity for each of the tests and prevalence in the population.
For the BLCM, we followed the classical Hui Walter approach [7] with two diagnostic tests and three populations (symptoms, exposure, and other). With dichotomized test results from two tests in three populations, the independence model without any conditional dependency is fully identifiable because there are nine degrees of freedom (i.e., three from each population) and seven parameters to be estimated: sensitivities and specificities of both tests and prevalences of each population. The four possible combinations dichotomized test results (−−,+−, −+, ++) in the three populations (i) are assumed to follow an independent multinomial distribution:
with the following four multinomial cell probabilities:
Here, pr is the prevalence and i indicates one of the three populations. Se and Sp are the sensitivities and specificities of the two tests, and cse12 and csp12 are the conditional dependencies between either the two sensitivities or the two specificities.
We used a Bayesian estimation framework with beta distributions Be(a,b) for the parameters of interest, i.e., sensitivities, specificities, and prevalences. We chose an informative prior for the specificity of the PCR, assuming that we are 95% sure that this specificity is higher than 90%, with a mode at 99%. Using betabuster, this assumption leads to dbeta(34.166327738, 1.335013089). For the other parameters of interest, we chose minimally informative priors dbeta(1,1). To assess the potential effect of these priors on the posterior estimates, we performed a sensitivity analysis with different combinations of alternative priors, mainly weakly informative priors with dbeta(2,1), but also informative priors designating a high sensitivity of PCR and a low prevalence in those which had no symptoms or contact with an infected person (population other) (Table 2).
Table 2.
Sensitivity analysis with different combinations of alternative priors.
We used Markov Chain Monte Carlo simulations with Gibbs sampling with JAGS version 4.3.0 (Plummer, 2003). The package runjags [19] was used to access JAGS and to prepare the model code. The model and the data are available in the Supplementary Materials (S1.model.code.data.bug).
3. Results
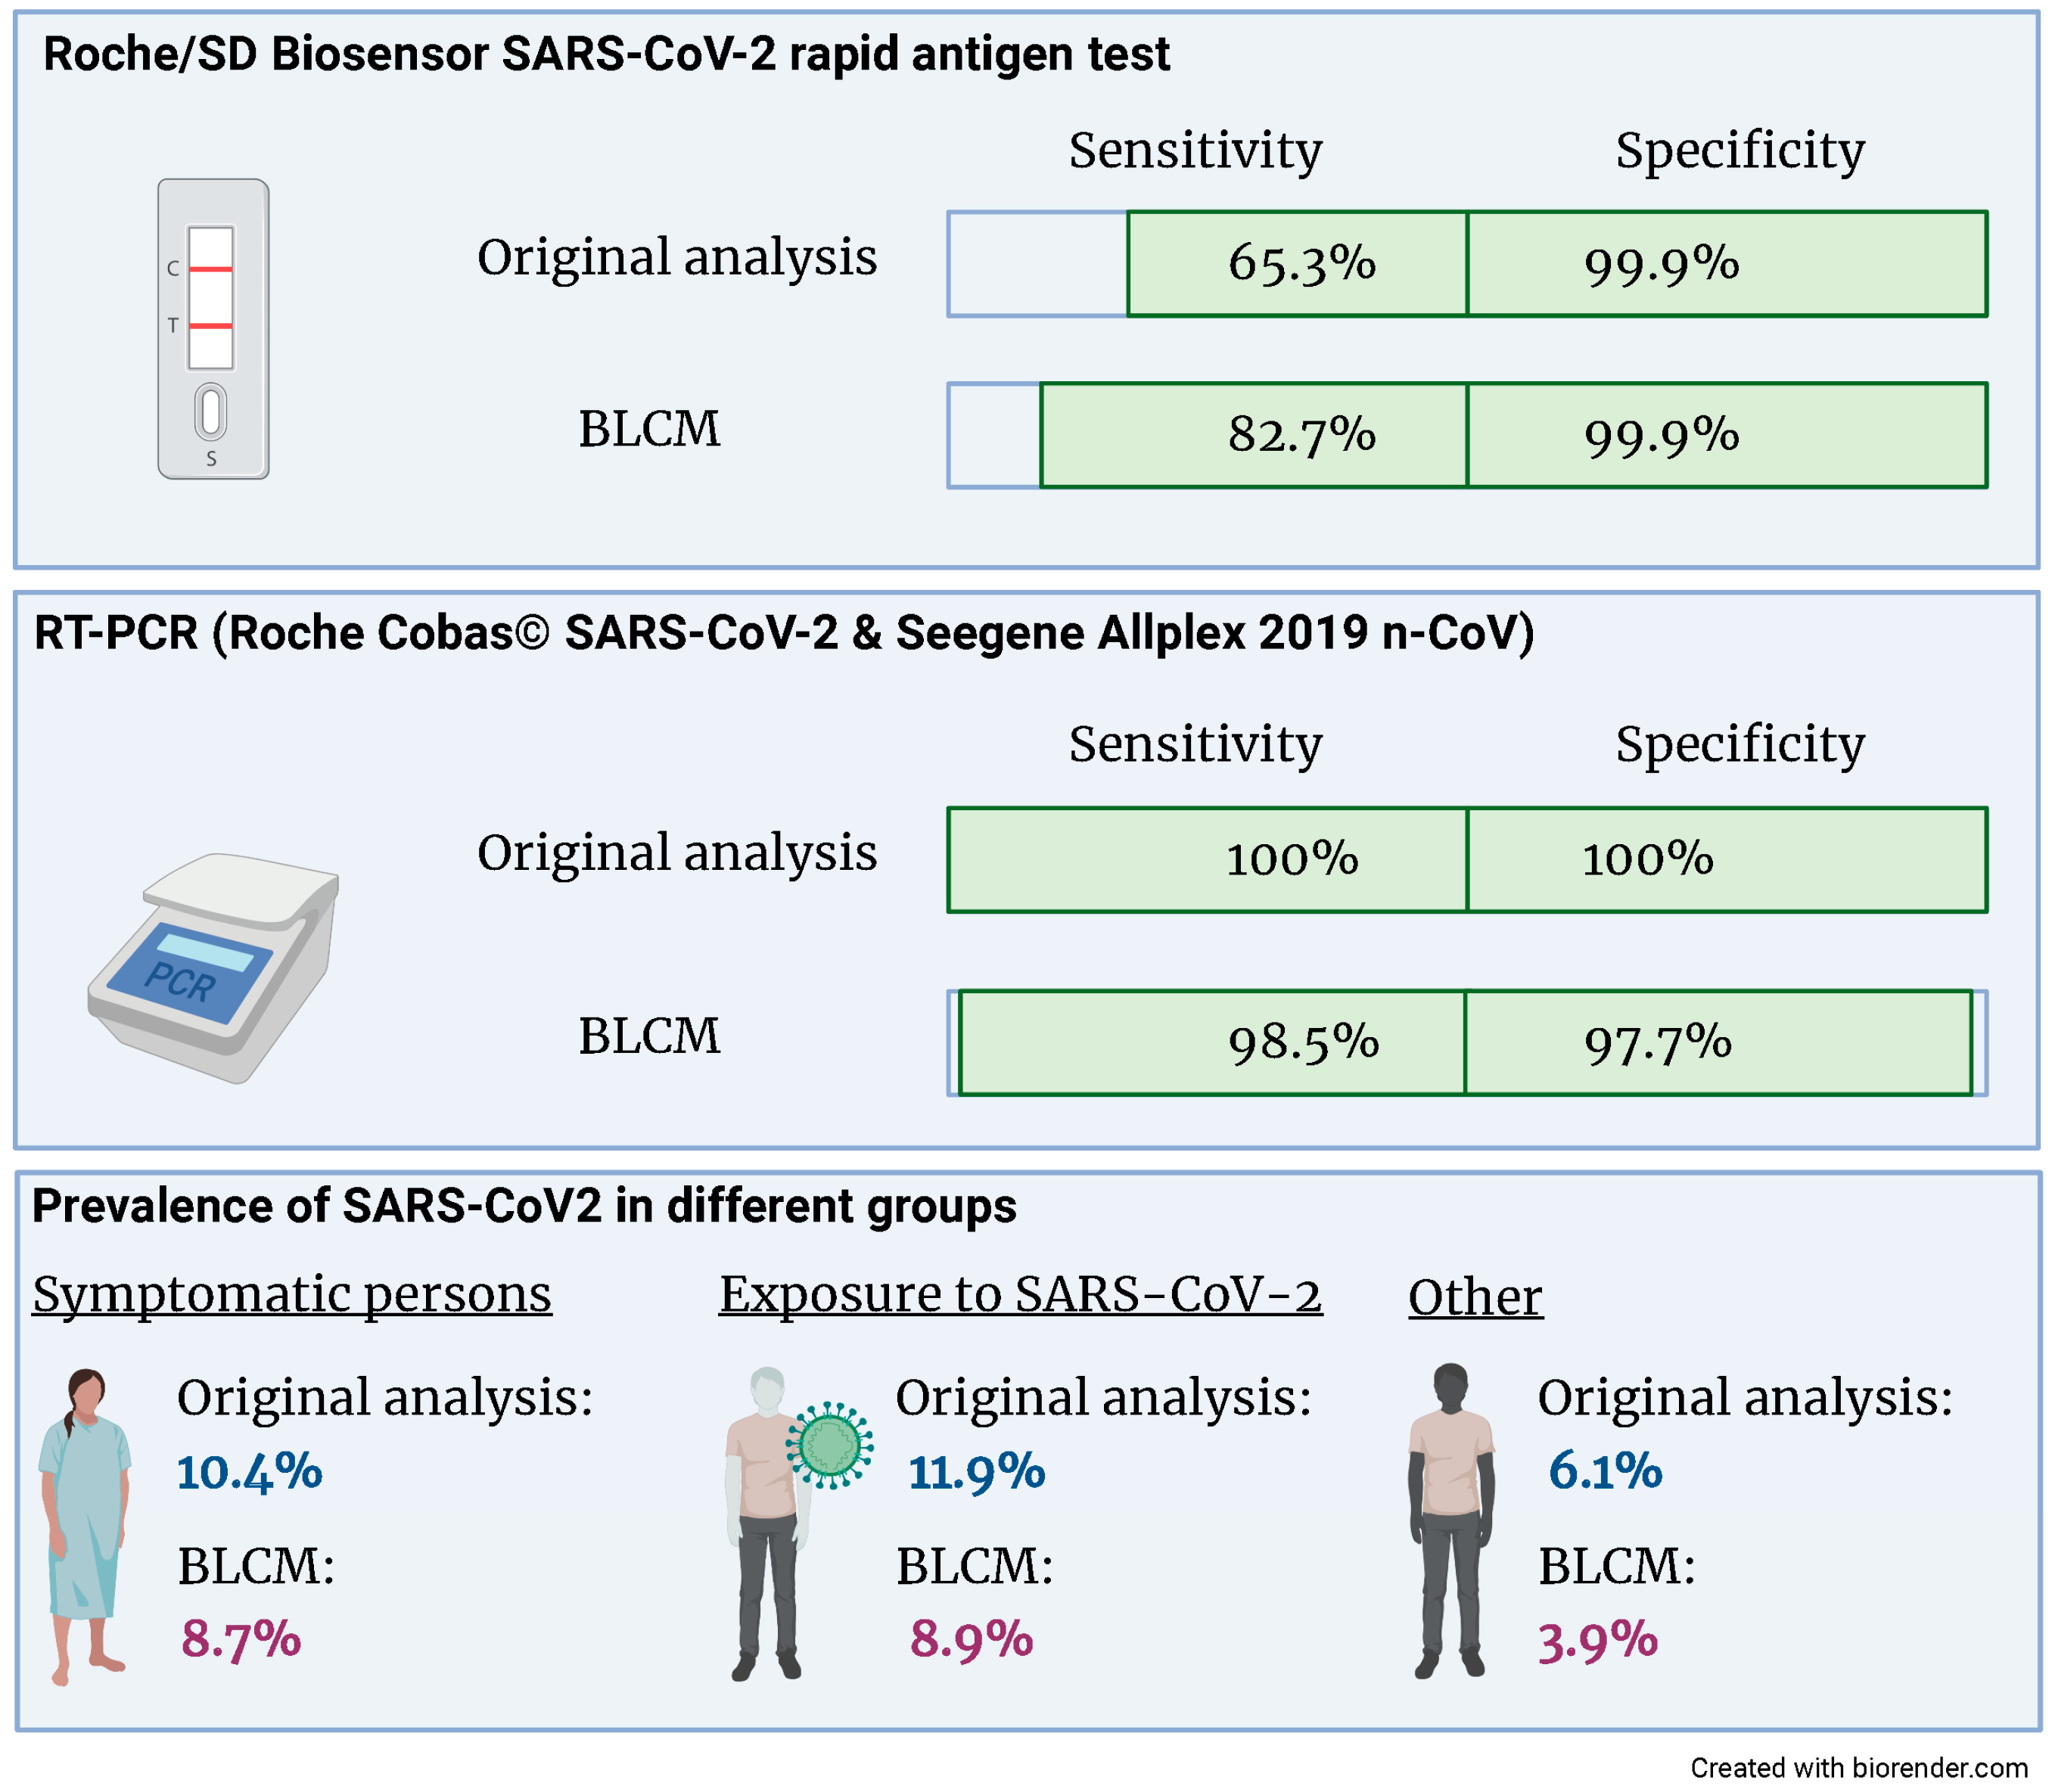
The latent class model converged based on the visual inspection of the trace plots and the Gelman–Rubin statistic. The estimates for the sensitivities and specificities of both tests and the three prevalences are given in Figure 2 and Table 3. Both the sensitivity and specificity of the RT-PCR assay are close to 100%. There was no evidence for a conditional dependency between sensitivities nor specificities, as evidenced by 95% credibility intervals, which included 0. Whilst the specificity of the rapid antigen test is close to 100%, the sensitivity is considerably lower and—compared to the other parameters of interest—the 95% credibility intervals are wider.
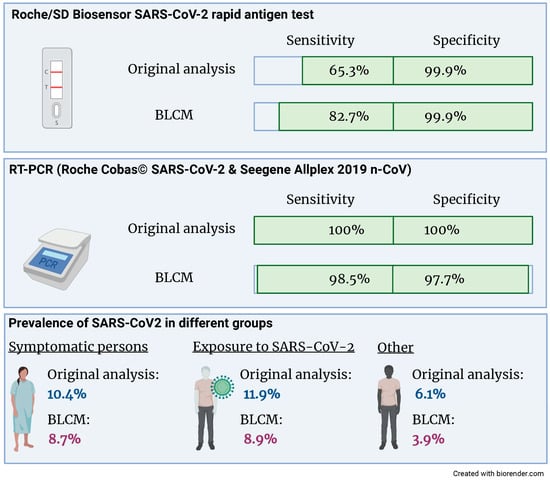
Figure 2.
Compared to the original analysis, the sensitivity of the Roche/SD Biosensor SARS-CoV-2 rapid antigen test increased from 65.3% to 82.7% when accounting for an imperfect gold standard. Also, the prevalence of SARS-CoV2 was reduced in all three groups.
Table 3.
Posterior medians and 95% credibility intervals for the diagnostic sensitivities (Se) and specificities (Sp) for the Roche/SD Biosensor rapid antigen test and the RT-PCR and the three prevalences for patients with symptoms, patients being exposed to COVID-19 cases, and patients being tested for other reasons.
When performing a sensitivity analysis by changing the prior information, the only posterior estimate that changed substantially with nearly 3% (absolute values) was the sensitivity of the rapid antigen test. As expected, the prevalence in patients with symptoms or exposure to COVID-19 cases was higher than in patients who came for other testing reasons.
4. Discussion
We used data from a large prospective cohort study analyzing the accuracy of a rapid antigen SARS-CoV-2 antigen test in clinical practice to apply a BLCM [15]. The resulting sensitivity of the rapid antigen test was considerably higher (82.7; 95% CRI 66.8; 100%) compared to the original analysis (65.3; 95% CRI 56.8; 73.1%). This finding might be explained by the diagnostic accuracies of the reference standard RT-PCR being close, but not equal, to 100%. In contrast, the specificity of the rapid antigen test is similarly high in the gold standard and the BLCM analysis.
To our knowledge, this is the first study applying a BLCM to estimate the diagnostic accuracy of the Roche/SD Biosensor rapid antigen test. The strength of our analysis is that we have included a large number of consecutive patients in clinical practice. The prospective design employing a strict protocol ensured complete and accurate data. Limitations of this study include the unequal sample sizes of the three populations, so the largest population, patients with symptoms, was possibly influenced the posteriors more than the two other populations. Additionally, although the model is theoretically identifiable with two diagnostic tests and three populations, the difference in the prevalence of the three populations is less than 10%, which might affect the estimates’ precision [20]. Furthermore, the assumption of constant diagnostic sensitivity in the three populations is also questionable. This is possibly the reason for the wider credibility intervals of the rapid antigen compared to the credibility intervals of the other parameters of interest. Possibly, in the considered sample of patients, different subpopulations exist, e.g., depending on the presence of clinical symptoms, more or fewer virus copies might be present, which might have a more considerable impact on the sensitivity of the rapid antigen test compared to RT-PCR.
The results of this study suggest that BLCMs are valuable tools when there is an imperfect reference standard, including for diagnosing respiratory infections in a routine clinical setting. The higher sensitivity of the antigen test could well be explained by the fact that the reference standard (RT-PCR) is not entirely accurate. Unfortunately, the “true value” cannot be determined empirically. Each method has its assumptions, which are not strictly adhered to, and which requirements are more significant in the situation at hand is difficult to say. BLCMs, similar to the classical gold standard approach, rely on the assumption that a positive and a negative test result indicates the same infection status for both tests.
This can be done already in the project’s protocol phase, thus supporting data analysis. Either separate BLCMs are conducted for patients with and without symptoms, or the symptoms (with/without) are included as a covariate in the evaluation of the diagnostic test [21]. We agree with [22] that BLCMs are complex models, that conditional dependencies are important, and that BLCMs are challenging to interpret by readers without a statistical background. We also agree with the famous statement of George Box: “all models are wrong, but some are useful” [23]. Still, in a pandemic situation, when new diagnostic tests are urgently needed, inter- and transdisciplinary research should be conducted, and a lack of statistical knowledge should not preclude the application of useful models.
5. Conclusions
In conclusion, BLCMs provide a valuable approach for determining diagnostic accuracy measures in the presence of an imperfect reference standard. This applies also to diagnosing respiratory infections in a routine clinical setting. Key limitations of this method can already be addressed in the planning phase of diagnostic accuracy studies.
Supplementary Materials
The following supporting information can be downloaded at: https://www.mdpi.com/article/10.3390/diagnostics13182892/s1, The dataset and the code are available in the Supplementary Materials (S.model.code.data.bug).
Author Contributions
S.H. performed the BLCM analysis and wrote the manuscript. H.N. contributed to the interpretation of the results and revised the manuscript, S.J., F.S.-R. and P.B. collected data and contributed to the interpretation of the results. P.J. contributed to the interpretation of the results and revised the manuscript. M.N. designed the study, interpreted the data, and wrote the manuscript. All authors have read and agreed to the published version of the manuscript.
Funding
This research did not receive any specific grant from funding agencies in the public, commercial, or not-for-profit sectors. MN is supported by a research grant from the Swiss National Science Foundation (#179334).
Institutional Review Board Statement
This study is a re-analysis of a published study (Jegerlehner et al., 2021 [15]) which received ethical approval by the local ethical committee (Kantonale Ethikkommission Bern #2020-02729).
Informed Consent Statement
Informed consent was obtained from all subjects involved in the study.
Data Availability Statement
The dataset and the code are available in the Supplementary Materials (S.model.code.data.bug).
Conflicts of Interest
MN has received research support from Roche Diagnostics outside of the present work. All other authors declare that no conflict of interest exist.
References
- Corman, V.M.; Landt, O.; Kaiser, M.; Molenkamp, R.; Meijer, A.; Chu, D.K.; Bleicker, T.; Brünink, S.; Schneider, J.; Schmidt, M.L.; et al. Detection of 2019 Novel Coronavirus (2019-NCoV) by Real-Time RT-PCR. Eurosurveillance 2020, 25, 2000045. [Google Scholar] [CrossRef] [PubMed]
- Chu, D.K.W.; Pan, Y.; Cheng, S.M.S.; Hui, K.P.Y.; Krishnan, P.; Liu, Y.; Ng, D.Y.M.; Wan, C.K.C.; Yang, P.; Wang, Q.; et al. Molecular Diagnosis of a Novel Coronavirus (2019-NCoV) Causing an Outbreak of Pneumonia. Clin. Chem. 2020, 66, 549–555. [Google Scholar] [CrossRef] [PubMed]
- Arevalo-Rodriguez, I.; Buitrago-Garcia, D.; Simancas-Racines, D.; Zambrano-Achig, P.; Del Campo, R.; Ciapponi, A.; Sued, O.; Martinez-García, L.; Rutjes, A.W.; Low, N.; et al. False-Negative Results of Initial RT-PCR Assays for COVID-19: A Systematic Review. PLoS ONE 2020, 15, e0242958. [Google Scholar] [CrossRef] [PubMed]
- Dramé, M.; Tabue Teguo, M.; Proye, E.; Hequet, F.; Hentzien, M.; Kanagaratnam, L.; Godaert, L. Should RT-PCR Be Considered a Gold Standard in the Diagnosis of COVID-19? J. Med. Virol. 2020, 92, 2312–2313. [Google Scholar] [CrossRef] [PubMed]
- Kortela, E.; Kirjavainen, V.; Ahava, M.J.; Jokiranta, S.T.; But, A.; Lindahl, A.; Jääskeläinen, A.E.; Jääskeläinen, A.J.; Järvinen, A.; Jokela, P.; et al. Real-Life Clinical Sensitivity of SARS-CoV-2 RT-PCR Test in Symptomatic Patients. PLoS ONE 2021, 16, e0251661. [Google Scholar] [CrossRef] [PubMed]
- Berkvens, D.; Speybroeck, N.; Praet, N.; Adel, A.; Lesaffre, E. Estimating Disease Prevalence in a Bayesian Framework Using Probabilistic Constraints. Epidemiology 2006, 17, 145–153. [Google Scholar] [CrossRef] [PubMed]
- Hui, S.L.; Walter, S.D. Estimating the Error Rates of Diagnostic Tests. Biometrics 1980, 36, 167–171. [Google Scholar] [CrossRef]
- Cheung, A.; Dufour, S.; Jones, G.; Kostoulas, P.; Stevenson, M.A.; Singanallur, N.B.; Firestone, S.M. Bayesian Latent Class Analysis When the Reference Test Is Imperfect: -EN- -FR- Analyse Bayésienne à Classes Latentes Dans Les Situations Où Le Test de Référence Est Imparfait -ES- Análisis Bayesiano de Clases Latentes Cuando La Prueba de Referencia Es Imperfecta. Rev. Sci. Tech. OIE 2021, 40, 271–286. [Google Scholar] [CrossRef]
- Plummer, M. JAGS: A Program for Analysis of Bayesian Graphical Models Using Gibbs Sampling. In Proceedings of the 3rd International Workshop on Distributed Statistical Computing (DSC 2003), Vienna, Austria, 20–22 March 2003; Volume 124. [Google Scholar]
- Kostoulas, P.; Nielsen, S.S.; Branscum, A.J.; Johnson, W.O.; Dendukuri, N.; Dhand, N.K.; Toft, N.; Gardner, I.A. STARD-BLCM: Standards for the Reporting of Diagnostic Accuracy Studies That Use Bayesian Latent Class Models. Prev. Vet. Med. 2017, 138, 37–47. [Google Scholar] [CrossRef]
- Butler-Laporte, G.; Lawandi, A.; Schiller, I.; Yao, M.; Dendukuri, N.; McDonald, E.G.; Lee, T.C. Comparison of Saliva and Nasopharyngeal Swab Nucleic Acid Amplification Testing for Detection of SARS-CoV-2: A Systematic Review and Meta-Analysis. JAMA Intern. Med. 2021, 181, 353. [Google Scholar] [CrossRef]
- Kostoulas, P.; Eusebi, P.; Hartnack, S. Diagnostic Accuracy Estimates for COVID-19 Real-Time Polymerase Chain Reaction and Lateral Flow Immunoassay Tests with Bayesian Latent-Class Models. Am. J. Epidemiol. 2021, 190, 1689–1695. [Google Scholar] [CrossRef] [PubMed]
- Perkins, T.A.; Stephens, M.; Alvarez Barrios, W.; Cavany, S.; Rulli, L.; Pfrender, M.E. Performance of Three Tests for SARS-CoV-2 on a University Campus Estimated Jointly with Bayesian Latent Class Modeling. Microbiol. Spectr. 2022, 10, e01220-21. [Google Scholar] [CrossRef] [PubMed]
- Sisay, A.; Abera, A.; Dufera, B.; Endrias, T.; Tasew, G.; Tesfaye, A.; Hartnack, S.; Beyene, D.; Desta, A.F. Diagnostic Accuracy of Three Commercially Available One Step RT-PCR Assays for the Detection of SARS-CoV-2 in Resource Limited Settings. PLoS ONE 2022, 17, e0262178. [Google Scholar] [CrossRef] [PubMed]
- Jegerlehner, S.; Suter-Riniker, F.; Jent, P.; Bittel, P.; Nagler, M. Diagnostic Accuracy of a SARS-CoV-2 Rapid Antigen Test in Real-Life Clinical Settings. Int. J. Infect. Dis. 2021, 109, 118–122. [Google Scholar] [CrossRef] [PubMed]
- Brigger, D.; Horn, M.P.; Pennington, L.F.; Powell, A.E.; Siegrist, D.; Weber, B.; Engler, O.; Piezzi, V.; Damonti, L.; Iseli, P.; et al. Accuracy of Serological Testing for SARS-CoV-2 Antibodies: First Results of a Large Mixed-method Evaluation Study. Allergy 2021, 76, 853–865. [Google Scholar] [CrossRef] [PubMed]
- Jegerlehner, S.; Suter-Riniker, F.; Jent, P.; Bittel, P.; Nagler, M. Diagnostic Accuracy of SARS-CoV-2 Saliva Antigen Testing in a Real-Life Clinical Setting. Int. J. Infect. Dis. 2022, 119, 38–40. [Google Scholar] [CrossRef] [PubMed]
- Horn, M.P.; Jonsdottir, H.R.; Brigger, D.; Damonti, L.; Suter-Riniker, F.; Endrich, O.; Froehlich, T.K.; Fiedler, M.; Largiadèr, C.R.; Marschall, J.; et al. Serological Testing for SARS-CoV-2 Antibodies in Clinical Practice: A Comparative Diagnostic Accuracy Study. Allergy 2022, 77, 2090–2103. [Google Scholar] [CrossRef] [PubMed]
- Denwood, M.J. Runjags: An R Package Providing Interface Utilities, Model Templates, Parallel Computing Methods and Additional Distributions for MCMC Models in JAGS. J. Stat. Soft. 2016, 71, 1–25. [Google Scholar] [CrossRef]
- Toft, N.; Jørgensen, E.; Højsgaard, S. Diagnosing Diagnostic Tests: Evaluating the Assumptions Underlying the Estimation of Sensitivity and Specificity in the Absence of a Gold Standard. Prev. Vet. Med. 2005, 68, 19–33. [Google Scholar] [CrossRef]
- Lewis, F.I.; Torgerson, P.R. A Tutorial in Estimating the Prevalence of Disease in Humans and Animals in the Absence of a Gold Standard Diagnostic. Emerg. Themes Epidemiol. 2012, 9, 9. [Google Scholar] [CrossRef]
- Korevaar, D.A.; Toubiana, J.; Chalumeau, M.; McInnes, M.D.F.; Cohen, J.F. Evaluating Tests for Diagnosing COVID-19 in the Absence of a Reliable Reference Standard: Pitfalls and Potential Solutions. J. Clin. Epidemiol. 2021, 138, 182–188. [Google Scholar] [CrossRef]
- Box, G.E.P. Robustness in the Strategy of Scientific Model Building. In Robustness in Statistics; Elsevier: Amsterdam, The Netherlands, 1979; pp. 201–236. ISBN 978-0-12-438150-6. [Google Scholar]

Disclaimer/Publisher’s Note: The statements, opinions and data contained in all publications are solely those of the individual author(s) and contributor(s) and not of MDPI and/or the editor(s). MDPI and/or the editor(s) disclaim responsibility for any injury to people or property resulting from any ideas, methods, instructions or products referred to in the content. |
© 2023 by the authors. Licensee MDPI, Basel, Switzerland. This article is an open access article distributed under the terms and conditions of the Creative Commons Attribution (CC BY) license (https://creativecommons.org/licenses/by/4.0/).