Article

Prognostic Value of BRAF, Programmed Cell Death 1 (PD1), and PD Ligand 1 (PDL1) Protein Expression in Colon Adenocarcinoma

1
Department of Pathology, Faculty of Medicine, Mansoura University, Mansoura 35516, Egypt
2
Department of Laboratory Medicine and pathobiology, University of Toronto, Toronto, ON M5S 1A8, Canada
3
Division of Endocrine and Oncologic Surgery, Department of Surgery, School of Medicine, Tulane University, New Orleans, LA 70112, USA
4
Medical Genetics Unit, Histology and Cell Biology Department, Faculty of Medicine, Suez Canal University, Ismailia 41522, Egypt
5
Department of Medical Biochemistry and Molecular Biology, Faculty of Medicine, Suez Canal University, Ismailia 41522, Egypt
6
Department of Biochemistry, Faculty of Medicine, Northern Border University, Arar 73213, Saudi Arabia
7
Surgical Oncology Department, Faculty of Medicine, Mansoura University, Mansoura 35516, Egypt
8
Medical Oncology Unit, Oncology Center, Internal Medicine Department, Faculty of Medicine, Mansoura University, Mansoura 35516, Egypt
9
Oncology Center, King Abdullah Medical City, Makkah 24246, Saudi Arabia
10
Department of Anatomy, Faculty of Medicine, Jazan University, Jazan 82621, Saudi Arabia
11
Department of Histology and Cell Biology, Faculty of Medicine, Suez Canal University, Ismailia 41522, Egypt
12
Faculty of Medicine, Mansoura University, Mansoura 21955, Egypt
13
Department of Pathology, Faculty of Medicine, Helwan University, Cairo 11795, Egypt
*
Author to whom correspondence should be addressed.
Diagnostics 2023, 13(2), 237; https://doi.org/10.3390/diagnostics13020237
Submission received: 10 November 2022 / Revised: 22 December 2022 / Accepted: 29 December 2022 / Published: 9 January 2023
(This article belongs to the Special Issue Advances in the Diagnosis and Management of Tumors/Cancers)

Abstract

:
Patients with colorectal cancer in different stages show variable outcomes/therapeutic responses due to their distinct tumoral biomarkers and biological features. In this sense, this study aimed to explore the prognostic utility of BRAF, programmed death-1 (PD1), and its ligand (PDL1) protein signatures in colon adenocarcinoma. The selected protein markers were explored in 64 archived primary colon adenocarcinomas in relation to clinicopathological features. BRAF overexpression was found in 39% of the cases and was significantly associated with grade 3, N1, advanced Dukes stage, presence of relapse, and shorter overall survival (OS). PD1 expression in the infiltrating immune cells (IICs) exhibited significant association with T2/T3, N0/M0, early Dukes stage, and absence of relapse. PDL1 expression in IICs is significantly associated with advanced nodal stage/distant metastasis, advanced Dukes stage, and shorter OS. Meanwhile, PDL1 expression in neoplastic cells (NC) was associated with the advanced lymph node/Dukes stage. A positive combined expression pattern of PDL1 in NC/IICs was associated with poor prognostic indices. Tumor PDL1 expression can be an independent predictor of OS and DFS. The multivariate analyses revealed that short OS was independently associated with the RT side location of the tumor, PD1 expression in stromal IICs, and PDL1 expression in NC. In conclusion, overexpression of BRAF in colon adenocarcinoma is considered a poor prognostic pathological marker. In addition, PDL1 expression in NC is considered an independent prognostic factor for DFS/OS. Combined immunohistochemical assessment for BRAF and PD1/PDL1 protein expressions in colon adenocarcinoma might be beneficial for selecting patients for future targeted therapy.

1. Introduction

According to GLOBOCAN 2018 data, colorectal cancer (CRC) is the fourth most common cancer diagnosed globally [1,2]. Although cancer screening programs and improved pre- and post-operative care have reduced mortality associated with CRC, it is still the third cause of cancer-related deaths worldwide [3]. The 5-year survival rate of patients with metastatic disease is still less than 10%, which is probably due to limitations in early diagnoses and the lack of specific markers to determine tumor development or the patient’s prognosis [4].
Cancer management, including CRC, has witnessed some of the most significant advances in adjuvant treatment, target therapy, immunotherapy, and follow-up strategies [5,6,7,8,9,10]. Recently, immunotherapy has been considered an effective treatment for many types of cancers, such as as gastric carcinoma, malignant melanomas, non-small cell lung cancer, renal cell carcinomas, and bladder carcinomas [11,12,13,14,15]. The most important therapy is that which targets the programmed death 1 (PD1)/PD-ligand 1 (L1) pathway [16]. This pathway is stimulated by the interaction between PDL-1 on tumor cells and the PD1 expressed on activated T (CD8+) cells, B cells, and natural killer cells, resulting in T cells apoptosis with subsequent downregulation of the antitumor responses of T cells [17,18,19,20]. In addition, PDL1 expressed by tumor cells and their related stromal cells can be stabilized by tumor necrosis factor alpha (TNF-α) and causes the suppression of antitumor immunity [21].
Aberrant PD1 and PDL1 expression were reported in several types of cancers, including skin cancer, gastric cancer, pancreatic cancer, and breast cancer [19,22,23]. In CRC, PDL1 expression is implicated in tumorigenesis, and its prognostic importance is not fully clarified [4].
Alteration in the BRAF pathway is reported in up to 20% of colorectal tumorigenesis, as it results in uncontrolled cellular growth [24]. It is implicated in the serrated neoplastic pathway, aggressive phenotype, and poor prognosis in stage IV CRC [3,4]. BRAF inhibitors appear to reverse some tumor-associated immune-suppressive signals, and the immune-stimulatory effects observed in response to treatments subside with disease progression [25]. However, the targeted BRAF therapy alone is not very effective, and it was reported to be associated with the persistence of a high level of tumor PDL1 expression [26,27].
For these considerations, this study aimed to assess the prognostic value of PD1/PD-L1 and BRAF proteins expression in colorectal carcinoma by immunohistochemical analysis. This may provide hope for combined BRAF inhibitors and immunotherapy application in such cases in the near future.

2. Materials and Methods

2.1. Patients

One hundred consecutive cases of primary colon adenocarcinomas were collected retrospectively from Mansoura University, Faculty of Medicine, Oncology Center, Egypt, between July 2014 and June 2017. All patients underwent curative R0 resections. Patients with double malignancies, patients who received previous chemotherapy or radiotherapy, and patients with no available follow-up data were excluded. All patients were followed up regularly at three, six, and 12-month intervals following the guidelines of the German tumor centers (completeness index of 0.96) [28].
Only 64 eligible patients had complete clinical, survival, and pathological data with paraffin blocks (Figure 1). The study was approved by the regional Ethics committee for the Faculty of Medicine, Mansoura University, Egypt (approval no. R.21.02.1198.R1). The demographic data, such as the patient’s age, sex, tumor location, and post-operative course (recurrence and survival), were obtained from the patient’s medical records.

2.2. Histopathology

Paraffin-embedded blocks of tumor tissue, as well as adjacent normal colon tissues from the patients, were retrieved from archives of pathology. Serial sections from each specimen were stained with H&E for histological evaluation. Two pathologists reviewed the histopathological features of each slide according to WHO classification [29]. TNM staging and Dukes staging of each tumor were reviewed according to Akkoca et al. [30].

2.3. Immunohistochemical (IHC) Analysis and Interpretation

Tissue sections were dewaxed, rehydrated, and washed in phosphate-buffered saline 1× (PBS; Lonza, Verviers, Belgium). Epitope retrieval was performed by treating the slides in a PT Link (Dako, Agilent Technologies, Santa Clara, CA, United States) containing acid or basic solution (as appropriate), preheated to 97 °C for 30 min. Next, endogenous peroxidase was inhibited with a peroxidase-blocking solution (Dako, Agilent Technologies, Santa Clara, CA, United States) for 5 min. Afterward, sections were immunostained with the following primary antibodies: anti-PDL1 (Clone, YPA1638, 1:50, Biospes, Chongqing Biospes Co., Ltd., Chongqing, China), anti-PD1 (Clone, YPA1637, 1:50, Biospes, Chongqing Biospes Co., Ltd., Chongqing, China), and anti-BRAF V (Catalog No. IHC-00607, GeneID 673, Isotype IgG, dilution 1:50, BETHYL laboratory, Montgomery, TX, USA). Tonsil tissue and breast cancer tissue were applied as positive controls for PD1/PDL1 and BRAF antibodies, respectively (following the manufacturer’s guide). The sections were counterstained for 3 min with Meyer’s hematoxylin, then mounted. Negative controls were obtained by omitting the primary antibodies.
The stain was interpreted independently by two observers blinded to the clinical outcome. The Hercept Test scoring system was used to detect the staining score of both PDL1 and PD1 in the infiltrating immune cells and PDL1 in tumor cells. For PDL1 expression of the tumor cells, the intensity of the stain was scored as 0 (no staining), 1 (light yellow), 2 (brown), and 3 (deep brown). The number of stained cells per 100 was scored as 1 (≤10%), 2 (10%~50%), and 3 (≥50%). High PDL1 expression was detected when the product of the staining strength score multiplied and the number of stained cells per 100 cells was no less than three. With regard to immune cell-specific PDL1/PD1 expressions, the percentage of stained cells per 100 cells were detected and categorized as 0–9%, 10–49%, and 50–100% stained immune cells [31].
For BRAF staining, the intensity of the anti-BRAF antibody in tumor cells was recorded on a 0–3 scale. The expression was mainly cytoplasmic with nuclear staining in cases with strong and moderate cytoplasmic staining. Strong cytoplasmic with or without nuclear staining was scored as 3, moderate cytoplasmic staining with or without nuclear staining as 2, weak cytoplasmic staining as 1, and the absence of staining was scored as 0. In addition, any nuclear staining and the percentage of tumor cells stained positive with anti-BRAF antibodies were recorded. The cases were scored as dysregulated BRAF protein expression if > 80% of tumor cells expressed diffuse uniform unequivocal strong or moderate cytoplasmic staining with or without nuclear staining. However, they were scored negative for dysregulated BRAF expression if they showed no staining or weak, cytoplasmic, non-granular, uniform staining (stain intensity <80%). The cases with staining of isolated tumor cells in a tumor and those who showed no staining were also considered negative cases for the dysregulated BRAF expression. The cases were scored as equivocal if they displayed ambiguous, heterogeneous, non-uniform cytoplasmic staining in tumor cells with or without nuclear staining [24].

2.4. Combined Expression Patterns of PDL1 in Neoplastic Cells (NC) and Infiltrating Immune Cells (IIC)

The study cases were categorized into four groups according to the combined expression patterns of PDL1 in neoplastic cells (NC) and infiltrating immune cells (IIC), a method which is validated by Valentini et al. 2018 (22). Group A (NC−/IIC−) which was negative in NCs and IICs; Group B (NC+/IIC−) which was positive only in neoplastic cells; Group C (NC−/IIC+) was positive only in IICs; Group D (NC+/IIC+) was positive both in NCs and IICs. The expression pattern of each marker in both NC and IIC was tested for association with clinicopathological parameters.

2.5. Statistical Analysis

Data were analyzed using R version 3.5.1 and SPSS version 23.0. Chi-square and Fisher’s Exact tests were applied for qualitative variables (when appropriate), while student’s-t and Mann–Whitney U tests were employed for continuous attributes. p-value ≤ 0.05 was set to be significant.
Patients were grouped into four groups based on PDL1 expression and location. The association of the expression patterns and the clinicopathological parameters were tested using the Kruskal–Wallis test. Differences in overall survival (OS) and disease-free survival (DFS) between groups were assessed using the log-rank test, and Kaplan–Meier curves were plotted. Univariate and multivariate Cox proportional hazard regression analyses were performed to calculate the hazard ratio (HR) and 95% confidence interval (CI).

3. Results

3.1. The Clinicopathological Characteristics of the Studied Cases

Table 1 summarizes the clinicopathological features of the studied 64 cases of colorectal adenocarcinoma. The mean age at diagnosis was 57.3 ± 12.5 years. Twenty-nine cases (45.3%) were ≤ 55 years, and twenty-nine cases (45.3%) were females. In 52 cases, the tumor was located in the ascending colon (81.3%), and, in the other 12 cases, were located in the descending colon and rectum (18.8%). About 38 cases (59.4%) were grade II, and 17 cases (26.5%) were grade III. The most prevalent T stages were T3 (40 cases; 62.5%) and T2 (15 cases; 23.4%). The nodal stages varied from N0: 37 (57.8%), N1: 24 (37.5%), and N2: 3 (4.7%). Most cases had no metastasis; only five (7.8%) had distant metastasis. The studied cases were in Dukes stage A: 10 (15.6%), B: 26 (40.6%), C: 23 (35.9%), and D: 5 (7.8%). During the follow-up period (34 ± 20 months), nearly 61% of the cases had not relapsed, while 45.3% died.

3.2. BRAF Protein Expression and Association with Clinicopathological Prognostic Factors of Colon Adenocarcinoma

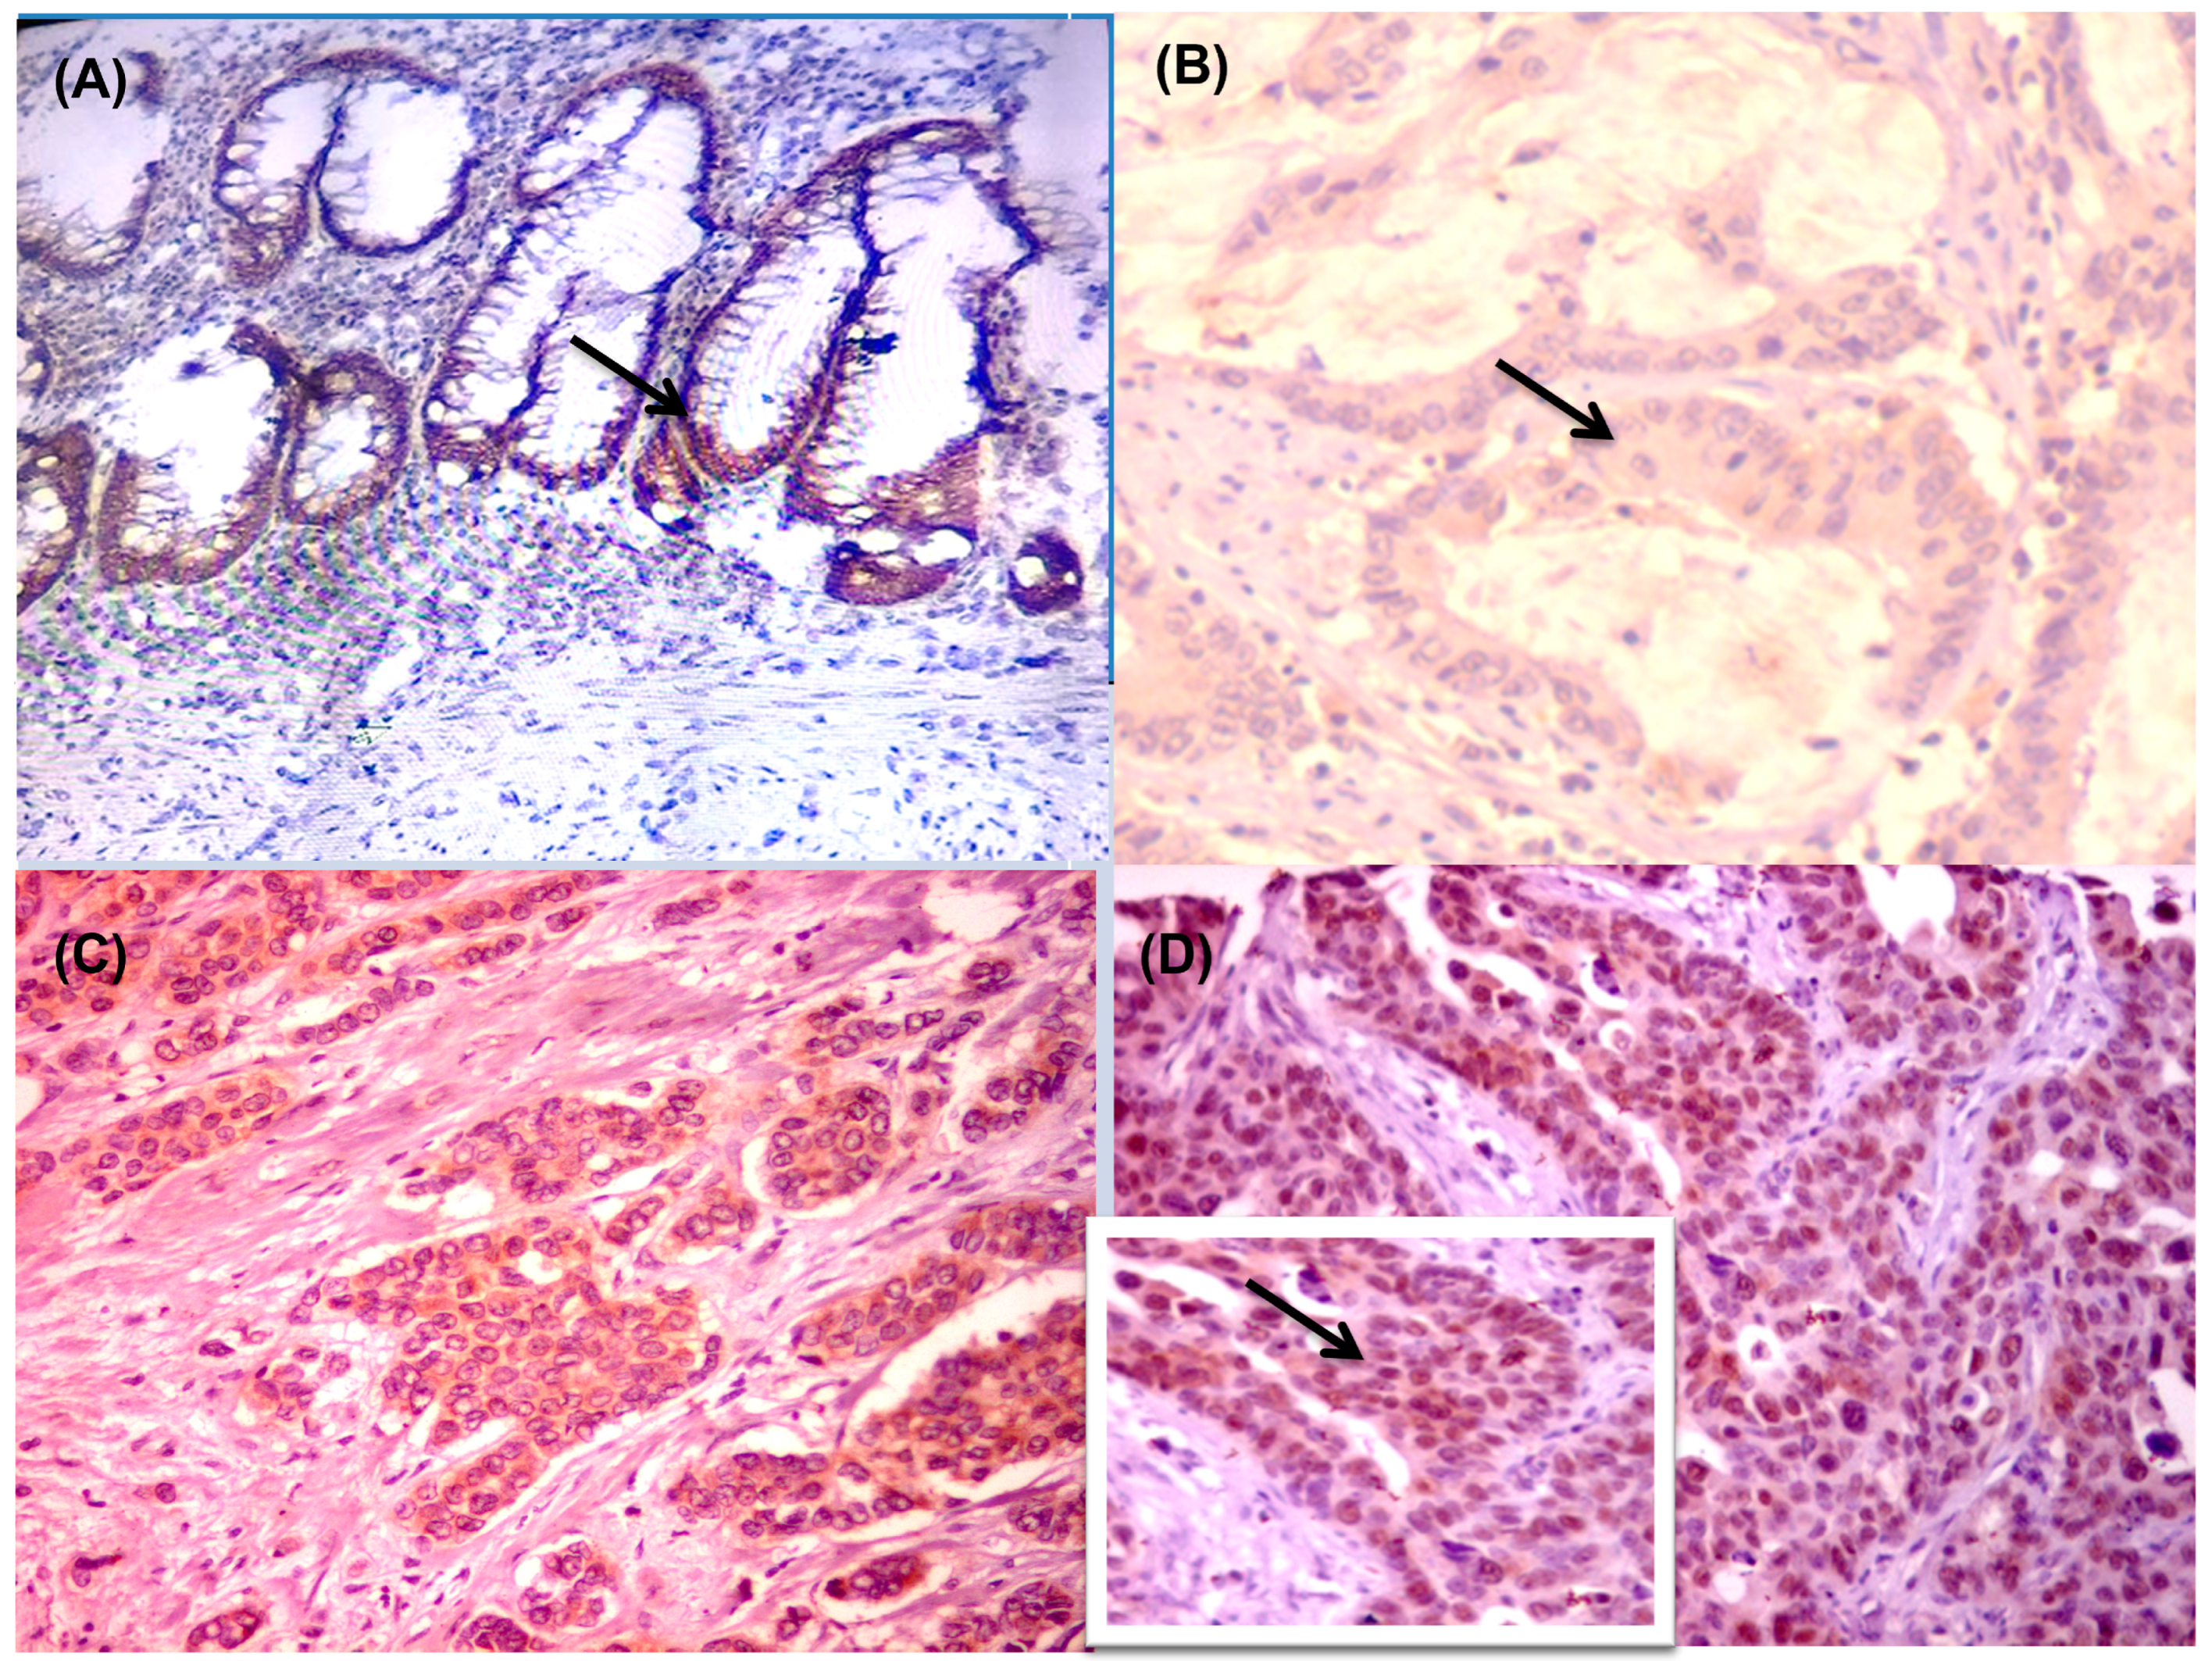
BRAF protein expression was considered positive in 25 cases (39.1%). The staining was cytoplasmic with or without nuclear staining. Adjacent non-neoplastic colorectal tissue showed scattered nuclear staining in the mucosa and/or cytoplasmic staining in smooth muscle (Figure 2).
As regards the association of BRAF protein expression with the clinicopathological characteristics of the studied colonic adenocarcinoma cases, using a two-sided Chi-square test, there were significant associations with grade III (p = 0.04), N1 (p = 0.00), advanced Dukes stage (C-D) (p = 0.02), presence of relapse (p = 0.02), and shorter overall survival (OS; p = 0.00). At the same time, BRAF protein expression was not associated with the presence of lymphovascular invasion (LVI; p = 0.06) (Table 2).

3.3. Expression of PD1 and PDL1 and Association with Clinicopathological Prognostic Factors of Colon Adenocarcinomas

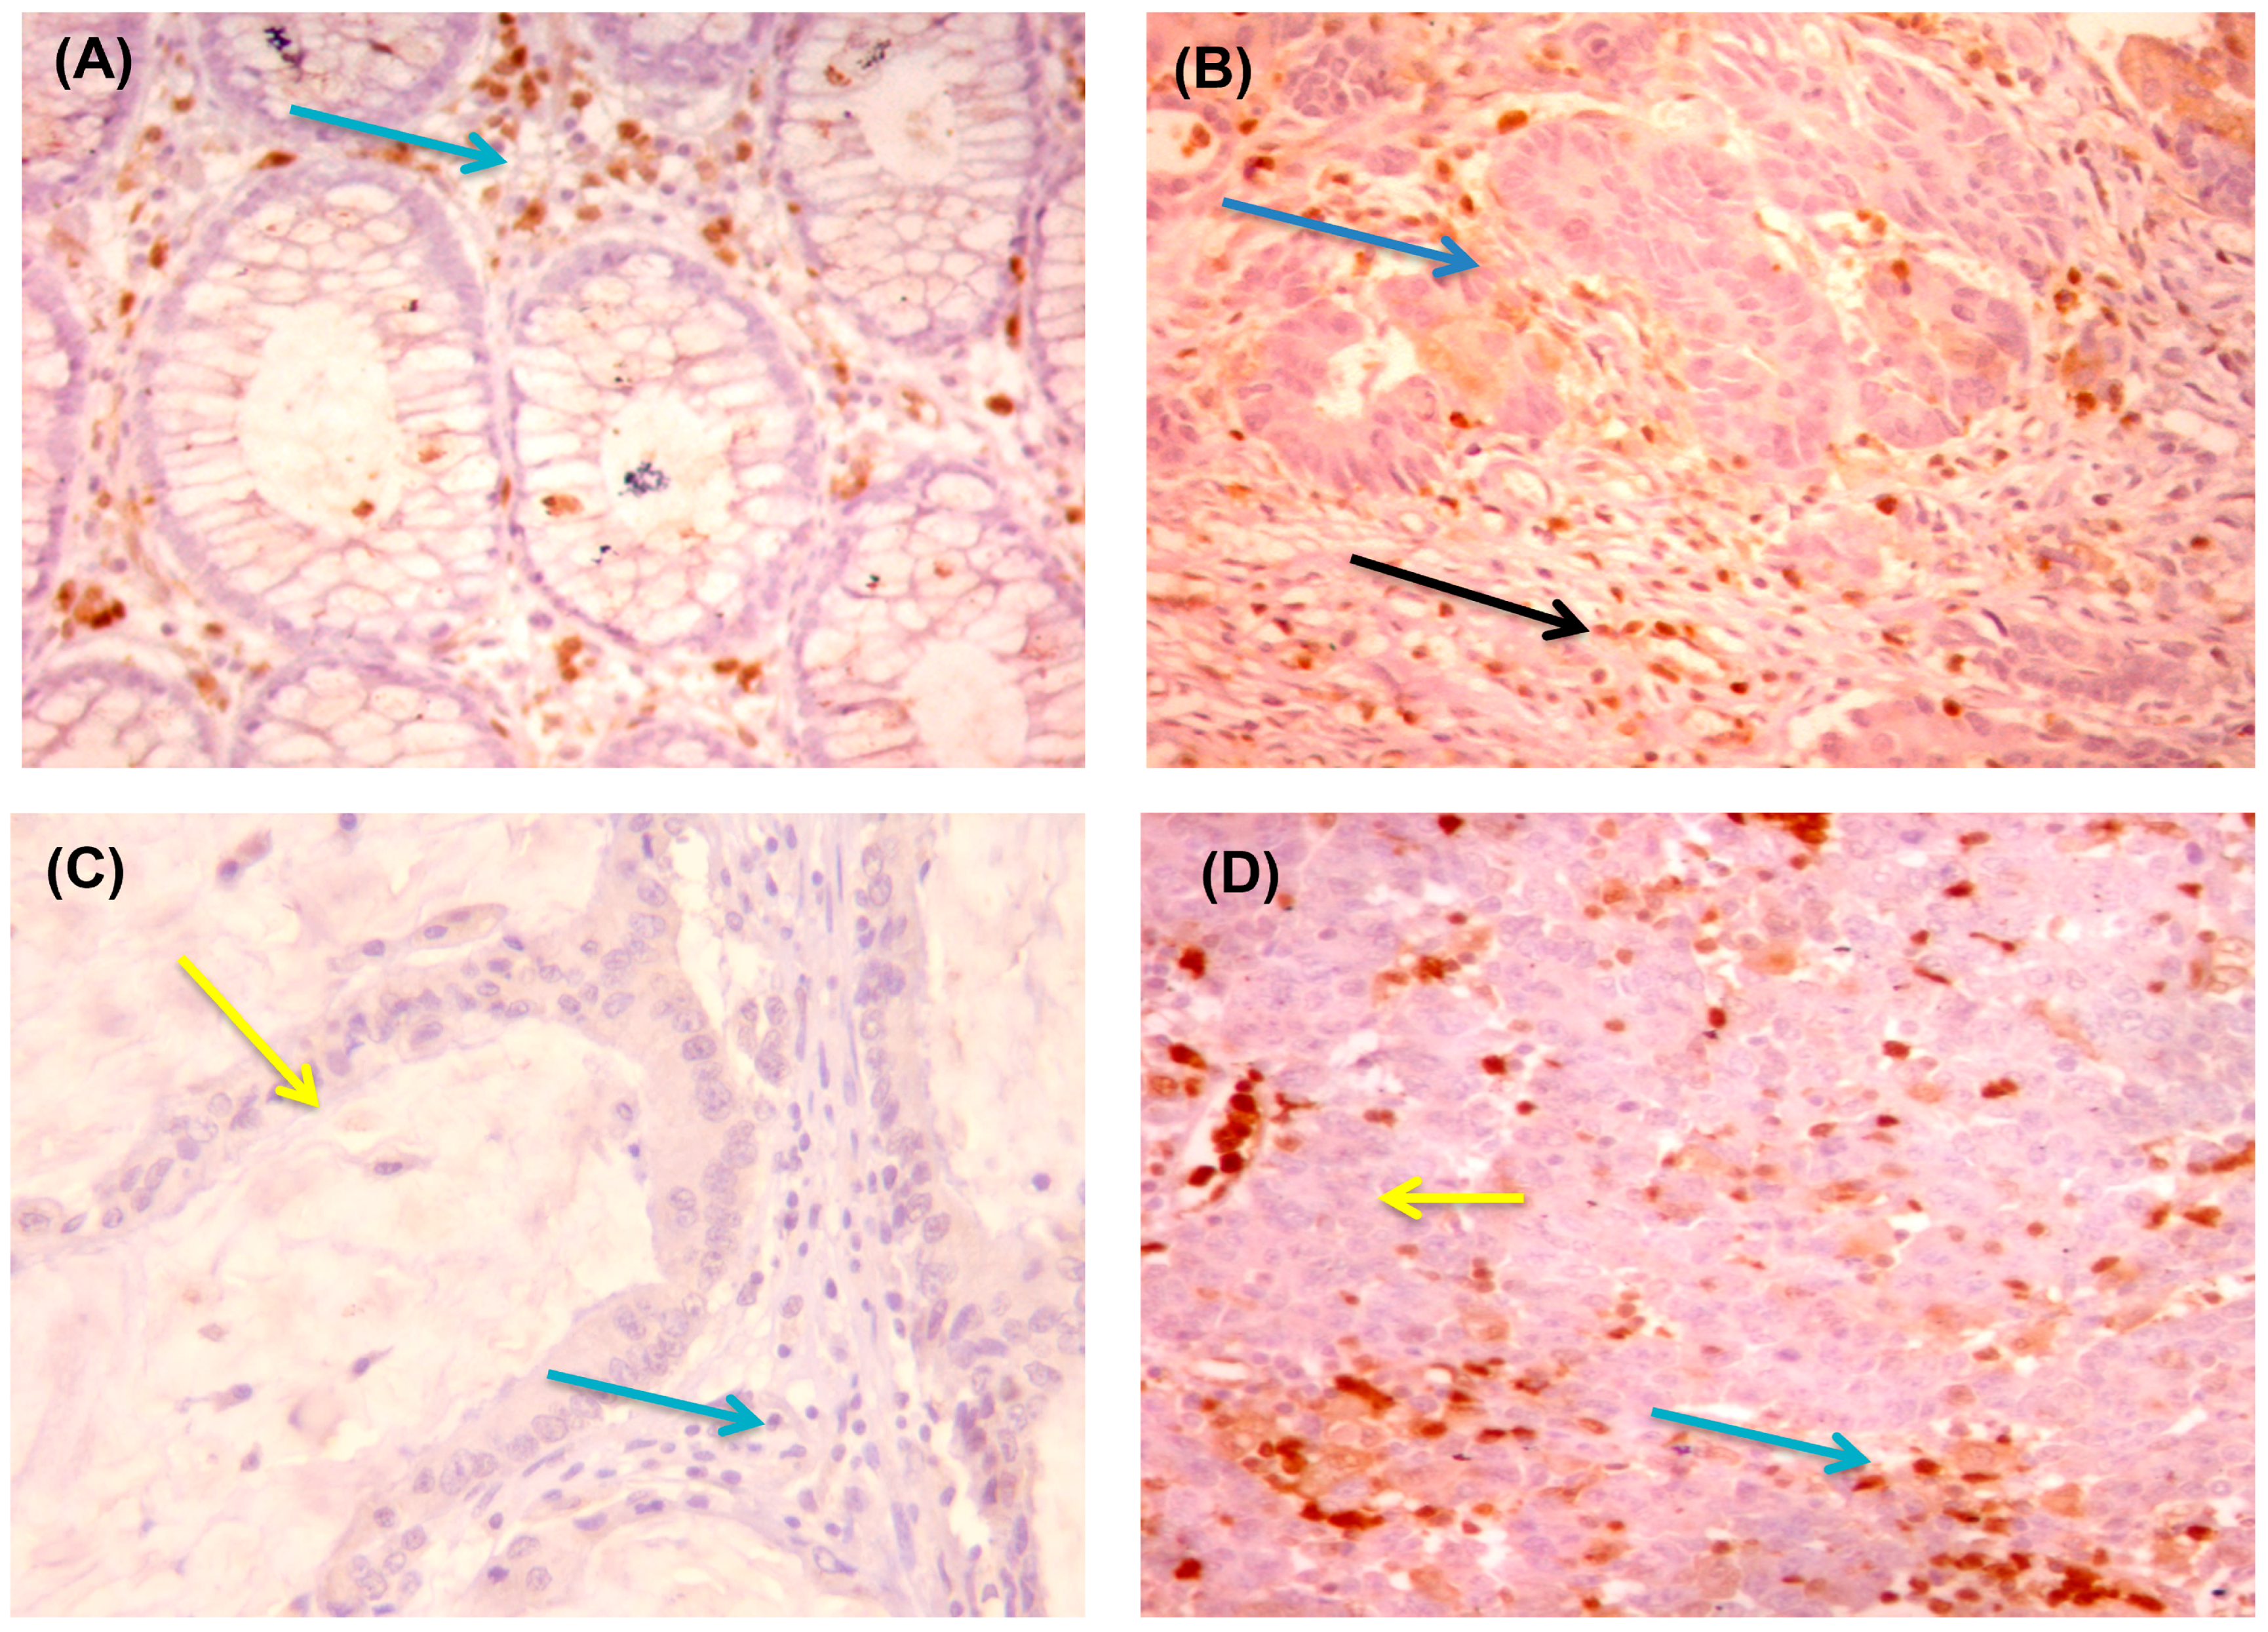
In adjacent non-neoplastic colonic mucosa epithelial cells, PD1 and PDL1 proteins showed no staining. The pattern of PD1 and PDL1 expression in neoplastic cells was either focal or diffuse, with a predominance of the focal pattern, particularly along with the tumor–stromal interface. While in infiltrating immune cells (IIC), a diffuse positive pattern was prevalent. Among the 64 patients, 41 (64%) had PD1 overexpression in IIC (Table 3, Figure 3).
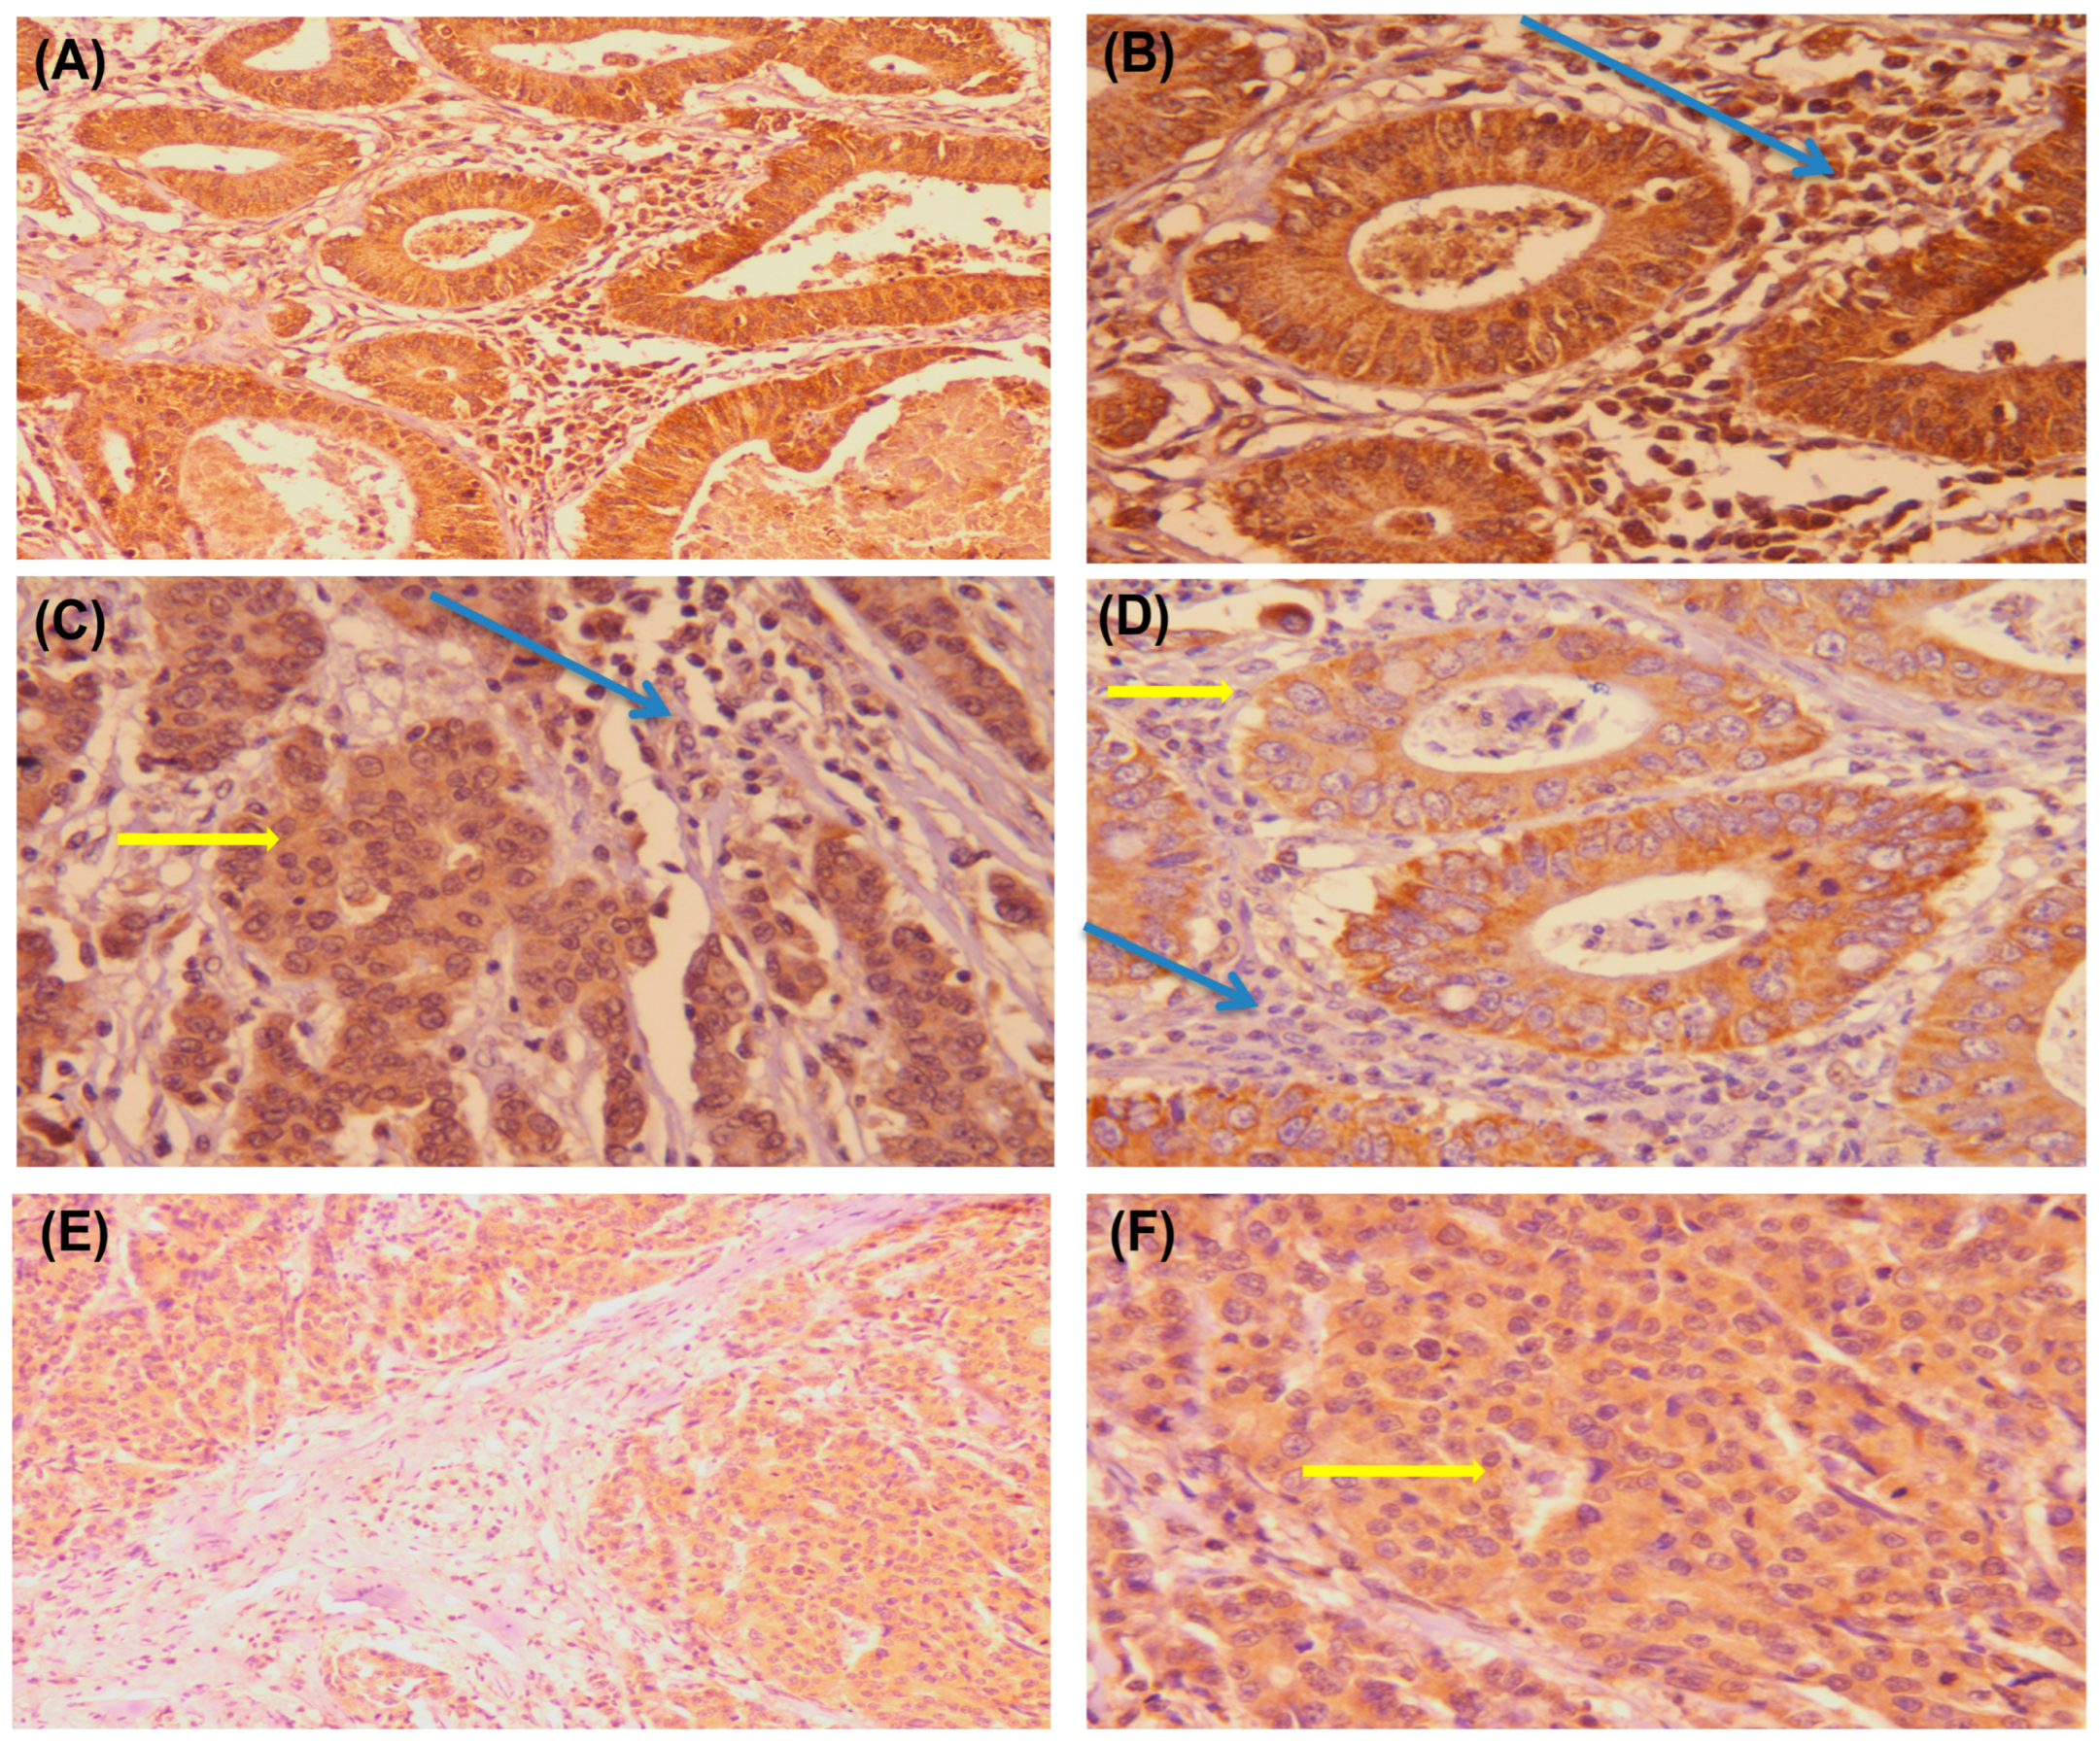
PDL1 overexpression in NC was detected in 34 cases (53.1%), and PDL1 overexpression in IICs was detected in 33 cases (51.6%) (Table 1). Staining was predominantly localized in the cellular membrane with diffuse faint intracellular expression (Table 1, Figure 4).
Regarding PDL1 overexpression in NC and IIC association with the clinicopathological characteristics, using a two-sided Chi-square test, there were significant associations with the advanced lymph node stage (p = 0.00, 0.000) and advanced Dukes stage (p = 0.000, 0.000). In addition, PDL1 overexpression in IICs exhibited a significant association with the presence of distant metastasis (p = 0.01) and shorter OS (p = 0.01). While PD1 overexpression in IICs exhibited significant association with T2/T3 (p = 0.002), N0 (p = 0.00), M0 (p = 0.00), early Dukes stage (p = 0.00), and absence of relapse (p = 0.00) (Table 3).

3.4. Combined Expression Patterns of PDL1 in Neoplastic and Infiltrating Immune Cells, and Association with the Clinicopathological Prognostic Factors of Colon Adenocarcinomas

The combined expression pattern of PDL1 includes four groups. Group A (NC−/IIC−), Group B (NC+/IIC−), Group C (NC−/IIC+), and Group D (NC+/IIC+). The studied cases include 18 cases (group A), 17 cases (group B), 10 cases (group C), and 19 cases (group D). Combined expression pattern group D was significantly associated with poor prognostic parameters, including advanced nodal stage (p = 0.002), advanced Dukes tumor stage (p = 0.01), and shorter OS (p = 0.05) using the Kruskal–Wallis test (Table 4).

3.5. Correlation between BRAF, PD1, and the PDL1 Protein Expressions

By testing the way of linking the expression pattern of the three markers using the Spearman Bivariate correlation test, BRAF protein expression positivity did not correlate with either IICs PD1, NC PDL1, IIC PDL1, or the combined pattern of PDL1. Only NC PDL1 and IIC PDL1 show a considerable positive correlation to the combined pattern of PDL1 expression (r: 0.591 and 0.895, respectively (p = 0.000 for both)) (Table 5).

3.6. Univariate and Multivariate Analyses of Patients’ Clinical Outcomes (Relapse, Overall and Disease-Free Survival) and BRAF, PD1, and PDL1 Expressions

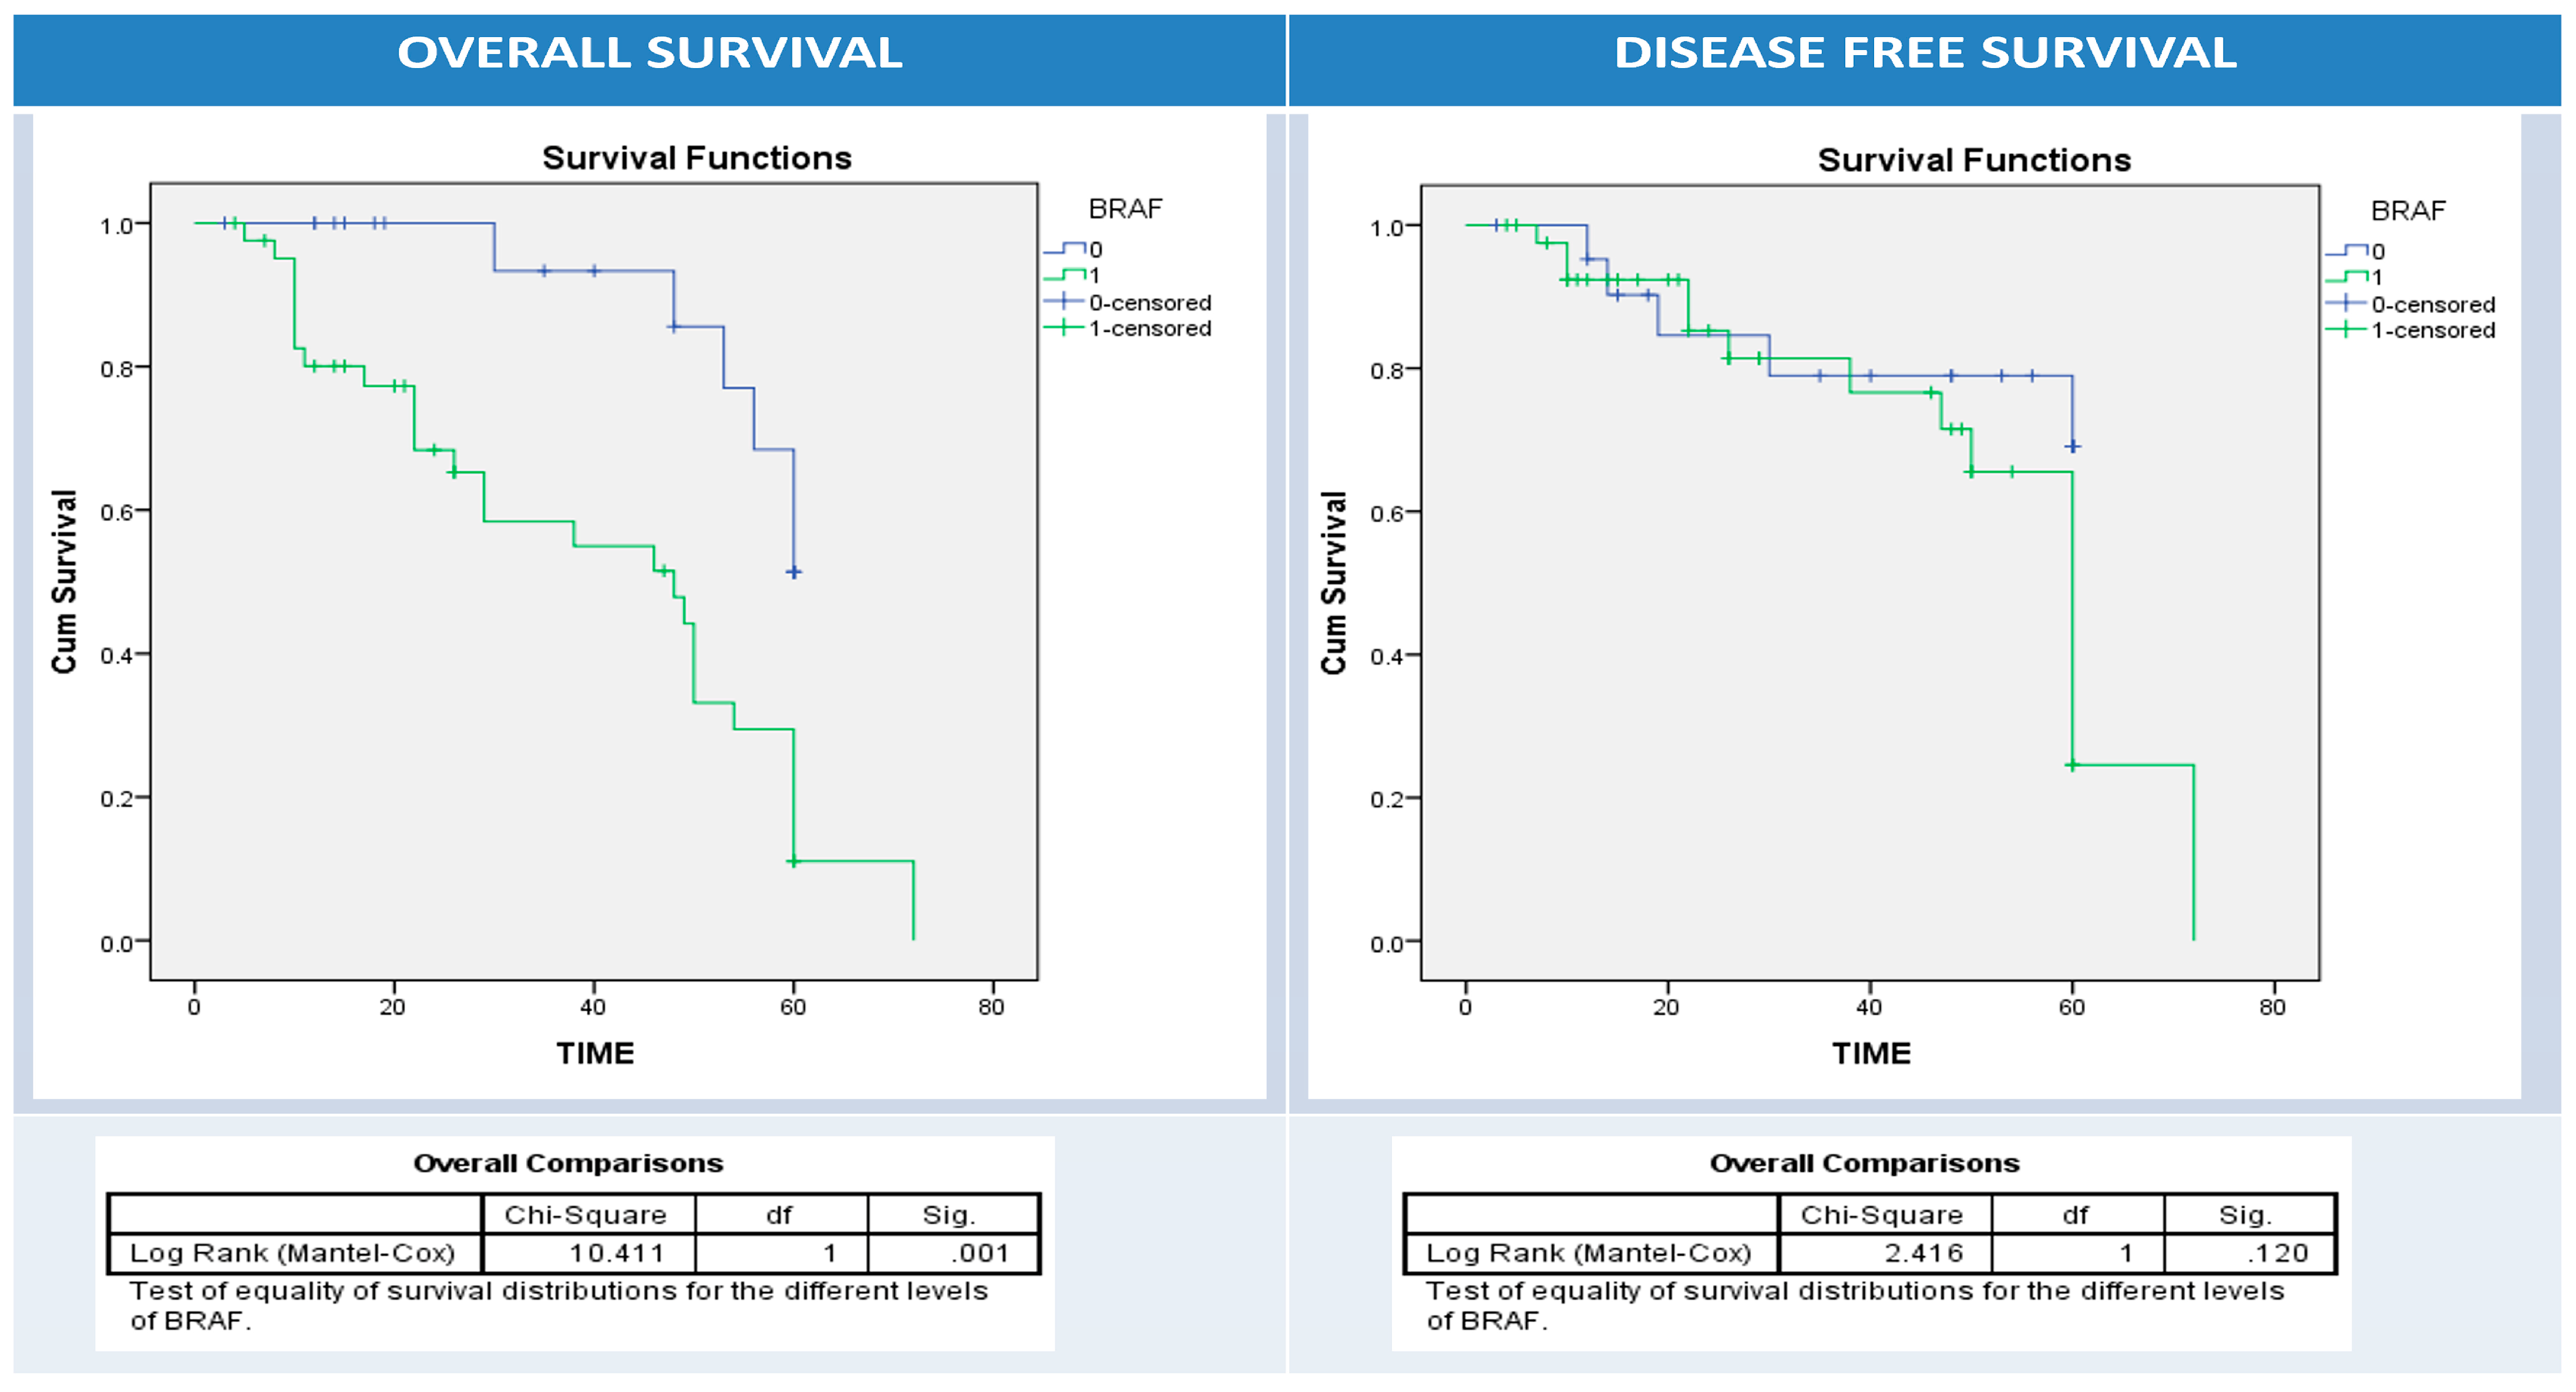
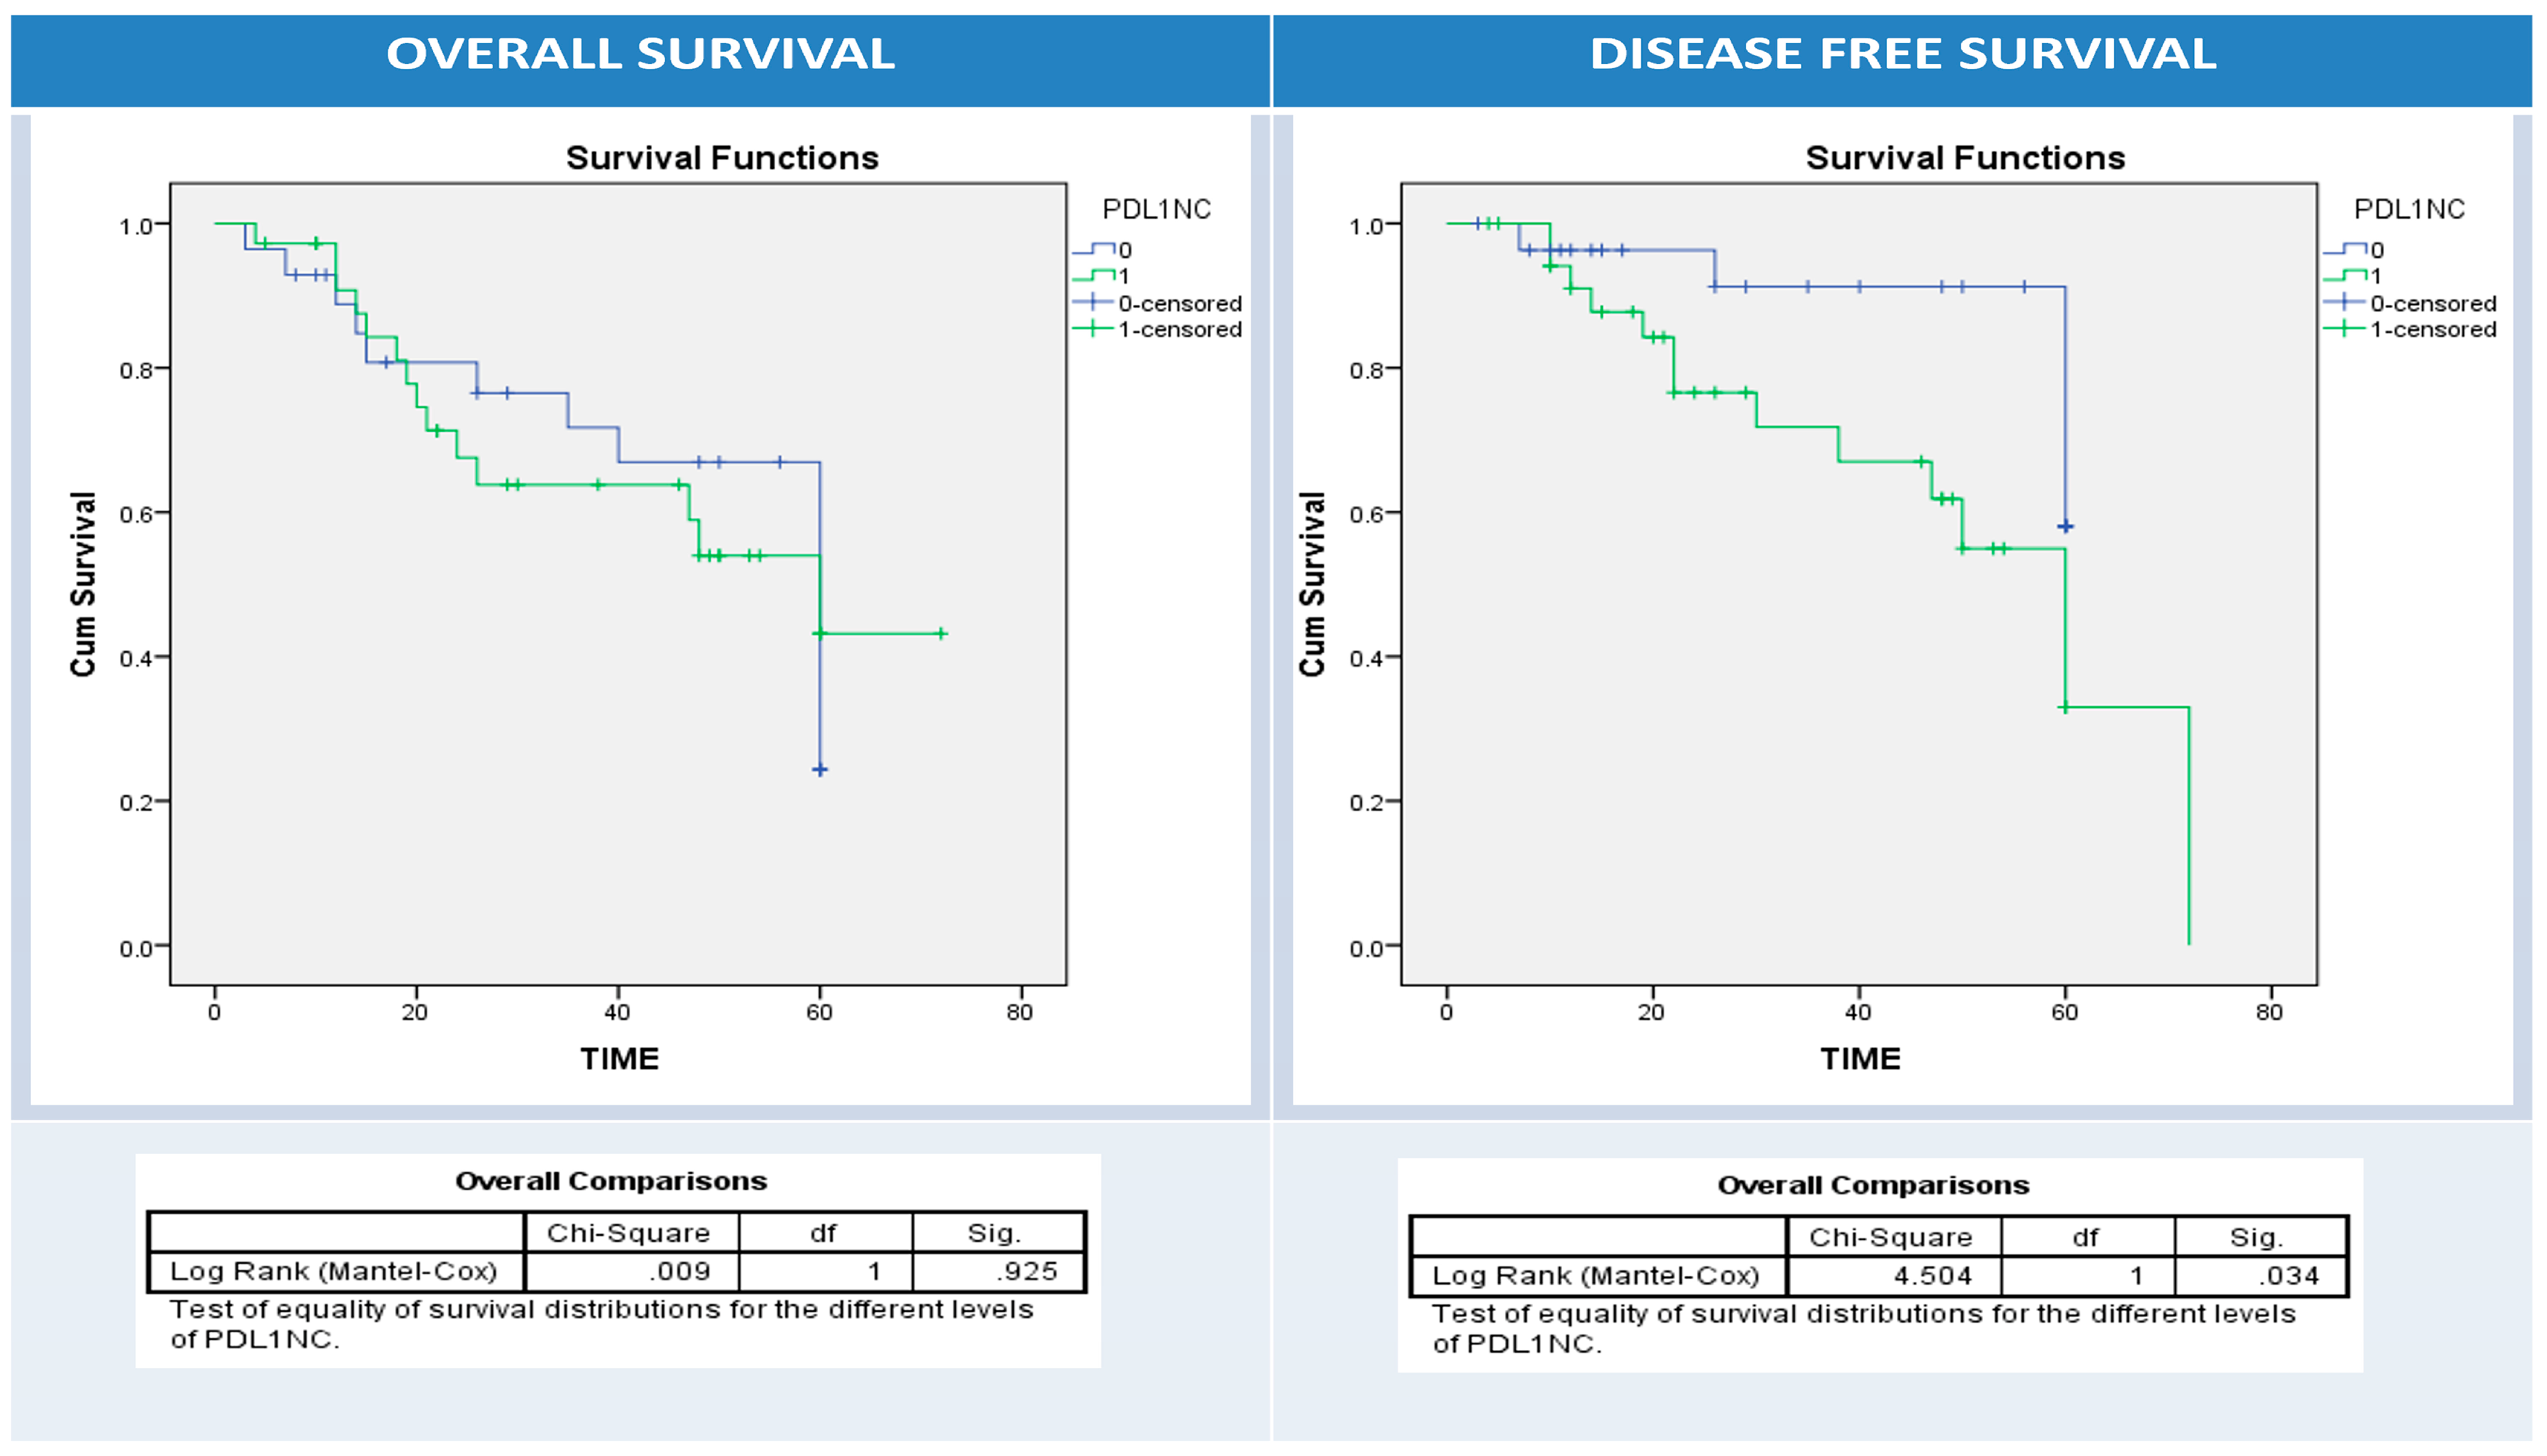
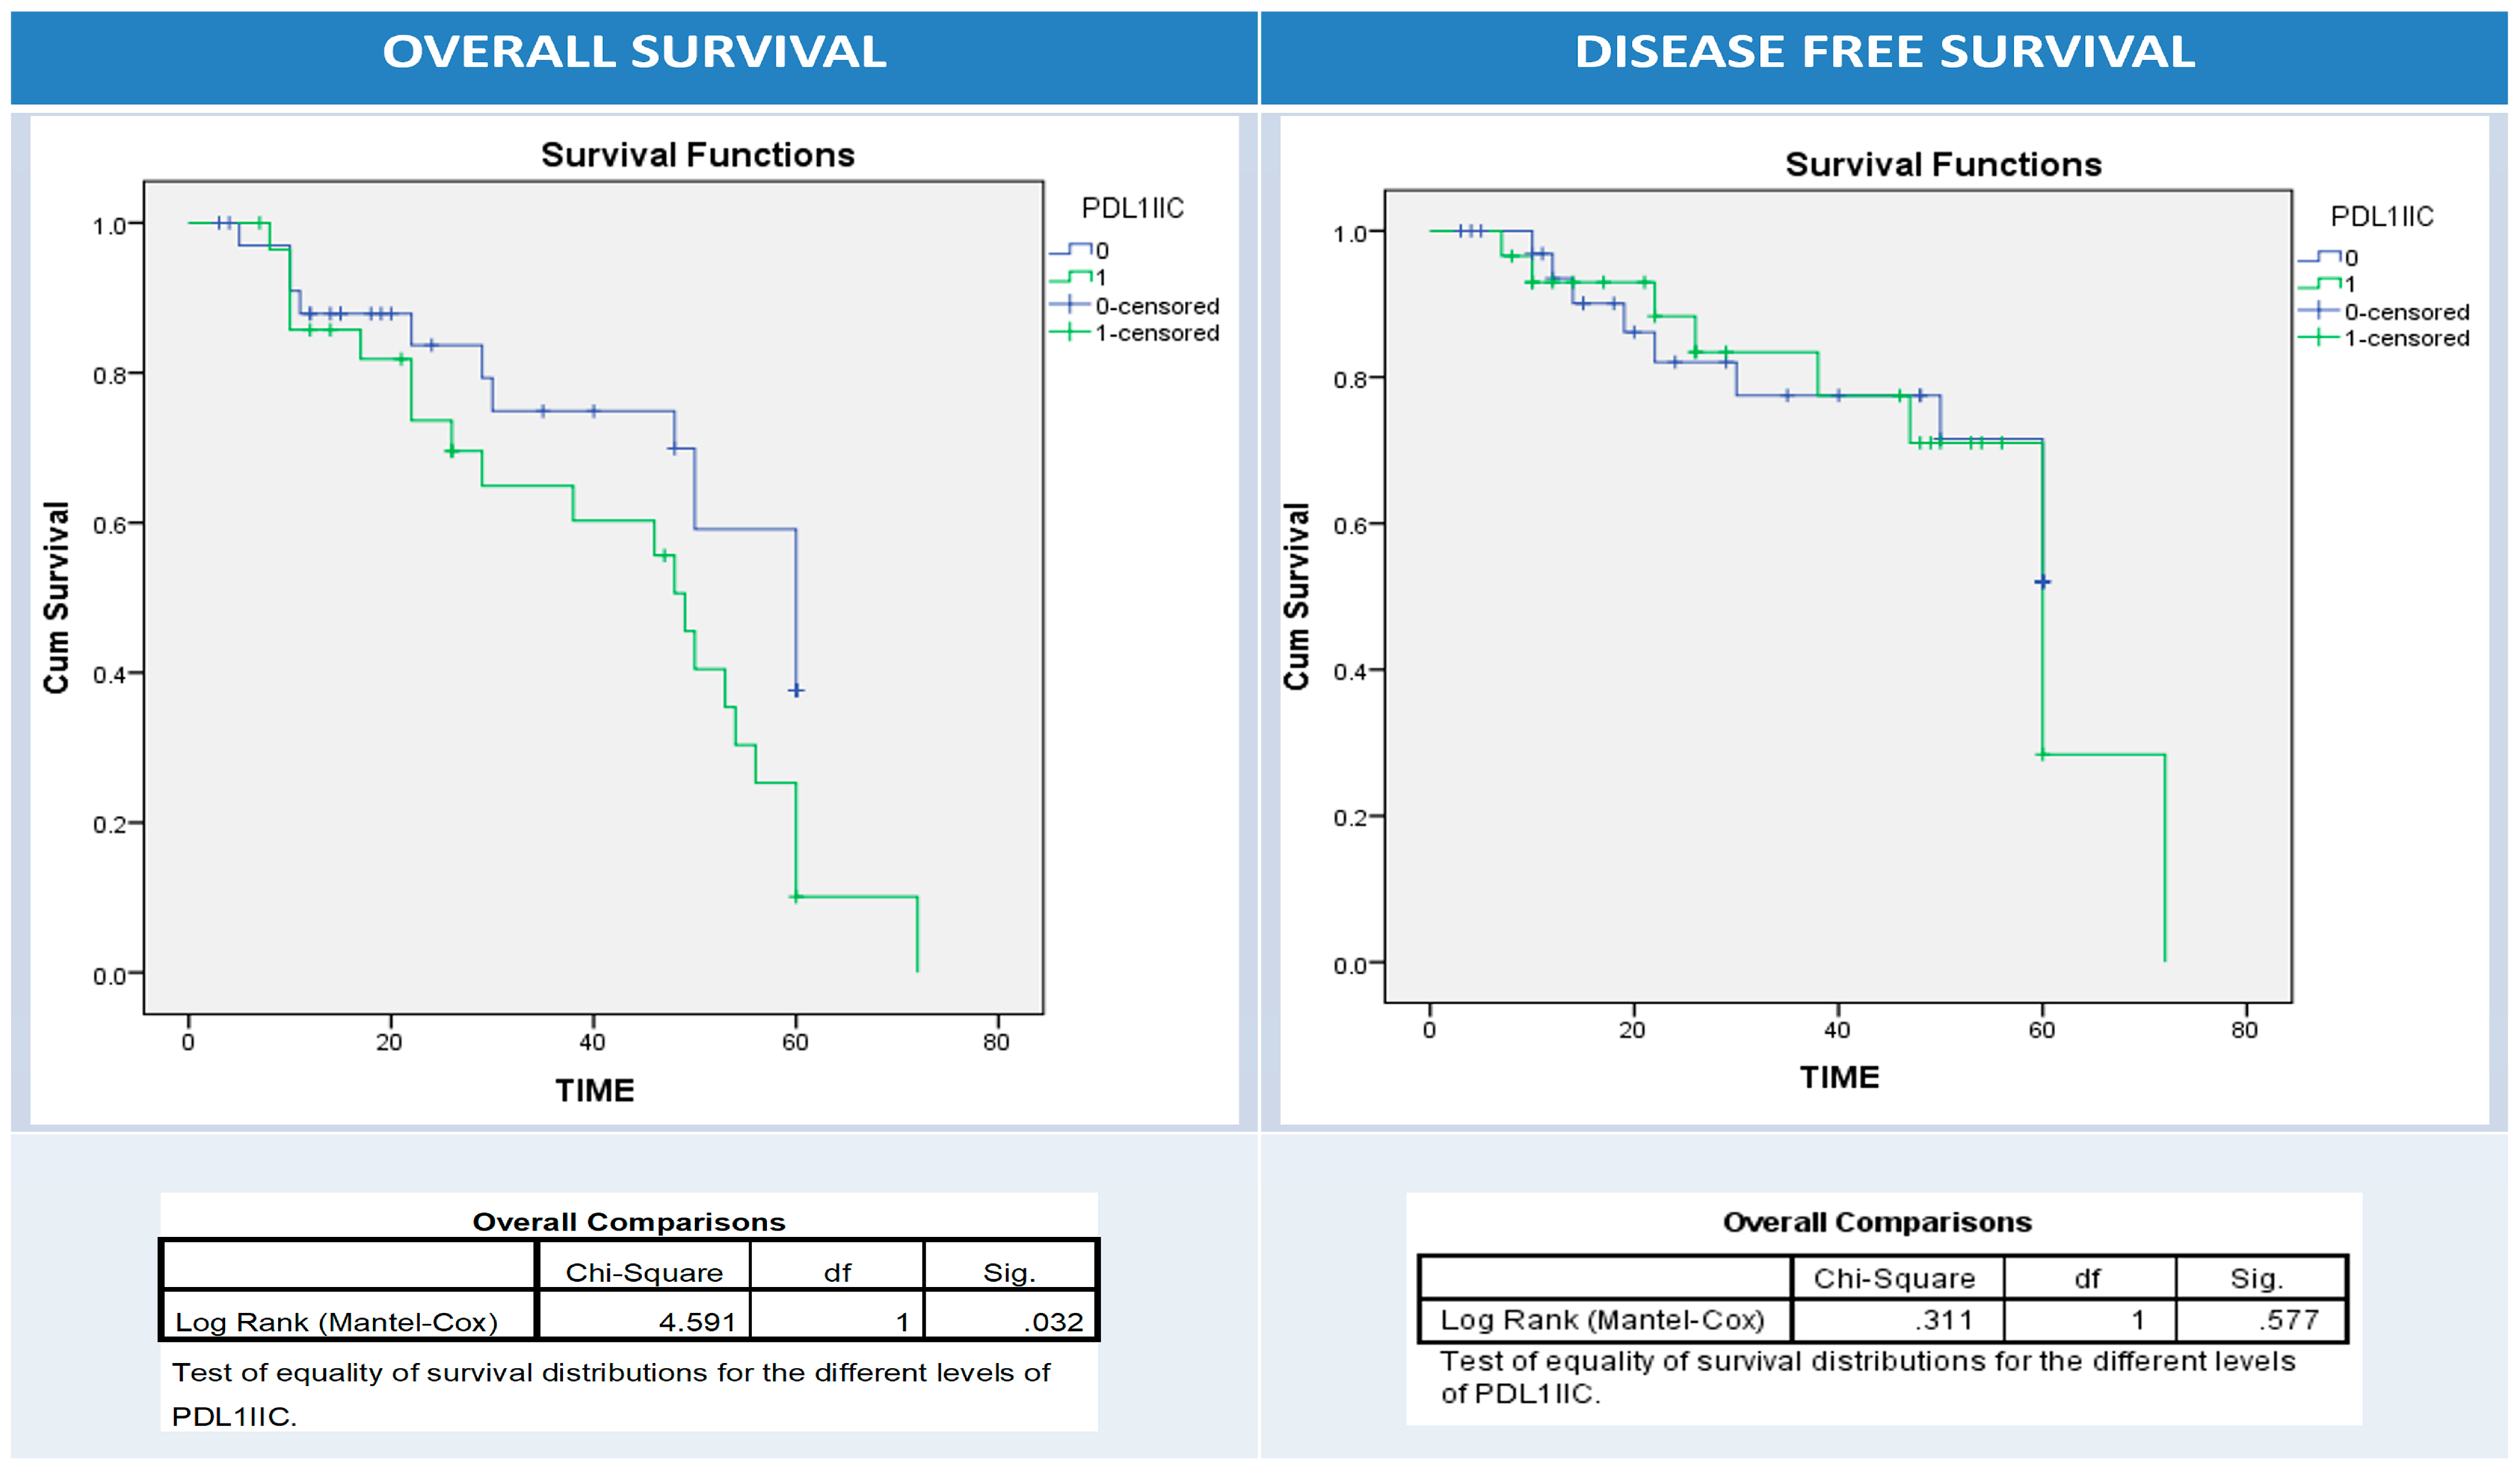
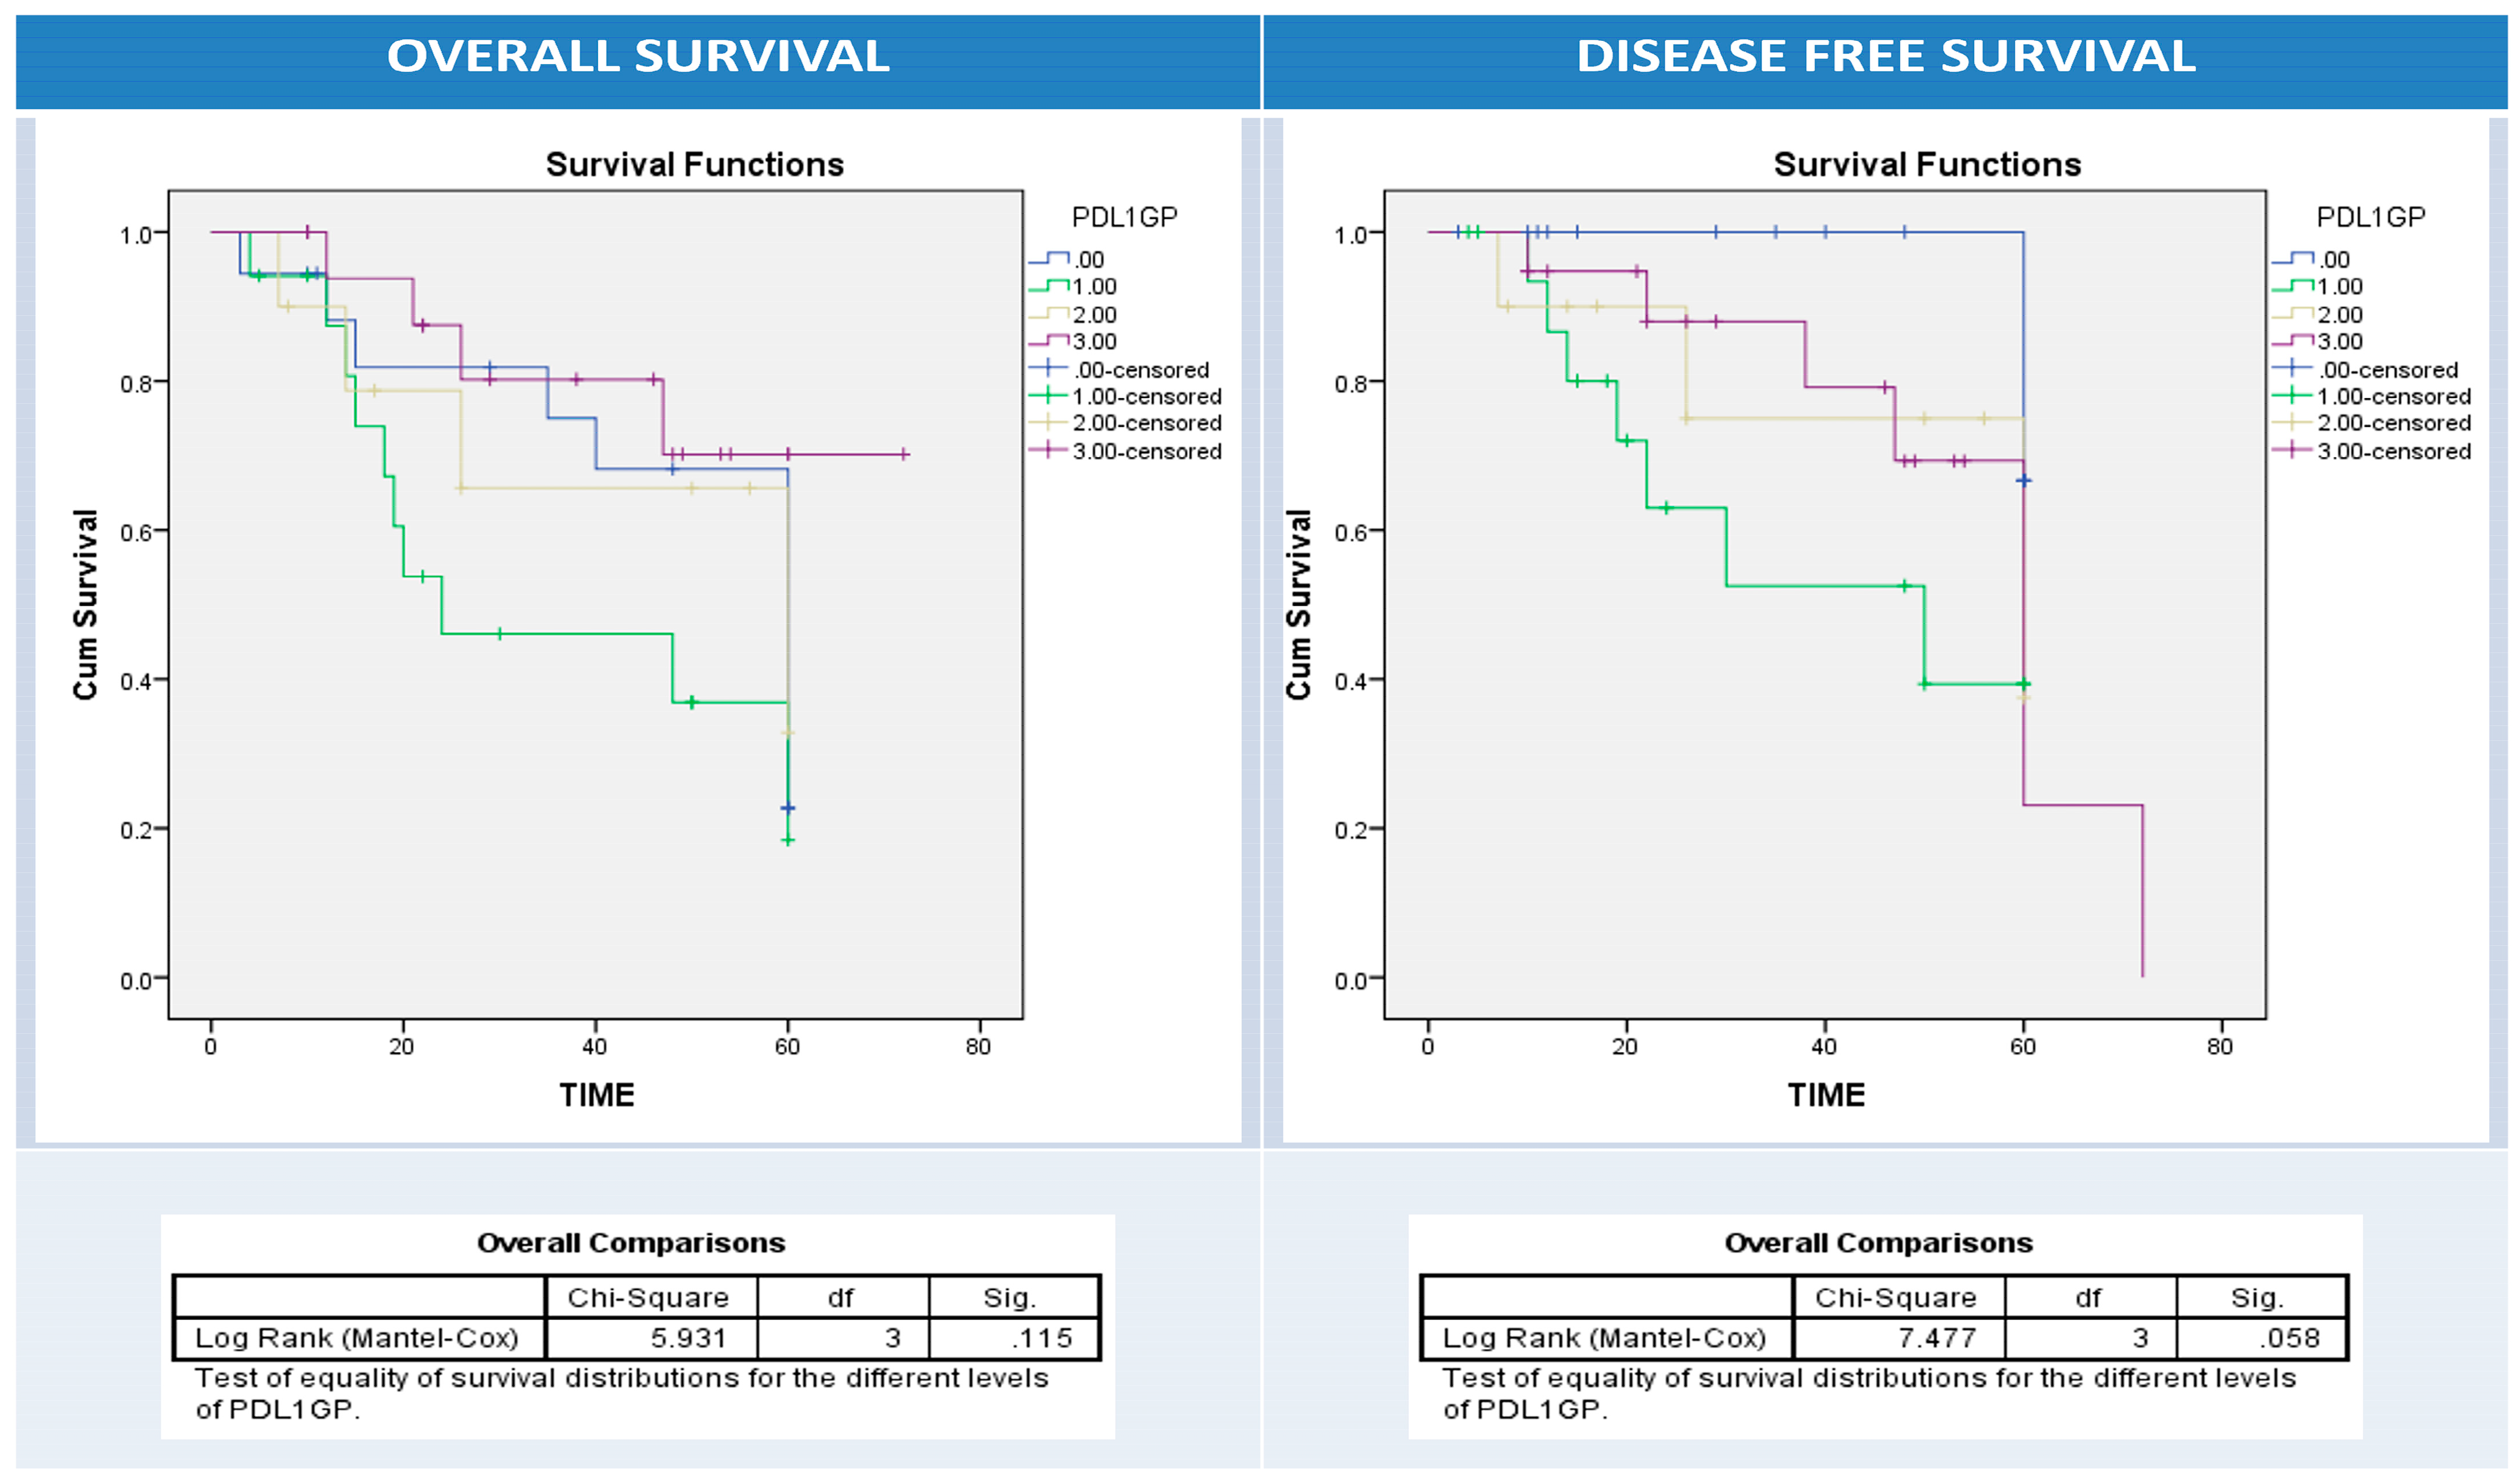
Using univariate survival analysis by Kaplan–Meier curve and the log-rank test, there was no significant difference in disease-free and overall survival rates among patient groups with different BRAF protein, IIC PD1, and PDL1 protein (NC, IIC, or combined pattern) expression patterns apart from BRAF protein expression and overall survival (p = 0.001), PDL1 overexpression in NC and disease-free survival (p = 0.034), and PDL1 overexpression in IIC and overall survival (p = 0.03) (Figure 5, Figure 6, Figure 7, Figure 8 and Figure 9).
Multivariate regression analysis using all clinical and pathological variables failed to detect PDL1 (IIC) and BRAF protein expressions as independent predictors for survival and relapse. However, tumor PDL1 expression can be used as an independent predictor of OS and DFS [OS: HR, 3.250; 95% CI, 1.088–9.713; p = 0.035 and DFS: HR, 2.241; 95% CI, 1.003–5.006; p = 0.049]. PD1 overexpression in stromal IICs was independently associated with short OS (HR: 0.233, 95% CI: 0.060–0.903, p = 0.035). In addition, the right-side location of CRC revealed an independent association with short overall survival (HR: 433.167, 95% CI: 1.437-130573.1, p = 0.037) (Table 6).

4. Discussion

The recently developed immunotherapeutic strategies have yielded remarkable clinical results in controlling tumor growth in many tumors. It showed the highest response in melanoma, renal cell carcinoma, non-small cell lung carcinoma, and microsatellite instability-high CRC [17,32]. The year 2017 witnessed the first US Food and Drug Administration (FDA) approval of immune checkpoint inhibitor (ICI) immunotherapy for the management of CRC [33]. However, PD1/PDL1 blockade therapy is significantly helpful only in a group of patients, and the others either show resistance or only respond transiently to this therapy [34]. So, identifying resistance mechanisms is crucial to enhance the reach of more responders to this therapy.
Also, accumulating evidence suggested that dysregulated BRAF expression has an immunosuppressive effect and a role in poor response to PD1/PDL1 checkpoint inhibitors targeted immunotherapy. In melanoma, there are mounting data that oncogenic BRAF contributes to immune escape, and several clinical trials combined BRAF inhibitors with immune checkpoint blockade [35]. For these considerations, IHC expression of PD1, PDL1, and BRAF proteins evaluation before therapy may help to determine patients that will benefit from immunotherapy and could be used as a base to design novel combination therapy (immunotherapy and BRAF inhibitors) for CRC.
BRAF is a protein kinase and part of the mitogen-activated protein (MAP) kinase signaling cascade, which involves the transduction of a growth signal from the cell membrane to the nucleus via a chain of protein kinases, and is responsible for cellular proliferation and survival [24]. Detection of BRAF in colon carcinoma has the potential as a prognostic marker and also as treatment target for new BRAF inhibitors, such as vemurafenib [35,36].
Genetic testing is expensive, with high-level laboratory requirements, and needs strict quality control and professional knowledge of molecular detection technology of PCR; hence, it is not conducive to clinical application in areas of limited resources. In contrast, IHC is economical, simple, and feasible. Some studies assessed the feasibility of IHC instead of PCR to detect the mutated BRAF and reported near-to-complete concordance between both techniques in various cancers, including colon carcinomas [37,38,39]. These results support using IHC as a simplified strategy to screen colorectal cancers in clinical practice [40].
Based on previous experience, we used immunohistochemistry to detect dysregulated protein BRAF expression. We followed the previous recommendation to consider diffuse cytoplasmic staining with moderate to intense staining in >80% of tumor cells as positive dysregulated expression; however, weak staining is negative, and heterogenous staining is equivocal [24]; however, using specific anti-BRAF monoclonal antibodies is recommended in future studies to uncover the mutational status of the tested samples.
BRAF protein expression was recorded in 25 cases (39.1%) in the current study with significant association with the advanced grade, lymph node state, Dukes staging, and the occurrence of relapse and short OS. From these results, we concluded that BRAF protein expression in CRC is a poor prognostic marker. These findings agree with the previous studies’ results in which the authors explored the BRAF gene and protein expressions, and found that these expressions were associated with poor prognostic parameters, including the advanced grade and T stage of the tumor, and short OS in the case of protein expression [24,41]. Our findings support the previous studies, which report the significant implication of BRAF in cancer and associate right-sided colon cancer with worse clinical outcomes. BRAF protein is a valuable biomarker for identifying patients who may benefit from a more individualized course of therapy [24,42]. We noticed occasional cytoplasmic and nuclear immunostaining for BRAF in normal mucosa cells (Figure 2). These findings should be interpreted with caution, as incomplete specificity of the anti-BRAF polyclonal antibodies used in the current work and the potential cross-reactivity with other epitopes could play part in this finding, and warrant further confirmatory studies that apply more specific monoclonal antibodies to differentiate mutant vs. wild BRAF protein.
Regarding PD1, positivity in IICs was observed in 64% of cases. PDL1 was expressed in tumor cells in 53.1% of cases, and IICs in 51.6% of cases. Significant correlation between PD1 positivity in IICs and early T stage, negative LN stage, early-stage Dukes, M0, and absence of relapse. These data reflected that immune cell PD1 expression is significantly associated with good prognostic pathological parameters, which agreed with Berntsson et al., who concluded that immune-specific PD1 is significantly associated with lower T and M stages, whatever the location of the tumor, as their study related the side to the prognostic impact of PD1 and PDL1 expressions [43].
As regards PDL1 protein expression in NC and IIC, positive PDL1 expressions in NC showed a significant association with aggressive clinicopathological parameters (advanced nodal stage and Dukes). These data agree with previous studies [4,21]. Juneja et al. confirmed that NC PDL1 could inhibit the antitumor immunity by inactivation of CD8+ TC sensitive to PD1 signaling, and lead to an increase in the aggressiveness of the tumor [21]. Shen et al. concluded a significant association of NC PDL1 expression with advanced cancer stage and lymphatic invasion based upon a meta-analysis of 3481 patients included in 10 studies [4]. However, Berntsson et al. confirmed that neoplastic cell expression of PDL1 was significantly associated with younger age and highly differentiated tumors, but this was in the right-side colon cancer only and not on the left side or in the total cohort study [43].
The IIC PDL1 expression was significantly associated with advanced nodal stage, metastasis, advanced Dukes, and short OS. These results were inconsistent with the Berntsson et al. findings, which confirmed that immune cell expression of PDL1 was significantly associated with lower T, N, and M stages [43]. Such type of difference in the results could be attributed to a large number of Berntsson et al. samples (557 cases) compared to ours (64 cases), the different monoclonal antibodies used, and the different cutoff points of positivity. In addition, the degree of staining intensity was considered in the current work, but not in the Berntsson et al. study [43].
Regarding the pattern of PDL1 expression and tumor immune microenvironment, our study identified four subsets (NC−/IIC−, NC+/IIC−, NC−/IIC+, and NC+/IIC+). We found that combined expression pattern group D was significantly associated with advanced LN and Dukes stage. This classification helps the oncologist select the patient candidate for immune therapy, as the first pattern (NC−/IIC−) will not benefit from the therapy, and the last pattern (group D) will be the ideal candidate for checkpoint inhibitors.
The Spearman Bivariate correlation test revealed a positive correlation between BRAF protein expression scores and positivity. In addition, the test revealed that NC PDL1 is only significantly correlated to the combined pattern of PDL1 expression. However, IIC PDL1 showed a strong positive correlation to the combined pattern of PDL1. BRAF protein expression score or positivity did not correlate with IIC PD1, NC PDL1, IIC PDL1, or the combined pattern of PDL1. These results were consistent with the Berntsson et al. study, both on the correlation between BRAF expression and both PD1 and PDL1 protein expressions [43]. From these results, we can suggest that BRAF protein assessment could be helpful for patients with CRC arranging for combined therapy (immunotherapy and BRAF inhibitors).
Significant heterogeneity in survival outcome characterizes colonic cancer patients with dysregulated BRAF expression due to the complex, and still not entirely fully elucidated, interactions between the clinical, genetic, and epigenetic landscape of BRAF expression [44]. Our study suggested the importance of testing patients for PD1 and PDL1 along with BRAF protein expression evaluation.
Multivariate regression analysis using all clinical and pathological variables failed to detect PD1 (IIC), PDL1 (IIC), and BRAF protein as independent predictors for survival and relapse. However, tumor PDL1 expression can independently predict OS and DFS. This finding was consistent with a recent Wang et al. meta-analysis, in which the meta-regression showed that “PD-L1 expression played a significant role on poor CRC OS (HR  =  1.95, 95% CI (1.92, 3.98)) and DFS (HR  =  2.14, 95% CI (0.73, 4.52))” and could independently predict a poor CRC prognosis [45].
Also, the multivariate analysis revealed that the right-side location of the CRC could be a potential predictor for the short OS. This result is congruent with the Baran et al. report, which emphasized that CRC is not a single entity, but its pathogenesis and treatment response could depend on the anatomical location (i.e., RT vs. LT side). Patients with left-sided CRC showed more response to “5-fluorouracil (5-FU)-based regimes” as one of the adjuvant chemotherapies and also to “anti-epidermal growth factor receptor therapy” as targeted therapy with a better prognosis. In comparison, patients with right-sided CRC showed poor response to conventional chemotherapies, but demonstrated more promising results with immunotherapies, as it is characterized by an increase in the antigenic load [46].
It is noteworthy to consider the limited sample size in this study and the absence of applying a BRAF mutation-specific assay. In this sense, large-scale studies using highly specific (monoclonal antibodies) assays for IHC analysis for the detection of the BRAF mutation are highly recommended. In addition, the adoption of the recent “WHO classification of the digestive system tumors” is warranted in future studies.

5. Conclusions

The current study concluded that overexpression of BRAF protein in colorectal carcinoma is a poor prognostic pathological marker. In addition, PDL1 expression in NC is considered an independent prognostic factor for DFS and OS. Our study can suggest that combined immunohistochemical assessment for BRAF protein, PD1, and PDL1 expression in CRC could be beneficial for selecting patients for future combined immunotherapy and BRAF inhibitors.

Author Contributions

Conceptualization, A.T.I., E.A.T., M.S.F. and N.A.S.; data curation, A.T.I., E.A.T., K.E., Z.E. (Ziad Emarah) and Z.E. (Ziad Ehab); formal analysis, E.E. and K.A.; funding acquisition, E.E., K.E., Z.E. (Ziad Emarah) and A.A.M.S.; investigation, A.T.I., M.S.F. and N.A.S.; methodology, E.A.T., K.E. and Z.E. (Ziad Emarah); project administration, E.A.T. and K.A.; resources, A.T.I., M.S.F., K.A., A.A.M.S. and Z.E. (Ziad Ehab); software, E.A.T., K.A. and N.A.S.; supervision, K.A., Z.E. (Ziad Emarah) and N.A.S.; validation, M.S.F., A.A.M.S., Z.E. (Ziad Ehab) and N.A.S.; visualization, A.T.I., E.E. and Z.E. (Ziad Emarah); writing—original draft, A.T.I., E.E., E.A.T., A.A.M.S. and N.A.S.; writing—review and editing, A.T.I., E.E., M.S.F., K.E. and N.A.S.. All authors have read and agreed to the published version of the manuscript.

Funding

This research received no external funding.

Institutional Review Board Statement

The study protocol was approved by the ethical committee of the Faculty of Medicine, Mansoura University, Mansoura, Egypt (approval no. R.21.02.1198.R1).

Informed Consent Statement

Not applicable, as the included specimens retrospectively were archived in the pathology lab.

Data Availability Statement

The data sets generated and/or analyzed during the current study are available from the corresponding author on reasonable request.

Conflicts of Interest

The authors declare no conflict of interest.

References

  1. Siegel, R.L.; Miller, K.D.; Jemal, A. Cancer statistics, 2019. CA Cancer J. Clin. 2019, 69, 7–34. [Google Scholar] [CrossRef] [Green Version]
  2. Rawla, P.; Sunkara, T.; Barsouk, A. Epidemiology of colorectal cancer: Incidence, mortality, survival, and risk factors. Prz. Gastroenterol. 2019, 14, 89–103. [Google Scholar] [CrossRef] [PubMed]
  3. Welch, H.G.; Robertson, D.J. Colorectal Cancer on the Decline--Why Screening Can’t Explain It All. N. Engl. J. Med. 2016, 374, 1605–1607. [Google Scholar] [CrossRef] [PubMed]
  4. Shen, Z.; Gu, L.; Mao, D.; Chen, M.; Jin, R. Clinicopathological and prognostic significance of PD-L1 expression in colorectal cancer: A systematic review and meta-analysis. World J. Surg. Oncol. 2019, 17, 4. [Google Scholar] [CrossRef] [PubMed] [Green Version]
  5. Mackenzie, R.; Kommoss, S.; Winterhoff, B.J.; Kipp, B.R.; Garcia, J.J.; Voss, J.; Halling, K.; Karnezis, A.; Senz, J.; Yang, W.; et al. Targeted deep sequencing of mucinous ovarian tumors reveals multiple overlapping RAS-pathway activating mutations in borderline and cancerous neoplasms. BMC Cancer 2015, 15, 415. [Google Scholar] [CrossRef] [Green Version]
  6. Isomoto, K.; Haratani, K.; Hayashi, H.; Shimizu, S.; Tomida, S.; Niwa, T.; Yokoyama, T.; Fukuda, Y.; Chiba, Y.; Kato, R.; et al. Impact of EGFR-TKI Treatment on the Tumor Immune Microenvironment in EGFR Mutation–Positive Non–Small Cell Lung Cancer. Clin. Cancer Res. 2020, 26, 2037–2046. [Google Scholar] [CrossRef]
  7. Salem, M.E.; Puccini, A.; Tie, J. Redefining Colorectal Cancer by Tumor Biology. Am. Soc. Clin. Oncol. Educ. Book 2020, 40, 1–13. [Google Scholar] [CrossRef] [PubMed]
  8. Claps, F.; Mir, M.C.; Zargar, H. Molecular markers of systemic therapy response in urothelial carcinoma. Asian J. Urol. 2021, 8, 376–390. [Google Scholar] [CrossRef]
  9. Mertens, L.S.; Claps, F.; Mayr, R.; Bostrom, P.J.; Shariat, S.F.; Zwarthoff, E.C.; Boormans, J.L.; Abas, C.; van Leenders, G.J.L.H.; Götz, S.; et al. Prognostic markers in invasive bladder cancer: FGFR3 mutation status versus P53 and KI-67 expression: A multi-center, multi-laboratory analysis in 1058 radical cystectomy patients. Urol. Oncol. 2022, 40, 110.e1–110.e9. [Google Scholar] [CrossRef]
  10. Mir, M.C.; Campi, R.; Loriot, Y.; Puente, J.; Giannarini, G.; Necchi, A.; Rouprêt, M.; on behalf of the EAU Section of Oncological Urology ESOU Board. Adjuvant Systemic Therapy for High-risk Muscle-invasive Bladder Cancer After Radical Cystectomy: Current Options and Future Opportunities. Eur. Urol. Oncol. 2022, 5, 726–731. [Google Scholar] [CrossRef] [PubMed]
  11. Högner, A.; Moehler, M. Immunotherapy in Gastric Cancer. Curr. Oncol. 2022, 29, 1559–1574. [Google Scholar] [CrossRef]
  12. Ralli, M.; Botticelli, A.; Visconti, I.C.; Angeletti, D.; Fiore, M.; Marchetti, P.; Lambiase, A.; de Vincentiis, M.; Greco, A. Immunotherapy in the Treatment of Metastatic Melanoma: Current Knowledge and Future Directions. J. Immunol. Res. 2020, 2020, 9235638. [Google Scholar] [CrossRef]
  13. Punekar, S.R.; Shum, E.; Grello, C.M.; Lau, S.C.; Velcheti, V. Immunotherapy in non-small cell lung cancer: Past, present, and future directions. Front. Oncol. 2022, 12, 877594. [Google Scholar] [CrossRef] [PubMed]
  14. Deleuze, A.; Saout, J.; Dugay, F.; Peyronnet, B.; Mathieu, R.; Verhoest, G.; Bensalah, K.; Crouzet, L.; Laguerre, B.; Belaud-Rotureau, M.A.; et al. Immunotherapy in Renal Cell Carcinoma: The Future Is Now. Int. J. Mol. Sci. 2020, 21, 2532. [Google Scholar] [CrossRef] [PubMed] [Green Version]
  15. Rhea, L.P.; Mendez-Marti, S.; Kim, D.; Aragon-Ching, J.B. Role of immunotherapy in bladder cancer. Cancer Treat. Res. Commun. 2021, 26, 100296. [Google Scholar] [CrossRef] [PubMed]
  16. Xue, C.; Xu, Y.; Ye, W.; Xie, Q.; Gao, H.; Xu, B.; Zhang, D.; Jiang, J. Expression of PD-L1 in ovarian cancer and its synergistic antitumor effect with PARP inhibitor. Gynecol. Oncol. 2020, 157, 222–233. [Google Scholar] [CrossRef] [PubMed]
  17. Johnson, R.L. Robbins Basic Pathology. Arch. Pathol. Lab. Med. 2003, 127, 1532. [Google Scholar] [CrossRef]
  18. Yu, Y.; Sitaraman, S.; Gewirtz, A.T. Intestinal epithelial cell regulation of mucosal inflammation. Immunol. Res. 2004, 29, 55–68. [Google Scholar] [CrossRef]
  19. Gianchecchi, E.; Delfino, D.V.; Fierabracci, A. Recent insights into the role of the PD-1/PD-L1 pathway in immunological tolerance and autoimmunity. Autoimmun. Rev. 2013, 12, 1091–1100. [Google Scholar] [CrossRef]
  20. Lim, S.O.; Li, C.W.; Xia, W.; Cha, J.H.; Chan, L.C.; Wu, Y.; Chang, S.S.; Lin, W.C.; Hsu, J.M.; Hsu, Y.H.; et al. Deubiquitination and Stabilization of PD-L1 by CSN5. Cancer Cell 2016, 30, 925–939. [Google Scholar] [CrossRef]
  21. Juneja, V.R.; McGuire, K.A.; Manguso, R.T.; LaFleur, M.W.; Collins, N.; Haining, W.N.; Freeman, G.J.; Sharpe, A.H. PD-L1 on tumor cells is sufficient for immune evasion in immunogenic tumors and inhibits CD8 T cell cytotoxicity. J. Exp. Med. 2017, 214, 895–904. [Google Scholar] [CrossRef] [Green Version]
  22. Zuazo, M.; Gato-Cañas, M.; Llorente, N.; Ibañez-Vea, M.; Arasanz, H.; Kochan, G.; Escors, D. Molecular mechanisms of programmed cell death-1 dependent T cell suppression: Relevance for immunotherapy. Ann. Transl. Med. 2017, 5, 385. [Google Scholar] [CrossRef] [Green Version]
  23. Kamphorst, A.O.; Wieland, A.; Nasti, T.; Yang, S.; Zhang, R.; Barber, D.L.; Konieczny, B.T.; Daugherty, C.Z.; Koenig, L.; Yu, K.; et al. Rescue of exhausted CD8 T cells by PD-1-targeted therapies is CD28-dependent. Science 2017, 355, 1423–1427. [Google Scholar] [CrossRef] [Green Version]
  24. Ibrahiem, A.T.; Fawzy, M.S.; Abu AlSel, B.T.; Toraih, E.A. Prognostic value of BRAF/MIR-17 signature and B-Raf protein expression in patients with colorectal cancer: A pilot study. J. Clin. Lab. Anal. 2021, 35, e23679. [Google Scholar] [CrossRef]
  25. Di Nicolantonio, F.; Martini, M.; Molinari, F.; Sartore-Bianchi, A.; Arena, S.; Saletti, P.; De Dosso, S.; Mazzucchelli, L.; Frattini, M.; Siena, S.; et al. Wild-type BRAF is required for response to panitumumab or cetuximab in metastatic colorectal cancer. J. Clin. Oncol. 2008, 26, 5705–5712. [Google Scholar] [CrossRef] [PubMed]
  26. Bai, Y.; Guo, T.; Huang, X.; Wu, Q.; Niu, D.; Ji, X.; Feng, Q.; Li, Z.; Kakudo, K. In papillary thyroid carcinoma, expression by immunohistochemistry of BRAF V600E, PD-L1, and PD-1 is closely related. Virchows Arch. 2018, 472, 779–787. [Google Scholar] [CrossRef]
  27. Atefi, M.; Avramis, E.; Lassen, A.; Wong, D.J.; Robert, L.; Foulad, D.; Cerniglia, M.; Titz, B.; Chodon, T.; Graeber, T.G.; et al. Effects of MAPK and PI3K pathways on PD-L1 expression in melanoma. Clin. Cancer Res. 2014, 20, 3446–3457. [Google Scholar] [CrossRef] [PubMed] [Green Version]
  28. Schmiegel, W.; Pox, C.; Reinacher-Schick, A.; Adler, G.; Arnold, D.; Fleig, W.; Fölsch, U.R.; Frühmorgen, P.; Graeven, U.; Heinemann, V.; et al. S3 guidelines for colorectal carcinoma: Results of an evidence-based consensus conference on February 6/7, 2004 and June 8/9, 2007 (for the topics IV, VI and VII). Z. Gastroenterol. 2010, 48, 65–136. [Google Scholar] [CrossRef] [Green Version]
  29. Bosman, F.T.; Carneiro, F.; Hruban, R.H.; Theise, N.D. WHO Classification of Tumours of the Digestive System; World Health Organization: Geneva, Switzerland, 2010. [Google Scholar]
  30. Akkoca, A.N.; Yanık, S.; Ozdemir, Z.T.; Cihan, F.G.; Sayar, S.; Cincin, T.G.; Cam, A.; Ozer, C. TNM and Modified Dukes staging along with the demographic characteristics of patients with colorectal carcinoma. Int. J. Clin. Exp. Med. 2014, 7, 2828–2835. [Google Scholar]
  31. Shan, T.; Chen, S.; Wu, T.; Yang, Y.; Li, S.; Chen, X. PD-L1 expression in colon cancer and its relationship with clinical prognosis. Int. J. Clin. Exp. Pathol. 2019, 12, 1764–1769. [Google Scholar] [PubMed]
  32. Tolba, M.F. Revolutionizing the landscape of colorectal cancer treatment: The potential role of immune checkpoint inhibitors. Int. J. Cancer 2020, 147, 2996–3006. [Google Scholar] [CrossRef]
  33. Sharma, P.; Hu-Lieskovan, S.; Wargo, J.A.; Ribas, A. Primary, Adaptive, and Acquired Resistance to Cancer Immunotherapy. Cell 2017, 168, 707–723. [Google Scholar] [CrossRef] [PubMed] [Green Version]
  34. Nowicki, T.S.; Hu-Lieskovan, S.; Ribas, A. Mechanisms of Resistance to PD-1 and PD-L1 Blockade. Cancer J. 2018, 24, 47–53. [Google Scholar] [CrossRef]
  35. Boni, A.; Cogdill, A.P.; Dang, P.; Udayakumar, D.; Njauw, C.N.; Sloss, C.M.; Ferrone, C.R.; Flaherty, K.T.; Lawrence, D.P.; Fisher, D.E.; et al. Selective BRAFV600E inhibition enhances T-cell recognition of melanoma without affecting lymphocyte function. Cancer Res. 2010, 70, 5213–5219. [Google Scholar] [CrossRef] [PubMed] [Green Version]
  36. van Brummelen, E.M.J.; de Boer, A.; Beijnen, J.H.; Schellens, J.H.M. Mutations as Predictive Biomarker for Response to Anti-EGFR Monoclonal Antibodies. Oncologist 2017, 22, 864–872. [Google Scholar] [CrossRef] [Green Version]
  37. Rössle, M.; Sigg, M.; Rüschoff, J.H.; Wild, P.J.; Moch, H.; Weber, A.; Rechsteiner, M.P. Ultra-deep sequencing confirms immunohistochemistry as a highly sensitive and specific method for detecting BRAF V600E mutations in colorectal carcinoma. Virchows Arch. 2013, 463, 623–631. [Google Scholar] [CrossRef] [PubMed] [Green Version]
  38. Sinicrope, F.A.; Smyrk, T.C.; Tougeron, D.; Thibodeau, S.N.; Singh, S.; Muranyi, A.; Shanmugam, K.; Grogan, T.M.; Alberts, S.R.; Shi, Q. Mutation-specific antibody detects mutant BRAFV600E protein expression in human colon carcinomas. Cancer 2013, 119, 2765–2770. [Google Scholar] [CrossRef] [Green Version]
  39. Hang, J.F.; Li, A.F.; Chang, S.C.; Liang, W.Y. Immunohistochemical detection of the BRAF V600E mutant protein in colorectal cancers in Taiwan is highly concordant with the molecular test. Histopathology 2016, 69, 54–62. [Google Scholar] [CrossRef] [PubMed]
  40. Gavin, P.G.; Colangelo, L.H.; Fumagalli, D.; Tanaka, N.; Remillard, M.Y.; Yothers, G.; Kim, C.; Taniyama, Y.; Kim, S.I.; Choi, H.J.; et al. Mutation profiling and microsatellite instability in stage II and III colon cancer: An assessment of their prognostic and oxaliplatin predictive value. Clin. Cancer Res. 2012, 18, 6531–6541. [Google Scholar] [CrossRef] [Green Version]
  41. Brennan, D.F.; Dar, A.C.; Hertz, N.T.; Chao, W.C.; Burlingame, A.L.; Shokat, K.M.; Barford, D. A Raf-induced allosteric transition of KSR stimulates phosphorylation of MEK. Nature 2011, 472, 366–369. [Google Scholar] [CrossRef]
  42. Capper, D.; Berghoff, A.S.; Magerle, M.; Ilhan, A.; Wöhrer, A.; Hackl, M.; Pichler, J.; Pusch, S.; Meyer, J.; Habel, A.; et al. Immunohistochemical testing of BRAF V600E status in 1,120 tumor tissue samples of patients with brain metastases. Acta Neuropathol. 2012, 123, 223–233. [Google Scholar] [CrossRef] [PubMed]
  43. Berntsson, J.; Eberhard, J.; Nodin, B.; Leandersson, K.; Larsson, A.H.; Jirström, K. Expression of programmed cell death protein 1 (PD-1) and its ligand PD-L1 in colorectal cancer: Relationship with sidedness and prognosis. Oncoimmunology 2018, 7, e1465165. [Google Scholar] [CrossRef] [PubMed] [Green Version]
  44. Fanelli, G.N.; Dal Pozzo, C.A.; Depetris, I.; Schirripa, M.; Brignola, S.; Biason, P.; Balistreri, M.; Dal Santo, L.; Lonardi, S.; Munari, G.; et al. The heterogeneous clinical and pathological landscapes of metastatic. Cancer Cell Int. 2020, 20, 30. [Google Scholar] [CrossRef]
  45. Wang, S.; Yuan, B.; Wang, Y.; Li, M.; Liu, X.; Cao, J.; Li, C.; Hu, J. Clinicopathological and prognostic significance of PD-L1 expression in colorectal cancer: A meta-analysis. Int. J. Color. Dis. 2021, 36, 117–130. [Google Scholar] [CrossRef]
  46. Baran, B.; Mert Ozupek, N.; Yerli Tetik, N.; Acar, E.; Bekcioglu, O.; Baskin, Y. Difference Between Left-Sided and Right-Sided Colorectal Cancer: A Focused Review of Literature. Gastroenterol. Res. 2018, 11, 264–273. [Google Scholar] [CrossRef] [PubMed]
Figure 1. Consort flow diagram for the selection of the study cohort.
Diagnostics 13 00237 g001
Figure 2. Immunohistochemical staining of colonic adenocarcinoma for BRAF protein showed aberrant cytoplasmic expression in the adjacent non-neoplastic colonic mucosa ((A) × 200). Colonic adenocarcinoma did not express staining for BRAF protein ((B) × 400), colonic adenocarcinoma expressed diffuse strong cytoplasmic staining ((C) × 200), while other colonic adenocarcinoma showed diffuse strong cytoplasmic staining associated nuclear staining for BRAF protein ((D) × 400).
Diagnostics 13 00237 g002
Figure 3. Immunohistochemical staining of colonic adenocarcinoma for PD1. Adjacent non-neoplastic colonic mucosa showed positive staining of the mucosal lymphocytes for PD1 ((A) ×400), G1 adenocarcinoma showed positive staining of intratumoral immune cells for PD1 (blue arrow) with no expression in tumor cells (yellow arrow) ((B) × 200 and (C) × 400). In addition, G3 adenocarcinoma showed expression of PD1 on intratumoral immune cells (blue arrow) with negative expressions on tumor cells (yellow arrow) ((D) × 400). N.B., as the lymphocytes have little cytoplasm, the staining appears mainly cytoplasmic.
Diagnostics 13 00237 g003
Figure 4. Immunohistochemical staining of colonic adenocarcinoma for PDL1. Positive expressions of PDL1 on tumor cells (yellow arrow) and intertumoral lymphocytes in G1 colonic adenocarcinoma (blue arrow) were observed ((A) ×200 and (B) × 400). G2 adenocarcinoma showed moderate expression of PDL1 on intratumor immune cells (blue arrow) and tumor cells (yellow arrow) (C) × 400). The expression is mainly cytoplasmic; however, in the photo ((D) × 400), the expression of PDL1 in tumor cells was mainly membranous (yellow arrow) with no expression on intratumor immune cells (blue arrow). In addition, G3 adenocarcinoma showed moderate expression of PDL1 on tumor cells (yellow arrow in panel (F)) ((E) × 200 and (F) × 400).
Diagnostics 13 00237 g004
Figure 5. Kaplan–Meier survival curves for overall (right panel) and disease-free survival (left panel) according to BRAF expression (0: blue (-ve BRAF), 1: green (BRAF overexpression)). Log Rank test (Mantel–Cox) was used.
Diagnostics 13 00237 g005
Figure 6. Kaplan–Meier survival curves for overall (right panel) and disease-free survival (left panel) according to IIC PD1 expression (0: blue (-ve PD1 IIC); 1: green (+ve PD1 IIC)). Log Rank test (Mantel–Cox) was used.
Diagnostics 13 00237 g006
Figure 7. Kaplan–Meier survival curves for overall (right panel) and disease-free survival (left panel) according to neoplastic cells (NC) PDL1 expression (0: blue (-ve PDL1 NC); 1: green (+ve PDL1 NC)). Log Rank test (Mantel–Cox) was used.
Diagnostics 13 00237 g007
Figure 8. Kaplan–Meier survival curves for overall (right panel) and disease-free survival (left panel) according to intratumor immune cells (IIC) PDL1 expression (0: blue (-ve PDL1 IIC); 1: green (+ve PDL1 IIC)). Log Rank test (Mantel–Cox) was used.
Diagnostics 13 00237 g008
Figure 9. Kaplan–Meier survival curves for overall (right panel) and disease-free survival (left panel) according to combined PDL1 expression pattern (NC−IIC). 0: blue (NC−IIC−); 1.00: green (NC+ IIC); 2.00: yellow (NC−IIC+); 3: purple (NC+IIC+). Log Rank test (Mantel–Cox) was used.
Diagnostics 13 00237 g009
Table 1. The clinicopathological characteristics of the study cases.
Number 64 (100)
Age (years)Mean ± SD57.3 ± 12.5
≤5529 (45.3)
>5535 (54.7)
SexF29 (45.3)
M35 (54.7)
LateralityRT52 (81.3)
LT12 (18.8)
GradeG19 (14.1)
G238 (59.4)
G317 (26.5)
T stageT15 (7.8)
T215 (23.4)
T340 (62.5)
T44 (6.3)
N stageN037 (57.8)
N124 (37.5)
N23 (4.7)
M stageM059 (92.2)
M15 (7.8)
LVINo35 (45.3)
Yes29 (54.7)
DukesA10 (15.6)
B26 (40.6)
C23 (35.9)
D5 (7.8)
A+B35 (54.7)
C+D29 (45.3)
RelapseNo44 (60.9)
Yes20 (39.1)
AliveDead35 (45.3)
Survived29 (54.7)
BRAF proteinNegative39 (60.9)
Positive25 (39.1)
Score 039 (60.9)
Score 111 (17.2)
Score 29 (14.1)
Score 35 (7.8)
PD1-IICNegative23 (35.9)
Positive41 (64.1)
PDL1-NCNegative30 (46.9)
Positive34 (53.1)
PDL1-IICNegative31 (48.4)
Positive33 (51.6)
Data are represented as frequency (percentage) and/or mean ± standard deviation (SD). T; tumor, N; lymph node; M; metastasis (distant); LVI; lymphovascular invasion, IIC = infiltrating immune cells, NC = neoplastic cells.
Table 2. Association of BRAF protein expression status and clinicopathological prognostic factors of colorectal cancer.
VariableTotal
64 (100)
BRAF Protein Expressionp-Value
Negative
N = 39
Positive
N = 25
Age (y)Mean 57.9 ± 13.458 ± 110.9
Age Group≤552917120.7
>55352213
SexF2918110.8
M352114
LateralityRt5230220.5
Lt1293
GradeG19720.04
G2382513
G317710
T stageT15230.5
T21587
T3402812
T4413
N stageN0373160.00
N124717
N2312
M stageM05936230.9
M1532
LVINo3525100.06
Yes291415
DukesA-B352870.001
C-D291118
RelapseNo4431130.02
Yes20812
OSDead3514210.00
Survived29254
Data are presented as frequency (percentage) and/or mean ± standard deviation (SD). Two-sided Chi-square and Kruskal–Wallis tests were used. Bold values indicate a statistically significant p-value below 0.05. T: tumor, N: lymph node, M: metastasis (distant); LVI: lymphovascular invasion, OS: overall survival, Rt: Right, Lt: Left.
Table 3. Association of PD1 expression in IIC and PDL1 expression in NC and IIC and clinicopathological prognostic factors of colorectal cancer.
VariableTotalPD1-IICpPDL1-NCpPDL1-IICp
NegativePositiveNegativePositiveNegativePositive
N 6423412836 3529
Age M ± SD 58.7 ± 13.657.5 ± 12.10.758.3 ± 1357.6 ± 12.40.859.3 ± 12.156.3 ± 13.20.4
≤552910190.812170.714150.3
>5535132216192114
SexF2910190.814150.516130.9
M35132214211916
LocationRt4719330.821310.228240.7
Lt12487575
GradeG19270.3540.163
G2381820182021170.3
G31731451289
T stageT15050.02230.6140.5
T2155108796
T340142616242317
T44402222
T1+T2174130.21070.11070.6
T3+T447192818292522
N stageN0378290.0022150.0035120.00
N12413116181014
N23210303
M stageM05918410.0027320.235240.01
M15501405
LVINo3513220.818170.122130.1
Yes29101910191316
DukesA10370.00820.00640.00
B263231412206
C231211518914
D5501405
A-B356290.0022130.0025100.00
C-D2917126231019
RelapseNo4412320.0322220.125190.6
Yes201196141010
AliveDead3514210.413220.214210.01
Survived299201514218
Data are presented as frequency (percentage) and/or mean (M) ± standard deviation (SD). Student’s t-test, Chi-square, and Fisher’s Exact test were used. Bold values indicate a statistically significant p-value below 0.05. T: tumor, N: lymph node, M: metastasis (distant); LVI: lymphovascular emboli, OS: overall survival, Rt: Right, Lt: Left, NC: neoplastic cells, IIC: infiltrating immune cell.
Table 4. Association of combined expression patterns of PDL-1 in NC and IIC and clinicopathological prognostic factors of colon adenocarcinomas.
Variable PDL1p-Value
NC−/IIC−NC+/IIC−NC−/IIC+NC+/IIC+
Number 18171019
Age (y)≤5529775100.8
>5535111059
SexF2988670.7
M35109412
LateralityRT5213158160.6
LT125223
GradeG1951030.3
G238101189
G3173527
T stageT1510130.5
T2156324
T3401013611
T441111
T1-21773340.4
T3-44711714715
N stageNo371510750.002
N12437311
N230003
M stageNo5918179150.05
Yes50014
LVINo351210670.3
Yes2967412
DukesA1051310.001
B2611933
C2327311
D50014
A-B35169640.001
C-D2928415
RelapseNo4415107120.4
Yes203737
AliveDead35776150.05
Survived29111044
Data are presented as frequency (percentage). Chi-square and Fisher’s Exact tests were used. Bold values indicate a statistically significant p-value below 0.05. T: tumor, N: lymph node, M: metastasis (distant); LVI: lymphovascular invasion, OS: overall survival, RT: Right, LT: Left, NC: neoplastic cells, IIC: infiltrating immune cells.
Table 5. Correlation between IIC PD1, NC PDL1, IIC PDL1, combined PDL1, and BRAF protein expression in colon adenocarcinomas.
BRAF Protein ScoreBRAF Protein PositivityIIC PD1NC PDL1IIC PDL1PDL1gp
BRAF protein ScoreCorrelation Coefficient1.0000.966 **−0.1240.1810.1390.191
Sig. (2-tailed).0.0000.3290.1520.2740.132
N646464646464
BRAF protein PositiveCorrelation Coefficient0.966 **1.000−0.1350.1900.1720.222
Sig. (2-tailed)0.000 0.2890.1330.1740.078
N646464646464
IIC PD1Correlation Coefficient−0.124−0.1351.0000.062−0.234−0.172
Sig. (2-tailed)0.3290.289.0.6290.0630.174
N646464646464
NC PDL1Correlation Coefficient0.1810.1900.0621.0000.1700.591 **
Sig. (2-tailed)0.1520.1330.629.0.1790.000
N646464646464
IIC PDL1Correlation Coefficient0.1390.172−0.2340.1701.0000.895 **
Sig. (2-tailed)0.2740.1740.0630.179.0.000
N646464646464
PDL1gpCorrelation Coefficient0.1910.222−0.1720.591 **0.895 **1.000
Sig. (2-tailed)0.1320.0780.1740.0000.000.
N646464646464
Data are presented as frequency (percentage). ** A bivariate Spearman correlation test was used. Bold values indicate a statistically significant p-value below 0.05. NC: neoplastic cells, IIC: infiltrating immune cells, gp: group.
Table 6. Cox proportional hazard regression analysis of overall and disease-free survival among patients with colon adenocarcinomas.
OSDFS
Exp(B)95.0% CI for Exp(B)Sig.Exp(B)95.0% CI for Exp(B)Sig.
LowerUpperLowerUpper
Age (>55 vs ≤55)2.3430.6608.3200.1881.2400.5093.0220.636
Sex1.8870.6095.8420.2711.9310.8794.2440.101
Location (left vs. right)433.21.437130573.1130.03711.1390.340364.50.176
Grade (G3 vs G1/2)0.5120.1801.4610.2110.5890.3131.1080.100
T stage11.4821.49188.3930.0190.9470.3692.4310.909
LN stage0.8150.0689.8220.8720.5470.0963.1310.498
Metastasis0.1840.0048.6930.3900.9400.07212.2630.962
LVI2.5030.7038.9050.1571.2720.4463.6270.653
Dukes Staging0.8100.1006.5360.8430.8310.2053.3640.795
BRAF Score0.0740.0031.6430.1001.3260.4893.5910.579
BRAF Positive11.4050.0761711.90.3410.5120.0604.3810.541
PD1 stroma0.2330.0600.9030.0351.0560.3333.3520.926
PDL1 tissue3.2501.0889.7130.0352.2411.0035.0060.049
PDL1stroma0.3800.1021.4110.1481.1310.4802.6680.778
Bold values indicate a statistically significant p-value < 0.05. OS, overall survival; DFS, disease-free survival, T: tumor, LN: lymph node, LVI: lymphovascular invasion, CI: confidence interval, PD1: programmed death 1, PDL1: programmed death ligand 1.
Disclaimer/Publisher’s Note: The statements, opinions and data contained in all publications are solely those of the individual author(s) and contributor(s) and not of MDPI and/or the editor(s). MDPI and/or the editor(s) disclaim responsibility for any injury to people or property resulting from any ideas, methods, instructions or products referred to in the content.