
Standardized Uptake Values on SPECT/CT: A Promising Alternative Tool for Treatment Evaluation and Prognosis of Metastatic Neuroendocrine Tumours
 , , and
Abstract
:1. Introduction
2. Materials and Methods
2.1. Patient Selection
2.2. 99mTc-EDDA/HYNIC-TOC Synthesis
2.3. 99mTc-EDDA/HYNIC-TOC Radiochemical Purity
2.4. Acquisition Technique and Reconstruction
2.5. Scanner Calibration
2.6. Image Analysis
2.7. Statistical Analysis
3. Results
4. Discussion
5. Conclusions
Author Contributions
Funding
Institutional Review Board Statement
Informed Consent Statement
Data Availability Statement
Conflicts of Interest
References
- Fraenkel, M.; Faggiano, A.; Valk, G.D. Epidemiology of Neuroendocrine Tumors. Neuroendocr. Tumors A Multidiscip. Approach 2015, 44, 1–23. [Google Scholar] [CrossRef]
- Oronsky, B.; Ma, P.C.; Morgensztern, D.; Carter, C.A. Nothing But NET: A Review of Neuroendocrine Tumors and Carcinomas. Neoplasia 2017, 19, 991–1002. [Google Scholar] [CrossRef]
- Lamberti, G.; La Salvia, A. Neuroendocrine Tumors: Challenges and Future Perspectives. J. Clin. Med. 2022, 11, 4351. [Google Scholar] [CrossRef]
- Rindi, G.; Klimstra, D.S.; Abedi-Ardekani, B.; Asa, S.L.; Bosman, F.T.; Brambilla, E.; Busam, K.J.; de Krijger, R.R.; Dietel, M.; El-Naggar, A.K.; et al. A Common Classification Framework for Neuroendocrine Neoplasms: An International Agency for Research on Cancer (IARC) and World Health Organization (WHO) Expert Consensus Proposal. Mod. Pathol. 2018, 31, 1770–1786. [Google Scholar] [CrossRef] [Green Version]
- Nagtegaal, I.D.; Odze, R.D.; Klimstra, D.; Paradis, V.; Rugge, M.; Schirmacher, P.; Washington, K.M.; Carneiro, F.; Cree, I.A.; the WHO Classification of Tumours Editorial Board. The 2019 WHO Classification of Tumours of the Digestive System. Histopathology 2020, 76, 182–188. [Google Scholar] [CrossRef] [PubMed] [Green Version]
- Rindi, G.; Mete, O.; Uccella, S.; Basturk, O.; La Rosa, S.; Brosens, L.A.A.; Ezzat, S.; de Herder, W.W.; Klimstra, D.S.; Papotti, M.; et al. Overview of the 2022 WHO Classification of Neuroendocrine Neoplasms. Endocr. Pathol. 2022, 33, 115–154. [Google Scholar] [CrossRef]
- Haug, A.R. PRRT of Neuroendocrine Tumors: Individualized Dosimetry or Fixed Dose Scheme? EJNMMI Res. 2020, 10, 35. [Google Scholar] [CrossRef] [PubMed] [Green Version]
- Buscombe, J.R. Evidence Base for the Use of PRRT. Semin. Nucl. Med. 2020, 50, 399–404. [Google Scholar] [CrossRef]
- Popa, O.; Taban, S.M.; Pantea, S.; Plopeanu, A.D.; Barna, R.A.; Cornianu, M.; Pascu, A.-A.; Dema, A.L.C. The New WHO Classification of Gastrointestinal Neuroendocrine Tumors and Immunohistochemical Expression of Somatostatin Receptor 2 and 5. Exp. Ther. Med. 2021, 22, 1179. [Google Scholar] [CrossRef] [PubMed]
- Dromain, C.; Prior, J.O.; Schaefer, N. Functional and Radiological Imaging of Neuroendocrine Neoplasms. In The Spectrum of Neuroendocrine Neoplasia: A Practical Approach to Diagnosis, Classification and Therapy; Asa, S.L., La Rosa, S., Mete, O., Eds.; Springer International Publishing: Cham, Switzerland, 2021; pp. 29–53. ISBN 978-3-030-54391-4. [Google Scholar] [CrossRef]
- Cascini, G.L.; Cuccurullo, V.; Tamburrini, O.; Rotondo, A.; Mansi, L. Peptide Imaging with Somatostatin Analogues: More than Cancer Probes. Curr. Radiopharm. 2013, 6, 36–40. [Google Scholar] [CrossRef]
- Haider, M.; Al-Toubah, T.; El-Haddad, G.; Strosberg, J. Molecular Imaging and Radionuclide Therapy of Neuroendocrine Tumors. Curr. Opin. Endocrinol. Diabetes Obes. 2020, 27, 16–21. [Google Scholar] [CrossRef]
- Mikołajczak, R.; Maecke, H.R. Radiopharmaceuticals for Somatostatin Receptor Imaging. Nucl. Med. Rev. 2016, 19, 126–132. [Google Scholar] [CrossRef] [Green Version]
- Reilly, C.; Gemmell, A.J.; McLaughlin, I.M.; Fleming, R.; Reed, N.; McIntosh, D.; Nicol, A. Characterisation of 99mTc EDDA/HYNIC-TOC (Tektrotyd) Physiological and Neuroendocrine Tumour Uptake Using SPECT/CT Standardised Uptake Values: Initial Experience. Nucl. Med. Commun. 2021, 42, 935–939. [Google Scholar] [CrossRef]
- Kunikowska, J.; Lewington, V.; Krolicki, L. Optimizing Somatostatin Receptor Imaging in Patients With Neuroendocrine Tumors: The Impact of 99mTc-HYNICTOC SPECT/SPECT/CT Versus 68Ga-DOTATATE PET/CT Upon Clinical Management. Clin. Nucl. Med. 2017, 42, 905–911. [Google Scholar] [CrossRef]
- Vlajković, M.; Rajić, M.; Ilić, S.; Stević, M.; Kojić, M.; Živković, V.; Karanikolić, A.; Matović, M. The Influence of Ki-67 Proliferation Index on Tc-99m-EDDA-HYNIC-TOC Somatostatin Receptor Scintigraphy in Patients with Carcinoids. Open Chem. 2015, 13, 339–345. [Google Scholar] [CrossRef]
- Artiko, V.; Afgan, A.; Petrović, J.; Radović, B.; Petrović, N.; Vlajković, M.; Šobić-Šaranović, D.; Obradović, V. Evaluation of Neuroendocrine Tumors with 99mTc-EDDA/HYNIC TOC. Nucl. Med. Rev. 2016, 19, 99–103. [Google Scholar] [CrossRef] [PubMed] [Green Version]
- Saponjski, J.; Macut, D.; Petrovic, N.; Ognjanovic, S.; Popovic, B.; Bukumiric, Z.; Saranović, D.S. Diagnostic and Prognostic Value of 99mTc-Tektrotyd Scintigraphy and 18F-FDG PET/CT in a Single-Center Cohort of Neuroendocrine Tumors. Arch. Med. Sci. 2021. [Google Scholar] [CrossRef]
- Sergieva, S.; Robev, B.; Dimcheva, M.; Fakirova, A.; Hristoskova, R. Clinical Application of SPECT-CT with 99mTc-Tektrotyd in Bronchial and Thymic Neuroendocrine Tumors (NETs). Nucl. Med. Rev. 2016, 19, 81–87. [Google Scholar] [CrossRef] [PubMed] [Green Version]
- Poletto, G.; Cecchin, D.; Sperti, S.; Filippi, L.; Realdon, N.; Evangelista, L. Head-to-Head Comparison between Peptide-Based Radiopharmaceutical for PET and SPECT in the Evaluation of Neuroendocrine Tumors: A Systematic Review. Curr. Issues Mol. Biol. 2022, 44, 5516–5530. [Google Scholar] [CrossRef]
- Gherghe, M.; Lazăr, A.M.; Stanciu, A.E.; Mutuleanu, M.-D.; Sterea, M.-C.; Petroiu, C.; Galeș, L.N. The New Radiolabeled Peptide 99mTcEDDA/HYNIC-TOC: Is It a Feasible Choice for Diagnosing Gastroenteropancreatic NETs? Cancers 2022, 14, 2725. [Google Scholar] [CrossRef]
- Van den Wyngaert, T.; Elvas, F.; Schepper, S.D.; Kennedy, J.A.; Israel, O. SPECT/CT: Standing on the Shoulders of Giants, It Is Time to Reach for the Sky! J. Nucl. Med. 2020, 61, 1284–1291. [Google Scholar] [CrossRef]
- Kurkowska, S.; Birkenfeld, B.; Piwowarska-Bilska, H. Physical Quantities Useful for Quality Control of Quantitative SPECT/CT Imaging. Nucl. Med. Rev. 2021, 24, 93–98. [Google Scholar] [CrossRef]
- Wang, J.; Rios, A.; Lisova, K.; Slavik, R.; Chatziioannou, A.F.; van Dam, R.M. High-Throughput Radio-TLC Analysis. Nucl. Med. Biol. 2020, 82–83, 41–48. [Google Scholar] [CrossRef]
- Sarikaya, I.; Albatineh, A.N.; Sarikaya, A. Revisiting Weight-Normalized SUV and Lean-Body-Mass–Normalized SUV in PET Studies. J. Nucl. Med. Technol. 2020, 48, 163–167. [Google Scholar] [CrossRef]
- General Electric GE Healthcare Q. Metrix Quantitative SPECT SUV Results with Multi-Dimensional Organ and Lesion Characterization. 2014. Available online: www.gehealthcare.com (accessed on 16 November 2022).
- O, J.H.; Lodge, M.A.; Wahl, R.L. Practical PERCIST: A Simplified Guide to PET Response Criteria in Solid Tumors 1.0. Radiology 2016, 280, 576–584. [Google Scholar] [CrossRef] [Green Version]
- Poeppel, T.D.; Binse, I.; Petersenn, S.; Lahner, H.; Schott, M.; Antoch, G.; Brandau, W.; Bockisch, A.; Boy, C. 68Ga-DOTATOC Versus 68Ga-DOTATATE PET/CT in Functional Imaging of Neuroendocrine Tumors. J. Nucl. Med. 2011, 52, 1864–1870. [Google Scholar] [CrossRef] [Green Version]
- Gherghe, M.; Mutuleanu, M.-D.; Stanciu, A.E.; Irimescu, I.; Lazar, A.; Bacinschi, X.; Anghel, R.M. Quantitative Analysis of SPECT-CT Data in Metastatic Breast Cancer Patients—The Clinical Significance. Cancers 2022, 14, 273. [Google Scholar] [CrossRef] [PubMed]
- Qi, N.; Meng, Q.; You, Z.; Chen, H.; Shou, Y.; Zhao, J. Standardized Uptake Values of 99mTc-MDP in Normal Vertebrae Assessed Using Quantitative SPECT/CT for Differentiation Diagnosis of Benign and Malignant Bone Lesions. BMC Med. Imaging 2021, 21, 39. [Google Scholar] [CrossRef] [PubMed]
- Dorbala, S.; Park, M.-A.; Cuddy, S.; Singh, V.; Sullivan, K.; Kim, S.; Falk, R.H.; Taqueti, V.R.; Skali, H.; Blankstein, R.; et al. Absolute Quantitation of Cardiac 99mTc-Pyrophosphate Using Cadmium-Zinc-Telluride–Based SPECT/CT. J. Nucl. Med. 2021, 62, 716–722. [Google Scholar] [CrossRef] [PubMed]
- Piwowarska-Bilska, H.; Kurkowska, S.; Birkenfeld, B. Optimized Method for Normal Range Estimation of Standardized Uptake Values (SUVmax, SUVmean) in Liver SPECT/CT Images with Somatostatin Analog [99mTc]-HYNIC-TOC (Tektrotyd). Nucl. Med. Rev. 2022, 25, 37–46. [Google Scholar] [CrossRef] [PubMed]
- Sharma, R.; Wang, W.M.; Yusuf, S.; Evans, J.; Ramaswami, R.; Wernig, F.; Frilling, A.; Mauri, F.; Al-Nahhas, A.; Aboagye, E.O.; et al. 68Ga-DOTATATE PET/CT Parameters Predict Response to Peptide Receptor Radionuclide Therapy in Neuroendocrine Tumours. Radiother. Oncol. 2019, 141, 108–115. [Google Scholar] [CrossRef]
- Kratochwil, C.; Stefanova, M.; Mavriopoulou, E.; Holland-Letz, T.; Dimitrakopoulou-Strauss, A.; Afshar-Oromieh, A.; Mier, W.; Haberkorn, U.; Giesel, F.L. SUV of [68Ga]DOTATOC-PET/CT Predicts Response Probability of PRRT in Neuroendocrine Tumors. Mol. Imaging Biol. 2015, 17, 313–318. [Google Scholar] [CrossRef] [PubMed]
- Ortega, C.; Wong, R.K.S.; Schaefferkoetter, J.; Veit-Haibach, P.; Myrehaug, S.; Juergens, R.; Laidley, D.; Anconina, R.; Liu, A.; Metser, U. Quantitative 68Ga-DOTATATE PET/CT Parameters for the Prediction of Therapy Response in Patients with Progressive Metastatic Neuroendocrine Tumors Treated with 177Lu-DOTATATE. J. Nucl. Med. 2021, 62, 1406–1414. [Google Scholar] [CrossRef] [PubMed]
- Lee, H.; Eads, J.R.; Pryma, D.A. 68Ga-DOTATATE Positron Emission Tomography-Computed Tomography Quantification Predicts Response to Somatostatin Analog Therapy in Gastroenteropancreatic Neuroendocrine Tumors. Oncologist 2021, 26, 21–29. [Google Scholar] [CrossRef] [PubMed]
- Miederer, M.; Seidl, S.; Buck, A.; Scheidhauer, K.; Wester, H.-J.; Schwaiger, M.; Perren, A. Correlation of Immunohistopathological Expression of Somatostatin Receptor 2 with Standardised Uptake Values in 68Ga-DOTATOC PET/CT. Eur. J. Nucl. Med. Mol. Imaging 2009, 36, 48–52. [Google Scholar] [CrossRef] [PubMed]
- Kroiss, A.; Putzer, D.; Decristoforo, C.; Uprimny, C.; Warwitz, B.; Nilica, B.; Gabriel, M.; Kendler, D.; Waitz, D.; Widmann, G.; et al. 68Ga-DOTA-TOC Uptake in Neuroendocrine Tumour and Healthy Tissue: Differentiation of Physiological Uptake and Pathological Processes in PET/CT. Eur. J. Nucl. Med. Mol. Imaging 2013, 40, 514–523. [Google Scholar] [CrossRef]
- Krak, N.C.; Boellaard, R.; Hoekstra, O.S.; Twisk, J.W.R.; Hoekstra, C.J.; Lammertsma, A.A. Effects of ROI Definition and Reconstruction Method on Quantitative Outcome and Applicability in a Response Monitoring Trial. Eur. J. Nucl. Med. Mol. Imaging 2005, 32, 294–301. [Google Scholar] [CrossRef]
- Wahl, R.L.; Jacene, H.; Kasamon, Y.; Lodge, M.A. From RECIST to PERCIST: Evolving Considerations for PET Response Criteria in Solid Tumors. J. Nucl. Med. 2009, 50, 122S–150S. [Google Scholar] [CrossRef] [Green Version]
- Tzortzakakis, A.; Holstensson, M.; Hagel, E.; Karlsson, M.; Axelsson, R. Intra- and Interobserver Agreement of SUV SPECT Quantitative SPECT/CT Processing Software, Applied in Clinical Settings for Patients with Solid Renal Tumors. J. Nucl. Med. Technol. 2019, 47, 258–262. [Google Scholar] [CrossRef]
- Ogura, I.; Kobayashi, E.; Nakahara, K.; Igarashi, K.; Haga-Tsujimura, M.; Toshima, H. Quantitative SPECT/CT Imaging for Medication-Related Osteonecrosis of the Jaw: A Preliminary Study Using Volume-Based Parameters, Comparison with Chronic Osteomyelitis. Ann. Nucl. Med. 2019, 33, 776–782. [Google Scholar] [CrossRef]


| Age (mean ± SD) | 48.36 ± 16.93 | (range 18–69) | |
|---|---|---|---|
| ki67 (mean ± SD) | 7 ± 6.25 | (range 2–25%) | |
| Number | Percentage | ||
| Sex | M | 9 | 64.3% |
| F | 5 | 35.7% | |
| NET localisation | Pancreas | 6 | 42.9% |
| Small bowel | 3 | 21.4% | |
| Lungs | 3 | 21.4% | |
| Large bowel | 1 | 7.1% | |
| Unknown | 1 | 7.1% | |
| Tumour grade | NET G1 | 6 | 42.9% |
| NET G2 | 7 | 50% | |
| NET G3 | 1 | 7.1% | |
| Metastases site | Liver | 11 | 78.6% |
| Lymph nodes | 10 | 71.4% | |
| Bones | 3 | 21.4% | |
| Lungs | 1 | 7.1% |
| Positivity Rate (%) | |
|---|---|
| Immunohistochemical marker | |
| CGA | 85.7 |
| SYN | 92.9 |
| NSE | 21.4 |
| CD56 | 14.3 |
| Biochemical marker | |
| SER | 57.1 |
| 5-HIAA | 14.3 |
| CGA | 85.7 |
| Metastatic Site | SUVmax of Metastases (g/mL) | SUVmax of Healthy Tissue (g/mL) | TL/N Ratio |
|---|---|---|---|
| Liver | 12.44 ± 7.76 | 3.34 ± 0.93 | 4.20 ± 2.67 |
| Lymph nodes | 11.98 ± 10.45 | 8.01 ± 5.31 (spleen) | 1.84 ± 1.53 |
| Bone | 5.90 ± 3.68 | 0.66 ± 0.37 | 9.37 ± 2.91 |
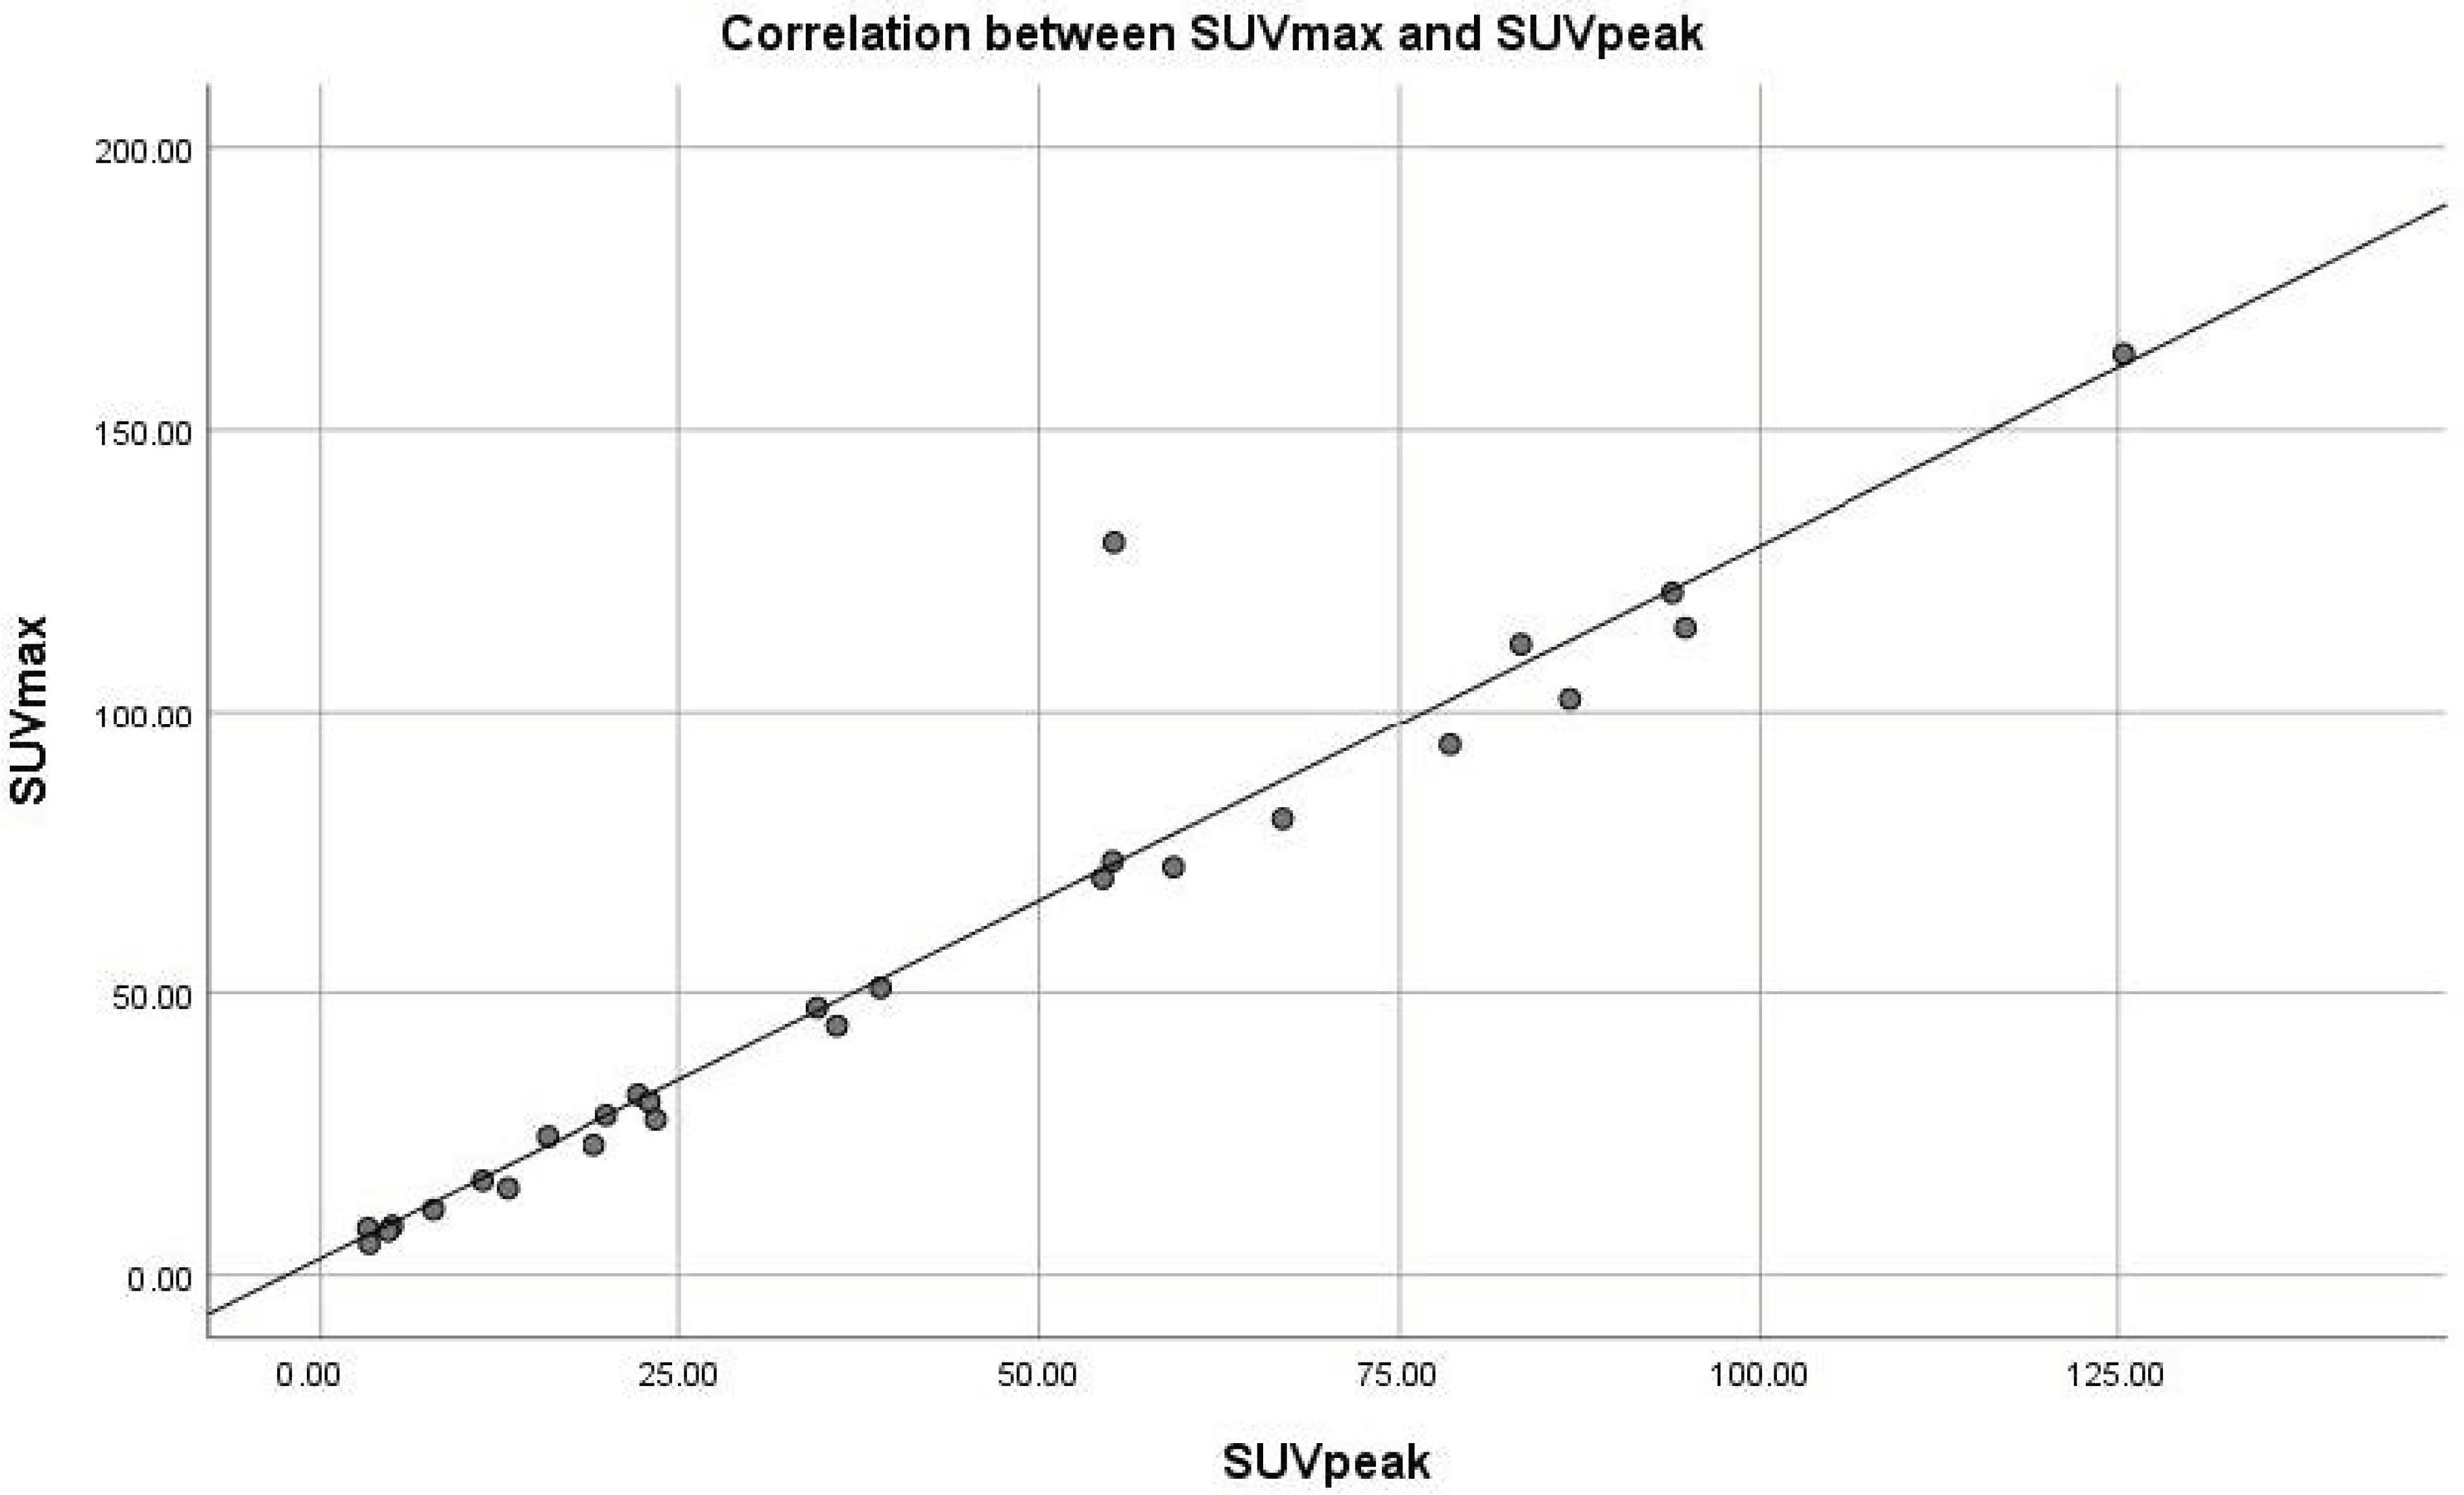
| Lesion | SUVmax (g/mL) | SUVpeak (g/mL) | r Correlation Coefficient | p |
|---|---|---|---|---|
| Liver metastases | 12.44 ± 7.76 | 10.15 ± 6.79 | 0.982 | 0.000 |
| Lymph node metastases | 11.98 ± 10.45 | 8.81 ± 7.99 | 0.980 | 0.000 |
| Bone metastases | 5.90 ± 3.68 | 5.55 ± 2.47 | 0.920 | 0.027 |
| Lesion—ki67 | r SUVmax | p | r SUVpeak | p |
|---|---|---|---|---|
| Liver metastases | 0.079 | 0.707 | 0.127 | 0.582 |
| Lymph node metastases | −0.036 | 0.889 | −0.012 | 0.966 |
| Bone metastases | −0. 701 | 0.506 | 0.672 | 0.531 |
| All lesions | 0.042 | 0.820 | 0.096 | 0.656 |
Disclaimer/Publisher’s Note: The statements, opinions and data contained in all publications are solely those of the individual author(s) and contributor(s) and not of MDPI and/or the editor(s). MDPI and/or the editor(s) disclaim responsibility for any injury to people or property resulting from any ideas, methods, instructions or products referred to in the content. |
© 2023 by the authors. Licensee MDPI, Basel, Switzerland. This article is an open access article distributed under the terms and conditions of the Creative Commons Attribution (CC BY) license (https://creativecommons.org/licenses/by/4.0/).
Share and Cite
Gherghe, M.; Lazar, A.M.; Simion, L.; Irimescu, I.-N.; Sterea, M.-C.; Mutuleanu, M.-D.; Anghel, R.M. Standardized Uptake Values on SPECT/CT: A Promising Alternative Tool for Treatment Evaluation and Prognosis of Metastatic Neuroendocrine Tumours. Diagnostics 2023, 13, 318. https://doi.org/10.3390/diagnostics13020318
Gherghe M, Lazar AM, Simion L, Irimescu I-N, Sterea M-C, Mutuleanu M-D, Anghel RM. Standardized Uptake Values on SPECT/CT: A Promising Alternative Tool for Treatment Evaluation and Prognosis of Metastatic Neuroendocrine Tumours. Diagnostics. 2023; 13(2):318. https://doi.org/10.3390/diagnostics13020318
Chicago/Turabian StyleGherghe, Mirela, Alexandra Maria Lazar, Laurentiu Simion, Ionela-Nicoleta Irimescu, Maria-Carla Sterea, Mario-Demian Mutuleanu, and Rodica Maricela Anghel. 2023. "Standardized Uptake Values on SPECT/CT: A Promising Alternative Tool for Treatment Evaluation and Prognosis of Metastatic Neuroendocrine Tumours" Diagnostics 13, no. 2: 318. https://doi.org/10.3390/diagnostics13020318