Abstract
The patterns of idiopathic pulmonary fibrosis (IPF) lung disease that directly correspond to elevated hyperpolarised gas diffusion-weighted (DW) MRI metrics are currently unknown. This study aims to develop a spatial co-registration framework for a voxel-wise comparison of hyperpolarised gas DW-MRI and CALIPER quantitative CT patterns. Sixteen IPF patients underwent 3He DW-MRI and CT at baseline, and eleven patients had a 1-year follow-up DW-MRI. Six healthy volunteers underwent 129Xe DW-MRI at baseline only. Moreover, 3He DW-MRI was indirectly co-registered to CT via spatially aligned 3He ventilation and structural 1H MRI. A voxel-wise comparison of the overlapping 3He apparent diffusion coefficient (ADC) and mean acinar dimension (LmD) maps with CALIPER CT patterns was performed at baseline and after 1 year. The abnormal lung percentage classified with the LmD value, based on a healthy volunteer 129Xe LmD, and CALIPER was compared with a Bland–Altman analysis. The largest DW-MRI metrics were found in the regions classified as honeycombing, and longitudinal DW-MRI changes were observed in the baseline-classified reticular changes and ground-glass opacities regions. A mean bias of −15.3% (95% interval −56.8% to 26.2%) towards CALIPER was observed for the abnormal lung percentage. This suggests DW-MRI may detect microstructural changes in areas of the lung that are determined visibly and quantitatively normal by CT.
1. Introduction
Idiopathic pulmonary fibrosis (IPF) is a group of lung diseases that are defined by the lack of an underlying cause and are characterised by the presence of usual interstitial pneumonia (UIP) and pathological fibroblastic activity [1]. UIP is spatially heterogeneous, both macroscopically and microscopically, with a peripheral and basal predominant distribution. In a CT scan, visible patterns of UIP include honeycombing cysts, reticular opacities associated with traction bronchiectasis, and ground glass opacities [2,3,4]. The presence of any UIP pattern in a CT scan is crucial for IPF diagnosis, and it typically involves a multi-disciplinary team [2,3,4,5]. Semi-quantitative disease severity scoring methods have been proposed that have some prognostic capabilities [6,7]. However, these methods are not currently standardised, and scoring can be subjective across independent radiologists [8].
Several texture-based or machine learning algorithms [9,10,11,12,13,14,15,16] have been proposed for the automated characterisation of CT scans for interstitial lung disease (ILD) patterns that demonstrate correlation and agreement with radiologists’ scoring. Computer-Aided Lung Informatics for Pathology Evaluation and Rating (CALIPER), an image analysis software developed by the Mayo Clinic (Rochester, MN, USA), can automatically characterise and quantify volumetric CT images for patterns of ILD on a voxel-wise level [12]. CALIPER-derived parameters have been shown to be associated with IPF disease progression [17], and were more accurate than visual CT scoring in IPF mortality prediction and prognostication [18,19].
Hyperpolarised gas diffusion-weighted MRI (DW-MRI) with inhaled helium-3 (3He) or xenon-129 (129Xe) is an imaging technique that is sensitive to changes in acinar microstructure [20,21,22,23]. In lungs with IPF, the global apparent diffusion coefficient (ADC) and mean acinar dimension (LmD) from 3He and 129Xe DW-MRI is elevated compared to healthy lungs, which is indicative of a loss of the acinar integrity related to fibrosis [24,25,26,27]. Furthermore, DW-MRI metrics correlate with a visual scoring of ILD severity on CT images, and the LmD demonstrated sensitivity to longitudinal change in IPF [26]. Elevated DW-MRI metric regions qualitatively appeared to spatially correlate with the ILD patterns visible in CT scans, and they were hypothesised to be related to regions of honeycomb cysts. A more regional or voxel-wise comparison is therefore required to help elucidate which ILD features directly correspond to the observed elevated DW-MRI metrics.
Multi-modality spatial co-registration of hyperpolarised gas lung MRI and CT has previously been successfully implemented to compare hyperpolarised gas MRI- and CT-based maps of lung ventilation in patients with asthma [28], chronic obstructive lung disease (COPD) [29] and lung cancer [30]. Moreover, the co-registration of hyperpolarised gas DW-MRI with CT has facilitated quantitative multi-parametric response mapping and MRI-based emphysema indices, which have revealed subclinical features of COPD that were not detectable with DW-MRI or CT alone [31,32,33]. However, to date, there have been no studies that have spatially co-registered DW-MRI and CT in patients with IPF or ILD. The aim of this work was therefore to develop a multi-modality spatial co-registration framework for hyperpolarised gas DW-MRI and CALIPER CT. The framework will facilitate a voxel-wise comparison of DW-MRI metrics with quantitative CALIPER CT patterns in a cohort of IPF patients.
2. Materials and Methods
2.1. Study Participants
Sixteen patients (mean 71 ± 5 years, 14 men) with a multi-disciplinary team IPF diagnosis, and six healthy volunteers (mean 67 ± 3 years, 4 men) with no history of respiratory disorders and smoking were recruited for this retrospective interpretation of prospectively acquired data from two separate studies that were approved by the Liverpool Central NHS Research Ethics Committee [26] (February 2016 to February 2018) and the Regional Ethical Review Board in Lund, Sweden [34] (March to May 2019), respectively. All participants provided written informed consent.
The inclusion criteria for the patients with IPF included a diagnosis of IPF within one year, oxygen saturations of ≥90% in room air, and an age of 18–80. The exclusion criteria included patients on immunosuppressive treatment, pregnancy, renal impairment, oxygen saturations of <90% in room air, an age of >80 years old (or an age of <18 years old at the onset of the study), an inability to lie supine comfortably for at least 60 min, a significant co-morbidity that was likely to reduce life expectancy to less than one year, a severe ischaemic heart disease (or symptoms of angina that could not be fully controlled), significant congestive cardiac failure, any contraindication(s) to MRI scanning, and previous allergies to MRI contrast agent (gadolinium).
All IPF patients underwent 3He MRI and CT at baseline, and eleven patients had a 1-year follow up 3He MRI. Four IPF patients died between the follow up examinations, and one patient was too sick and withdrew from the study. All healthy volunteers underwent a baseline 129Xe MRI only. The difference in hyperpolarised gas between the IPF patients and healthy volunteers was due to the transition of the research community from 3He to 129Xe gas due to the scarcity of 3He gas [35]. Figure 1 summarises the participant imaging data and analyses for this study.
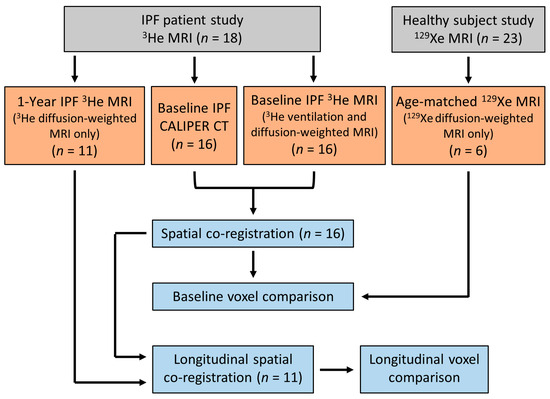
Figure 1.
Flow chart summarising the imaging data obtained and the imaging analyses for this study. IPF patient and healthy volunteer data were from two separate prospective studies, respectively [26,34].
2.2. MRI and CT Image Acquisition
Hyperpolarised 3He and 129Xe lung MRI was acquired on a 1.5 T GE HDx scanner using 3He and 129Xe flexible quadrature chest radiofrequency coils (Clinical MR Solutions, Brookfield, WI, USA). All examinations involved the inhalation of a gas mixture of hyperpolarised 3He (~25% polarization) or 129Xe (~25% polarization), as well as the nitrogen from functional residual capacity (FRC). Gases were polarized under Medicines & Healthcare products Regulatory Agency (MHRA) approved licences with in-house equipment and processes (POLARIS, University of Sheffield, UK). The volume of gas mixture was titrated based upon the subjects’ heights, up to 1 L, to account for the differences in lung volume. Each subject was ≥ 160 cm and subsequently inhaled 1 L gas mixtures. Before undergoing the MRI exam, each subject was coached by a lung physiologist to achieve FRC, and they practiced by inhaling 1 L of room air. Each IPF participant underwent 3He DW-MRI and ventilation MRI, while healthy volunteers underwent 129Xe DW-MRI only. The aforementioned 129Xe and 3He DW-MRI sequences were optimised such that comparable LmD values could be derived from both gases [36].
Hyperpolarised 3He diffusion-weighted (DW)-MRI was acquired with a 3D multiple b-value spoiled gradient echo (SPGR) sequence and compressed sensing undersampling [26], which were obtained with the following parameters: 250 mL of 3He (balanced with 750 mL of N2); FOV: 40 × 32 × 28.8 cm3; TE/TR: 4.2/6.0 ms; voxel size: 4.17 × 4.17 × 12 mm3; b-values: 0, 1.6, 4.2, and 7.2 s/cm2; diffusion time: 1.6 ms; maximum diffusion-weighted gradient strength: 30 mT/m; ramp: 0.3 ms; plateau: 1.0 ms; flip angle: 1.9°; and bandwidth: ±31.25 kHz.
Healthy volunteers underwent hyperpolarised 129Xe DW-MRI only with a 3D multiple b-value SPGR sequence and compressed sensing undersampling [36], and these were performed with the following parameters: 550 mL of 129Xe (balanced with 450 mL of N2); FOV: 40 × 32 × 27 cm3; TE/TR: 14.0/17.3 ms; voxel size: 6.25 × 6.25 × 15 mm3; b-values: 0, 12, 20, and 30 s/cm2; diffusion time: 8.5 ms; maximum diffusion-weighted gradient strength: 32.6 mT/m; ramp: 0.3 ms; plateau: 2.3 ms; flip angle: 3.1°; and bandwidth: ±6.97 kHz. A previous benchmarking study has demonstrated that equivalent 129Xe and 3He LmD values can be derived from using the above sequence parameters (see Supplementary Materials Figure S1) [36].
Hyperpolarised 3He lung ventilation MRI was acquired with a 3D balanced steady-state free precession sequence [28] with the following sequence parameters: 150 mL of 3He (balanced with 850 mL N2); in-plane FOV: 40 × 32 cm2; TE/TR: 0.6/1.9 ms; voxel size of 4 × 4 × 5 mm3; flip angle: 10°; and bandwidth: ±83.5 kHz. The same-breath 1H images of the thorax were acquired at the same spatial resolution as the 3He lung ventilation for anatomical reference [28] with the following sequence parameters: 3D SPGR, in-plane FOV: 40 × 40 cm2; TE/TR: 0.6/1.4 ms; voxel size of 4 × 4 × 5 mm3; flip angle: 5°; and bandwidth: ±83.5 kHz.
The sixteen IPF patients underwent non-contrast multi-detector row CT of the thorax at one tertiary centre on a 64-section scanner (Light-Speed; GE Medical) during a single full-inspiration breath hold. The CT images were reconstructed to 1.25 mm thick sections using either “Soft”, “Lung”, or “Chest” reconstruction kernels, and the mean dose-length product for all participants was 313 mGy∙cm (range, 101–743 mGy∙cm). CT was performed as close as was practical to the MRI examination (mean 56 ± 62 days).
2.3. Image Registration and Analysis
The undersampled hyperpolarised 3He and 129Xe DW-MRI data were reconstructed using in-house MATLAB (MathWorks, Inc., MA, USA) code [26,36]. For each IPF participant, 3He DW-MRI was spatially co-registered to the CT indirectly via spatially aligned 3He ventilation and structural 1H MRI [28], which was achieved using Advanced Normalization Tools (ANTs) software [37] (Figure 2). Furthermore, 3He DW-MRI was co-registered to the 3He ventilation images, while CT was co-registered to the structural 1H MRI. CT images were segmented as part of the CALIPER software analysis; meanwhile, all 3He and 1H MRI images were segmented using in-house developed software. Each image registration involved a rigid pre-alignment transformation that was followed by affine and diffeomorphic transformations [28]. For the diffeomorphic stage, a standard pyramidal approach was followed using mutual information at the higher levels [38] and cross correlation at the base as cost functions [39]. Further details on the image registration transformations can be found in Tahir et al. [28]. Image registrations were assessed by Dice similarity coefficients between the binary lung segmentation masks of warped 3He DW-MRI and 3He ventilation, as well as with warped CT and structural 1H.
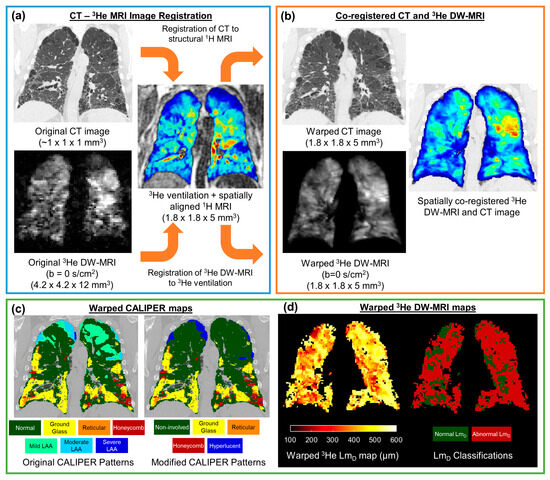
Figure 2.
Framework for the spatial co-registration of CT images and 3He diffusion-weighted (DW)-MRI. The original CT images and DW-MRI (a) were indirectly co-registered by utilising same-breath acquired 3He ventilation and structural 1H MRI (b). The resultant warped images had a spatial resolution of 1.8 × 1.8 × 5 mm3 (c). The spatial transformation used to warp CT images was also used to deform CALIPER classifications maps. (d) Maps of the 3He ADC and LmD were calculated from the original 3He DW-MRI, and they were warped using the same spatial transformation as DW-MRI. The abnormal LmD values were defined from a threshold of 406 µm, and they were derived from older healthy volunteer 129Xe DW-MRIs.
The CT images were analysed with CALIPER software, wherein each parenchyma voxel was characterised into one of seven patterns: normal, honeycombing, reticular changes, ground-glass opacities, and lower attenuation areas (LAA) (mild, moderate, and severe) [12]. To reduce the number of CALIPER patterns and DW-MRI comparisons, additional patterns were defined. Non-involved represents the physiologically normal lung, as well as the combined normal and mild LAA patterns; this was such because mild LAA patterns can appear in healthy lungs after deep inhalation. Hyperlucent voxels represent the emphysematous regions of the lung (moderate or severe LAA patterns). Thus, maps containing five CALIPER patterns (non-involved, honeycombing, reticular changes, ground-glass opacities, and hyperlucent) were derived for each CT image set.
CALIPER maps were co-registered to DW-MRI using the same CT-1H deformation field transformation with the nearest neighbour interpolation. Then, 3He ADC and LmD values were calculated for each original IPF 3He DW-MRI dataset on a voxel-by-voxel basis. Moreover, the 3He ADC was calculated from a mono-exponential fit of two b-values (b = 0, and 1.6 s/cm2). Furthermore, 3He LmD was derived from fitting all respective 4 b-values (3He b = 0, 1.6, 4.2, 7.2 s/cm2) to the stretched exponential model (SEM) of the gas diffusion in the lungs [34]. Voxel-wise maps of the 3He ADC and LmD were subsequently warped using the 3He DW-MRI-ventilation deformation field transformation with the nearest neighbour interpolation. For each healthy volunteer, maps of 129Xe LmD were calculated voxel-by-voxel from the 129Xe DW-MRI data using the SEM for 129Xe b= 0, 12, 20, and 30 s/cm2 [34].
In the absence of longitudinal CT imaging, the 1-year follow up of 3He DW-MRI, available for eleven of the IPF patients, was warped to the spatial domain of the baseline 3He ventilation using the same ANT registration pipeline detailed above for the baseline 3He DW-MRI. Thus, after this additional registration step, both baseline and longitudinal 3He DW-MRI were spatially co-registered to the baseline CT and CALIPER maps.
2.4. Statistical Analyses
The overlapping voxels from spatially co-registered 3He ADC or LmD maps and CALIPER maps were compared across all of the IPF patients. Only 5% of the overlapping voxels (every 20th) were considered for statistical analyses. This was due to the computational limitations of the statistical analysis software because of the large (~4 million) number of overlapping voxels.
Statistical differences in the 3He ADC or LmD values between the five CALIPER patterns were assessed with one-way ANOVA and the post hoc Tukey multiple comparison tests. The IPF patients’ 3He LmD values in CALIPER non-involved pattern voxels were compared to the healthy volunteers’ 129Xe LmD values with an independent t-test. A 129Xe LmD threshold of 406 µm, corresponding to the 95% upper limit of healthy 129Xe LmD values (see Results), was used to classify the 3He LmD voxels in the IPF cohort that were greater than the threshold as an abnormal value. The percentage of lung voxels classified as abnormal by LmD was compared to those co-registered CALIPER voxels with ILD patterns (honeycombing, reticular changes, and ground-glass opacities) using Bland–Altman analysis. In the sub-cohort of eleven IPF patients with longitudinal 3He DW-MRI, the overlapping voxels in 3He ADC or LmD and CALIPER maps were compared at baseline and after 1 year. Independent t-tests for the overlapping voxels in each of the five CALIPER patterns were used to determine if the statistically significant longitudinal changes in the diffusion metrics were observed in each respective CALIPER pattern.
All statistical analyses were performed in GraphPad Prism (v9.5, La Jolla, CA, USA), and any p-values that were <0.05 indicated statistical significance. Any statistically significant difference in ADC or LmD values were compared to a respective a priori-defined confidence interval (CI) range to contextualise if the statistical difference was a relevant one. The mean difference 95% CI of the Tukey multiple comparison tests or independent t-test differences were compared to the Bland–Altman 95% difference interval range that was previously reported for the same-day reproducibility of 3He ADC (±0.041 cm2/s) and LmD (±18.5µm) values in IPF patients [26].
3. Results
3.1. Spatial Co-Registration
Table 1 summarises the demographics and DW-MRI metrics for the IPF patients and healthy volunteers at baseline. The spatial co-registration of CT and 3He DW-MRI was successfully implemented in all sixteen IPF patients, and the resultant spatial resolution of co-registered images was 1.8 × 1.8 × 5 mm3. The mean Dice similarity coefficient for the CT-3He DW-MRI spatial co-registration was 0.920 ± 0.013. The mean Dice coefficients for the two separate CT-structural 1H and 3He DW-MRI-ventilation co-registrations were 0.954 ± 0.008 and 0.922 ± 0.009, respectively. The individual IPF patients’ co-registration Dice coefficients, CALIPER pattern percentages, and 3He DW-MRI metrics are summarised in Supplementary Materials, Table S1.

Table 1.
A summary of the subject demographics and global DW-MRI metrics for IPF patients and older healthy volunteers. All values are given as the mean ± standard deviation.
3.2. Baseline Voxel Comparison
An analysis of the overlapping co-registered voxels that were present in all baseline IPF patients demonstrated that the voxels classified as honeycombing had the largest 3He ADC and LmD values for all CALIPER patterns (Table 2).
Table 2.
A summary of 3He ADC and LmD values for each CALIPER pattern in the baseline voxel-wise comparison of the 16 IPF patients. All values are given as the mean ± standard deviation.
One-way ANOVA revealed that there was a statistically significant difference in the 3He ADC value (F(4, 203670) = 2618, p < 0.001) between at least two CALIPER patterns in the overlapping voxels (Figure 3a). The post hoc Tukey tests for multiple comparisons found significantly different 3He ADC values between all five CALIPER patterns (p < 0.001) (Table 3). When the 95% CI of the differences were compared to the a priori-defined relevance range, the mean difference in the 3He ADC between all CALIPER patterns was relevant, except that between the reticular and ground-glass patterns (Figure 3b).
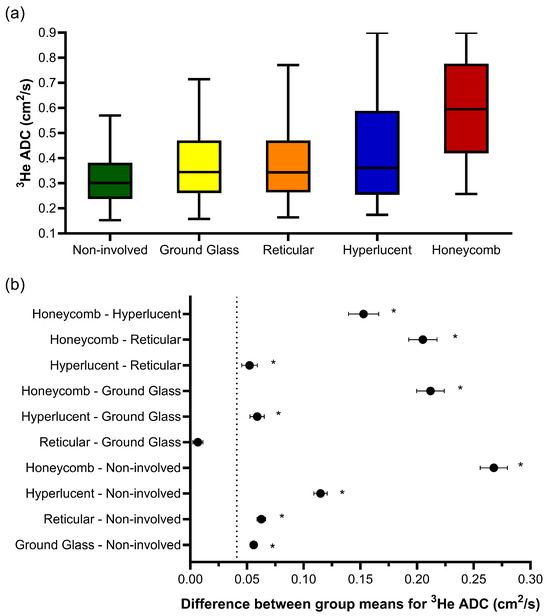
Figure 3.
(a) Boxplots of the 3He ADC value for each CALIPER pattern from a voxel-wise comparison of all the overlapping co-registered voxels in all IPF patients. The boxplot whiskers are representative of 5th and 95th percentiles. A significant difference between the CALIPER patterns for 3He ADC was obtained with a one-way ANOVA test (p < 0.001). (b) Plots of the mean difference confidence intervals (CI) for each post hoc Tukey multiple comparison test. The comparisons denoted by asterisks were significantly different (p < 0.001) and had a mean difference CI that was greater than the a priori-defined relevance range for 3He ADC in IPF patients (±0.041 cm2/s, dotted line).
Table 3.
Summary of mean differences (95% confidence interval range) for the post hoc Tukey multiple comparison tests of the 3He ADC and LmD with CALIPER patterns.
Similar trends were observed for 3He LmD, where one-way ANOVA indicated statistically significant differences in the CALIPER patterns (F(4, 186218) = 665.9, p < 0.001) (Figure 4a). The post hoc Tukey tests for multiple comparisons found significantly different 3He LmD values between all five CALIPER patterns (p < 0.001), except between the reticular and ground-glass (p = 0.87), hyperlucent and ground-glass (p = 0.16), and hyperlucent and reticular (p = 0.051) patterns (Table 3). All statistically significant 3He LmD differences in the CALIPER patterns were relevant when compared against the a priori 3He LmD relevance range (Figure 4b).
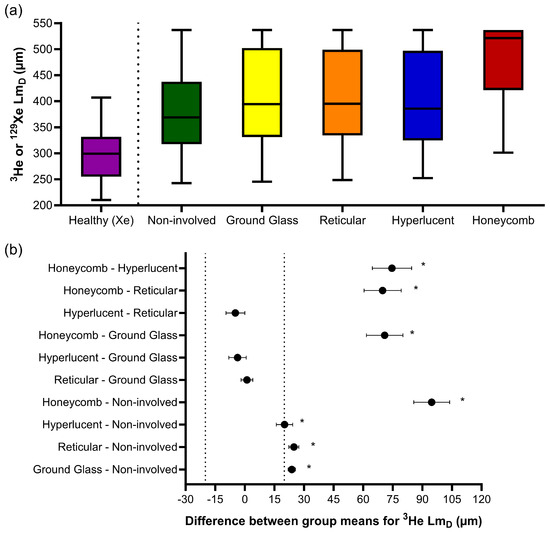
Figure 4.
(a) Boxplots of the 3He LmD values for each CALIPER pattern obtained via a voxel-wise comparison of all the overlapping co-registered voxels in all IPF patients, and the 129Xe LmD values for the older healthy volunteers. Boxplot whiskers are representative of the 5th and 95th percentiles. A significant difference between the CALIPER patterns for 3He LmD was obtained with a one-way ANOVA test (p < 0.001). The non-involved CALIPER patterns’ 3He LmD was significantly larger (p < 0.001, +80.1 µm) than those in the older healthy 129Xe LmD values. (b) The plots of mean difference confidence intervals (CI) for each post hoc Tukey multiple comparison tests. The comparisons denoted by asterisks were significantly different (p < 0.001) and had a mean difference CI greater than the a priori-defined relevance range for 3He LmD in the IPF patients (±18.5 µm, dotted line).
The 3He LmD values within the non-involved CALIPER pattern (mean = 380 ± 87 µm) were significantly larger (t(190731) = 168.7, p < 0.001) than the older healthy volunteer 129Xe LmD values (mean = 300 ± 61 µm) (Figure 4a). A threshold of 406 µm, corresponding to the 95% upper limit of older healthy 129Xe LmD values was chosen to classify the 3He LmD maps for abnormality. A Bland–Altman analysis of the percentage of abnormal lung voxels between LmD (>406 µm) and CALIPER (all ILD patterns) classifications obtained a mean bias of −15.3% (95% confidence interval −56.8% to 26.2%) towards CALIPER for IPF participants (Figure 5a). These results suggested that more abnormal microstructural changes are detected by DW-MRI. A trend towards increasing bias between CALIPER and LmD with an increased percentage of abnormal voxels was also observed (Figure 5b).
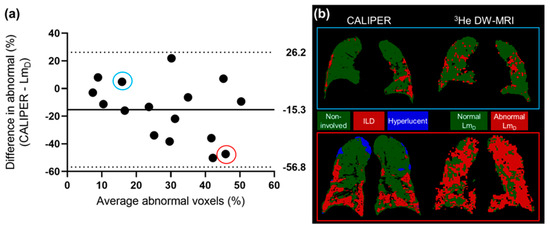
Figure 5.
(a) The Bland–Altman analysis of the percentage of voxels classified as abnormal by CALIPER or LmD (>406 µm) in all of the IPF patients. A mean bias of −15.3% towards abnormal values as classified by CALIPER was observed. (b) Two example patients with IPF, where one patient demonstrates a small difference in the percentage of their lungs classified as abnormal (blue—CALIPER = 18.3%, LmD = 13.4%), and one patient demonstrates a large difference (red—CALIPER = 22.2%, LmD = 69.6%).
3.3. Longitudinal Voxel Comparison
For the sub-cohort of 11 IPF patients who underwent a 1-year follow-up DW-MRI, overlapping co-registered 1-year ADC or LmD voxels were statistically significant different (p < 0.001) after 1 year globally and in all baseline CALIPER patterns, except in the hyperlucent and honeycomb patterns for ADC, and in the honeycomb pattern for LmD (Table 4). When significant longitudinal differences in CALIPER patterns were considered against the a priori 3He ADC and LmD relevance ranges, the largest and only relevant differences were observed for reticular (ADC and LmD) and ground-glass patterns (ADC). Meanwhile, the changes in non-involved and hyperlucent patterns were not relevant (Figure 6). This suggests that the longitudinal DW-MRI changes observed in this IPF cohort occur in the regions of the lung with ILD patterns, and not due to increased emphysematous regions.
Table 4.
Summary of the baseline and 1-year follow up 3He DW-MRI metrics in the longitudinal sub-cohort of the 11 IPF patients. Values given as the mean ± standard deviation. The mean differences (95% confidence interval range) for each CALIPER pattern, as classified on baseline CT, are shown for the 3He ADC and LmD values obtained from independent t-tests.
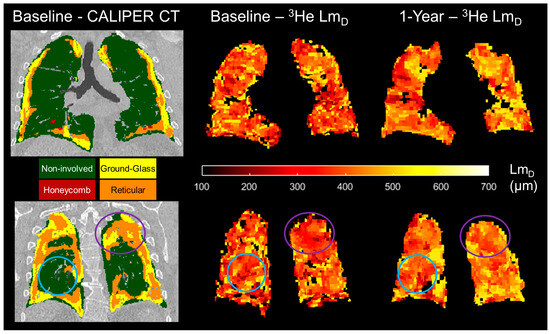
Figure 6.
Two example spatially co-registered 3He LmD maps at baseline and after 1 year following the corresponding baseline CALIPER CT map in one representative IPF patient. In the regions classified as ground-glass and reticular, the largest longitudinal differences in the 3He LmD value were observed (purple circles). In contrast, the regions that were classified as CALIPER non-involved demonstrated much less of a change in the 3He LmD value after 1 year (blue circles).
4. Discussion
A framework for the spatial co-registration of 3He DW-MRI and CT images was developed and implemented using images from the sixteen IPF participants. A high Dice similarity coefficient for the resultant spatial transformation indicates an excellent spatial overlap of the 3He DW-MRI and CT imaging modalities. The choice of an indirect CT and DW-MRI registration framework using spatially aligned 3He-1H MRI was based on a previous study of CT and 3He ventilation MRI registration, which demonstrated more accurate registrations with an indirect method that utilised same-breath 3He-1H MRI than a direct registration method [28]. The slightly lower Dice coefficient for the 3He DW-MRI-ventilation transformation may be related to the inherently lower spatial resolution of DW-MRI, which can result in fewer ventilation defects that are visible on the respective images and binary segmentation masks.
The CALIPER honeycombing pattern voxels had the largest ADC and LmD values out of all the CALIPER patterns; this further supports the hypothesis that elevated hyperpolarised gas DW-MRI metrics are a result of honeycomb cysts [26]. Smaller differences in the ADC and LmD values between normal and reticular or ground-glass patterns, when compared to honeycombing, may suggest that, in a CT scan, these ILD patterns have minimal accompanying acinar microstructural changes. However, the LmD values in the CALIPER non-involved or physiologically normal patterns were also significantly larger than those obtained from the healthy volunteers of a similar age range. This would suggest DW-MRI may detect microstructural changes in the regions of the IPF lung that quantitative CT characterises as physiologically normal. When the abnormal LmD threshold, defined as the 95% upper limit of healthy volunteer 129Xe LmD values, was compared to the CALIPER ILD patterns in IPF patients, an overall bias towards a higher percentage of the lung being classified as abnormal with DW-MRI was obtained. This bias further suggests that hyperpolarised gas DW-MRI may be sensitive to aspects of acinar changes in IPF lung disease, such as microscopic cysts that are not resolved by CT.
In our IPF cohort, the percentage of lung voxels characterised as ground-glass opacities by CALIPER was relatively high (12.4%, Table 2), which is not typical for a radiologic UIP pattern in a CT scan. However, we can confirm that each IPF subject had either a definite UIP or probable UIP CT pattern, as visually assessed by thoracic radiologists during multi-disciplinary team diagnosis (see Supplementary Materials, Table S1), and this is indicative of no predominant regions of ground-glass opacities [2,3,4]. This discrepancy in ground-glass opacity classifications could be related to differences between CALIPER and radiologist visual scoring, in which it has been previously shown that the honeycombing regions identified by radiologists were frequently characterised as reticular changes or ground-glass opacities on CALIPER [19].
A trend towards increased mean global ADC and LmD values in spatially co-registered 1-year follow ups of 3He DW-MRI is in keeping with the trends observed in the wider IPF patient cohort of this study [26]. The largest increases in ADC and LmD voxels after 1 year were observed for the patterns of reticular changes and ground-glass opacities, and not due to emphysema. These results suggest that if 1-year follow-up CALIPER CT images were acquired, then they would show an increased lung percentage of CALIPER ILD patterns [18,19]. We also hypothesise that some baseline ground-glass and reticular patterns regions would be classified as honeycombing in a 1-year follow-up CT scan.
The main limitation was that our IPF patient cohort was small and no longitudinal CT imaging was available. More patient data, across the two modalities, are therefore required to confirm our baseline and longitudinal findings. There were also limitations in the voxel-wise comparison of CALIPER and DW-MRI. First, due to the relatively large differences in voxel resolution between DW-MRI and CT, DW-MRI voxels were up-sampled and interpolated during spatial co-registration. The combination of partial volume voxel effects and misalignment errors may result in the incorrect classification of DW-MRI voxels in the regions with subtle changes in CALIPER CT patterns. However, the large number of voxels in the comparison, albeit in a small cohort, is a strength of this study and helps minimise the possibility of registration errors affecting our voxel-wise comparison. Second, only overlapping co-registered image voxels were considered. DW-MRI metrics are derived from ventilated lung voxels only; therefore, a comparison was not possible in ventilation defect regions. This is, however, more relevant in obstructive lung diseases when compared to restrictive ones such as IPF, and this is supported by the small number of un-ventilated lung regions that were observed on 3He DW-MRI.
The differences in imaging protocols between IPF patients and healthy volunteers, as well as between CT and DW-MRI, are also limitations of this study. The difference in hyperpolarised gas for DW-MRI was mitigated by implementing optimised diffusion imaging parameters that result in comparable DW-MRI metrics (see Supplementary Materials, Figure S1) [36]. However, the inherent lower diffusivity of 129Xe gas may slightly underestimate the healthy volunteers’ LmD values that are in the upper limit of normal when compared to 3He gas. The CT scans were acquired at full inspiratory volume, while 3He DW-MRI was imaged at FRC + 1L. Therefore, lung inflation volume differences could be a factor because DW-MRI metrics are more homogeneous and larger at full inspiration [40], and consequently the threshold for abnormal LmD values may be underestimated due to the smaller LmD values in the dependent lung at FRC + 1L. The combination of inflation and diffusivity differences may lead to an overestimation of the true bias between DW-MRI and CT if both imaging modalities were acquired at the same inflation level and with 3He gas.
5. Conclusions
The spatial co-registration of hyperpolarised gas DW-MRI and CALIPER quantitative CT maps in IPF patients demonstrated that the largest ADC and LmD values were observed in the regions classified as honeycombing. In addition, longitudinal DW-MRI changes were predominantly observed in reticular change and ground-glass opacity regions. Furthermore, the LmD values in voxels with a CALIPER normal pattern were larger than those from age-matched healthy volunteers, thus suggesting DW-MRI may detect microstructural changes even in areas of the lung that are determined as structurally normal by CT scans. The quantitative biomarkers from hyperpolarised gas DW-MRI and CT could play a role in future clinical trials, whereby IPF disease progression and response to new treatments is assessed. With the transition from hyperpolarised 3He to 129Xe for clinical lung imaging studies [35], this spatial co-registration framework is immediately transferrable to 129Xe DW-MRI. Furthermore, it can be used to explore quantitative CT patterns in different ILD subtypes and pulmonary diseases.
Supplementary Materials
The following supporting information can be downloaded at: https://www.mdpi.com/article/10.3390/diagnostics13233497/s1. Figure S1: Example maps of the mean acinar dimension (LmD) from the 3He and 129Xe diffusion-weighted MRIs in two representative IPF patients. A similar distribution of LmD values that accompany comparable global means demonstrate that comparable 3He and 129Xe LmD values are obtained with the diffusion-weighted MRI sequences. Table S1: Summary of the imaging metrics for each individual IPF patient at baseline. The metrics include the following: usual interstitial pneumonia (UIP) patterns on volumetric CT scans, as visually assessed by thoracic radiologists during IPF diagnosis; Dice overlap coefficients; CALIPER pattern percentages; and 3He diffusion-weighted MRI metrics. Non-involved = normal physiological lung; hyperlucent = emphysematous lung.
Author Contributions
Study conceptualisation: J.M.W. and S.M.B.; MRI acquisition: H.-F.C., N.D.W. and J.M.W.; MRI analysis and image registration: H.-F.C., N.D.W., A.M.B. and B.A.T.; Quantitative CT analysis: C.S.J., B.J.B. and R.A.K.; Writing—original draft preparation: H.-F.C. and J.M.W. All authors have read and agreed to the published version of the manuscript.
Funding
This work was supported by the National Institute for Health Research (NIHR) grant NIHR-RP-R3-12-027 and Medical Research Council (MRC) grant MR/M008894/1. The views expressed in this publication are those of the author(s) and not necessarily those of the NHS, the National Institute for Health Research, or the Department of Health.
Institutional Review Board Statement
The study was conducted in accordance with the guidelines in the Declaration of Helsinki and was approved by the Liverpool Central NHS Research Ethics Committee (15/NW/0750) and Regional Ethical Review Board in Lund, Sweden (2018/659).
Informed Consent Statement
Informed consent was obtained from all subjects involved in the study.
Data Availability Statement
The data presented in this study are available on request from the corresponding author.
Acknowledgments
The authors would like to acknowledge all members of the POLARIS research group at the University of Sheffield, as well as Jakob Löndahl and Madeleine Petersson-Sjögren of Lund University for their support and assistance in recruitment.
Conflicts of Interest
Dr Bartholmai and Dr Karwoski at Mayo Clinic both have a patent “Systems and Methods for Analysing in vivo Tissue Volumes using Medical Imaging Data” that is licensed to Imbio LLC (the commercial lung analysis software that includes CALIPER). Please note that all quantitative CT analysis in this manuscript was done with CALIPER software at Mayo Clinic and not with Imbio LLC software.
References
- Gross, T.J.; Hunninghake, G.W. Idiopathic Pulmonary Fibrosis. N. Engl. J. Med. 2001, 345, 517–525. [Google Scholar] [CrossRef]
- Raghu, G.; Collard, H.R.; Egan, J.J.; Martinez, F.J.; Behr, J.; Brown, K.K.; Colby, T.V.; Cordier, J.-F.; Flaherty, K.R.; Lasky, J.A.; et al. An Official ATS/ERS/JRS/ALAT Statement: Idiopathic Pulmonary Fibrosis: Evidence-based Guidelines for Diagnosis and Management. Am. J. Respir. Crit. Care Med. 2011, 183, 788–824. [Google Scholar] [CrossRef]
- Raghu, G.; Remy-Jardin, M.; Myers, J.L.; Richeldi, L.; Ryerson, C.J.; Lederer, D.J.; Behr, J.; Cottin, V.; Danoff, S.K.; Morell, F.; et al. Diagnosis of Idiopathic Pulmonary Fibrosis. An Official ATS/ERS/JRS/ALAT Clinical Practice Guideline. Am. J. Respir. Crit. Care Med. 2018, 198, e44–e68. [Google Scholar] [CrossRef]
- Lynch, D.A.; Sverzellati, N.; Travis, W.D.; Brown, K.K.; Colby, T.V.; Galvin, J.R.; Goldin, J.G.; Hansell, D.M.; Inoue, Y.; Johkoh, T.; et al. Diagnostic criteria for idiopathic pulmonary fibrosis: A Fleischner Society White Paper. Lancet Respir. Med. 2018, 6, 138–153. [Google Scholar] [CrossRef]
- Travis, W.D.; Costabel, U.; Hansell, D.M.; King, T.E., Jr.; Lynch, D.A.; Nicholson, A.G.; Ryerson, C.J.; Ryu, J.H.; Selman, M.; Wells, A.U.; et al. An official American Thoracic Society/European Respiratory Society statement: Update of the international multidisciplinary classification of the idiopathic interstitial pneumonias. Am. J. Respir. Crit. Care Med. 2013, 188, 733–748. [Google Scholar] [CrossRef]
- Ley, B.; Elicker, B.M.; Hartman, T.E.; Ryerson, C.J.; Vittinghoff, E.; Ryu, J.H.; Lee, J.S.; Jones, K.D.; Richeldi, L.; King, T.E.; et al. Idiopathic pulmonary fibrosis: CT and risk of death. Radiology 2014, 273, 570–579. [Google Scholar] [CrossRef]
- Best, A.C.; Meng, J.; Lynch, A.M.; Bozic, C.M.; Miller, D.; Grunwald, G.K.; Lynch, D.A. Idiopathic Pulmonary Fibrosis: Physiologic Tests, Quantitative CT Indexes, and CT Visual Scores as Predictors of Mortality. Radiology 2008, 246, 935–940. [Google Scholar] [CrossRef]
- Watadani, T.; Sakai, F.; Johkoh, T.; Noma, S.; Akira, M.; Fujimoto, K.; Bankier, A.A.; Lee, K.S.; Müller, N.L.; Song, J.-W.; et al. Interobserver Variability in the CT Assessment of Honeycombing in the Lungs. Radiology 2013, 266, 936–944. [Google Scholar] [CrossRef]
- Asakura, A.; Gotoh, T.; Iwasawa, T.; Saitoh, K.; Akasaka, H. Classification System of the CT Images with Non-Specific Interstitial Pneumonia. J. Inst. Image Electron. Eng. Jpn. 2004, 33, 180–188. [Google Scholar] [CrossRef]
- Rosas, I.O.; Yao, J.; Avila, N.A.; Chow, C.K.; Gahl, W.A.; Gochuico, B.R. Automated Quantification of High-Resolution CT Scan Findings in Individuals at Risk for Pulmonary Fibrosis. Chest 2011, 140, 1590–1597. [Google Scholar] [CrossRef]
- Uppaluri, R.; Hoffman, E.A.; Sonka, M.; Hunninghake, G.W.; McLENNAN, G. Interstitial Lung Disease: A quantitative study using the adaptive multiple feature method. Am. J. Respir. Crit. Care Med. 1999, 159, 519–525. [Google Scholar] [CrossRef]
- Bartholmai, B.J.; Raghunath, S.; Karwoski, R.A.B.; Moua, T.; Rajagopalan, S.; Maldonado, F.; Decker, P.A.M.; Robb, R.A. Quantitative Computed Tomography Imaging of Interstitial Lung Diseases. J. Thorac. Imaging 2013, 28, 298–307. [Google Scholar] [CrossRef]
- Humphries, S.M.; Yagihashi, K.; Huckleberry, J.; Rho, B.-H.; Schroeder, J.D.; Strand, M.; Schwarz, M.I.; Flaherty, K.R.; Kazerooni, E.A.; van Beek, E.J.R.; et al. Idiopathic Pulmonary Fibrosis: Data-driven Textural Analysis of Extent of Fibrosis at Baseline and 15-Month Follow-up. Radiology 2017, 285, 270–278. [Google Scholar] [CrossRef]
- Kim, H.J.; Brown, M.S.; Chong, D.; Gjertson, D.W.; Lu, P.; Kim, H.J.; Coy, H.; Goldin, J.G. Comparison of the Quantitative CT Imaging Biomarkers of Idiopathic Pulmonary Fibrosis at Baseline and Early Change with an Interval of 7 Months. Acad. Radiol. 2015, 22, 70–80. [Google Scholar] [CrossRef]
- Park, H.J.; Lee, S.M.; Song, J.W.; Oh, S.Y.; Kim, N.; Seo, J.B. Texture-Based Automated Quantitative Assessment of Regional Patterns on Initial CT in Patients With Idiopathic Pulmonary Fibrosis: Relationship to Decline in Forced Vital Capacity. Am. J. Roentgenol. 2016, 207, 976–983. [Google Scholar] [CrossRef]
- Salisbury, M.L.; Lynch, D.A.; van Beek, E.J.R.; Kazerooni, E.A.; Guo, J.; Xia, M.; Murray, S.; Anstrom, K.J.; Yow, E.; Martinez, F.J.; et al. Idiopathic Pulmonary Fibrosis: The Association between the Adaptive Multiple Features Method and Fibrosis Outcomes. Am. J. Respir. Crit. Care Med. 2017, 195, 921–929. [Google Scholar] [CrossRef]
- Hahn, A.D.; Carey, K.J.; Barton, G.P.; Torres, L.A.; Kammerman, J.; Cadman, R.V.; Lee, K.E.; Schiebler, M.L.; Sandbo, N.; Fain, S.B. Hyperpolarized 129Xe MR Spectroscopy in the Lung Shows 1-year Reduced Function in Idiopathic Pulmonary Fibrosis. Radiology 2022, 305, 688–696. [Google Scholar] [CrossRef]
- Jiao, X.-Y.; Song, H.; Liu, W.-W.; Yang, J.-L.; Wang, Z.-W.; Yang, D.; Huang, S. The effect of CALIPER-derived parameters for idiopathic pulmonary fibrosis in predicting prognosis, progression, and mortality: A systematic review. Eur. Radiol. 2023, 1–12. [Google Scholar] [CrossRef]
- Procter, A.J.; Jacob, J. Visual vs. computer-based computed tomography analysis for the identification of functional patterns in interstitial lung diseases. Curr. Opin. Pulm. Med. 2019, 25, 426–433. [Google Scholar] [CrossRef]
- Kaushik, S.S.; Cleveland, Z.I.; Cofer, G.P.; Metz, G.; Beaver, D.; Nouls, J.; Kraft, M.; Auffermann, W.; Wolber, J.; McAdams, H.P.; et al. Diffusion-weighted hyperpolarized 129Xe MRI in healthy volunteers and subjects with chronic obstructive pulmonary disease. Magn. Reson. Med. 2010, 65, 1154–1165. [Google Scholar] [CrossRef]
- Saam, B.T.; Yablonskiy, D.A.; Kodibagkar, V.D.; Leawoods, J.C.; Gierada, D.S.; Cooper, J.D.; Lefrak, S.S.; Conradi, M.S. MR imaging of diffusion of 3He gas in healthy and diseased lungs. Magn. Reason. Med. 2000, 44, 174–179. [Google Scholar] [CrossRef]
- Kirby, M.; Ouriadov, A.; Svenningsen, S.; Owrangi, A.; Wheatley, A.; Etemad-Rezai, R.; Santyr, G.E.; McCormack, D.G.; Parraga, G. Hyperpolarized3 He and 129Xe magnetic resonance imaging apparent diffusion coefficients: Physiological relevance in older never- and ex-smokers. Physiol. Rep. 2014, 2, e12068. [Google Scholar] [CrossRef]
- Kirby, M.; Svenningsen, S.; Owrangi, A.; Wheatley, A.; Farag, A.; Ouriadov, A.; Santyr, G.E.; Etemad-Rezai, R.; Coxson, H.O.; McCormack, D.G.; et al. Hyperpolarized3He and129Xe MR Imaging in Healthy Volunteers and Patients with Chronic Obstructive Pulmonary Disease. Radiology 2012, 265, 600–610. [Google Scholar] [CrossRef]
- Schreiber, W.G.; Morbach, A.E.; Stavngaard, T.; Gast, K.K.; Herweling, A.; Søgaard, L.V.; Windirsch, M.; Schmiedeskamp, J.; Heussel, C.P.; Kauczor, H.-U. Assessment of lung microstructure with magnetic resonance imaging of hyperpolarized Helium-3. Respir. Physiol. Neurobiol. 2005, 148, 23–42. [Google Scholar] [CrossRef]
- Bink, A.; Hanisch, G.; Karg, A.; Vogel, A.; Katsaros, K.; Mayer, E.; Gast, K.K.; Kauczor, H.-U. Clinical aspects of the apparent diffusion coefficient in 3He MRI: Results in healthy volunteers and patients after lung transplantation. J. Magn. Reson. Imaging 2007, 25, 1152–1158. [Google Scholar] [CrossRef]
- Chan, H.-F.; Weatherley, N.D.; Johns, C.S.; Stewart, N.J.; Collier, G.J.; Bianchi, S.M.; Wild, J.M. Airway Microstructure in Idiopathic Pulmonary Fibrosis: Assessment at Hyperpolarized 3He Diffusion-weighted MRI. Radiology 2019, 291, 223–229. [Google Scholar] [CrossRef]
- Eaden, J.A.; Weatherley, N.D.; Chan, H.-F.; Collier, G.; Norquay, G.; Swift, A.J.; Rajaram, S.; Smith, L.J.; Bartholmai, B.J.; Bianchi, S.M.; et al. Hyperpolarised xenon-129 diffusion-weighted magnetic resonance imaging for assessing lung microstructure in idiopathic pulmonary fibrosis. ERJ Open Res. 2023, 9. [Google Scholar] [CrossRef]
- Tahir, B.A.; Swift, A.J.; Marshall, H.; Parra-Robles, J.; Hatton, M.Q.; Hartley, R.; Kay, R.; E Brightling, C.; Vos, W.; Wild, J.M.; et al. A method for quantitative analysis of regional lung ventilation using deformable image registration of CT and hybrid hyperpolarized gas/1H MRI. Phys. Med. Biol. 2014, 59, 7267–7277. [Google Scholar] [CrossRef]
- Doganay, O.; Matin, T.; Chen, M.; Kim, M.; McIntyre, A.; McGowan, D.R.; Bradley, K.M.; Povey, T.; Gleeson, F.V. Time-series hyperpolarized xenon-129 MRI of lobar lung ventilation of COPD in comparison to V/Q-SPECT/CT and CT. Eur. Radiol. 2018, 29, 4058–4067. [Google Scholar] [CrossRef]
- Mathew, L.; Wheatley, A.; Castillo, R.; Castillo, E.; Rodrigues, G.; Guerrero, T.; Parraga, G. Hyperpolarized (3)He Magnetic Resonance Imaging: Comparison with four-dimensional x-ray computed tomography imaging in lung cancer. Acad. Radiol. 2012, 19, 1546–1553. [Google Scholar] [CrossRef]
- Capaldi, D.P.; Zha, N.; Guo, F.; Pike, D.; McCormack, D.G.; Kirby, M.; Parraga, G. Pulmonary Imaging Biomarkers of Gas Trapping and Emphysema in COPD:3He MR Imaging and CT Parametric Response Maps. Radiology 2016, 279, 597–608. [Google Scholar] [CrossRef]
- MacNeil, J.L.; Capaldi, D.P.I.; Westcott, A.R.; Eddy, R.L.; Barker, A.L.; McCormack, D.G.; Kirby, M.; Parraga, G. Pulmonary Imaging Phenotypes of Chronic Obstructive Pulmonary Disease Using Multiparametric Response Maps. Radiology 2020, 295, 227–236. [Google Scholar] [CrossRef]
- Tafti, S.; Garrison, W.J.; Mugler, J.P.; Shim, Y.M.; Altes, T.A.; Mata, J.F.; de Lange, E.E.; Cates, G.D.; Ropp, A.M.; Wang, C.; et al. Emphysema Index Based on Hyperpolarized 3He or 129Xe Diffusion MRI: Performance and Comparison with Quantitative CT and Pulmonary Function Tests. Radiology 2020, 297, 201–210. [Google Scholar] [CrossRef]
- Petersson-Sjögren, M.; Chan, H.-F.; Collier, G.J.; Norquay, G.; Olsson, L.E.; Wollmer, P.; Löndahl, J.; Wild, J.M. Airspace Dimension Assessment (AiDA) by inhaled nanoparticles: Benchmarking with hyperpolarised 129Xe diffusion-weighted lung MRI. Sci. Rep. 2021, 11, 4721. [Google Scholar] [CrossRef]
- Ebner, L.; Kammerman, J.; Driehuys, B.; Schiebler, M.L.; Cadman, R.V.; Fain, S.B. The role of hyperpolarized 129xenon in MR imaging of pulmonary function. Eur. J. Radiol. 2016, 86, 343–352. [Google Scholar] [CrossRef]
- Chan, H.-F.; Stewart, N.J.; Norquay, G.; Collier, G.J.; Wild, J.M. 3D diffusion-weighted 129 Xe MRI for whole lung morphometry. Magn. Reson. Med. 2017, 79, 2986–2995. [Google Scholar] [CrossRef]
- Avants, B.B.; Tustison, N.J.; Song, G.; Cook, P.A.; Klein, A.; Gee, J.C. A reproducible evaluation of ANTs similarity metric performance in brain image registration. NeuroImage 2011, 54, 2033–2044. [Google Scholar] [CrossRef]
- Chefd’Hotel, C.; Hermosillo, G.; Faugeras, O. A variational approach to multi-modal image matching. Proceedings the IEEE Workshop on Variational and Level Set Methods in Computer Vision, Vancouver, BC, Canada, 13 July 2001; pp. 21–28. [Google Scholar]
- Avants, B.; Epstein, C.; Grossman, M.; Gee, J. Symmetric diffeomorphic image registration with cross-correlation: Evaluating automated labeling of elderly and neurodegenerative brain. Med. Image Anal. 2008, 12, 26–41. [Google Scholar] [CrossRef]
- Halaweish, A.F.; Hoffman, E.A.; Thedens, D.R.; Fuld, M.K.; Sieren, J.P.; van Beek, E.J.R. Effect of Lung Inflation Level on Hyperpolarized3He Apparent Diffusion Coefficient Measurements in Never-Smokers. Radiology 2013, 268, 572–580. [Google Scholar] [CrossRef]


Disclaimer/Publisher’s Note: The statements, opinions and data contained in all publications are solely those of the individual author(s) and contributor(s) and not of MDPI and/or the editor(s). MDPI and/or the editor(s) disclaim responsibility for any injury to people or property resulting from any ideas, methods, instructions or products referred to in the content. |
© 2023 by the authors. Licensee MDPI, Basel, Switzerland. This article is an open access article distributed under the terms and conditions of the Creative Commons Attribution (CC BY) license (https://creativecommons.org/licenses/by/4.0/).