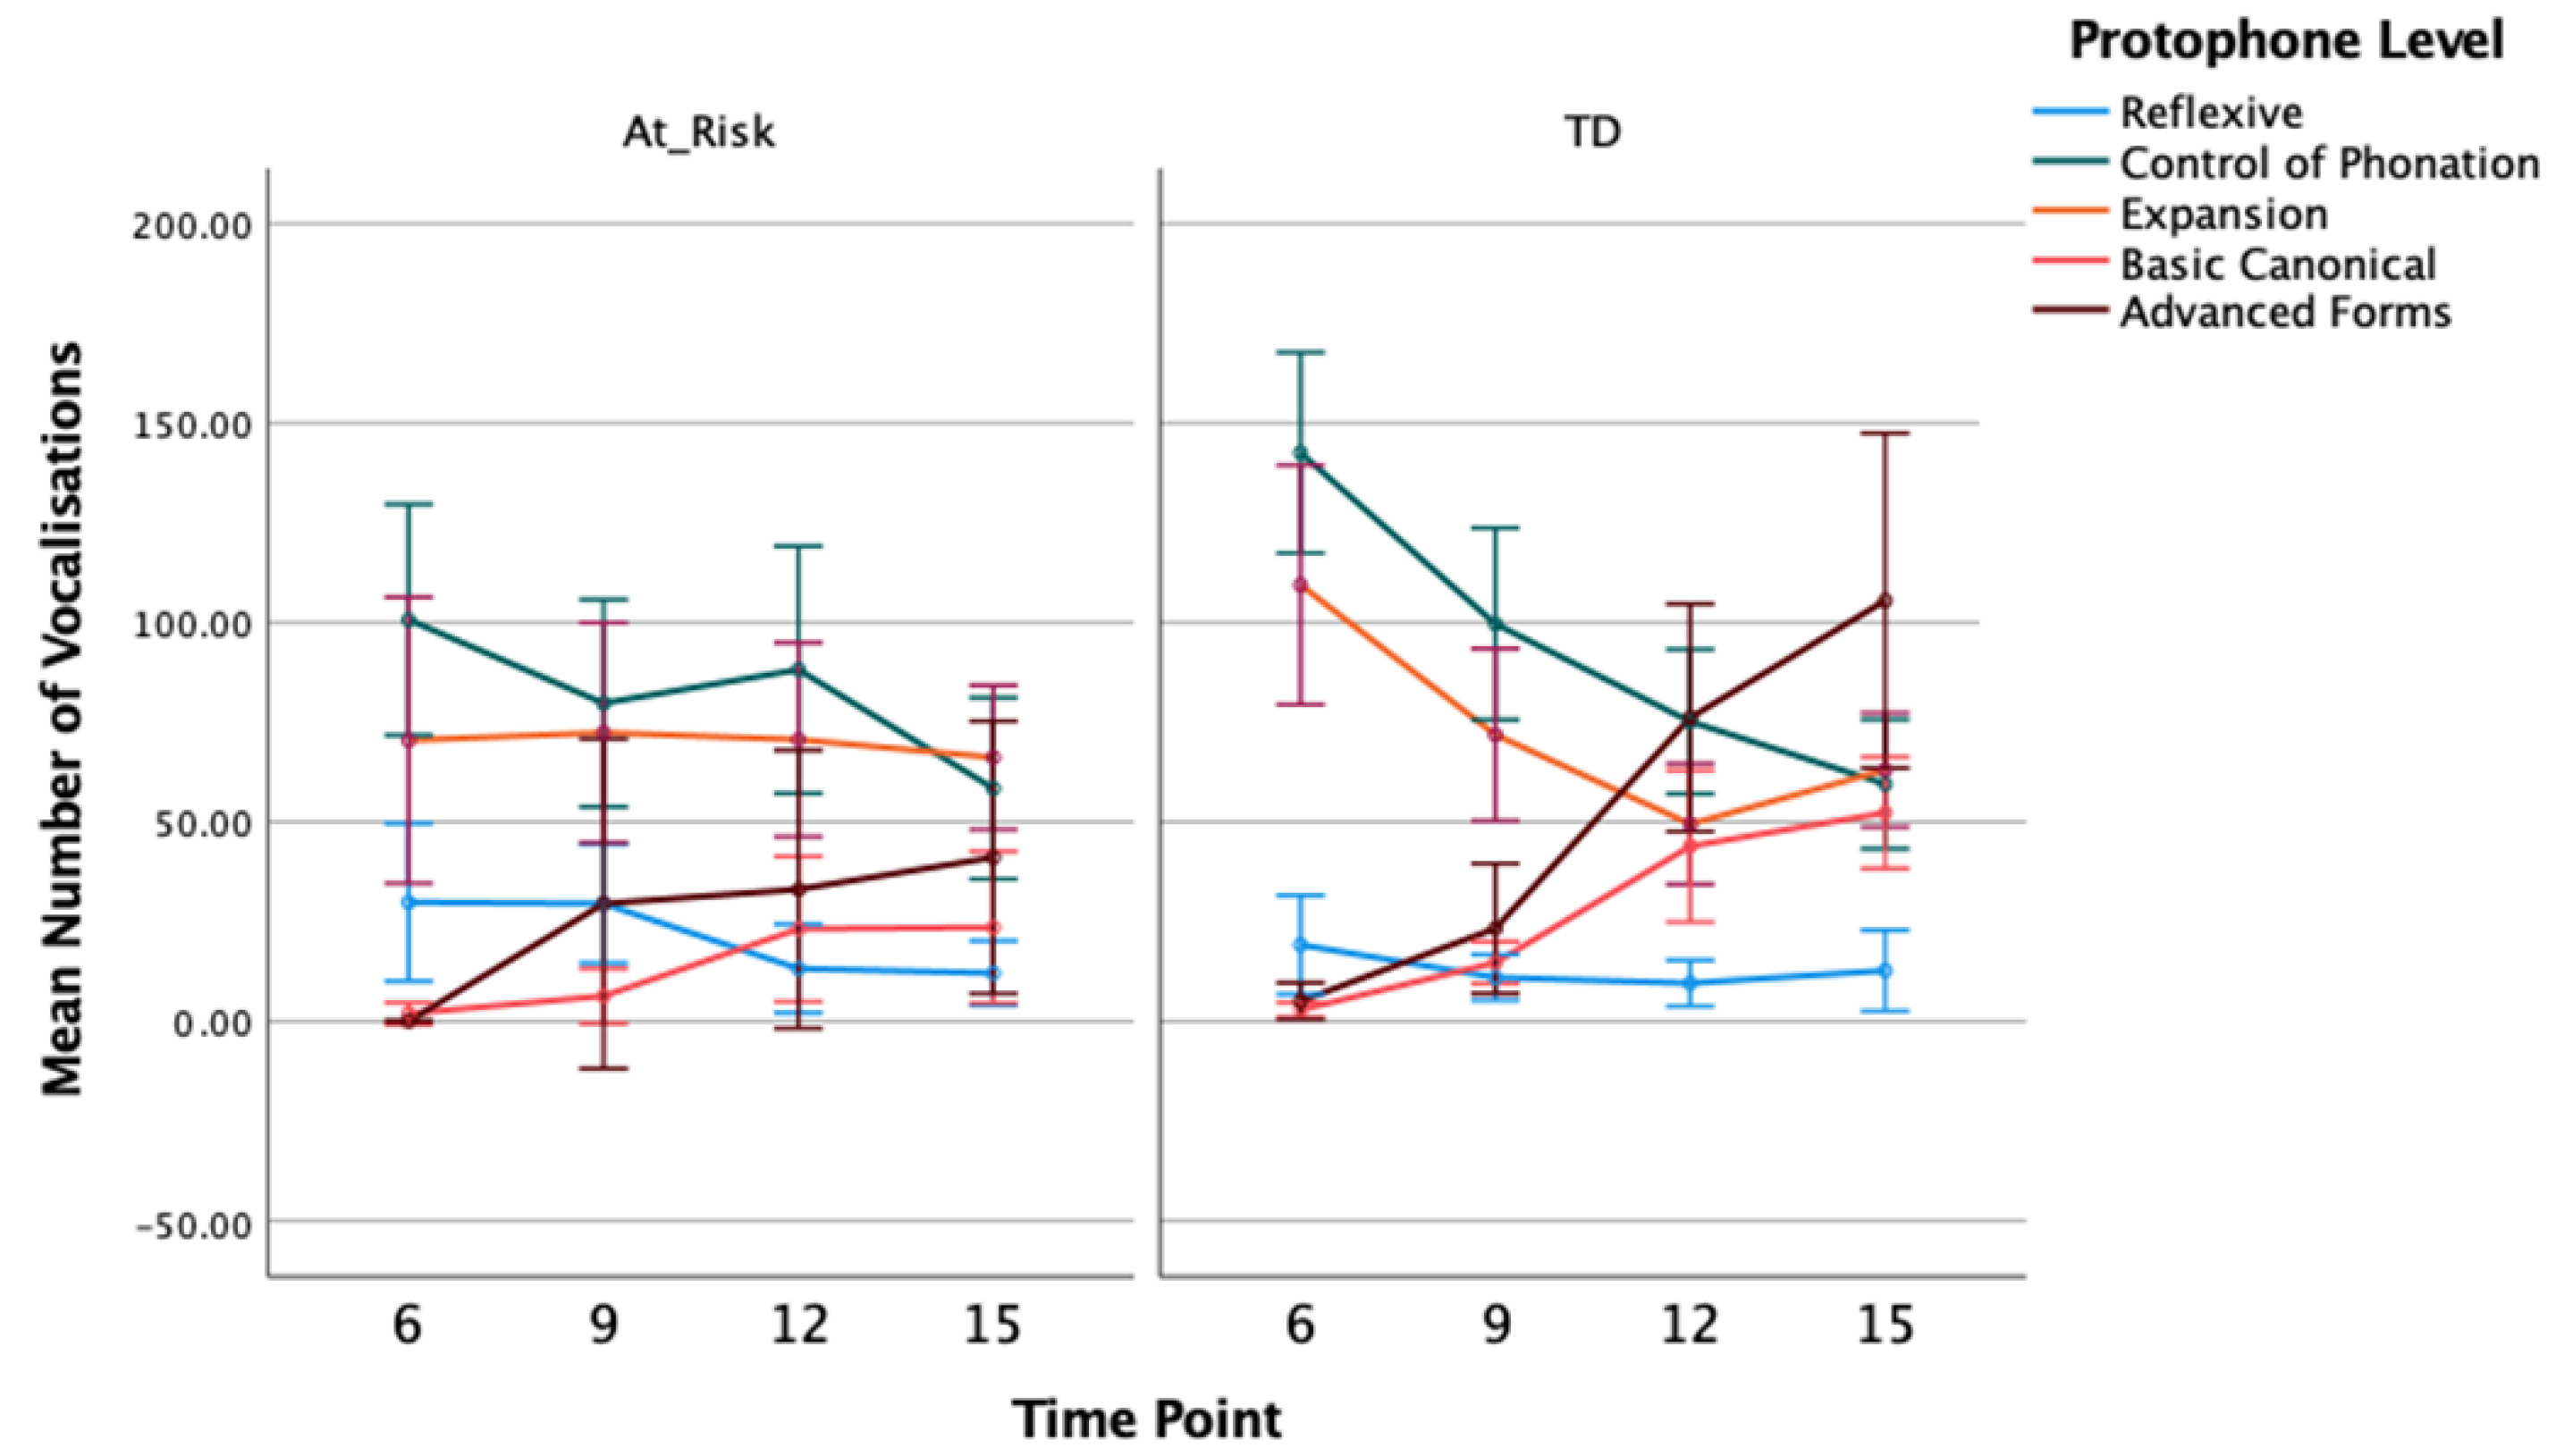
3.1.2. Number of Protophones
The mean number of utterances and vocalisations coded at each protophone level, split by group and time, are included in
Table 2. Visual displays of the timelines for each group with 95% confidence intervals are in
Figure 1 and
Figure 2. As a general pattern, the most common protophones at the youngest age of 6 months are the pre-canonical control of phonation and expansion type level sounds, followed by reflexive sounds. There were comparably few basic canonical sounds produced and advanced sounds are largely absent. For TD, in particular, there is a reduction in the pre-canonical sounds across the time points up to 15 months of age and a corresponding increase in basic canonical and advanced forms. These changes are evident in the percentage data reported below, as well. For the at-risk infants, there are some exceptions to this overall pattern, however, with differences supported by the results of the GLMM analyses as follows.
For the number of reflexive level utterances, GLMM analysis showed a main effect of time,
F(3, 119) = 4.490,
p = 0.005, η
p = 0.08, with a trend for the number of reflexive utterances to decrease at later time points (12 and 15 months) compared to earlier time points (6 and 9 months), but no overall group effect,
F(1, 119) = 3.039,
p = 0.084, η
p = 0.09, or group by time interaction,
F(3, 119) = 1.409,
p = 0.243, η
p = 0.02 (
Figure 1).
Similar results were found for the number of reflexive vocalisations; the mean number of reflexive vocalisations across both groups reduced over time,
F(3, 119) = 3.572,
p = 0.016, η
p = 0.08, but there was no group,
F(1, 119) = 3.736,
p = 0.056, η
p = 0.08, or group by time interaction,
F(3, 119) = 2.162,
p = 0.096, η
p = 0.05 (
Figure 2). The near-significant group effect appears to be due to a larger overall number of reflexive type vocalisations for at-risk infants compared to TD infants. Contrast analysis with adjusted p values showed the group difference at 9 months of age was statistically significant,
t(119) = 2.563,
p = 0.012. Descriptively, as shown in
Figure 2, there was a reduction in the number of reflexive sounds produced at 9 months compared to 6 months for TD infants, whereas at-risk infants did not show a reduction in reflexive sounds until after 9 months. This delay in the decline of reflexive sounds for at-risk infants may have contributed to the group difference at 9 months, in particular.
Analysis of utterances coded as control of phonation showed a significant decline over time, F(3, 119) = 13.528, p < 0.001, ηp = 0.33, as well as no group main effect, F < 1, and no significant interaction between group and time, F(3, 119) = 2.605, p = 0.055, ηp = 0.07. This pattern was also seen in the number of control of phonation type vocalisations: time as a main effect was significant, F(3, 119) = 15.603, p < 0.001, ηp = 0.31, but not group, F(1, 119) = 1.958, p = 0.164, ηp = 0.05, or the interaction between group and time, F(3, 119) = 2.365, p = 0.075, ηp = 0.08.
For the number of expansion type utterances, there were no significant main effects of group,
F(1, 119) = 2.551,
p = 0.113, η
p = 0.07, and time,
F(3, 119) = 2.438,
p = 0.068, η
p = 0.08, and no group by time interaction,
F(3, 119) = 1.185,
p = 0.318, η
p = 0.06. There was also no group,
F < 1, and no time effect,
F(3, 119) = 2.552,
p = 0.059, η
p = 0.09, for the number of expansion type vocalisations, but there was a significant group by time interaction,
F(3, 119) = 3.450,
p = 0.019, η
p = 0.12. The mean number of expansions reduced after 6 months for the TD group, with contrasts between the 6-month and all later time points being statistically significant (
ps < 0.05). There was no significant change over time for the at-risk group in the mean number of expansion vocalisations (
Figure 2).
GLMM analysis showed an increase in the number of basic canonical utterances from 6 to 15 months of age averaged across both groups, F(3, 119) = 14.811, p < 0.001, ηp = 0.39. Overall, the TD group produced more canonical syllables than at-risk infants, F(1, 119) = 9.244, p = 0.003, ηp = 0.23. Pair-wise contrasts with adjusted p values showed significant group differences at 9 and 15 months, t(119) = 3.134, p = 0.002, t(119) = 2.346, p = 0.021, respectively, but not 6 and 12 months, t(119) = 0.962, p = 0.338, t(119) = 1.757, p = 0.081, respectively. The rate of increase in production of canonical utterances across time was greater for TD children compared to at-risk children, however, the interaction between group and time did not reach statistical significance, F(3, 119) = 2.498, p = 0.063, ηp = 0.06. Findings were similar for the number of basic canonical vocalisations. There was a main effect of time, F(3, 119) = 22.762, p < 0.001, ηp = 0.37, with number of basic canonical vocalisations increasing with age, especially from the 9- to 12-month time point. The group main effect was significant, F(1, 119) = 9.564, p = 0.002, ηp = 0.24, with contrasts showing TD children produced significantly more basic canonical vocalisations than at-risk children at 9 and 15 months, t(119) = 2.127, p = 0.035, t(119) = 2.684, p = 0.008, respectively, but not 6 and 12 months, t(119) = 1.045, p = 0.298, t(119) = 1.730, p = 0.086, respectively. However, the interaction between group and time, in this instance, was statistically significant, F(3, 119) = 3.189, p = 0.026, ηp = 0.07, confirming a greater increase over time in the number of basic canonical vocalisations for TD than at-risk children.
Given none of the children produced advanced canonical forms at 6 months of age, this time point was excluded from analysis. Similar to the number of basic canonical utterances, there was an effect of time showing an increase in the number of advanced utterances from 9 to 15 months, F(2, 93) = 11.829, p < 0.001, ηp = 0.29. Although, numerically, the TD group produced more advanced utterances than the at-risk group, there was no group main effect, F(1, 93) = 3.292, p = 0.073, ηp = 0.10, and while the increase over time in advanced forms was greater for TD than at-risk children, the interaction between group and time was not significant, F(2, 93) = 1.976, p = 0.144, ηp = 0.05. For the number of advanced vocalisations, there was a main effect of time, F(2, 93) = 5.967, p = 0.004, ηp = 0.19, showing the number of advanced vocalisations increased from 9 to 15 months, and while the group main effect was not significant, F(1, 93) = 3.767, p = 0.055, ηp = 0.11, there was a significant interaction between group and time, F(2, 93) = 3.766, p = 0.027, ηp = 0.12. Contrasts showed no difference between groups at 9 months of age, t(93) = 0.309, p = 0.758. The TD group showed a significantly higher number of advanced vocalisations than the at-risk group at both 12 and 15 months of age, t(93) = 2.102, p = 0.038, t(93) = 2.606, p = 0.011, respectively, consistent with a greater increase in the production of advanced forms for TD children compared to children at risk of CP across the 9- to 15-month age range.
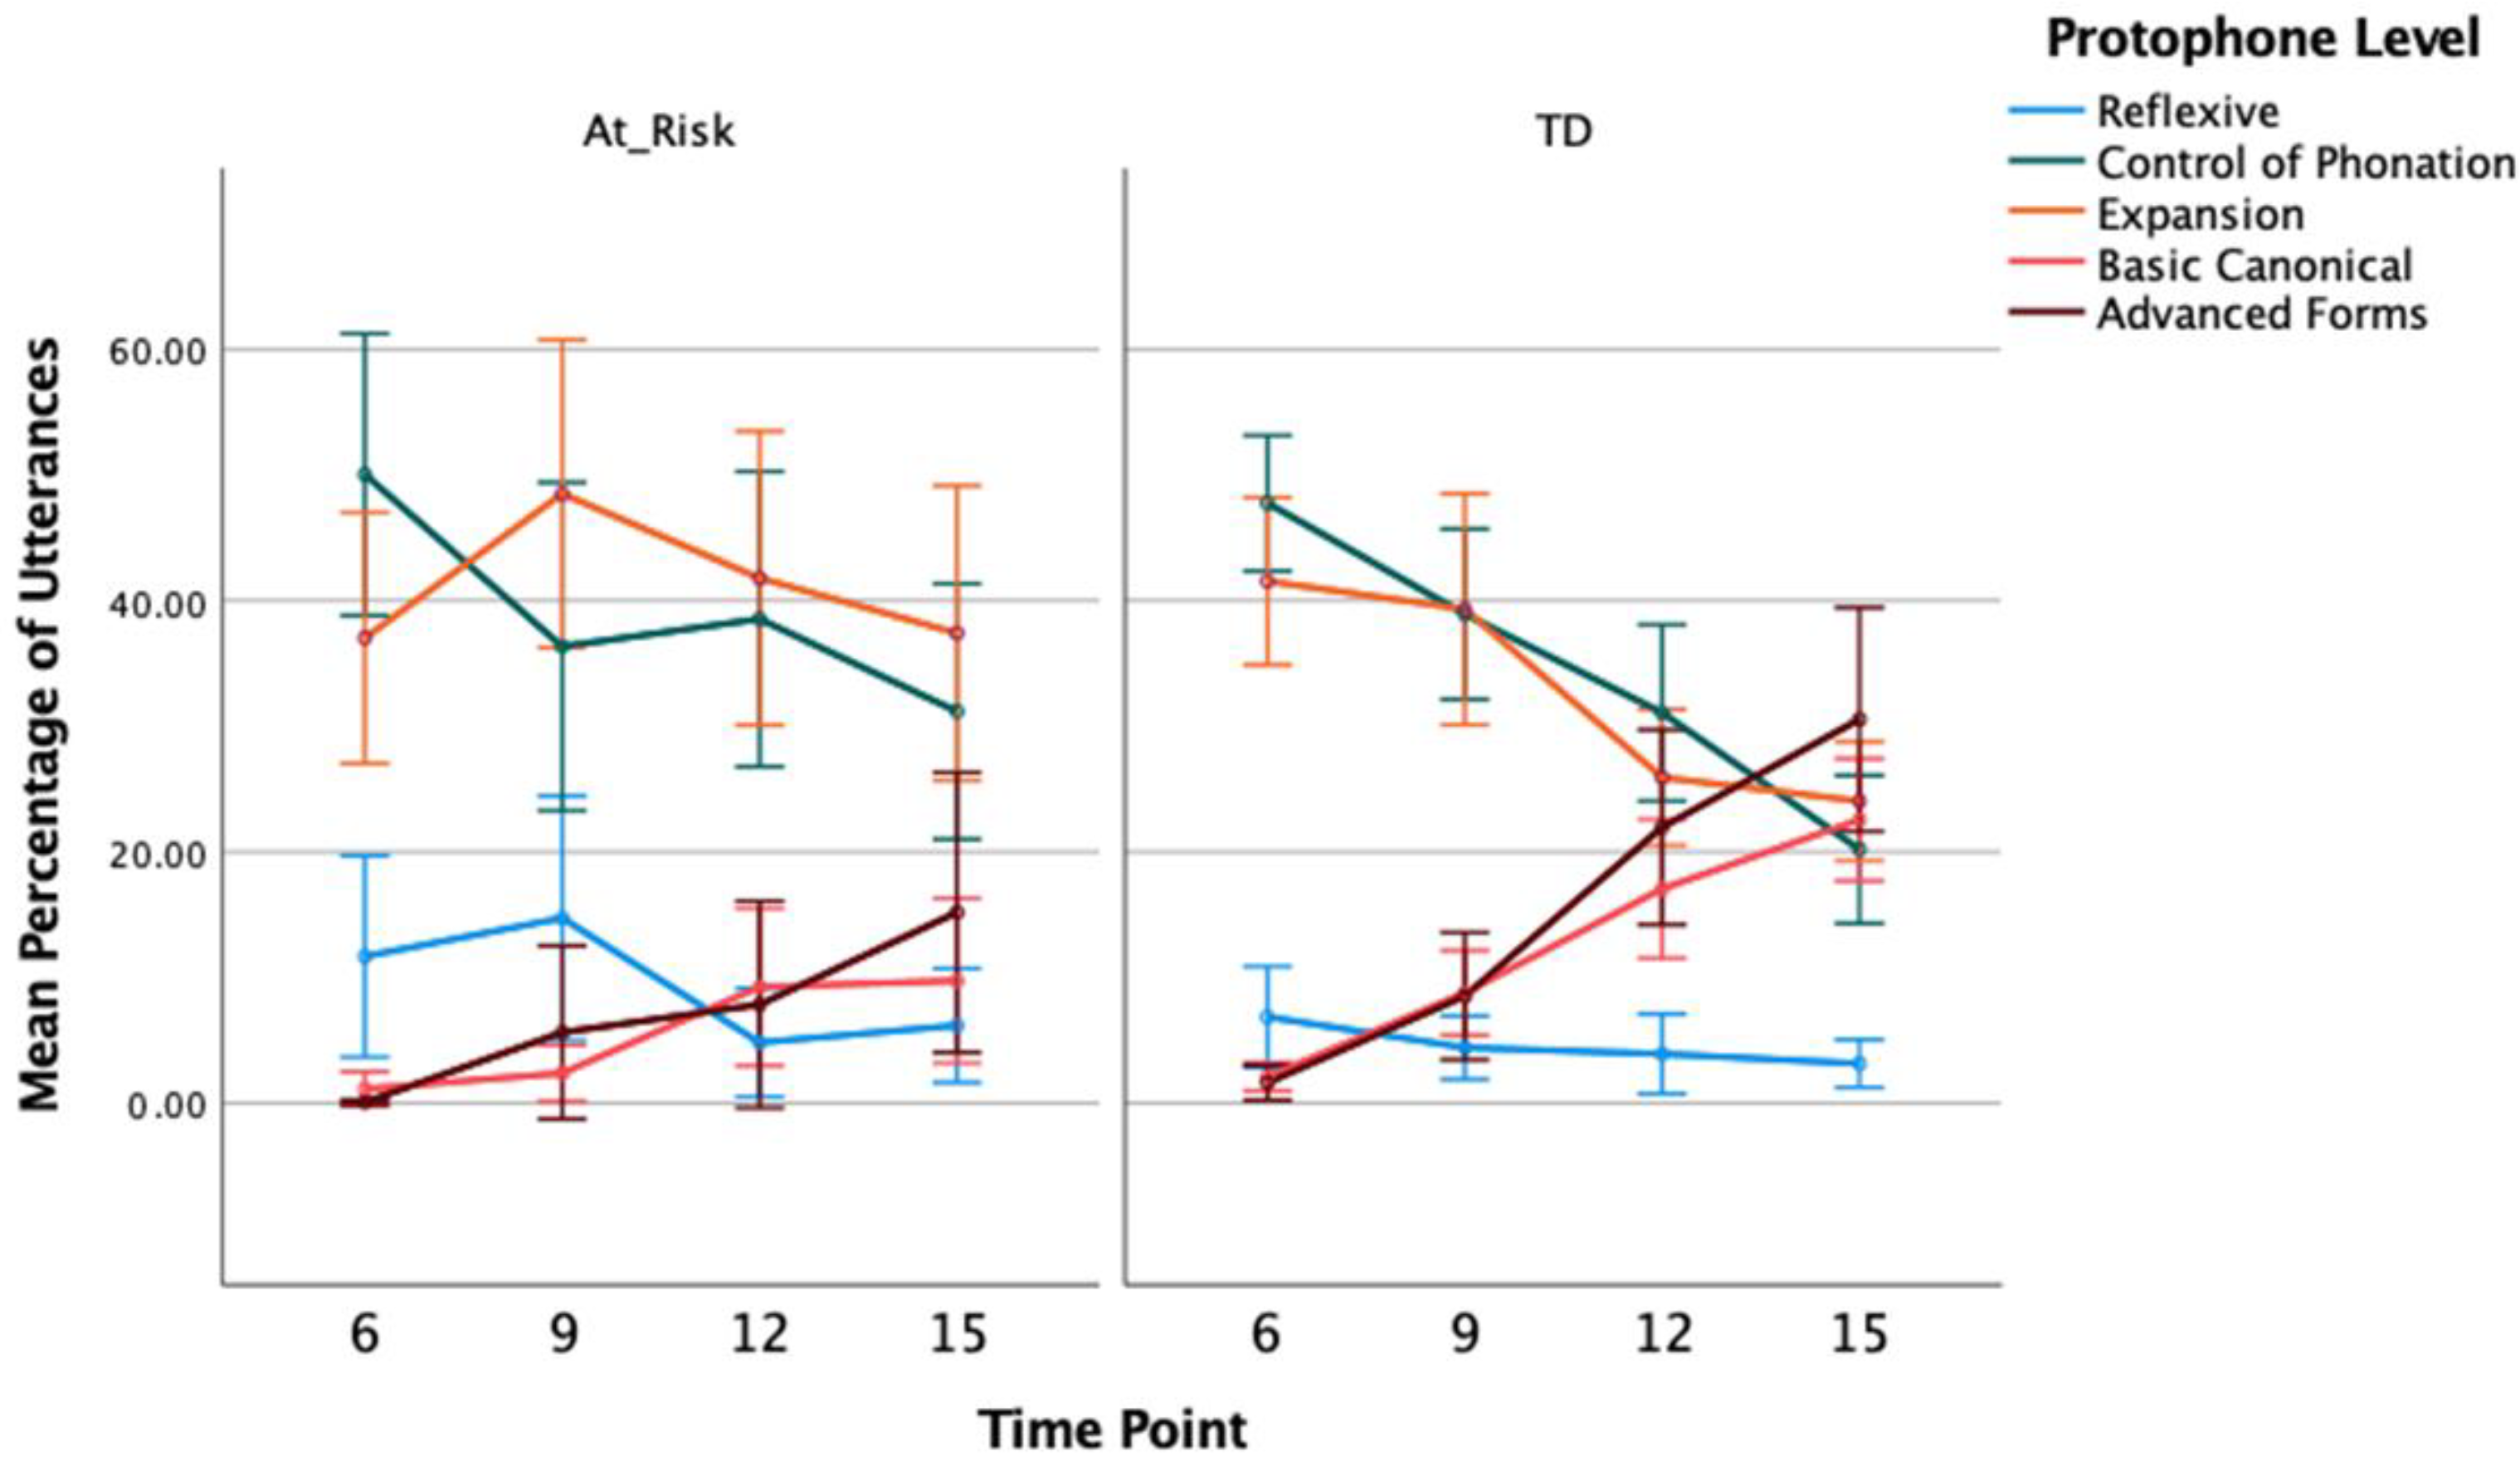
3.1.3. Percentage of Protophones
Figure 3 (see, also,
Table 3) shows the percentage of utterances coded at each protophone level according to the SAEVD-R for at-risk and TD groups at 6, 9, 12, and 15 months of age.
GLMM analysis showed the percentage of reflexive utterances to be greater overall for at-risk compared to TD children, F(1, 119) = 4.296, p = 0.040, ηp = 0.12. Pair-wise contrasts showed the group difference was significant at 9 months, in particular, t(119) = 2.275, p = 0.025. The percentage of reflexive utterances reduced significantly across time, collapsed across both groups, F(3, 119) = 4.653, p = 0.004, ηp = 0.11, with the largest decrease occurring between 9 and 12 months. The interaction between group and time was not statistically significant, F(3, 119) = 2.163, p = 0.096, ηp = 0.07. These results were mirrored in the analysis of percentage of reflexive vocalisations, with the GLMM showing a main effect of group, F(1, 119) = 5.356, p = 0.022, ηp = 0.13, and time, F(3, 119) = 3.774, p = 0.013, ηp = 0.13, but no significant interaction between group and time, F(3, 119) = 1.782, p = 0.154, ηp = 0.05. Contrasts showed the group difference was only significant at 9 months with at-risk children showing a greater percentage of reflexive vocalisations, t(119) = 2.487, p = 0.014.
There was a significant decrease in the percentage of control of phonation utterances across time (
Figure 3),
F(3, 119) = 9.989,
p < 0.001, η
p = 0.30, but no difference between groups,
F(1, 119) = 2.098,
p = 0.150, η
p = 0.10, or interaction between group and time,
F < 1. Again, these results were mirrored in the percentage of control of phonation vocalisations (
Figure 4): there was a main effect of time,
F(3, 119) = 12.886,
p < 0.001, η
p = 0.37, but no group effect,
F < 1, or group by time interaction,
F(3, 119) = 1.863,
p = 0.140, η
p = 0.06.
For the percentage of expansion type utterances, there was a significant decline across time, F(3, 119) = 3.719, p = 0.013, ηp = 0.14, and the main effect of group showed the percentage of utterances coded as expansion was higher for the at-risk group than the TD group, F(1, 119) = 5.700, p = 0.019, ηp = 0.16. Contrasts showed group differences were significant at 12 and 15 months of age, t(119) = 2.724, p = 0.007, t(119) = 2.342, p = 0.021. Although the group difference was significant at later time points, the interaction between group and time was not significant, F(3, 119) = 2.333, p = 0.078, ηp = 0.09. For the percentage of expansion type vocalisations, there was a significant group effect with a higher percentage of expansions for at-risk compared to TD, F(1, 119) = 4.066, p < 0.046, ηp = 0.12. Contrasts also showed this group difference at 12 and 15 months only, t(119) = 2.816, p = 0.006, t(119) = 2.917, p = 0.004. There was no significant main effect of time, F(3, 119) = 2.258, p = 0.085, ηp = 0.09, and no interaction between group and time, F(3, 119) = 1.659, p = 0.180, ηp = 0.11.
The percentage of basic canonical utterances increased across time,
F(3, 119) = 20.899,
p < 0.001, η
p = 0.45, and the TD group showed a higher percentage, overall, compared to the at-risk group,
F(1, 119) = 16.045,
p < 0.001, η
p = 0.33. The interaction between group and time was also significant,
F(3, 119) = 4.212,
p = 0.007, η
p = 0.10. The increase over time in the percentage of canonical utterances was greater for TD than at-risk children (
Figure 3). While at 6 months the two groups did not differ,
t(119) = 1.473,
p = 0.143, the TD children showed a significantly higher percentage of basic canonical utterances at each subsequent time point,
t(119) = 3.448,
p = 0.001,
t(119) = 2.060,
p = 0.042,
t(119) = 3.455,
p = 0.001, for 9, 12, and 15 months, respectively. These results were replicated in the percentage of basic canonical vocalisations with significant effects of group,
F(1, 119) = 11.854,
p < 0.001, η
p = 0.28, time,
F(3, 119) = 26.165,
p < 0.001, η
p = 0.41, and group by time interaction,
F(3, 119) = 4.019,
p = 0.009, η
p = 0.06 (
Figure 4).
Excluding the 6-month time point, GLMM analysis of the percentage of advanced form utterances showed an effect of time, F(2, 93) = 15.459, p < 0.001, ηp = 0.33, with an overall increase in advanced utterances at each time point. While the TD group percentage was higher than that of the at-risk group when tested as a main effect, F(1, 93) = 6.473, p = 0.013, ηp = 0.17, there was also a significant interaction between group and time, F(2, 93) = 4.430, p = 0.015, ηp = 0.08. From a similar percentage at 9 months, the TD group showed a steeper trajectory with increasing age than the at-risk group. Contrasts confirmed there was no group difference at 9 months, t(93) = 0.747, p = 0.457, but the TD group had a significantly higher percentage of advanced forms at both 12 and 15 months of age, t(93) = 2.743, p = 0.007, t(93) = 2.370, p = 0.020, respectively. For the percentage of advanced vocalisations, there was also a significant group effect, F(1, 93) = 4.900, p = 0.029, ηp = 0.14, time effect, F(2, 93) = 12.312, p < 0.001, ηp = 0.28, and group by time interaction, F(2, 93) = 4.407, p = 0.015, ηp = 0.10, with significant group contrasts at the 12- and 15-month time points, t(93) = 2.779, p = 0.007, t(93) = 2.199, p = 0.030. As with the percentage of utterances, at-risk children produced a smaller percentage of advanced vocalisations at those two later time points.

 ,
, 

