Abstract
A key process in the development of atherosclerotic plaques is the recruitment of monocytes into the artery wall. Using spectral photon-counting computed tomography we examine whether monocyte deposition within the artery wall of ApoE-/- mouse can be detected. Primary mouse monocytes were labelled by incubating them with 15 nm gold nanoparticles coated with 11-mercaptoundecanoic acid The monocyte uptake of the particle was confirmed by electron microscopy of the cells before injection into 6-week-old apolipoprotein E deficient (ApoE-/-) mouse that had been fed with the Western diet for 10 weeks. Four days following injection, the mouse was sacrificed and imaged using a MARS spectral photon counting computed tomography scanner with a spectral range of 7 to 120 KeV with five energy bins. Imaging analysis showed the presence of X-ray dense material within the mouse aortic arch which was consistent with the spectral characteristic of gold rather than calcium. The imaging is interpreted as showing the deposition of gold nanoparticles containing monocytes within the mouse aorta. The results of our study determined that spectral photon-counting computed tomography could provide quantitative information about gold nanoparticles labelled monocytes in voxels of 90 × 90 × 90 µm3. The imaging was consistent with previous micro-CT and electron microscopy of mice using the same nanoparticles. This study demonstrates that spectral photon-counting computed tomography, using a MARS small bore scanner, can detect a fundamental atherogenic process within mouse models of atherogenesis. The present study demonstrates the feasibility of spectral photon-counting computed tomography as an emerging molecular imaging modality to detect atherosclerotic disease.
1. Introduction
Cardiovascular disease (CVD) is a silent and progressive disease, which is difficult to detect before the onset of a clinical event, such as a stroke or myocardial infarction. The underlying pathology of CVD is the formation of atherosclerotic plaques within the artery wall [1]. Atherosclerotic plaques are made of inflammatory cells, mainly macrophages, T-cells, and smooth muscle cells, which are recruited into the inner wall of the artery [2]. Plaque progression is driven by chronic inflammatory processes which are exacerbated by a range of factors, including high plasma cholesterol, smoking, diabetes and age [3]. The growth of plaque due to the increasing number of these inflammatory cells in the artery wall reduces the artery elasticity and blood flow to key organs. In advanced plaques, significant cell death occurs leading to plaque destabilisation and rupture. The exposed plaque interior components trigger clot formation which may block the artery downstream from the ruptured plaque.
Artery plaques are difficult to detect by biochemical testing (blood or urine samples) or by imaging until they reach a significant size, at which point patients are usually experiencing various symptoms as a result of the plaque(s) presence or even its rupture [4,5,6]. Though plaques are sites of chronic inflammation, to date it has been difficult to devise definitive markers of plaque growth or destabilisation [7]. As a result, clinicians rely on the measurement of various risk factors to identify at-risk individuals for potential treatment. Artery plaques range in thickness from half a millimetre to three millimetres with a tissue composition similar to the surrounding tissues when viewed by X-ray or ultrasound imaging. In the advanced stages of the disease plaques can become calcified, so are relatively easy to detect by X-ray imaging. This makes the imaging of these plaque structures at an early or intermediate stage very challenging when calcification has not occurred. Even in advanced plaques it is difficult to detect the formation of unstable necrotic core regions by radiological imaging.
Magnetic resonance imaging (MRI), magnetic resonance angiography (MRA), and multidetector computed tomography angiography (MDCTA) are the leading imaging tools to detect aortic diseases [8]. The main challenge with MRI and MRA is a prolonged acquisition time that causes significant artefacts due to respiratory motion. This motion reduces the contrast-to-noise ratio and spatial resolution and requires ECG-gating to correct motion artefacts [9]. MDCTA uses a multirow detector to image a larger field of view, enabling shorter scan times, improved signal-to-noise ratio, and fewer image artefacts. However, difficulty in differentiating intramural hematoma, atherosclerotic plaque, and thrombus, all of which are highly attenuating, remains the primary concern in interpreting the result [10]. Although functional molecular imaging like positron emission tomography (PET)/CT or less commonly used PET/MRI can resolve this problem [11], PET availability, associated costs, low spatial resolution (about 6 mm) [12] and radionuclide radiation exposure limit the usage of these types of imaging techniques [13].
Spectral photon-counting CT (SPCCT) is a new generation of CT scanner that has received much attention in recent years [14,15,16]. SPCCT has evolved the concept of dual-energy CT (DECT) to emerge as the potential future of clinical CT imaging [14,17]. All elements have unique spectral attenuation properties. Suitable X-ray spectral characteristics within the diagnostic energy range allow key elements to be readily identified spectrally. The use of only two energy bands in DECT limits the specific identification of a number of materials, with DECT only able to separate contrast agents with significantly different X-ray attenuation coefficients. In contrast, SPCCT uses photon processing detectors, which differentiate a single broad X-ray spectrum into multiple energy bins. As a result, SPCCT is able to characterize multiple tissues, contrast agents, and even closely attenuating materials in a single acquisition with high CT contrast sensitivity and accuracy [18,19]. SPCCT has the potential to differentiate intramural hematoma from atherosclerotic plaque, even in the absence of a contrast agent [20,21,22].
Using SPCCT based MARS-CT machines developed by MARS Bioimaging Ltd., we have imaged ex-vivo human atherosclerotic plaques [23], crystalline arthropathies [24] and different types of calcium [25], excised osteoarthritic cartilage [26], high-Z materials including functionalized and non-functionalized nanoparticles [19,27], and soft tissue quantification [28] at sub-millimetre resolution.
SPCCT imaging offers the possibility to track specific cell types using nanoparticle labelling of cells [29,30]. A key early process driving plaque formation is the requirement of monocytes and macrophages into the artery wall [31]. Detection of this process has the potential to detect active plaque progression at a very early stage of the disease. In this research we examine whether SPCCT can detect the recruitment of AuNP-labelled monocytes into a mouse’s artery wall. Previous work had shown that the injection of AuNP-labelled monocytes into ApoE-/- mice resulted in the collection of X-ray dense material in the aortic arch of the mouse [32].
2. Materials and Methods
The scanner employed for this study was the MARS small animal spectral scanner, which uses a camera that incorporates seven Medipix3RX (Medipix3RX Collaboration, CERN) chips [33]. Each chip contains 128 × 128 pixels with a pixel pitch of 110 µm and is bump bonded to a cadmium zinc telluride (CZT) sensor layer. The MARS scanner features an energy resolution of 2.5 keV FWHM (full width half maximum) and can operate up to eight energy bins within the diagnostic energy range (20–120 keV). The MARS system enables simultaneous identification and quantification of multiple materials through individual photon energy measurements [34].
Data was acquired using a micro-focus poly-energetic X-ray source with a tungsten target (SB-120-350; Source-Ray Inc, Ronkonkoma, NY, USA). The energy thresholds were chosen to take into account the gold K-edge (80.7 keV) while retaining high resolution of bone and soft-tissue. To prevent imaging artifacts caused by narrow energy bins, a minimum of 10 keV intervals was used between thresholds. Based on the test with phantoms, the energy bins of 7–40, 40–50, 50–60, 60–79, and 79–118 keV were selected as they gave good differentiation between gold nanoparticles (AuNPs), calcium, and soft tissue in the spectral response. Reconstruction of the acquired data was performed using an in-house algorithm, referred to as MARS-recon [34]. The experimental setup is summarised in Table 1.

Table 1.
Summary of MARS spectral CT scanning protocol. SDD: source-to-detector distance. SOD: source-to-object distance.
Pixel masking was applied prior to scanning to remove noisy pixels, including non-functional, high and low sensitive pixels [35]. The raw data was collected into DICOM (Digital Imaging and Communications in Medicine) files and transferred to the scanner’s image processing system. The acquired data from five energy bins was flatfield corrected and ring artefacts filtered before MARS_recon (iterative reconstruction algorithm [36]) simultaneously reconstructed all energy bins into an 834 × 834 pixels, using a voxel size of 90 × 90 × 90 µm3.
Two material decomposition (MD) methods were applied. Both methods required a material calibration phantom. The first method used the calibration phantom spectral response as a reference. The spectral response of individual pixels at the region of interest within the biological sample (aorta) were compared to the reference to determine what material was present and at what concentration. A semi-automatic program was employed to process each pixel and measure the spectral response. The second method employed in-house MD software (MARS MD), which uses the reconstructed attenuation images from all energy bins to produce material density images for a set of preselected materials. Each material needs a set of mass attenuation coefficients to relate attenuation to density. These were obtained experimentally using the material calibration phantom. The MD algorithm is based on a non-negative constrained linear least-squares technique [34,37]. Both MD methods were applied to the same mouse dataset.
2.1. Material Calibration Phantom
The reference spectral responses and effective mass attenuation coefficients needed for MD were obtained by scanning a calibration phantom. A customized PMMA (polymethyl methacrylate) phantom held 200 µL Eppendorf PCR tubes containing AuNP solutions of various concentrations (0.5, 1, 2, 4, 8 and 10 mg/mL), hydroxyapatite (HA) rods (HA 50, 100, 200, 400 and 800 mg/cm3; HA acquired from QRM GmbH), water, and lipid (Figure 1). To evaluate the effect of soft tissue on the material attenuation profile, a layer of lamb red meat was wrapped around the phantom. The calibration phantoms were used to evaluate the linearity of the response to AuNP and HA concentrations and evaluate the spectroscopic response of the detector for different materials.
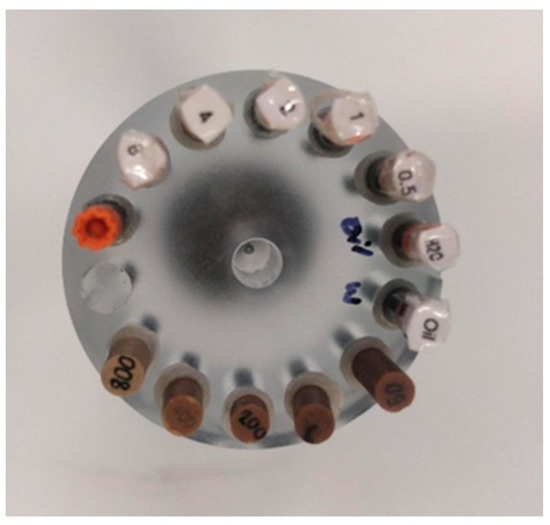
Figure 1.
Photo of the calibration phantom. PMMA calibration phantom with eight 200µL Eppendorf PCR inserts and five HA rod inserts.
The same scanning protocol was used to image a material calibration phantom (Figure 1) to provide reference spectral responses and effective mass attenuation coefficients. The reconstructed spectral response images of the phantom were analysed [38]. Linear regression analysis determined the relationship between spectral response and material concentration (linearity response) [39]. Furthermore, the relationship between the spectral response and the energy thresholds was evaluated graphically (spectral response).
2.2. AuNPs Synthesis and Characterization
The 11-mercaptoundecanoic acid (11-MUDA) coated gold nanoparticles used in this study had a diameter of 15 nm and were synthesized from gold (III) chloride hydrate using the Turkevich method as previously described [32]. In brief, 85 mg of the gold salt were dissolved in 250 mL of deionized water and brought to a boil. 25 mL of sodium citrate (38.8 mM) were added, the solution boiled for 15 min, and then cooled to room temperature. The particles were coated in 11-MUDA by ligand exchange in ethanol before washing in water by centrifugation and sterilization through a 0.45 μm syringe filter [32]. 11-MUDA was selected on the basis of previous studies, which screened NP coated with several different ligands. 11-MUDA coated NP were found to result in high nanoparticle uptake without adversely affecting cell viability or function. An inductively coupled plasma optical emission spectrometer (ICP-OES) was used to measure AuNP uptake. The concentrations varied somewhat depending on the batch, but were typically about 100 mg/mL. Using dynamic light scattering (DLS) and zeta potential, the particles were determined to have a hydrodynamic diameter of 31.5 nm and a surface charge of −36.8 eV.
2.3. Mouse Preparation
Six-week-old ApoE-/- mouse (B6.129P2-ApoEtm1UnC/J) was fed with the Western diet (Research Diets Inc, New Brunswick, NJ) for 10 weeks to develop atherosclerosis. Primary monocytes from C57BL/6 mice were treated with 0.5 mg/mL 11-MUDA AuNP. After 24 h cells were washed two times with DPBS, and then were resuspended in 250 μL of DPBS. A dose of 1.0 × 10⁶ cells were injected intravenously into each mouse. The mouse was euthanized using CO2 5 days after injection and scanned with MARS SPCCT. Following that, aortic plaques were excised, and transmission electron microscopy (TEM) was used to confirm the presence of gold-labelled monocytes. The animal experiment was performed at the University of Pennsylvania. Animal ethics for this study were approved by University Laboratory Animal Resources in conjunction with the Institutional Animal Care and Use Committee at the University of Pennsylvania.
3. Results
3.1. Phantom Imaging
The MARS imaging system was used to detect four different materials, AuNPs, water (soft tissue), lipid, and hydroxyapatite (HA) rods (bone). In Figure 2a, a series of selected slices in each energy bin of the calibration phantom is shown. The spectral response is plotted in Figure 3a,b for the HA and AuNPs concentrations, respectively. As it can be seen in Figure 3, HA and AuNPs have different spectral response trends, due to their different attenuation profiles. The spectral response of HA decreases as the energy thresholds increase, whereas the spectral response of the AuNP concentrations decreases until the fourth energy threshold, and increases in the fifth energy threshold to represent the k-edge absorption of gold at 80.7 keV. The linearity responses for AuNP and HA are plotted in Figure 4a,b. The two different trends were considered as the references in the first MD method to detect AuNPs in the aortic region. Establishing linearity of attenuation for each energy bin results in accurate material quantification and plays a key role in the result interpretation. The spectral response for AuNPs increases at the fifth threshold energy, whereas spectral response for HA decreases with increasing energy thresholds.
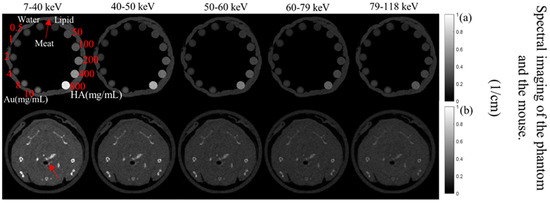
Figure 2.
Axials slices of the calibration phantom and mouse data. (a) Reconstruction of the calibration phantom for each energy bin (as indicated). Phantom contains Au, HA, lipid, and water. (b) Axial view of energy images of the mouse-the red arrow indicates the aortic arch.
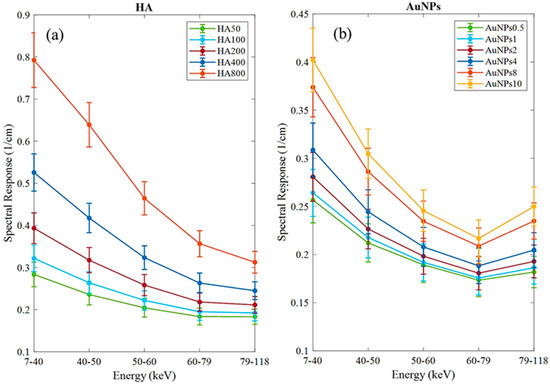
Figure 3.
Detector spectral response. (a) Spectral response of the detector for HA calibration rods. (b) Spectral response of the detector for AuNPs vials. Attenuation enhancement is observed in energy bin 5 (79–118 keV), indicating the K-edge of Au; 80.7 keV.
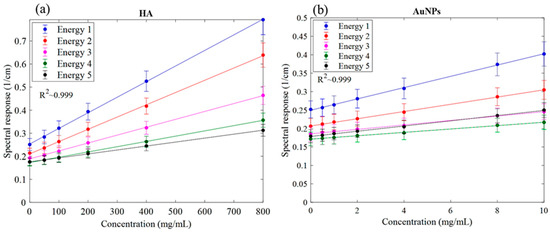
Figure 4.
Linearity of the detector spectral response. (a) Linearity of attenuation of HA (Spectral response). (b) The linearity of attenuation of AuNPs (Spectral response). The result of the linear regression shows that the CT system is linear with R2 values indicated on the graph. Accuracy of material identification and decomposition is based on the linearity established for each energy bin, using the calibration vials.
Figure 5 shows the material image of the phantom using the second MD method. HA vials at a concentration of 200 mg/cm3 and above identify correctly as HA by 100%, while for the lower concentrations of HA 100 and 50 mg/cm3, about 5% and 15% are misidentified as gold at about 8 mg/mL, respectively. For AuNP vials at concentrations 10, 8 and 4 mg/mL, the correct identification is above 97%. However, for lower concentrations of AuNPs, the correct identification was about 40 to 75%. Correct identification of 80% or more is acceptable or considered reliable [19]. Soft tissue, when near higher concentrations of HA were often misidentified as AuNP due to beam hardening caused by HA at higher concentrations.
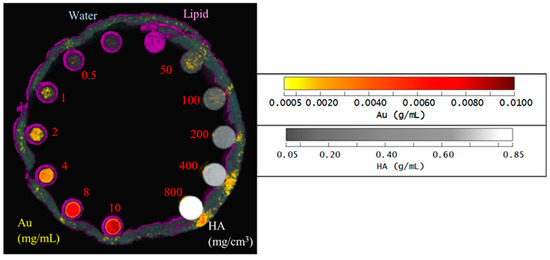
Figure 5.
Material image of phantom. 3D rendering material image of the phantom; lipid (purple), AuNPs (yellow to red), HA (grey to white) and water (blue).
3.2. Mouse Imaging
Figure 6 shows TEM of a primary monocyte incubated with 11-MUDA coated gold nanoparticles. The uptake for each cell was 127 pg/cell, as measured by ICP-OES.
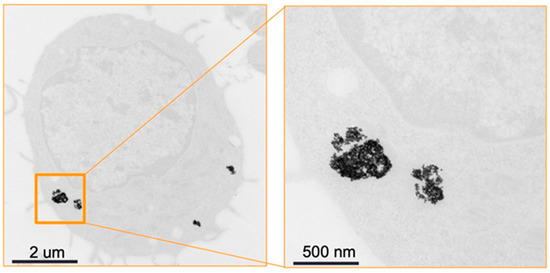
Figure 6.
TEM image. TEM of monocytes incubated with 11-MUDA coated gold nanoparticles. The panel on the right is an enlargement of the boxed area in the panel on the left.
A selected slice in each energy bin for the site of interest in the mouse (aortic arch) is shown in Figure 2b. The aortic arch was the region of interest (ROI) within the ApoE-/- mouse where atherosclerosis had formed. Therefore, this region was suspected to recruit AuNP-labelled monocytes. To apply the first MD method on the mouse data, the ROIs were selected in the aortic arch along 10 slices to cover the volume in question. In total, 890 voxels were selected. The spectral response was analysed for all selected voxels. The attenuation threshold for soft tissue is also set, and therefore the voxels whose attenuation is higher than the threshold are considered to contain AuNPs or calcification. The results showed 207 voxels in an aortic arch followed the spectral response of AuNP, which indicated a peak in the fifth energy bin, while the remaining voxels reflected the HA spectral response (Figure 7). To measure the concentration of gold within the 207 voxels exhibiting an AuNP spectral response, the voxel attenuation profile was compared across all energy bins with the attenuation profiles of known concentrations of AuNPs in the calibration phantom. The data show that out of 207 voxels, 96, 57, and 20 voxels were quantified to be 4, 8, and 10 mg/mL of AuNPs, respectively, with 33 voxels indicating a concentration more than 10 mg/mL (Figure 8).
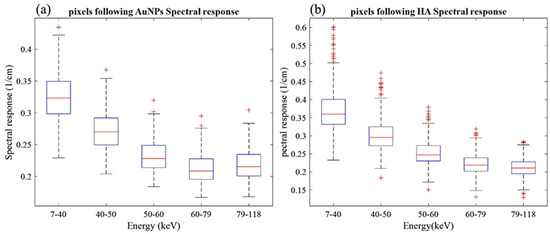
Figure 7.
Spectral response of voxels located within atherosclerotic regions. (a) Voxel response follow the AuNP trend peak at the fifth energy bin. (b) Voxels’ spectral responses follow HA attenuation profile.
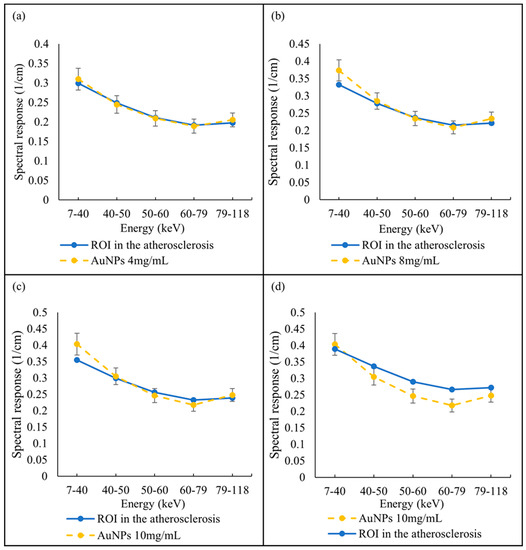
Figure 8.
Quantify AuNPs located within atherosclerotic regions. Spectral response of voxels located within atherosclerotic regions follow the AuNPs trend pick at fifth energy bin and quantified as (a) 4 mg/mL, (b) 8 mg/mL, (c) 10 mg/mL, and (d) more than 10 mg/mL, in comparison with known AuNP concentrations within phantom.
Results from the second MD method show the four fused material channels, consisting of AuNP, HA, water and lipid (Figure 9). Due to a ring artefact, AuNP is observed throughout the mouse. Considering the result of the second MD method on the phantom, AuNPs at a concentration of 4 mg/mL and lower can be misidentified as HA, and consequently, AuNPs within plaque are very likely to be misidentified as HA. Moreover, as can be seen in Figure 5, beam hardening caused by high concentrations of HA caused the soft tissue near the HA rods to be misidentified as gold. Therefore, the material density images produced by the second MD method do not provide sufficient evidence of the presence of AuNPs within the aortic plaque. However, the first MD method confirmed the presence of AuNPs in the aortic plaque. We therefore fused one energy channel (E1) (lung and trachea), HA (bone using second MD method), and water (soft tissue), and AuNPs (using first MD method) to indicate AuNPs in the plaque. In Figure 10a the anatomy of the heart and aortic arch can be seen for comparison. A MARS-CT image indicating AuNPs in the aortic region with a high level of detail, including the aortic arch shape is shown in Figure 10.
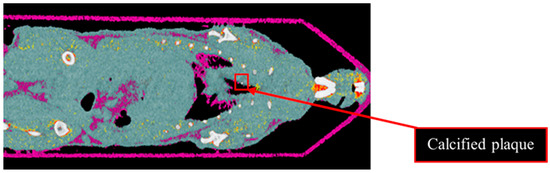
Figure 9.
Material image of ApoE-/- mouse. The 3D material image of ApoE-/- mouse. Bone (white), AuNPs (yellow to red), soft tissue (blue) and lipid (purple). Ring artefact is misidentified as AuNPs. The red box indicates calcified plaque.
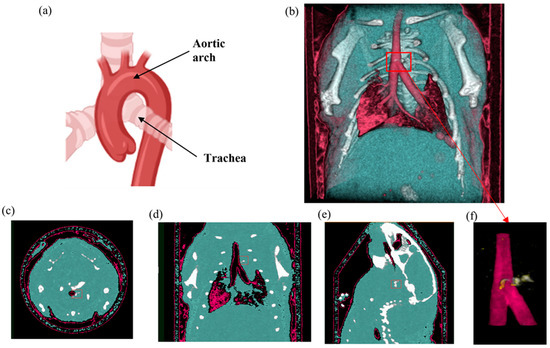
Figure 10.
Mouse SPCCT imaging. (a) Mouse heart and aortic arch anatomy. (b) MARS 3D visualisation of fused MD images including energy image at E1 (pink), HA channel (white), and soft tissue (blue). (c–e) Axial, coronal and sagittal slices through the AuNP ROI in the aorta respectively. (f) MARS fused MD images of the site of the interest (atherosclerotic plaque) including energy image at E1 (pink), HA channel (white) and yellow indicating ROI containing AuNPs determined by using first MD method. The red box indicates the aortic arch.
Figure 11 shows the TEM image of the excised plaque that confirms the presence of AuNPs. Note that control groups of mice (i.e., mice without atherosclerosis injected with AuNP labelled monocytes and mice with atherosclerosis injected with unlabelled monocytes) were scanned with conventional CT, as previously published [32], where the specific imaging of AuNP labelled monocytes in atherosclerosis was proven.
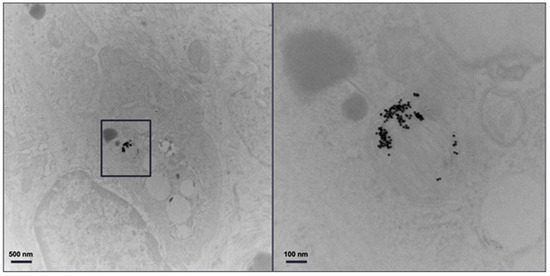
Figure 11.
TEM of plaque. Transmission electron microscopy of the atherosclerotic plaque of ApoE-/- mouse injected with gold nanoparticle labelled monocytes. The panel on the right is an enlargement of the boxed area on the left.
4. Discussion
Using MARS-CT, SPCCT imaging was able to identify and quantify the recruitment of gold-labelled monocytes in an ApoE-/- mouse. The findings were in agreement with the results obtained by micro-CT and electron microscopy using the same nanoparticles [32]. The SPCCT imaging using a single multi energy scan confirmed the high attenuating material in the aortic arch followed the spectral response of gold. Specifically, MARS-CT was able to differentiate AuNPs from calcification (hydroxyapatite). Here we have shown that the SPCCT can directly identify and quantify AuNP-labelled monocytes by the unique spectrum of the gold nanoparticles measured by the MARS-CT scanner.
Previous analysis using micro-CT required scanning of the mice before and after injection to calculate changes in attenuation to confirm the presence of gold labelled monocytes [32]. That analysis showed a 15.3 HU increase in the aortic arch region at day 5 in comparison to day 0 (before injection). In the previous study the presence of gold in the artery was confirmed by destructive ICP-OES analysis. With SPCCT imaging, tissue destruction was not necessary to confirm the presence of gold, as this was confirmed by the recorded X-ray adsorption. In addition to confirming the presence of gold, the MARS-CT was able to quantify the different concentrations of the materials within the scanned regions. Figure 2 shows how the spectral response of AuNP is distinct from HA. The linearity of attenuation for each energy bin in Figure 4a,b represents the capability of MARS SPCCT to identify and quantify HA and AuNPs. In spite of the fact that the collected spectral response for each material was significantly different from the other material, the first MD algorithm using least square error was not successful in differentiating AuNP-labelled monocytes from calcification within an aortic arch. However, the second MD method, which has examined only spectral response, was capable of distinguishing AuNPs-labelled monocytes from calcified regions within an aorta. In the last decade, many studies have focused on the structure of atherosclerotic plaques, and the resulting clinical outcomes [40,41]. To predict the risk of plaque rupture and the resulting clinical events, it is important to determine the plaque characteristics. Microcalcification and inflammation within the plaque have been evaluated as some of the causes of plaque rupture and cap erosion [42,43], with some studies suggesting macrocalcification may indicate increasing plaque stabilisation [44]. Inflammation drives the recruitment of monocytes into the artery wall, leading to plaque growth and instability [45,46]. Several studies have been carried out to explore the potential of MARS SPCCT to characterize atherosclerotic plaque. In studies conducted by Searle et.al [21] and Dahal [20], the SPCCT has been successfully used to locate and identify iron deposits and calcium within atherosclerotic plaque, both of which are considered critical biomarkers of vulnerable plaque. In another pilot study we investigated the composition of late-stage vulnerable plaques in ApoE mice fed on a chow diet. These mice (over 12 months old) show calcifications in the aortic arch, ascending aorta, and aortic root. The current work shows that imaging AuNPs labelled monocytes using SPCCT has the potential to characterize plaque.
SPCCT imaging has also been successfully used to image and differentiate cells from their embedding scaffold in brain tissue [47]. This imaging required the use of two different contrast agents which were easily distinguished from each other by their different X-ray absorption spectrum by SPCCT imaging, showing the strength of spectral imaging, especially in animal disease models using nanoparticle contrast agents.
The development of molecular imaging of specifically targeted cells or biomolecules within tissues has a great capacity for distinguishing characteristics of atherosclerotic plaque. There are several hurdles to overcome, such as radiation exposure [9], motion artefact [48], and spatial resolution [49], which limit imaging of arteries, especially coronary arteries. PET and single-photon emission computerized tomography (SPECT) do overcome some of these problems, but availability and requirement of the use of radio-labelled pharmaceuticals are two major limitations which restrict the use of these techniques for diseases like atherosclerotic plaque, which require follow-up imaging [50]. The other limitation of PET and SPECT is that they cannot provide anatomical information without being combined with CT or MRI.
It is anticipated that SPCCT scan time will be reduced with further with sensor development, so reducing motion artifacts, as seen with conventional CT.
MARS SPCCT can overcome other issues due to its high spatial resolution, low radiation dose, and the absence of needing radionuclide imaging agents. The results described herein were obtained from scanning the mouse post-mortem, which therefore eliminated any issues that could be created by subject motion. In vivo scanning would benefit from respiratory gating approaches such as algorithms applied to the reconstructed images to minimize motion artefacts.
The current study has a number of limitations. First, we have only studied one type of photon counting scanner, therefore it is not clear how generalizable the results are to the different types of systems in development (although data on macrophage imaging with AuNP in atherosclerotic plaque using a different scanner are promising [51]). Second, we focused on the aortic arch, which is where plaque first develops in this early model of atherosclerosis in mice. However, screening the whole mouse body did not indicate any calcified or uptake of AuNPs-labelled monocytes. Future studies might examine other arteries in other types of models of atherosclerosis as monocyte recruitment into plaques is a key feature of plaque development. Moreover, the currently used system is designed for small animal imaging, and results may differ with clinical scale scanners. From a dose perspective, this approach would be feasible in humans, since only approximately 1 g of AuNP would be needed, which is affordable. A key question for clinical translation is the safety and excretion of the nanoparticles. To achieve this, the latter, smaller, renally clearable AuNP may need to be employed. In addition, the results described herein were obtained from scanning the mouse post-mortem, which therefore eliminated any issues that could be created by subject motion. In vivo scanning may be possible via respiratory gating approaches such as algorithms applied to the reconstructed images to minimize motion artefacts.
5. Conclusions
We have demonstrated the feasibility of SPCCT to detect active atherosclerotic disease in conjunction with nanoparticle labelling of cells. SPCCT imaging using the MARS-CT was capable of distinguishing AuNP labelled monocytes from calcified regions within the atherosclerotic plaque based on the X-ray absorbance spectrum of gold. This imaging procedure could be used to study the kinetics of monocyte requirement during plaque development in animal models and demonstrates the feasibility of using targeted nanoparticles for clinical diagnosis.
Author Contributions
All the credited authors read, appraised and approved the final submitted manuscript. M.M. contributed to study conception, design, technical data acquisition with analysis and manuscript writing. E.S. and D.D. contributed to the technical data acquisition and analysis. J.K. and Y.C.D. prepared the nanoparticles and conducted the animal experiments. D.P.C. supervised the nanoparticle preparation and directed the animal research. A.B. supervised the research and was principal investigator for the research’s funding. S.P.G. supervised the research and contributed to the manuscript writing. The MARS Team provide the technical expertise to develop and maintain the MARS-CT scanners and software. Conceptualization, M.M.; Formal analysis, M.M.; Funding acquisition, A.B.; Investigation, M.M., J.K., Y.C.D., D.P.C., A.B. and MARS Bioimaging Ltd.; Methodology, M.M., J.K. and Y.C.D.; Resources, MARS Bioimaging Ltd.; Supervision, D.P.C., A.B. and S.P.G.; Validation, M.M.; Visualization, M.M.; Writing—original draft, M.M.; Writing—review & editing, S.P.G. All authors will be informed about each step of manuscript processing including submission, revision, revision reminder, etc. via emails from our system or assigned Assistant Editor. All authors have read and agreed to the published version of the manuscript.
Funding
This project was funded by the New Zealand Ministry of Business, Innovation and Employment (MBIE, www.mbie.govt.nz) contract number UOCX1404, award to Anthony Butler (principal investigator) and Steven Gieseg (associate investigator). Emily Searle PhD scholarship was supported through this grant. M.M., Devyani Dexit and Anthony Butler are employees of MARS Bioimaging. MARS Bioimaging Ltd., Christchurch, New Zealand provided the imaging machines and associated cost. MARS Bioimaging limited was involved in the data collection, analysis and decision to publish the manuscript.
Institutional Review Board Statement
Animal ethics for this study were approved by University Laboratory Animal Resources in conjunction with the Institutional Animal Care and Use Committee at the University of Pennsylvania.
Informed Consent Statement
Not applicable.
Data Availability Statement
We have uploaded the whole mouse imaging to the public repository, Available online: https://figshare.com/s/d77f95e3ff3f661c2cac and DOI: https://doi.org/10.6084/m9.figshare.19661391 (accessed on 27 April 2022).
Acknowledgments
The authors would like to acknowledge the support of the CERN Medipix3 collaboration and members of the MARS Team. We acknowledge Peter Chhour for biological sample preparation. The MARS Collaboration: Lead Author: Philip H Butler (E-mail: phil.butler@marsbioimaging.com) Sikiru A Adebileje, Steven D Alexander, Maya R Amma, Marzieh Anjomrouz, Fatemeh Asghariomabad, Ali Atharifard, James Atlas, Stephen T Bell, Anthony P H Butler, Philip H Butler, Pierre Carbonez, Claire Chambers, Krishna M Chapagain, Alexander I Chernoglazov, Jennifer A Clark, Frances Colgan, Jonathan S Crighton, Shishir Dahal, Jérôme Damet, Theodorus Dapamede, Niels J A de Ruiter, Devyani Dixit, Robert M N Doesburg, Karen Dombroski, Neryda Duncan, Steven P Gieseg, Anish Gopinathan, Brian P Goulter, Joseph L Healy, Luke Holmes, Kevin Jonker, Tracy Kirkbride f, Chiara Lowe, V B H Mandalika, Aysouda Matanaghi a, Mahdieh Moghiseh, Manoj Paladugu b, David Palmer, Raj K Panta, Peter Renaud, Yann Sayous, Nanette Schleich, Emily Searle, Jereena S Sheeja, Aaron Smith, Leza Vanden Broeke, Vivek V S, E Peter Walker, Manoj Wijesooriya, W Ross Younger.
Conflicts of Interest
Competition Interests and Financial Disclosure is as follows: Anthony Butler: Shareholder and board member and employee of MARS Bioimaging Ltd. Steven Gieseg: Shareholder and employee of MARS Bioimaging. Mahdieh Moghiseh: Shareholder and employee of MARS Bioimaging. Devyani Dixit: Employees of MARS Bioimaging. Emily Searle: Was an employee of MARS Bioimaging. David P. Cormode: He is named as an inventor on a patent concerning a gold nanoparticle formulation. He owns stock in a company whose goal is to commercialize such agents. In addition, he is the PI of NIH grants concerning CT contrast agents (the funder had no input on the work described herein).
References
- Libby, P.; Ridker, P.M.; Maseri, A. Inflammation and atherosclerosis. Circulation 2002, 105, 1135–1143. [Google Scholar] [CrossRef] [PubMed]
- Silvestre-Roig, C.; de Winther, M.P.; Weber, C.; Daemen, M.J.; Lutgens, E.; Soehnlein, O. Atherosclerotic plaque destabilization: Mechanisms, models, and therapeutic strategies. Circ. Res. 2014, 114, 214–226. [Google Scholar] [CrossRef] [PubMed]
- Geovanini, G.R.; Libby, P. Atherosclerosis and inflammation: Overview and updates. Clin. Sci. 2018, 132, 1243–1252. [Google Scholar] [CrossRef]
- Brinjikji, W.; Huston, J.; Rabinstein, A.A.; Kim, G.M.; Lerman, A.; Lanzino, G. Contemporary carotid imaging: From degree of stenosis to plaque vulnerability. J. Neurosurg. 2016, 124, 27–42. [Google Scholar] [CrossRef] [PubMed]
- Cires-Drouet, R.S.; Mozafarian, M.; Ali, A.; Sikdar, S.; Lal, B.K. Imaging of high-risk carotid plaques: Ultrasound. In Seminars in Vascular Surgery; WB Saunders: Philadelphia, PA, USA, 2017. [Google Scholar]
- Saba, L.; Saam, T.; Jäger, H.R.; Yuan, C.; Hatsukami, T.S.; Saloner, D.; Wasserman, B.A.; Bonati, L.H.; Wintermark, M. Imaging biomarkers of vulnerable carotid plaques for stroke risk prediction and their potential clinical implications. Lancet Neurol. 2019, 18, 559–572. [Google Scholar] [CrossRef]
- Tousoulis, D.; Oikonomou, E.; Economou, E.K.; Crea, F.; Kaski, J.C. Inflammatory cytokines in atherosclerosis: Current therapeutic approaches. Eur. Heart J. 2016, 37, 1723–1732. [Google Scholar] [CrossRef] [PubMed]
- Yoshioka, K.; Tanaka, R. MRI and MRA of aortic disease. Ann. Vasc. Dis. 2010, 3, 196–201. [Google Scholar] [CrossRef] [PubMed]
- Tarkin, J.M.; Dweck, M.R.; Evans, N.R.; Takx, R.A.; Brown, A.J.; Tawakol, A.; Fayad, Z.A.; Rudd, J.H. Imaging atherosclerosis. Circ. Res. 2016, 118, 750–769. [Google Scholar] [CrossRef] [PubMed]
- Litmanovich, D.; Bankier, A.A.; Cantin, L.; Raptopoulos, V.; Boiselle, P.M. CT and MRI in diseases of the aorta. Am. J. Roentgenol. 2009, 193, 928–940. [Google Scholar] [CrossRef] [PubMed]
- Small, G.R.; Ruddy, T.D. PET imaging of aortic atherosclerosis: Is combined imaging of plaque anatomy and function an amaranthine quest or conceivable reality? J. Nucl. Cardiol. 2011, 18, 717–728. [Google Scholar] [CrossRef] [PubMed]
- Polycarpou, I.; Tsoumpas, C.; King, A.P.; Marsden, P.K. Impact of respiratory motion correction and spatial resolution on lesion detection in PET: A simulation study based on real MR dynamic data. Phys. Med. Biol. 2014, 59, 697. [Google Scholar] [CrossRef] [PubMed]
- Saraste, A.; Nekolla, S.G.; Schwaiger, M. Cardiovascular molecular imaging: An overview. Cardiovasc. Res. 2009, 83, 643–652. [Google Scholar] [CrossRef] [PubMed]
- Pourmorteza, A.; Symons, R.; Sandfort, V.; Mallek, M.; Fuld, M.K.; Henderson, G.; Jones, E.C.; Malayeri, A.A.; Folio, L.R.; Bluemke, D.A. Abdominal imaging with contrast-enhanced photon-counting CT: First human experience. Radiology 2016, 279, 239–245. [Google Scholar] [CrossRef]
- Ding, H.; Klopfer, M.J.; Ducote, J.L.; Masaki, F.; Molloi, S. Breast tissue characterization with photon-counting spectral CT imaging: A postmortem breast study. Radiology 2014, 272, 731–738. [Google Scholar] [CrossRef] [PubMed]
- Panta, R.K.; Butler, A.P.; Butler, P.H.; de Ruiter, N.J.; Bell, S.T.; Walsh, M.F.; Doesburg, R.M.; Chernoglazov, A.I.; Goulter, B.P.; Carbonez, P. First human imaging with MARS photon-counting CT. In Proceedings of the 2018 IEEE Nuclear Science Symposium and Medical Imaging Conference Proceedings (NSS/MIC), Sydney, NSW, Australia, 10–17 November 2018; pp. 1–7. [Google Scholar]
- Anderson, N.G.; Butler, A.P. Clinical applications of spectral molecular imaging: Potential and challenges. Contrast Media Mol. Imaging 2014, 9, 3–12. [Google Scholar] [CrossRef]
- Curtis, T.E.; Roeder, R.K. Quantification of multiple mixed contrast and tissue compositions using photon-counting spectral computed tomography. J. Med. Imaging 2019, 6, 013501. [Google Scholar] [CrossRef]
- Moghiseh, M.; Aamir, R.; Panta, R.K.; de Ruiter, N.; Chernoglazov, A.; Healy, J.; Butler, A.; Anderson, N. Discrimination of multiple high-Z materials by multi-energy spectral CT–A phantom study. JSM Biomed. Imaging Data Pap. 2016, 61, 1007. [Google Scholar]
- Dahal, S. Characterization of atherosclerotic plaque with MARS Imaging. Ph.D. Thesis, University of Otago, Dunedin, New Zealand, 2021. [Google Scholar]
- Searle, E.K.; Butler, A.P.; Raja, A.Y.; Gieseg, S.P.; Adebileje, S.A.; Alexander, S.D.; Amma, M.R.; Anjomrouz, M.; Asghariomabad, F.; Atharifard, A. Distinguishing Iron and Calcium using MARS Spectral CT. In Proceedings of the 2018 IEEE Nuclear Science Symposium and Medical Imaging Conference Proceedings (NSS/MIC), Sydney, NSW, Australia, 10–17 November 2018; pp. 1–4. [Google Scholar]
- Healy, J.L. Optimization of MARS Scanners for Material Imaging of Biological Samples. Ph.D. Thesis, University of Canterbury, Christchurch, New Zealand, 2018. [Google Scholar]
- Zainon, R.B. Spectral Micro-CT Imaging of Ex Vivo Atherosclerotic Plaque. Ph.D. Thesis, University of Canterbury, Christchurch, New Zealand, 2012. [Google Scholar]
- Stamp, L.K.; Anderson, N.G.; Becce, F.; Rajeswari, M.; Polson, M.; Guyen, O.; Viry, A.; Choi, C.; Kirkbride, T.E.; Raja, A.Y. Clinical utility of multi-energy spectral photon-counting computed tomography in crystal arthritis. Arthritis Rheumatol. 2019, 71, 1158–1162. [Google Scholar] [CrossRef]
- Kirkbride, T.E.; Raja, A.Y.; Müller, K.; Bateman, C.J.; Becce, F.; Anderson, N.G. Discrimination between calcium hydroxyapatite and calcium oxalate using multienergy spectral photon-counting CT. Am. J. Roentgenol. 2017, 209, 1088–1092. [Google Scholar] [CrossRef]
- Rajendran, K.; Löbker, C.; Schon, B.S.; Bateman, C.J.; Younis, R.A.; de Ruiter, N.J.; Chernoglazov, A.I.; Ramyar, M.; Hooper, G.J.; Butler, A.P. Quantitative imaging of excised osteoarthritic cartilage using spectral CT. Eur. Radiol. 2017, 27, 384–392. [Google Scholar] [CrossRef]
- Moghiseh, M.; Aamir, R.; Healy, J.; Butler, A.; Anderson, N. Identification and Quantification of Multiple High-Z Materials by Spectral CT. Available online: https://epos.myesr.org/poster/esr/ecr2017/B-0121 (accessed on 17 March 2017).
- Aamir, R.; Chernoglazov, A.; Bateman, C.J.; Butler, A.P.H.; Butler, P.H.; Anderson, N.G.; Bell, S.T.; Panta, R.; Healy, J.L.; Mohr, J.L.; et al. MARS spectral molecular imaging of lamb tissue: Data collection and image analysis. J. Instrum. 2014, 9, P02005. [Google Scholar] [CrossRef]
- Ostadhossein, F.; Tripathi, I.; Benig, L.; LoBato, D.; Moghiseh, M.; Lowe, C.; Raja, A.; Butler, A.; Panta, R.; Anjomrouz, M. Multi-“Color” Delineation of Bone Microdamages Using Ligand-Directed Sub-5 nm Hafnia Nanodots and Photon Counting CT Imaging. Adv. Funct. Mater. 2019, 30, 1904936. [Google Scholar] [CrossRef]
- Moghiseh, M.; Lowe, C.; Lewis, J.G.; Kumar, D.; Butler, A.; Anderson, N.; Raja, A. Spectral Photon-Counting Molecular Imaging for Quantification of Monoclonal Antibody-Conjugated Gold Nanoparticles Targeted to Lymphoma and Breast Cancer: An In Vitro Study. Contrast Media Mol. Imaging 2018, 2018, 2136840. [Google Scholar] [CrossRef] [PubMed]
- Bobryshev, Y.V. Monocyte recruitment and foam cell formation in atherosclerosis. Micron 2006, 37, 208–222. [Google Scholar] [CrossRef] [PubMed]
- Chhour, P.; Naha, P.C.; O’Neill, S.M.; Litt, H.I.; Reilly, M.P.; Ferrari, V.A.; Cormode, D.P. Labeling monocytes with gold nanoparticles to track their recruitment in atherosclerosis with computed tomography. Biomaterials 2016, 87, 93–103. [Google Scholar] [CrossRef] [PubMed]
- Ballabriga, R.; Alozy, J.; Blaj, G.; Campbell, M.; Fiederle, M.; Frojdh, E.; Wong, W. The Medipix3RX: A high resolution, zero dead-time pixel detector readout chip allowing spectroscopic imaging. J. Instrum. 2013, 8, C02016. [Google Scholar] [CrossRef]
- Bateman, C.; Knight, D.; Brandwacht, B.; Mc Mahon, J.; Healy, J.; Panta, R.; Aamir, R.; Rajendran, K.; Moghiseh, M.; Ramyar, M. MARS-MD: Rejection based image domain material decomposition. J. Instrum. 2018, 13, P05020. [Google Scholar] [CrossRef]
- Heywang-Kobrunner, S.H.; Hacker, A.; Sedlacek, S. Advantages and Disadvantages of Mammography Screening. Breast Care 2011, 6, 199–207. [Google Scholar] [CrossRef]
- De Ruiter, N.J.; Butler, P.H.; Butler, A.P.; Bell, S.T.; Chernoglazov, A.I.; Walsh, M.F. MARS imaging and reconstruction challenges. In Proceedings of the 14th International Meeting on Fully Three-Dimensional Image Reconstruction in Radiology and Nuclear Medicine, Xi’an, China, 18–23 June 2017; pp. 18–23. [Google Scholar]
- Bateman, C.J. Methods for Material Discrimination in MARS Multi-Energy CT. Ph.D. Thesis, University of Otago, Dunedin, New Zealand, 2015. [Google Scholar]
- Moghiseh, M. Optimization of Spectral CT for Novel Applications of Nanoparticles. Ph.D. Thesis, University of Otago, Dunedin, New Zealand, 2018. [Google Scholar]
- Zainon, R.; Butler, A.P.H.; Cook, N.J.; Butzer, J.S.; Schleich, N.; Ruiter, N.d.; Tlustos, L.; Clark, M.J.; Heinz, R.; Butler, P.H. Construction and operation of MARS CT scanner. In Proceedings of the International Conference on Instrumentation, Control and Automation (ICA 2009), Bandung, Indonesia, 20–22 October 2009. [Google Scholar]
- Doherty, T.M.; Asotra, K.; Fitzpatrick, L.A.; Qiao, J.-H.; Wilkin, D.J.; Detrano, R.C.; Dunstan, C.R.; Shah, P.K.; Rajavashisth, T.B. Calcification in atherosclerosis: Bone biology and chronic inflammation at the arterial crossroads. Proc. Natl. Acad. Sci. USA 2003, 100, 11201–11206. [Google Scholar] [CrossRef]
- Dweck, M.R.; Aikawa, E.; Newby, D.E.; Tarkin, J.M.; Rudd, J.H.; Narula, J.; Fayad, Z.A. Noninvasive molecular imaging of disease activity in atherosclerosis. Circ. Res. 2016, 119, 330–340. [Google Scholar] [CrossRef]
- Wanga, S.; Hibender, S.; Ridwan, Y.; van Roomen, C.; Vos, M.; Van Der Made, I.; van Vliet, N.; Franken, R.; van Riel, L.A.; Groenink, M. Aortic microcalcification is associated with elastin fragmentation in Marfan syndrome. J. Pathol. 2017, 243, 294–306. [Google Scholar] [CrossRef] [PubMed]
- Manduteanu, I.; Simionescu, M. Inflammation in atherosclerosis: A cause or a result of vascular disorders? J. Cell. Mol. Med. 2012, 16, 1978–1990. [Google Scholar] [CrossRef]
- Shioi, A.; Ikari, Y. Plaque calcification during atherosclerosis progression and regression. J. Atheroscler. Thromb. 2018, 25, 294–303. [Google Scholar] [CrossRef] [PubMed]
- Shi, C.; Pamer, E.G. Monocyte recruitment during infection and inflammation. Nat. Rev. Immunol. 2011, 11, 762–774. [Google Scholar] [CrossRef] [PubMed]
- Ghattas, A.; Griffiths, H.R.; Devitt, A.; Lip, G.Y.; Shantsila, E. Monocytes in coronary artery disease and atherosclerosis: Where are we now? J. Am. Coll. Cardiol. 2013, 62, 1541–1551. [Google Scholar] [CrossRef]
- Cuccione, E.; Chhour, P.; Si-Mohamed, S.; Dumot, C.; Kim, J.; Hubert, V.; Da Silva, C.C.; Vandamme, M.; Chereul, E.; Balegamire, J. Multicolor spectral photon counting CT monitors and quantifies therapeutic cells and their encapsulating scaffold in a model of brain damage. Nanotheranostics 2020, 4, 129. [Google Scholar] [CrossRef]
- Robson, P.M.; Dweck, M.R.; Trivieri, M.G.; Abgral, R.; Karakatsanis, N.A.; Contreras, J.; Gidwani, U.; Narula, J.P.; Fuster, V.; Kovacic, J.C. Coronary artery PET/MR imaging: Feasibility, limitations, and solutions. JACC Cardiovasc. Imaging 2017, 10, 1103–1112. [Google Scholar] [CrossRef]
- Nakahara, T.; Dweck, M.R.; Narula, N.; Pisapia, D.; Narula, J.; Strauss, H.W. Coronary artery calcification: From mechanism to molecular imaging. JACC Cardiovasc. Imaging 2017, 10, 582–593. [Google Scholar] [CrossRef]
- Nolte, T.; Gross-Weege, N.; Schulz, V. (Hybrid) SPECT and PET Technologies. In Molecular Imaging in Oncology; Springer: Berlin/Heidelberg, Germany, 2020; pp. 111–133. [Google Scholar]
- Si-Mohamed, S.A.; Sigovan, M.; Hsu, J.C.; Tatard-Leitman, V.; Chalabreysse, L.; Naha, P.C.; Garrivier, T.; Dessouky, R.; Carnaru, M.; Boussel, L.J.R. In vivo molecular K-edge imaging of atherosclerotic plaque using photon-counting CT. Radiology 2021, 300, 98–107. [Google Scholar] [CrossRef]


Disclaimer/Publisher’s Note: The statements, opinions and data contained in all publications are solely those of the individual author(s) and contributor(s) and not of MDPI and/or the editor(s). MDPI and/or the editor(s) disclaim responsibility for any injury to people or property resulting from any ideas, methods, instructions or products referred to in the content. |
© 2023 by the authors. Licensee MDPI, Basel, Switzerland. This article is an open access article distributed under the terms and conditions of the Creative Commons Attribution (CC BY) license (https://creativecommons.org/licenses/by/4.0/).