Abstract
We implemented a multimodal approach to examine associations between structural and neurochemical changes that could signify neurodegenerative processes related to mild cognitive impairment (MCI). Fifty-nine older adults (60–85 years; 22 MCI) underwent whole-brain structural 3T MRI (T1W, T2W, DTI) and proton magnetic resonance spectroscopy (1H-MRS). The regions of interest (ROIs) for 1H-MRS measurements were the dorsal posterior cingulate cortex, left hippocampal cortex, left medial temporal cortex, left primary sensorimotor cortex, and right dorsolateral prefrontal cortex. The findings revealed that subjects in the MCI group showed moderate to strong positive associations between the total N-acetylaspartate to total creatine and the total N-acetylaspartate to myo-inositol ratios in the hippocampus and dorsal posterior cingulate cortex and fractional anisotropy (FA) of WM tracts crossing these regions—specifically, the left temporal tapetum, right corona radiata, and right posterior cingulate gyri. In addition, negative associations between the myo-inositol to total creatine ratio and FA of the left temporal tapetum and right posterior cingulate gyri were observed. These observations suggest that the biochemical integrity of the hippocampus and cingulate cortex is associated with a microstructural organization of ipsilateral WM tracts originating in the hippocampus. Specifically, elevated myo-inositol might be an underlying mechanism for decreased connectivity between the hippocampus and the prefrontal/cingulate cortex in MCI.
1. Introduction
Mild cognitive impairment (MCI) is regarded as a transitional stage between normal cognitive aging and the development of Alzheimer’s disease (AD), which is characterized by more rapid cognitive decline compared to that seen in normal cognitive aging [1,2]. From a neurobehavioral perspective, MCI is associated primarily with a prominent memory impairment and accelerated loss of gray matter in the medial temporal cortex, hippocampus, and/or orbitofrontal cortex [2,3,4,5]. Declines in other cognitive domains (e.g., language) or brain structural changes (e.g., loss of gray matter volume and cortical thickness) in other brain regions were found to be less prominent than or similar to those seen in normal aging [4]. However, findings from some longitudinal studies suggest that the rate of gray matter atrophy in MCI and normal older adults was substantially higher in non-demented older adults who were at higher risk of developing AD [6,7]. For example, apolipoprotein E (APOE) ε4 carriers showed a larger decrease in total gray matter volume as well as greater regional gray matter loss in the hippocampus and subregions of the temporal lobe as compared to non-demented older individuals who were APOE ε4-negative [7]. These individuals were also found to show reduced glucose uptake in temporal and cingulate cortical areas, gray matter atrophy, and whole-brain and regional cortical thinning [6,7,8,9].
Structural MRI methods have long been used for clinical follow-up and research in patient populations with neurodegenerative diseases. Overall observations from these studies revealed extensive gray matter atrophy mostly in the medial temporal and hippocampal regions of patients with dementia-like disorders [10,11,12,13,14]. In addition to gray matter atrophy, findings from studies using diffusion tensor imaging (DTI) reported changes in white matter (WM) structural integrity such as atrophy or/and hyperintensities, representing neurodegeneration [3,4]. DTI has been found to be a sensitive and reliable tool for the quantification of microscopic changes in WM structure, and it allows us to depict white matter (WM) microstructure changes in neurodegeneration disorders. Fractional anisotropy (FA) WM tracts obtained from DTI images are frequently used as a measure of microstructural integrity in the brain associated with demyelination and other structural WM abnormalities [2,15,16,17].
Neurodegenerative processes in aging and age-related pathological conditions are also characterized by alterations in neurometabolite concentrations which can be reliably quantified with proton-magnetic resonance spectroscopy (1H-MRS) [18]. For example, the quantification of brain neurometabolites with 1H-MRS in healthy human volunteers typically shows a depletion in regional concentrations of N-acetylaspartate (NAA) and increases in concentrations of choline (Cho) and myo-inositol (mIns) [19,20,21,22,23,24]. Alterations in the regional concentrations of NAA, Cho, mIns, or their ratios to creatine (Cr) have also been identified as biomarkers for the development of neurodegenerative processes in MCI and AD [25,26,27,28,29,30,31,32,33,34,35]. Specifically, low NAA/Cr and NAA/mIns and elevated mIns/Cr and Cho/Cr in the posterior cingulate cortex or hippocampus were found to be associated with a decrease in global cognition, the development of MCI, and a higher risk of progression from MCI to dementia [33,34,36]. For example, evidence from recent studies of our group revealed that higher Cho/Cr and mIns/Cr in the hippocampus and posterior cingulate were generic predictors of worse balance performance, suggesting that neuroinflammatory processes in these regions might be a driving factor for impaired balance performance in cognitive aging and MCI [16,30]. Overall, findings from this study and other 1H-MRS exploratory studies in aging populations point toward potentially relevant neurometabolic biomarkers for the risk assessment of motor and cognitive performance declines in older adults that were at higher risk of developing dementia [30,33].
In this exploratory study, we introduce a multimodal neuroimaging approach to examine associations between structural and neurochemical changes that could signify neurodegenerative processes related to mild cognitive impairment (MCI). Neuroimaging in general and 1H-MRS in particular are used as diagnostic tools for neurodegenerative diseases associated with AD and dementia [29,34,35,36,37]. Nonetheless, associations between neuroanatomical structural changes and neurochemical changes in the aging brain are generally underexplored. In this study, we introduced a multimodal approach to discuss associations between structural and neurochemical changes that could signify neurodegenerative processes related to MCI. Specifically, we explored neurochemical biomarkers of WM microstructural integrity in brain regions that may be related to an accelerated decline in global cognition and motor performance in MCI. We predicted that lower NAA/mIns and higher Cho/Cr in the cingulate cortex, hippocampus, and/or temporal lobe regions would be associated with poor microstructural organization of white matter (WM) bundles originating in these regions. This presumption is supported by evidence that under some pathological conditions, the strength of WM tract connections is affected by local changes in neurometabolite levels. For example, decreased regional levels of NAA and increased regional levels of mIns are generally considered to be biomarkers of white matter (WM) microstructural declines and demyelination [23,38]. Elevated mIns and reduced NAA (and overall lower NAA/mIns ratio) are considered as robust markers of neurodegenerative processes, reflecting the combined pathology of decreased neuronal integrity and gliosis [22,39]. Moreover, a lower NAA/mIns ratio and an elevated mIns/Ct ratio in the posterior cingulate cortex of cognitively normal older adults and older adults with MCI were found to be related to a risk of developing clinical Alzheimer’s disease [26,27,35,36,37]. We focused specifically on the effect of MCI on associations between the ratios of NAA/Cr, Cho/Cr, mIns/Cr, and NAA/mIns in the dorsal posterior cingulate cortex (dorsal PCC), left sensorimotor cortex (left SM1), left hippocampus (left HPC), left middle temporal cortex (left MTC), and right dorsolateral prefrontal cortex (right DLPFC) and fractional anisotropy of WM tracts originating in these cortical regions. These regions were selected as they are implicated in reductions in global cognition, executive function, memory, and motor function in normal aging and manifestations of MCI [21,30,31,34,37,40,41,42].
2. Materials and Methods
2.1. Participants
The participants consisted of 59 (34 females and 25 males) apparently healthy older adults, aged 60–85 years who were recruited from the same pool of participants as in Vints et al. [43]. The experimental protocol was approved by the local Medical Ethics Committee for Biomedical Research (No. BE-10-7), and written informed consent was obtained from all participants prior to their inclusion in the study. Individuals with central nervous system (CNS) injuries, alcohol abuse, diabetes, musculoskeletal disorders, neurodegenerative diseases, or oncological disorders were excluded from the study. All participants were asked to report their age, sex, smoking status, and educational level (i.e., basic education, secondary education, or higher education) and were instructed not to participate in any vigorous activity at least two days prior to the MRI scanning sessions and cognitive tests. The cognitive assessment was conducted in a clinical environment by a qualified mental health care specialist (co-author SK) and included administration of a global cognitive assessment test (i.e., the Montreal Cognitive Assessment—MoCA), a psychological health assessment (the Hospital Anxiety and Depression scale—HAD), the Profile of Mood States assessment (POMS), subjective performance in daily activities, and personal demographic data. A clinical diagnosis of MCI was obtained according to the International Classification of Diseases (ICD-10) and Petersen criteria [2], yielding two groups: 37 (22 female) healthy controls (HC) with no apparent cognitive impairments (67.4 ± 5.0 years; MoCA 27.0 ± 1.7) and 22 (12 female) older adults with MCI (73.1 ± 6.8 years; MoCA 22.5 ± 2.0). None of the participants had contra-indications for magnetic resonance imaging (as indicated in the guidelines of the Department of Radiology at the Kaunas Clinics, Lithuanian University of Health Sciences). None of the participants were diagnosed with dementia or AD disease, and all participants with MCI had a score of 20 or above on the MoCA scale. For the demographic characteristics of participants, see Table 1.

Table 1.
Participant demographic characteristics.
2.2. Brain Imaging and 1H-MRS
The scanning protocol consisted of whole-brain MRI anatomical scanning, diffusion tensor imaging (DTI), and single voxel 1H-MRS. All the scanning sessions were conducted using a Siemens 3T Skyra Magnetic Resonance scanner (Siemens Healthiness, Erlangen, Germany) with a 32-channel receiver head-coil. A high-resolution T1-weighted structural MR image (repetition time (TR) = 2200 ms, echo time (TE) = 2.48 ms, 0.9 × 0.9 × 1.0 mm3 voxels, field of view: 230 × 256 mm, number of sagittal slices = 176) was used to acquire a 3D magnetization prepared gradient echo (MPRAGE) image. 1H-MRS spectra were collected at the five voxel locations as previously described by Vints et al. (2022), including the dorsal posterior cingulate cortex (dPCC), left sensorimotor cortex (left SM1), left hippocampus (left HPC), left middle temporal cortex (left MTC), and right dorsolateral prefrontal cortex (right DLPFC); for an illustration, see Figure 1A. All spectra were acquired using a point-resolved spectroscopy (PRESS) sequence (TR = 2000 ms, TE = 30 ms, number of averages = 128, spectral bandwidth = 2000 Hz, data size = 1024 points) with chemical shift selective (CHESS) water suppression. Voxel-specific shimming was performed using automated B0-field mapping followed by manual adjustment to reduce the water signal full width at half maximum (FWHM) to below 15 Hz. The voxel sizes were as follows: (i) 1.6 × 1.6 × 1.6 cm3 in the dorsal PCC, left SM1, and right DLPFC voxels; (ii) 20 × 12 × 16 cm3 in the left MTC; and (iii) 26 × 12 × 12 in the left HPC. The unsuppressed water signal was also acquired for absolute metabolite quantification using the same acquisition parameters. In total, 295 spectra (=59 participants × 5 regions) were collected. All spectra were visually checked to ensure the absence of artefacts prior to quantification with the LCModel (version 6.3.1-R). The basis set for the LCModel consisted of 27 basis spectra including the following: alanine (Ala), aspartate (Asp), creatine (Cr), phosphocreatine (PCr), γ-aminobutyric acid (GABA), glucose (Glc), glutamine (Gln), glutamate (Glu), glycerophosphocholine (GPC), phosphorylcholine (PCh), myoinositol (mIns), lactate (Lac), N-acetyl aspartate (NAA), N-acetyl-aspartyl-glutamate (NAAG), scyllo-Inositol (Scyllo), taurine (Tau), negative creatine methylene (-CrCH2), guanidinoacetate (Gua), lipids (Lip09, Lip13a, Lip13b, and Lip20), and macromolecules (MM09, MM12, MM14, MM17, and MM20). The major quantifiable metabolite complexes were (1) total NAA (tNAA) composed of NAA and NAAG, (2) total creatine (tCr) composed of Cr and PCr, (3) total choline (tCho) composed of GPC and PCh, (4) mIns, and (5) the glutamate–glutamine complex (Glx); for an illustration, see Figure 1B. The outcome measures were the ratios to tCr of tNAA, tCho, mIns, and Glx. Only spectra with linewidths FWHM ≤ 0.105 ppm and a signal-to-noise ratio (SNR) ≥ 5 were included in the statistical analyses. This resulted in the elimination of 14 spectra (7.6%) from the HC group (left MTC = 8, left HPC = 4, dPCC = 1, right DLPFC = 1) and 12 spectra (10.9%) from the MCI group (left MTC = 5, left HPC = 3, dPCC= 2, right DLPFC = 2). All included neurometabolites were quantified with a Cramér-Rao lower bound (CRLB) < 20%. Variables of interest were the concentration ratios of tNAA/tCr, Glx/tCr, tCho/tCr, mIns/tCr, and tNAA/mIns in the five regions of interest (i.e., dPCC, left SM1, left HPC, left MTC, and right DLPFC). A detailed description of the MRS acquisition protocol, MRS data management, and MRS data quality was added in Supplementary Materials in line with the MRSinMRS Reporting Checklist [44].
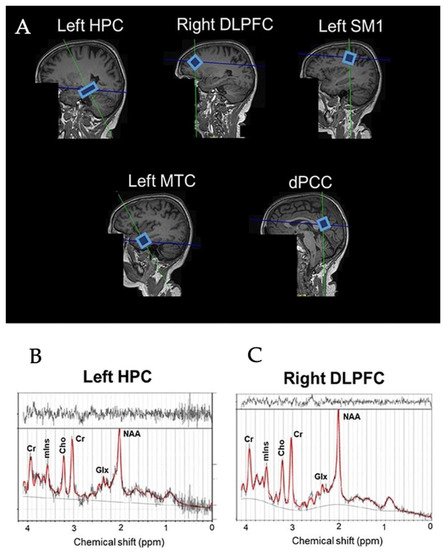
Figure 1.
Example voxel positions placed on all ROIs in the brain (A) and spectra of left HPC (B) and right DLPFC (C) from a representative subjects. HPC = hippocampus, DLPFC = dorsolateral prefrontal cortex, SM1 = sensorimotor cortex, MTC = medial temporal cortex, dPCC = dorsal posterior cingulate cortex, NAA = N-acetylaspartate, Glx = glutamate–glutamine complex, mIns = myo-inositol, Cho = choline, Cr = creatine + phosphocreatine.
2.3. Diffusion Tensor Images (DTI) and Tractography
Whole-brain DTI data were acquired using a spin-echo EPI sequence ep2d_diff_DTI_dir_CoIFA with the following parameters: 60 slices, 64 diffusion directions (b = 1000 s/mm2, Averages 1; b = 0 s/mm2, Averages 12); 2 interleaved volumes without diffusion weighting (b = 0 s/mm2; b = 1000 s/mm2); voxel size = 1.7 × 1.7 × 2.0 mm3, TE/TR = 78.0/7100 ms; matrix size = 122 × 128; and number of axial slices = 60. Tractography between the selected regions of interest (ROI) was performed using Neuro 3D in the Siemens Syngo.via Workstation (https://www.siemens-healthineers.com/magnetic-resonance-imaging/options-and-upgrades/clinical-applications/syngo-mr-tractography (accessed on 5 September 2021)). A set of fiber trajectories was acquired by manually placing seeds in all 5 MRS voxels and 16 pre-defined seeds (Figure 2). An estimation of white matter pathways was performed from the centers of each voxel. A particular tract was differentiated from other sets of trajectories by keeping those fibers that intersected regions of interest (ROIs). The ROIs were selected to circle tract cross-sections that were seen in any of the axial, sagittal, or coronal directional color maps [45,46]. The splenium of the corpus callosum was obtained by selecting the apparent tract cross-section in the axial plane (ROI 2). The left and right internal and external capsules were selected by using an ROI placed in the axial plane situated about halfway through the midbrain, yielding 4 fiber trajectories (ROI 3, ROI 4, ROI 5, ROI 6). The anterior and posterior superior regions of both the left and right corona radiata were derived by selecting the fibers that continued inferiorly as the internal capsule and superiorly as the centrum semiovale at the level of lateral ventricles in the axial plane, yielding 2 fiber trajectories (ROI 7, ROI 8, ROI 9, ROI 10, ROI 11, ROI 12). ROIs of the left and right hippocampus were placed on a coronal plane (ROI 15, ROI 16). The ROI for the hippocampal body was positioned on the upper lateral area of the hippocampus where the pons, third ventricle, and cerebral aqueduct were fully visible [47]. ROIs for the posterior cingulate were placed in a coronal plane on the bilateral cingulate above the corpus callosum where the pons and cerebral aqueduct were visible (ROI 13, ROI 14). The ROIs of both the left and right SM1s (primary sensorimotor cortices) were obtained from the precentral gyrus by selecting the fibers emerging from the motor cortex (ROI 17, ROI 18). The ROIs of the left and right DLPFC were selected on an axial plane by using two lines: one line was drawn on the most ventral surface of the frontal lobe and another line was drawn anterior to the anterior commissure (ROI 19, ROI 20). These two lines provided anatomical boundaries. The right and left tapetum tracts were obtained on an axial plane by selecting the fibers that extend laterally from the corpus callosum on either side into the temporal lobe (ROI 21, ROI 22). Variables of interest were the fractional anisotropy (FA) and number of tracts (NOT) of the whole brain (respectively, FA 1 and NOT 1) and the FA and NOT of the 21 fiber trajectories.
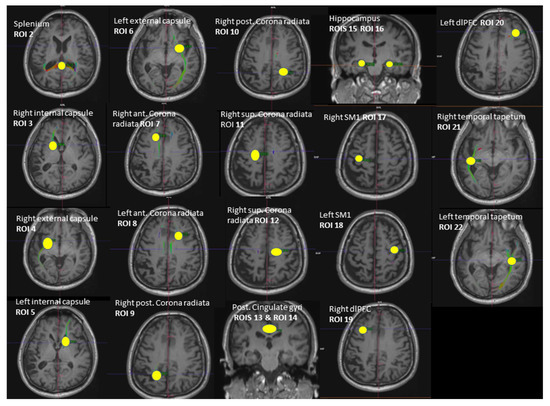
Figure 2.
Illustration of the 21 regions of interest (ROIs) used as seed regions for tractography. Voxels of MRS: ROI 13—right dPCC, ROI 18—left SM1, ROI 16—left hippocampus, ROI 22—left MTC, ROI 19—right dlPFC. ROI = region of interest, dPCC = dorsal posterior cingulate cortex, MTC = middle temporal cortex, dlPFC = dorsolateral prefrontal cortex, SM1 = sensorimotor cortex.
2.4. Statistical Analysis
All the statistical analyses were performed using IBM SPSS version 24.0 (IBM Corp., Armonk, NY, USA) and R Statistical Software version 4 (R Core Team, Vienna, Austria). Group differences in the DTI parameters (FA and NOT) were analyzed using a set of two-sided independent t-tests if data were normally distributed and group variances were equal, or the Mann–Whitney U test if the above assumptions were not met. p-values were corrected for multiple comparisons using the false discovery rate (FDR) approach with p = 0.05 as a limit [48]. Group differences were considered statistically significant if they survived FDR corrections for 44 multiple comparisons. The Spearman’s correlation test was used to evaluate the associations between MoCA scores and the mean FA or number of tracts of all diffusion tracts. Correlations were considered as statistically significant if they survived FDR corrections for 44 multiple comparisons and were reported as trends if p < 0.05. A Fisher r-to-z transformation was used to identify significant group differences between HC and MCI. Group differences were considered significant if they survived FDR correction, and they were otherwise considered as trends if p < 0.05. Finally, Spearman’s correlation tests were performed to examine the associations between the neurometabolite ratios (i.e., tNAA/tCr, tCho/tCr, mIns/tCr, Glx/tCr, and tNAA/mIns) in the dPCC, left HPC, right SM1, left MTC, and right DLPFC and FA or NOT of WM fiber tracts. Correlations were considered as statistically significant at p < 0.001 and were reported as trends if p < 0.01. Correlations with a small effect size (|rS| ≤ 0.3) were not reported. A Fisher r-to-z transformation was used to identify group differences in neurometabolic correlates of WM microstructural properties between HC and MCI. Group differences were considered significant if p < 0.001 or were reported as trends if p < 0.01. All the correlational analyses were conducted for the total population (i.e., HC + MCI combined) and for each group separately.
3. Results
3.1. Group Differences in WM Structural Properties
The group means and standard deviations of WM structural properties are summarized in Table 2 (FA) and Table 3 (NOT). NOT and FA values were found to be higher in HC as compared to MCI, suggesting that WM integrity in cognitively intact older adults was superior to that of older individuals with MCI. However, none survived FDR correction. Trends towards significant group differences in FA measures (all uncorrected p-values ≥ 0.003) were found for the following: (1) whole-brain fiber tracts (FA 1) (mean (HC) = 0.476, mean (MCI) = 0.467 uncorrected p = 0.007); (2) left external capsule fiber tracts (FA 6) (mean (HC) = 0.436, mean (MCI) = 0.414, uncorrected p = 0.003); (3) left corona radiata anterior fiber tracts (FA 8) (mean (HC) = 0.471, mean (MCI) = 0.456, uncorrected p = 0.048); (4) right corona radiata superior fiber tracts (FA 12) (mean (HC) = 0.487, mean (MCI) = 0.461, uncorrected p = 0.032); (5) right DLPFC fiber tracts (FA 19) (mean (HC) = 0.408, mean (MCI) = 0.367, uncorrected p = 0.017); (6) left DLPFC fiber tracts (FA 20) (mean (HC) = 0.398, mean (MCI) = 0.377, uncorrected p = 0.040); (7) left temporal tapetum fiber tracts (FA 22) (mean (HC) = 0.451, mean (MCI) = 0.433, uncorrected p = 0.036). Trends towards significant group differences in NOT were observed for the left anterior corona radiata fiber tracts (NOT 8) (mean (HC) = 342, mean (MCI) = 249, uncorrected p = 0.016) and right superior corona radiata fiber tracts (NOT 12) (mean (HC) = 265, mean (MCI) = 193, uncorrected p = 0.013).
Table 2.
Group differences in fractional anisotropy (FA) values in different regions of interest (ROIs) obtained for older healthy controls (HC) and older adults with mild cognitive impairment (MCI).
Table 3.
Group differences in the number of tracts (NOT) in different regions of interest (ROIs) obtained for older healthy controls (HC) and older adults with mild cognitive impairment (MCI).
3.2. Associations between WM Structural Properties and Global Cognition (MoCA) Scores
Total population (HC + MCI): Significant positive correlations existed between MoCA scores and the number of fiber tracts in the left and right temporal tapetum (NOT 21 and NOT 22: r-values ≥ 0.432, uncorrected p < 0.001). The remaining correlations did not reach significance (all uncorrected p-values ≥ 0.003). However, trends with moderate effect size (0.3 < r < 0.5) were found between MoCA scores and the whole-brain number of fiber tracts (NOT 1: r = 0.375, uncorrected p = 0.005), the FA of the left external capsule fiber tracts (FA 6: r = 0.361, uncorrected p = 0.007), and the FA of the left temporal tapetum fiber tracts (FA 22: r = 0.342, uncorrected p = 0.011); for all remaining correlations: |r| ≤ 0.293 and uncorrected p ≥ 0.030; see Table 4 (for total population). No significant associations between MoCA scores and WM structural properties were found when the two group were analyzed separately (all uncorrected p > 0.001); see Table 5 (for FA) and Table 6 (for NOT).
Table 4.
Significant correlations between MoCA scores and WM tractographic properties overall.
Table 5.
Significant correlations between fractional anisotrophy (FA) and MoCA scores in older healthy controls (HC) and older adults with mild cognitive impairment (MCI).
Table 6.
Significant correlations between number of tracts (NOT) and MoCA scores in older healthy controls (HC) and older adults with mild cognitive impairment (MCI).
HC group: Trends showing positive associations between MoCA scores and WM microstructural properties were found for the whole-brain number of fiber tracts (NOT 1: rSHC = 0.479, uncorrected p = 0.004) and the number of fiber tracts in the right temporal tapetum (NOT 21: rSHC = 0.491, p = 0.003). The remaining correlations were considered as moderate to weak or did not reach significance (all |rSHC| ≤ 0.373, uncorrected p ≥ 0.030).
MCI group: Trends with a moderate effect size were observed between MoCA scores and the FA of right SM1 fiber tracts (FA 17: negative association: rMCI = −0.522, p = 0.015), the number of fiber tracts connecting the left HPC and the left cingulate cortex (NOT 16: positive association: r = 0.464, uncorrected p = 0.039), the FA of the left temporal tapetum fiber tracts (FA 22: rMCI = 0.414, uncorrected p = 0.062), and the number of tracts of the right temporal tapetum (NOT 21: rMCI = 0.408, uncorrected p = 0.067). For all remaining correlations: |rMCI| ≤ 0.346 and uncorrected p ≥ 0.125.
Group differences: Trends towards significant group differences in the correlations between MoCA scores and WM structural properties were found for the total number of fiber tracts (NOT 1: rHC = 0.479, rMCI = −0.181, |z| = 2.37, uncorrected p = 0.018), for the FA of right SM1 fiber tracts (FA 17: rHC = −0.044, rMCI = −0.522, |z| = 1.81, uncorrected p = 0.035), and for the FA and the number of fiber tracts connecting the left HPC and left cingulate cortex (FA 16: rHC = 0.373, rMCI = −0.280, |z| = 2.25, uncorrected p = 0.012; NOT 16: rHC = −0.121, rMCI = 0.464, |z| = 2.07, uncorrected p = 0.038).
3.3. Associations between WM Structural Properties and Neurometabolite Ratios
Significant correlations or trends with moderate to strong correlations between neurometabolite ratios and FA are illustrated schematically in Figure 3A. For MCI, multiple associations were found where the FA properties of fiber tracts consisting of the right and left temporal tapetum, right posterior corona radiata, or right posterior cingulate gyri were associated with tNAA/tCr, mIns/tCr, or tNAA/mIns in the dPCC, left HPC, and left MTC (all p ≤ 0.009). In contrast to MCI, findings from the HC cohort revealed only one trend where a positive association was observed between the FA of the left external capsule and right DLPFC tNAA/tCr (p = 0.003). Significant positive associations were also found for MCI between the number of fiber tracts in the right DLPFC (NOT 19) and left posterior corona radiata (NOT 10) and left HPC tNAA/tCr and mIns/tCr (p < 0.001) (Figure 3B). In addition, trends towards significant associations (p < 0.01) were observed in both groups (observations at p ≥ 0.01 were not reported). The abovementioned observations are discussed, in detail, next.
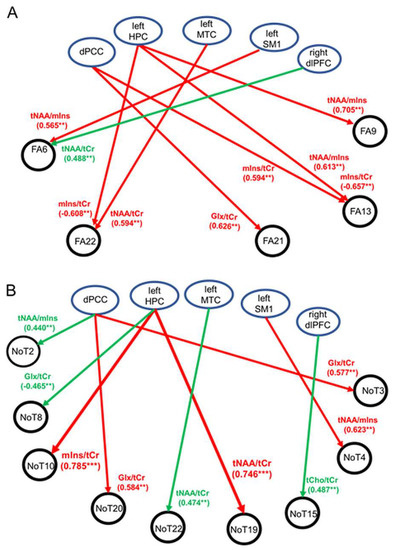
Figure 3.
Schematic illustration showing significant associations (p < 0.001) or trends (p < 0.01) between WM tractographic properties and 1H-MRS neurometabolites in the five regions of interest. (A) Associations between fractional anisotropy (FA) and 1H-MRS neurometabolites. (B) Associations between number of tracts (NOT) and 1H-MRS neurometabolites. Abbreviations: HPC = hippocampus, DLPFC = dorsolateral prefrontal cortex, SM1 = sensorimotor cortex, MTC = medial temporal cortex, dPCC = dorsal posterior cingulate cortex, tNAA = total NAA, Glx = glutamate–glutamine complex, mIns = myo-inositol, tCho = total choline, tCr = total creatine. Regions of interest (ROIs) are identified. ** p ≤ 0.009, *** p < 0.001.
Total population (HC + MCI): A significant negative correlation existed between the number of fiber tracts in the left anterior corona radiata (NOT 8) and left HPC Glx/tCr (rS = −0.500, uncorrected p < 0.001). Trends showing moderate correlations were found between the following: (1) dPCC Glx/tCr and the number of fiber tracts in the left DLPFC (NOT 20) (rS = 0.410, uncorrected p = 0.002); (2) left HPC tCho/tCr and FA of the right SM1 (FA 17) (rS = 0.402, uncorrected p = 0.004); (3) left HPC mIns/tCr and the number of fiber tracts in the superior right corona radiata (NOT 11) (rS = −0.391, uncorrected p = 0.005) and FA of the left temporal tapetum (FA 22) (rS = −0.427, uncorrected p = 0.002); (4) left HPC tNAA/mIns and FA of the right posterior corona radiata (FA 9) (rS = 0.372, uncorrected p = 0.008); (5) left MTC tNAA/tCr and the number of fiber tracts in the left temporal tapetum (NOT 22) (rS = 0.385, uncorrected p = 0.009); and (6) right DLPFC tNAA/tCr and FA of the left external capsule (FA 6) (rS = 0.414, uncorrected p = 0.002); for all remaining correlations (|rSHC| ≤ 0.342, uncorrected p ≥ 0.01), see Table 7 (for total population). These findings suggest that, globally, higher FA values and a higher number of WM tracts were associated primarily with higher tNAA/tCr and lower mIns/tCr. No other significant group differences or trends were found.
Table 7.
Significant correlations between WM tractographic properties and 1H-MRS neurometabolites for the total population.
HC group: No significant correlations between WM structural properties and neurometabolite ratios were found (all p > 0.001) (Table 8). Trends showing moderate correlations were observed between the following: (1) right DLPFC tNAA/tCr and FA of the left external capsule (FA 6) (rSHC = 0.488, uncorrected p = 0.003); (2) right DLPFC tNAA/tCr and NOT in the splenium (NOT 2) (rSHC = 0.440, uncorrected p = 0.009); (3) right DLPFC tNAA/mIns and the total number of fiber tracts (NOT 1) (rSHC = 0.445, uncorrected p = 0.008); and (4) right DLPFC tCho/tCr and the number of fiber tracts connecting the right HPC and right cingulate cortex (NOT 15) (rSHC = 0.483, uncorrected p = 0.003). In addition, trends existed between the following: (5) left HPC Glx/tCr and the number of fiber tracts in the left corona radiata (NOT 8) (rSHC = −0.465, uncorrected p = 0.008); (6) left MTC tNAA/tCr and the number of fiber tracts in the left temporal tapetum (NOT 22) (rSHC = 0.474, uncorrected p = 0.008); and (7) left SM1 Glx/tCr and FA of whole-brain fiber tracts (FA 1) (rSHC = 0.521, uncorrected p = 0.002). In addition, moderate negative associations existed between dPCC tNAA/tCr and the number of fiber tracts in the right posterior corona radiata (NOT 9) (rSHC = −0.404, uncorrected p = 0.018) and dPCC tNAA/tCr and FA of the right temporal tapetum (FA 21) (rSHC = −0.427, uncorrected p = 0.012) which did not exist in MCI. No other significant group differences or trends were found.
Table 8.
Significant group differences in correlations between WM tractographic properties and 1H-MRS neurometabolites.
MCI group: Significant strong positive correlations existed between the left HPC tNAA/tCr and the number of fiber tracts in the right DLPFC (NOT 19), and between the left HPC mIns/tCr and the number of fiber tracts in the left posterior corona radiata (NOT 10) (rSMCI ≥ 0.745, uncorrected p < 0.001) (Table 8). Trends showing positive associations with moderate to strong correlations were found between the following: (1) left HPC tNAA/mIns and FA of the right posterior corona radiata (FA 9) (rSMCI = 0.705, uncorrected p = 0.002); (2) left HPC tNAA/mIns and FA of the left posterior cingulate gyri (FA 13) (rSMCI = 0.613, uncorrected p = 0.007); (3) dPCC mIns/tCr and FA of the left posterior cingulate gyri (FA 13) (rSMCI = 0.594, uncorrected p = 0.006); (4) dPCC Glx/tCr and FA of the right temporal tapetum (FA 21) (rSMCI = 0.626, uncorrected p = 0.004); (5) left dPCC Glx/tCr and the number of fiber tracts in the right internal capsule (NOT 3) (rSMCI = 0.577, uncorrected p = 0.008); (6) left DLPFC (NOT 20) (rSMCI = 0.584, uncorrected p = 0.007); and (7) left SM1 and tNAA/mIns and FA of the left external capsule (FA 6) (rSMCI = 0.565, uncorrected p = 0.009). Finally, negative associations with moderate to strong correlations existed between (8) the left HPC mIns/tCr and FA of the left posterior cingulate gyri (FA 13) (rSMCI = −0.657, uncorrected p = 0.003) and (9) the left HPC mIns/tCr and the left temporal tapetum (FA 22) (rSMCI = −0.608, uncorrected p = 0.009). In summary, the microstructural integrity of WM fiber tracts in MCI was associated primarily with the neurometabolite characteristics of the dPCC and left HPC. Specifically: (1) dPCC Glx/tCr was associated with FA or the number of fiber tracts in the left or right temporal tapetum; (2) dPCC and the left HPC mIns/tCr were associated with the FA of fiber tracts in the right cingulate gyri; (3) left HPC mIns/tCr and tNAA/mIns were associated with FA or the number of tracts in the right cingulate gyri (tNAA/mIns), right corona radiata (tNAA/mIns), and left temporal tapetum (mIns/tCr); (4) the left SM1 NAA/mIns was associated with FA in the left or right external capsule; and (5) the left MTC tNAA/tCr was associated with the FA of fiber tracts in the left temporal tapetum. No other significant group differences or trends were found.
Group differences: Significant results and trends at p < 0.01 are summarized in Table 8 (observations at p ≥ 0.01 were not reported). Significant group differences in the correlations between WM structural properties and neurometabolite ratios were observed primarily for the left HPC tNAA/tCr and mIns/tCr (left HPC tNAA/tCr and number of fiber tracts in the left DLPFC (NOT 19): rSHC = −0.227, rSMCI = 0.745, |z| = 3.75, uncorrected p = 0.0002; left HPC mIns/tCr and number of fiber tracts in left posterior corona radiata (NOT 10): rSHC = 0.005, rSMCI = 0.785, |z| = 3.31, uncorrected p = 0.0009). Other group differences with trends towards significance were observed for correlations between the following: (1) dPCC tNAA/tCr and FA of the right temporal tapetum (FA 21) (rSHC = −0.427, rSMCI = 0.471, |z| = 3.20, uncorrected p = 0.0014) and dPCC tNAA/tCr and the number of fiber tracts in the right corona radiata (NOT 9) (rSHC = −0.405, rSMCI = 0.465, |z| = 3.09, uncorrected p = 0.0020); and (2) left SM1 tNAA/tCr and the number of fiber tracts in the right external capsule (rSHC = −0.226, rSMCI = 0.623, |z| = 3.26, uncorrected p = 0.0014). For all remaining correlations: |z| ≤ 2.87, p ≥ 0.004.
4. Discussion
The present study provides novel insights into the neurochemical biomarkers of the microstructural organization of WM tracts in older adults with intact cognitive functioning and in MCI patients. We primarily focused on brain regions associated with cognitive impairments in MCI patients which included the medial temporal lobe (including the hippocampus), the posterior cingulate cortex, and the dorsolateral prefrontal cortex.
4.1. Neurochemical Characteristics of Hippocampus and Cortex in Healthy Aging and MCI
Our findings revealed no statistical differences in the neurochemical characteristics of the four cortical regions (i.e., dPCC, left SM1, left MTC, and right DLPFC) and hippocampus between MCI patients and cognitively intact older adults. The observations are in line with findings from other 1H-MRS studies, but contradictory to others where group differences have been documented [27,28,29,30,31,33,34,49]. The absence of significant group differences in the neurometabolite levels between MCI and non-MCI subjects may suggest that the subjects included in the MCI group were mostly patients with stable MCI or individuals with a low risk of progressing to Alzheimer’s disease [27,35].
Neurodegenerative processes in aging and MCI are typically characterized by alterations in neurometabolite concentrations of tNAA, Cho, and mIns [18,37]. In healthy human volunteers, in vivo quantification of brain neurometabolites with 1H-MRS typically shows age-related declines in the regional levels of multiple neurometabolites, including NAA, Glx, and GABA and increases in the levels of Cho and mIns [19,20,21,22,23,24,40,43]. The same alterations have also been shown to play a pivotal role as mediators of progressive cognitive decline observed in older adults with MCI or patients with dementia-related disorders [26,28,29,30]. Specifically, low tNAA/tCr and elevated mIns/tCr and tCho/tCr in the posterior cingulate cortex and/or the hippocampus were reported as early predictors of a transition from MCI to Alzheimer’s disease [33,34]. Finally, elevated levels of mIns in the hippocampus and high levels of tCho and glutamate in the anterior cingulate cortex were found to be associated with worse performance on a working memory task as well as elevated low-grade systemic inflammation [43,50]. Importantly, lower tNAA/tCr and elevated mIns/tCr in the hippocampus and posterior cingulate cortex structures of individuals with MCI have been considered as potential biomarkers for monitoring the progression from MCI to Alzheimer’s disease (AD) [34]. Therefore, examining associations between measures of cognitive functions and neurometabolite levels in key brain regions related to the development of MCI can shed light on the processes related to MCI’s etiology. However, the abovementioned evidence leaves us with a knowledge gap about the neurometabolic correlates of other neurodegenerative processes related to structural changes in general and MCI in particular; specifically, the microstructural integrity of WM tracts connecting the hippocampus with other brain regions [23,38,43].
4.2. Neurochemical Predictors of WM Microstructural Integrity
Our main findings were that subjects in the MCI group showed moderate to strong associations between tNAA/tCr, mIns/tCr, and tNAA/mIns ratios at dPCC, left HPC, and/or left MTC and the FA values of WM tracts crossing these regions (Figure 3A). We also found associations between the aforementioned neurometabolites and NOT (Figure 3B), but these associations were not specific to MCI and therefore will not be discussed here. FA is a biomarker reflecting the microstructural integrity of white matter bundles. Similar to findings from previous studies, decreased microstructural integrity (as expressed by lower FA) in our study was linked with lower NAA/tCr and NAA/mIns ratios and higher mIns/tCr. These observations may in part be explained by decreased neuronal density and axonal loss, which are characterized by lower levels of tNAA or tNAA/tCr [23,38]. In addition, the negative association between mIns/tCr and FA could hint at a link between increased glial activity and the interruption of the microstructural organization of WM. For example, a study on patients with schizophrenia revealed that mIns levels were negatively associated with FA in both patient and control groups even when controlling for age, suggesting a possible effect of neuroinflammation on white matter integrity [51]. Pro-inflammatory processes and aging of glial cells have long been argued to play a role in the conditions associated with cognitive decline and neurodegeneration in the normal aging process [52,53]. However, only a limited number of studies have attempted to measure both peripheral and central biomarkers of inflammation and examined their interrelationship [41,43,50]. The association between neuroinflammatory processes in healthy aging and cortical expressions of mIns was recently confirmed by Vints et al. and others, where associations were reported between mIns or mIns/tCr and biomarkers of systemic inflammation (e.g., kynurenine and IL-6) [43,50]. In line with findings presented in Figure 3, we proposed that there might be a connection between the levels of neuroinflammation in the left hippocampus and the microstructural integrity of WM tracts originating from this region, specifically, but not exclusively, the left posterior cingulate and left temporal tapetum. In line with previous studies, our results suggest that elevated levels of mIns may be used as a peripheral inflammatory marker that is associated with neuroinflammation and potentially neurodegeneration [41,43]. Overall, these observations confirm our working hypothesis that neuroinflammatory processes in the hippocampus and posterior cingulate may be key players in the mechanism(s) underlying the structural damage of WM related to the development of MCI. Finally, we propose that elevated glial cell activity as expressed by elevated mIns/tCr may be an underlying mechanism for decreased connectivity between the hippocampus and prefrontal/cingulate cortex that could lead to cognitive decline and potentially to neurodegenerative diseases. However, further research is needed to confirm this hypothesis.
4.3. Associations between WM Structural Properties and MoCA Scores in Healthy Aging and MCI
As predicted, our observations revealed the existence of associations between WM structural properties and MoCA scores. This finding is in line with findings from previous studies where similar associations were observed in both healthy aging and patient populations including mild cognitive impairment and neurodegenerative diseases such as Alzheimer’s disease [15,54,55,56]. Overall findings from these studies and our study suggest that higher FA values of white matter tracts originating from the hippocampus and cingulate cortex were positively correlated with MoCA scores, suggesting that decreased FA values can predict a decline in global cognition in MCI [15,57]. In the healthy aging population, some studies have found a negative correlation between FA values and MoCA scores, suggesting that reduced FA values in specific white matter regions are associated with decreased cognitive function [58]. This finding is somewhat in line with observations from our data set where high MoCA scores were negatively associated with high FA values of WM tracts originating in the right sensorimotor cortex.
Reduced FA values and a possible reduction in the number of WM tracts in MCI have been consistently reported in white matter regions associated with cognitive decline [15]. These findings, in addition to observations from the present study, suggest that both FA values and the number of tracts (NOTs) originating from the hippocampus can be used as markers of cognitive decline in MCI, and therefore may be useful for monitoring the progression of this disease. Furthermore, we suggest that the FA values (or number of tracts) of WM connections among ROIs included in the present study can be used as a reliable marker of cognitive decline in MCI and may be utilized as a tool for monitoring disease progression and treatment response.
4.4. Study Limitations
A major limitation of the present study was the small size of the subjects in the MCI group, which is possibly the reason for the lack of significant findings with regard to associations between WM properties and MoCA as well as between WM properties and 1H-MRS measures. Therefore, even though our observations pointed toward possible associations between the biochemical integrity and structural integrity of the brain, the current observations need to be discussed with caution, especially when discussed in conjunction with the diagnostic evaluation of disease progression. Furthermore, the lack of a sufficient sample size limits our ability to draw conclusions about the causal relationship between WM microstructural integrity, neurochemical integrity, and global cognition in MCI through mediation analysis [59], for example, through tests for the effect of the independent WM microstructural property FA on global cognition through the mediator variable tNAA/tCr or mIns/tCr. Another possible limitation of this study was the implementation of a diffusion analysis with the Syngo.via Workstation, which provides information on diffusivity, FA, and number of tracts. However, other diffusion analysis tools such as neurite orientation dispersion and density imaging (NODDI) or constrained spherical deconvolution (CSD)-based fiber tractography [60] that are considered to be more advanced and up-to-date require the use of specific Matlab Toolboxes that were not accessible to the researchers. The aforementioned processing tools have been designed to deal with crossing fibers by estimating the fiber orientation distribution in each image voxel. Therefore, they are expected to provide a more accurate estimation of the microstructural organization of fibers within a voxel. However, observations from the present study were generally in line with findings from previous studies using another software library [15,61], thus supporting our findings.
4.5. Conclusions
We have shown that the processes associated with the etiology of MCI depend (at least in part) on the biochemical properties of the hippocampus. More specifically, observations from this study suggest that the biochemical integrity of the left hippocampus is associated with the microstructural organization of ipsilateral WM tracts connecting the hippocampus with the temporal and prefrontal cortex. This finding highlights the role of 1H MRS as a marker of structural abnormalities in MCI. The increased use of 1H MRS in clinical practice as a biomarker in early pathological involvement in neurodegenerative diseases could potentially provide complementary information on the underlying pathologies that could lead to dementia.
Supplementary Materials
The following supporting information can be downloaded at: https://www.mdpi.com/article/10.3390/diagnostics13040654/s1, File S1: MRSinMRS Reporting Checklist for single-voxel MR spectroscopy imaging.
Author Contributions
K.V., O.L. and R.G. contributed to the conception and design of the study. M.Š., S.K., S.S., K.V., R.G., V.J.Č., O.L., G.D. and N.M. were involved in data collection and/or analysis. R.K. performed the statistical analysis. K.V. and O.L. wrote the first draft of the manuscript. K.V. and O.L. prepared the figures. R.G., U.H., O.L., W.A.J.V. and N.M. had a role in supervision. All authors have read and agreed to the published version of the manuscript.
Funding
This work was supported by the Research Council of Lithuania (Grant Number S-SEN-20-5). The sponsor was not involved in the study design; the collection, analysis, and interpretation of the data; in the writing of the report; nor in the decision to submit the article for publication.
Institutional Review Board Statement
The study was conducted according to the guidelines of the Declaration of Helsinki, and approved by Kaunas region’s Medical Ethics Committee for Biomedical Research No. BE-2-36, 2020 07 08. All subjects gave their informed consent for inclusion before they participated in the study.
Informed Consent Statement
Informed consent was obtained from all subjects involved in the study.
Data Availability Statement
Excel files with processed data and statistical outputs supporting the conclusions of this article will be made available by the authors upon request to the corresponding authors (kristina.valatkeviciene@lsmu.lt), without undue reservation. Obtaining access to raw data or MRI scan files will require approval from the project manager (nerijus.masiulis@lsu.lt) in addition to ethical approval (on an individual user and purpose basis) by the local medical ethical committee. The authors are willing to support such ethical approval applications.
Acknowledgments
The authors wish to thank Laimutis Kurtinaitis for his involvement in the collection of MRI data.
Conflicts of Interest
The authors declare no conflict of interest.
References
- Eshkoor, S.A.; Mun, C.Y.; Ng, C.K.; Hamid, T.A. Mild cognitive impairment and its management in older people. Clin. Interv. Aging 2015, 10, 687–693. [Google Scholar] [CrossRef]
- Petersen, R.C.; Parisi, J.E.; Dickson, D.W.; Johnson, K.A.; Knopman, D.S.; Boeve, B.F.; Jicha, G.A.; Ivnik, R.J.; Smith, G.E.; Tangalos, E.G.; et al. Neuropathologic Features of Amnestic Mild Cognitive Impairment. Arch. Neurol. 2006, 63, 665–672. [Google Scholar] [CrossRef]
- Davatzikos, C.; Xu, F.; An, Y.; Fan, Y.; Resnick, S.M. Longitudinal progression of Alzheimer’s-like patterns of atrophy in normal older adults: The SPARE-AD index. Brain 2009, 132, 2026–2035. [Google Scholar] [CrossRef]
- Driscoll, I.; Davatzikos, C.; An, Y.; Wu, X.; Shen, D.; Kraut, M.; Resnick, S.M. Longitudinal pattern of regional brain volume change differentiates normal aging from MCI. Neurology 2009, 72, 1906–1913. [Google Scholar] [CrossRef]
- van de Pol, L.A.; van der Flier, W.M.; Korf, E.S.C.; Fox, N.C.; Barkhof, F.; Scheltens, P. Baseline predictors of rates of hippo-campal atrophy in mild cognitive impairment. Neurology 2007, 69, 1491–1497. [Google Scholar] [CrossRef]
- Caballero, M.A.; Brendel, M.; Delker, A.; Ren, J.; Rominger, A.; Bartenstein, P.; Dichgans, M.; Weiner, M.W.; Ewers, M. Mapping 3-year changes in gray matter and metabolism in Aβ-positive nondemented subjects. Neurobiol. Aging 2015, 36, 2913–2924. [Google Scholar] [CrossRef]
- Régy, M.; Dugravot, A.; Sabia, S.; Fayosse, A.; Mangin, J.; Chupin, M.; Fischer, C.; Bouteloup, V.; Dufouil, C.; Chêne, G.; et al. Association of APOE ε4 with cerebral gray mat-ter volumes in non-demented older adults: The MEMENTO cohort study. Neuroimage 2022, 250, 118966. [Google Scholar] [CrossRef]
- Vonk, J.M.J.; Bouteloup, V.; Mangin, J.; Dubois, B.; Blanc, F.; Gabelle, A.; Ceccaldi, M.; Annweiler, C.; Krolak-Salmon, P.; Belin, C.; et al. Semantic loss marks early Alzheimer’s dis-ease-related neurodegeneration in older adults without dementia. Alzheimers Dement. 2020, 12, e12066. [Google Scholar]
- Moore, E.E.; Liu, D.; Pechman, K.R.; Acosta, L.M.Y.; Bell, S.P.; Davis, L.T.; Blennow, K.; Zetterberg, H.; Landman, B.A.; Schrag, M.S.; et al. Mild Cognitive Impairment Staging Yields Genetic Susceptibility, Biomarker, and Neuroimaging Differences. Front. Aging Neurosci. 2020, 12, 139. [Google Scholar] [CrossRef]
- Atiya, M.; Hyman, B.T.; Albert, M.S.; Killiany, R. Structural Magnetic Resonance Imaging in Established and Prodromal Alzheimer Disease: A Review. Alzheimer Dis. Assoc. Disord. 2003, 17, 177–195. [Google Scholar] [CrossRef]
- Anderson, V.C.; Litvack, Z.N.; Kaye, J.A. Magnetic Resonance Approaches to Brain Aging and Alzheimer Disease-associated Neuropathology. Top. Magn. Reson. Imaging 2005, 16, 439–452. [Google Scholar] [CrossRef]
- Apostolova, L.G.; Thompson, P.M. Mapping progressive brain structural changes in early Alzheimer’s disease and mild cognitive impairment. Neuropsychologia 2008, 46, 1597–1612. [Google Scholar] [CrossRef]
- Chiang, G.C.; Insel, P.S.; Tosun, D.; Schuff, N.; Truran-Sacrey, D.; Raptentsetsang, S.; Jack, C.R.; Weiner, M.W.; Alzheimer's Disease Neuroimaging Initiative. Identifying Cognitively Healthy Elderly Individuals with Subsequent Memory Decline by Using Automated MR Temporoparietal Volumes. Radiology 2011, 259, 844–851. [Google Scholar] [CrossRef]
- Leung, K.K.; Bartlett, J.W.; Barnes, J.; Manning, E.N.; Ourselin, S.; Fox, N.C.; Alzheimer's Disease Neuroimaging Initiative. Cerebral atrophy in mild cognitive impairment and Alzheimer disease: Rates and acceleration. Neurology 2013, 80, 648–654. [Google Scholar] [CrossRef]
- Thillainadesan, S.; Wen, W.; Zhuang, L.; Crawford, J.; Kochan, N.; Reppermund, S.; Slavin, M.; Trollor, J.; Brodaty, H.; Sachdev, P. Changes in mild cognitive im-pairment and its subtypes as seen on diffusion tensor imaging. Int. Psychogeriatr. 2012, 24, 1483–1493. [Google Scholar]
- Levin, O.; Vints, W.A.J.; Ziv, G.; Katkutė, G.; Kušleikienė, S.; Valatkevičienė, K.; Sheoran, S.; Drozdova-Statkevičienė, M.; Gleiznienė, R.; Pääsuke, M.; et al. Neurometabolic correlates of postur-ography in normal aging and older adults with mild cognitive impairment: Evidence from a 1H-MRS study. Neuroimage Clin. 2022, 37, 103304. [Google Scholar] [CrossRef]
- Maudsley, A.A.; Govind, V.; Levin, B.; Saigal, G.; Harris, L.T.; Sheriff, S. Distributions of Magnetic Resonance Diffusion and Spectroscopy Measures with Traumatic Brain Injury. J. Neurotrauma 2015, 32, 1056–1063. [Google Scholar] [CrossRef]
- Cleeland, C.; Pipingas, A.; Scholey, A.; White, D. Neurochemical changes in the aging brain: A systematic review. Neurosci. Biobehav. Rev. 2019, 98, 306–319. [Google Scholar] [CrossRef]
- Ding, X.; Maudsley, A.A.; Sabati, M.; Sheriff, S.; Schmitz, B.; Schütze, M.; Bronzlik, P.; Kahl, K.G.; Lanfermann, H. Physiological neuronal decline in healthy ag-ing human brain—An in vivo study with MRI and short echo-time whole-brain 1H MR spectroscopic imaging. Neuroimage 2016, 137, 45–51. [Google Scholar] [CrossRef]
- Gao, F.; Edden, R.A.; Li, M.; Puts, N.A.; Wang, G.; Liu, C.; Zhao, B.; Wang, H.; Bai, X.; Zhao, C.; et al. Edited magnetic resonance spectroscopy detects an age-related decline in brain GABA levels. NeuroImage 2013, 78, 75–82. [Google Scholar] [CrossRef]
- Porges, E.C.; Woods, A.J.; Edden, R.A.E.; Puts, N.A.J.; Harris, A.D.; Chen, H.; Garcia, A.G.; Seider, T.R.; Lamb, D.G.; Williamson, J.B.; et al. Frontal Gamma-Aminobutyric Acid Con-centrations Are Associated with Cognitive Performance in Older Adults. Biol. Psychiatry Cogn. Neurosci. Neuroimaging 2017, 2, 38–44. [Google Scholar]
- Reyngoudt, H.; Claeys, T.; Vlerick, L.; Verleden, S.; Acou, M.; Deblaere, K.; De Deene, Y.; Audenaert, K.; Goethals, I.; Achten, E. Age-related differences in metabolites in the posterior cingulate cortex and hippocampus of normal ageing brain: A 1H-MRS study. Eur. J. Radiol. 2012, 81, e223–e231. [Google Scholar] [CrossRef]
- Wijtenburg, S.A.; McGuire, S.A.; Rowland, L.M.; Sherman, P.M.; Lancaster, J.L.; Tate, D.F.; Hardies, L.J.; Patel, B.; Glahn, D.C.; Hong, L.E.; et al. Relationship between frac-tional anisotropy of cerebral white matter and metabolite concentrations measured using 1H magnetic resonance spec-troscopy in healthy adults. Neuroimage 2013, 66, 161–168. [Google Scholar]
- Zahr, N.M.; Mayer, D.; Rohlfing, T.; Chanraud, S.; Gu, M.; Sullivan, E.V.; Pfefferbaum, A. In vivo glutamate measured with magnetic resonance spectroscopy: Behavioral correlates in aging. Neurobiol. Aging 2013, 34, 1265–1276. [Google Scholar] [CrossRef]
- Ben Salem, D.; Walker, P.M.; Aho, S.; Tavernier, B.; Giroud, M.; Tzourio, C.; Ricolfi, F.; Brunotte, F. Brain flexibility and balance and gait per-formances mark morphological and metabolic abnormalities in the elderly. J. Clin. Neurosci. 2008, 15, 1360–1365. [Google Scholar]
- Kantarci, K.; Smith, G.E.; Ivnik, R.J.; Petersen, R.C.; Boeve, B.F.; Knopman, D.S.; Tangalos, E.G.; Jack, C.R., Jr. 1H magnetic resonance spectroscopy, cognitive function, and apolipoprotein E genotype in normal aging, mild cognitive impairment and Alzheimer’s disease. J. Int. Neuropsychol. Soc. 2002, 8, 934–942. [Google Scholar] [CrossRef]
- Kantarci, K.; Weigand, S.D.; Petersen, R.C.; Boeve, B.F.; Knopman, D.S.; Gunter, J.; Reyes, D.; Shiung, M.; O’Brien, P.C.; Smith, G.E.; et al. Longitudinal 1H MRS changes in mild cognitive impairment and Alzheimer’s disease. Neurobiol. Aging 2007, 28, 1330–1339. [Google Scholar] [CrossRef]
- Lyros, E.; Ragoschke-Schumm, A.; Kostopoulos, P.; Sehr, A.; Backens, M.; Kalampokini, S.; Decker, Y.; Lesmeister, M.; Liu, Y.; Reith, W.; et al. Normal brain aging and Alzheimer’s disease are associated with lower cerebral pH: An in vivo histidine 1H-MR spectroscopy study. Neurobiol. Aging 2019, 87, 60–69. [Google Scholar] [CrossRef]
- Mitolo, M.; Stanzani-Maserati, M.; Capellari, S.; Testa, C.; Rucci, P.; Poda, R.; Oppi, F.; Gallassi, R.; Luisa Sambati, L.; Rizzo, G.; et al. Predicting conversion from mild cogni-tive impairment to Alzheimer’s disease using brain 1H-MRS and volumetric changes: A two- year retrospective follow-up study. Neuroimage Clin. 2019, 23, 101843. [Google Scholar]
- Oeltzschner, G.; Wijtenburg, S.A.; Mikkelsen, M.; Edden, R.A.E.; Barker, P.B.; Joo, J.H.; Leoutsakos, J.M.S.; Rowland, L.M.; Workman, C.I.; Smith, G.S. Neurometabolites and associa-tions with cognitive deficits in mild cognitive impairment: A magnetic resonance spectroscopy study at 7 Tesla. Neurobiol. Aging 2019, 73, 211–218. [Google Scholar]
- Olson, B.L.B.; Holshouser, B.A.; Britt, W.; Mueller, C.; Baqai, W.; Patra, S.; Petersen, F.; Kirsch, W.M. Longitudinal Metabolic and Cognitive Changes in Mild Cognitive Impairment Patients. Alzheimer Dis. Assoc. Disord. 2008, 22, 269–277. [Google Scholar] [CrossRef]
- Zanigni, S.; Testa, C.; Calandra-Buonaura, G.; Sambati, L.; Guarino, M.; Gabellini, A.; Evangelisti, S.; Cortelli, P.; Lodi, R.; Tonon, C. The contribution of cerebellar proton magnetic resonance spectroscopy in the differential diagnosis among parkinsonian syndromes. Park. Relat. Disord. 2015, 21, 929–937. [Google Scholar] [CrossRef]
- Zhao, L.; Teng, J.; Mai, W.; Su, J.; Yu, B.; Nong, X.; Li, C.; Wei, Y.; Duan, G.; Deng, X.; et al. A Pilot Study on the Cutoff Value of Related Brain Metabolite in Chinese Elderly Patients With Mild Cognitive Impairment Using MRS. Front. Aging Neurosci. 2021, 13, 617611. [Google Scholar] [CrossRef]
- Liu, H.; Zhang, D.; Lin, H.; Zhang, Q.; Zheng, L.; Zheng, Y.; Yin, X.; Li, Z.; Liang, S.; Huang, S. Meta-Analysis of Neurochemical Changes Estimated via Magnetic Resonance Spectroscopy in Mild Cognitive Impairment and Alzheimer’s Disease. Front. Aging Neurosci. 2021, 13. [Google Scholar] [CrossRef]
- Kantarci, K. Proton MRS in mild cognitive impairment. J. Magn. Reason. Imaging 2013, 37, 770–777. [Google Scholar]
- Waragai, M.; Moriya, M.; Nojo, T. Decreased N-Acetyl Aspartate/Myo-Inositol Ratio in the Posterior Cingulate Cortex Shown by Magnetic Resonance Spectroscopy May Be One of the Risk Markers of Preclinical Alzheimer’s Disease: A 7-Year Follow-Up Study. J. Alzheimer’s Dis. 2017, 60, 1411–1427. [Google Scholar] [CrossRef]
- Wang, H.; Tan, L.; Wang, H.; Liu, Y.; Yin, R.; Wang, W.; Chang, X.-L.; Jiang, T.; Yu, J.-T. Magnetic Resonance Spectroscopy in Alzheimer’s Disease: Sys-tematic Review and Meta-Analysis. J. Alzheimers Dis. 2015, 46, 1049–1070. [Google Scholar] [CrossRef]
- Grossman, E.J.; Kirov, I.I.; Gonen, O.; Novikov, D.S.; Davitz, M.S.; Lui, Y.W.; Grossman, R.I.; Inglese, M.; Fieremans, E. N-acetyl-aspartate levels correlate with intra-axonal compartment parameters from diffusion MRI. Neuroimage 2015, 118, 334–343. [Google Scholar] [CrossRef]
- Jones, R.S.; Waldman, A.D. 1H-MRS evaluation of metabolism in Alzheimer’s disease and vascular dementia. Neurol. Res. 2004, 26, 488–495. [Google Scholar] [CrossRef]
- Levin, O.; Weerasekera, A.; King, B.R.; Heise, K.F.; Sima, D.M.; Chalavi, S.; Maes, C.; Peeters, R.; Sunaert, S.; Cuypers, K.; et al. Sensorimotor cortex neurometabolite lev-els as correlate of motor performance in normal aging: Evidence from a 1H-MRS study. Neuroimage 2019, 202, 116050. [Google Scholar] [CrossRef]
- Lind, A.; Boraxbekk, C.; Petersen, E.T.; Paulson, O.B.; Siebner, H.R.; Marsman, A. Regional Myo-Inositol, Creatine, and Cho-line Levels Are Higher at Older Age and Scale Negatively with Visuospatial Working Memory: A Cross-Sectional Proton MR Spectroscopy Study at 7 Tesla on Normal Cognitive Ageing. J. Neurosci. 2020, 40, 8149–8159. [Google Scholar] [CrossRef]
- Watson, N.L.; Rosano, C.; Boudreau, R.; Simonsick, E.M.; Ferrucci, L.; Sutton-Tyrrell, K.; Hardy, S.E.; Atkinson, H.H.; Yaffe, K.; Satterfield, S.; et al. Executive Function, Memory, and Gait Speed Decline in Well-Functioning Older Adults. J. Gerontol. Ser. A 2010, 65, 1093–1100. [Google Scholar] [CrossRef]
- Vints, W.A.J.; Kušleikiene, S.; Sheoran, S.; Šarkinaite, M.; Valatkevičiene, K.; Gleizniene, R.; Kvedaras, M.; Pukenas, K.; Himmelreich, U.; Cesnaitiene, V.J.; et al. Inflammatory Blood Bi-omarker Kynurenine Is Linked with Elevated Neuroinflammation and Neurodegeneration in Older Adults: Evidence From Two 1H-MRS Post-Processing Analysis Methods. Front. Psychiatry 2022, 13, 859772. [Google Scholar] [CrossRef]
- Lin, A.; Andronesi, O.; Bogner, W.; Choi, I.; Coello, E.; Cudalbu, C.; Juchem, C.; Kemp, G.J.; Kreis, R.; Krššák, M.; et al. Minimum Reporting Standards for in vivo Mag-netic Resonance Spectroscopy (MRSinMRS): Experts’ consensus recommendations. NMR Biomed. 2021, 34, e4484. [Google Scholar] [CrossRef]
- Mori, S.; Kaufmann, W.E.; Davatzikos, C.; Stieltjes, B.; Amodei, L.; Fredericksen, K.; Pearlson, G.D.; Melhem, E.R.; Solaiyappan, M.; Raymond, G.V.; et al. Imaging cortical association tracts in the human brain using diffusion-tensor-based axonal tracking. Magn. Reson. Med. 2002, 47, 215–223. [Google Scholar] [CrossRef]
- Lazar, M.; Weinstein, D.M.; Tsuruda, J.S.; Hasan, K.M.; Arfanakis, K.; Meyerand, M.E.; Badie, B.; Rowley, H.A.; Haughton, V.; Field, A.; et al. White matter tractography using diffusion tensor deflection. Hum. Brain Mapp. 2003, 18, 306–321. [Google Scholar] [CrossRef]
- Hong, Y.J.; Yoon, B.; Shim, Y.S.; Cho, A.H.; Lim, S.C.; Ahn, K.J.; Yang, D.W. Differences in microstructural alterations of the hip-pocampus in Alzheimer disease and idiopathic normal pressure hydrocephalus: A diffusion tensor imaging study. AJNR Am. J. Neuroradiol. 2010, 31, 1867–1872. [Google Scholar]
- Benjamini, Y.; Hochberg, Y. Controlling the False Discovery Rate: A Practical and Powerful Approach to Multiple Testing. J. R. Stat. Soc. Ser. B 1995, 57, 289–300. [Google Scholar] [CrossRef]
- Targosz-Gajniak, M.G.; Siuda, J.S.; Wicher, M.M.; Banasik, T.J.; Bujak, M.A.; Augusciak-Duma, A.M.; Opala, G. Magnetic reso-nance spectroscopy as a predictor of conversion of mild cognitive impairment to dementia. J. Neurol. Sci. 2013, 335, 58–63. [Google Scholar] [CrossRef]
- Lind, A.; Boraxbekk, C.; Petersen, E.T.; Paulson, O.B.; Andersen, O.; Siebner, H.R.; Marsman, A. Do glia provide the link between low-grade systemic inflammation and normal cognitive ageing? A 1H magnetic resonance spectroscopy study at 7 tesla. J. Neurochem. 2021, 159, 185–196. [Google Scholar] [CrossRef]
- Chiappelli, J.; Hong, L.E.; Wijtenburg, S.A.; Du, X.; Gaston, F.; Kochunov, P.; Rowland, L.M. Alterations in frontal white matter neu-rochemistry and microstructure in schizophrenia: Implications for neuroinflammation. Transl. Psychiatry 2015, 5, e548. [Google Scholar] [CrossRef]
- Angelova, D.M.; Brown, D.R. Microglia and the aging brain: Are senescent microglia the key to neurodegeneration? J. Neu-rochem. 2019, 151, 676–688. [Google Scholar] [CrossRef]
- Triviño, J.J.; von Bernhardi, R. The effect of aged microglia on synaptic impairment and its relevance in neurodegenerative diseases. Neurochem. Int. 2021, 144, 104982. [Google Scholar]
- Medina, D.; Detoledo-Morrell, L.; Urresta, F.; Gabrieli, J.D.; Moseley, M.; Fleischman, D.; Bennett, D.A.; Leurgans, S.; Turner, D.A.; Stebbins, G.T. White matter changes in mild cognitive impairment and AD: A diffusion tensor imaging study. Neurobiol. Aging 2006, 27, 663–672. [Google Scholar] [CrossRef]
- Zavaliangos-Petropulu, A.; Nir, T.M.; Thomopoulos, S.I.; Reid, R.I.; Bernstein, M.A.; Borowski, B.; Jack, C.R., Jr.; Weiner, M.W.; Jahanshad, N.; Thompson, P.M. Diffusion MRI Indi-ces and Their Relation to Cognitive Impairment in Brain Aging: The Updated Multi-protocol Approach in ADNI3. Front. Neuroinform. 2019, 13, 2. [Google Scholar] [CrossRef]
- Ohlhauser, L.; Parker, A.F.; Smart, C.M.; Gawryluk, J.R. White matter and its relationship with cognition in subjective cog-nitive decline. Alzheimers Dement. 2018, 11, 28–35. [Google Scholar] [CrossRef]
- Raghavan, S.; Przybelski, S.A.; Reid, R.I.; Graff-Radford, J.; Lesnick, T.G.; Zuk, S.M.; Knopman, D.S.; Machulda, M.M.; Mielke, M.M.; Petersen, R.C.; et al. Reduced fractional anisotropy of genu of corpus callosum as a predictor of longitudinal cognition in MCI. Neurobiol. Aging 2020, 96, 176–183. [Google Scholar]
- Kantarci, K. Fractional anisotropy of the fornix and hippocampal atrophy in Alzheimer’s disease. Front. Aging Neurosci. 2014, 6, 316. [Google Scholar] [CrossRef]
- Fritz, M.S.; MacKinnon, D.P. Required Sample Size to Detect the Mediated Effect. Psychol. Sci. 2007, 18, 233–239. [Google Scholar] [CrossRef]
- Sacco, S.; Caverzasi, E.; Papinutto, N.; Cordano, C.; Bischof, A.; Gundel, T.; Cheng, S.; Asteggiano, C.; Kirkish, G.; Mallott, J.; et al. Neurite Orientation Dispersion and Density Imaging for Assessing Acute Inflammation and Lesion Evolution in MS. Am. J. Neuroradiol. 2020, 41, 2219–2226. [Google Scholar] [CrossRef]
- Zhylka, A.; Sollmann, N.; Kofler, F.; Radwan, A.; De Luca, A.; Gempt, J.; Wiestler, B.; Menze, B.; Krieg, S.M.; Zimmer, C.; et al. Tracking the Corticospinal Tract in Patients With High-Grade Glioma: Clinical Evaluation of Multi-Level Fiber Tracking and Comparison to Conventional Determinis-tic Approaches. Front. Oncol. 2021, 11, 761169. [Google Scholar]


Disclaimer/Publisher’s Note: The statements, opinions and data contained in all publications are solely those of the individual author(s) and contributor(s) and not of MDPI and/or the editor(s). MDPI and/or the editor(s) disclaim responsibility for any injury to people or property resulting from any ideas, methods, instructions or products referred to in the content. |
© 2023 by the authors. Licensee MDPI, Basel, Switzerland. This article is an open access article distributed under the terms and conditions of the Creative Commons Attribution (CC BY) license (https://creativecommons.org/licenses/by/4.0/).