Abstract
Global longitudinal strain (GLS) and mechanical dispersion (MD), as determined by 2D speckle tracking echocardiography, have been demonstrated to be reliable indicators of prognosis in a variety of cardiovascular illnesses. There are not many papers that discuss the prognostic significance of GLS and MD in a population with non-ST-segment elevated acute coronary syndrome (NSTE-ACS). Our study objective was to examine the predictive utility of the novel GLS/MD two-dimensional strain index in NSTE-ACS patients. Before discharge and four to six weeks later, echocardiography was performed on 310 consecutive hospitalized patients with NSTE-ACS and effective percutaneous coronary intervention (PCI). Cardiac mortality, malignant ventricular arrhythmia, or readmission owing to heart failure or reinfarction were the major end points. A total of 109 patients (35.16%) experienced cardiac incidents during the follow-up period (34.7 ± 8 months). The GLS/MD index at discharge was determined to be the greatest independent predictor of composite result by receiver operating characteristic analysis. The ideal cut-off value was −0.229. GLS/MD was determined to be the top independent predictor of cardiac events by multivariate Cox regression analysis. Patients with an initial GLS/MD > −0.229 that deteriorated after four to six weeks had the worst prognosis for a composite outcome, readmission, and cardiac death according to a Kaplan–Meier analysis (all p < 0.001). In conclusion, the GLS/MD ratio is a strong indicator of clinical fate in NSTE-ACS patients, especially if it is accompanied by deterioration.
1. Introduction
Acute coronary syndrome (ACS) is responsible for a significant part of all deaths caused by cardiovascular disease and is an important contributor to morbidity and mortality during and after hospitalization [1]. Non-ST-segment elevated acute coronary syndrome (NSTE-ACS) shows a poorer prognosis and a higher incidence than ST-segment elevated acute coronary syndrome (STEMI) [1,2]. Risk stratification in these patients is important to correctly undergo an intensified treatment strategy and to prevent unnecessary readmissions to the hospital [1,3]. Assessing left ventricular (LV) remodeling, which leads to heart failure (HF), can predict the prognosis of these patients [4]. Before presenting HF symptoms, patients can develop asymptomatic diastolic and/or systolic LV disfunction, with structural or functional cardiac abnormalities as a cause [5]. Therefore, cardiac imaging is indispensable for managing and following these patients. Prognosis in cardiovascular disease is strongly related to systolic function, commonly assessed using left ventricular ejection fraction (LVEF), and to diastolic function, evaluated by the estimation of left ventricular filling pressures (LVFPs).
When evaluating LVFPs in individuals with cardiac illness, there are numerous criteria to consider. Tissue Doppler imaging (TDI) is a well-established and powerful predictor of unfavorable outcome in several cardiovascular disorders. According to studies [3,6,7,8,9,10], the ratio of early transmitral flow velocity to early diastolic mitral annulus velocity (E/e’) has a significant predictive value for worse outcomes following acute myocardial infarction. Additionally, because longitudinally orientated cardiac fibers are known to be the most sensitive to ischemia, the systolic mitral annulus velocity (s’) is connected to these fibers and can be utilized to evaluate regional motion impairment [5,6,10].
It has been shown that 2D speckle tracking echocardiography (2D-STE) with measurement of the global longitudinal strain (GLS) and of the mechanical dispersion (MD) of the LV can be useful for predicting adverse outcomes in ACS [6,11]. An important advantage of 2D-STE measurements over the Doppler-based technique is its independence of the ultrasound insonation angle [12,13,14]. It has been shown that GLS is a powerful independent predictor of LV remodeling after revascularization therapy in patients with NSTE-ACS [6]. Studies of patients with ischemic and nonischemic cardiomyopathy have shown that a decrease in GLS is linked to an increased risk of ventricular arrhythmias and major cardiac adverse cardiovascular events [15].
MD is also a marker derived from 2D-STE and reflects contraction heterogeneity. MD is described as a predictor of ventricular arrhythmias independently of LVEF and is significantly associated with sudden cardiac death [16,17]. Physiologically, all myocardial segments have, to some extent, similar contraction duration; thus, the values for MD are normally low. Its measurement is a parameter that can be used to predict mortality and ventricular arrhythmias in myocardial infarction, nonischemic cardiomyopathy, HF, and cardiac resynchronization therapy [9,10,16,18,19]. A greater MD was detected in patients with ventricular arrhythmias with ischemic and nonischemic cardiomyopathy than in those that did not present ventricular arrhythmias [20]. Prolonged MD was associated with worse long-term outcomes in patients with STEMI [18].
LV function has been evaluated with 2D-STE measurements in patients with ACS; however, very few data are available in the literature. There are even fewer studies that have investigated GLS and MD measured by 2D-STE in an NSTE-ACS population.
Our group proposed a new index, GLS/MD, to predict cardiac events in patients with previous NSTE-ACS. We aim to examine the relationship between the GLS/MD ratio and cardiac events and the value of GLS/MD worsening during follow-up in an NSTE-ACS patient population after undergoing successful percutaneous coronary intervention (PCI) therapy.
2. Materials and Methods
2.1. Study Population
The Timisoara Institute of Cardiovascular Diseases’ Cardiology Department serves as an invasive center for 15 non-invasive cardiology units. A total of 2773 patients were admitted to the department for PCI from January 2018 to May 2019. All of these patients were registered in a clinical database. In accordance with the 2015 ESC Guidelines for the management of acute coronary syndromes in patients presenting without persistent ST-segment elevation [21], we prospectively examined 402 consecutive NSTE-ACS patients who underwent successful PCI in sinus rhythm while being hospitalized in our clinic. Residual stenosis of less than 20% was considered a successful PCI; non-culprit intervention was carried out concurrently with hospitalization. Patients with inadequate echocardiographic images, prior myocardial infarction, open-chest surgery, cardiac pacemaker/defibrillator, mitral stenosis, severe primary MR, significant annular calcification, renal failure (serum creatinine > 1.3 mg/dL), and non-cardiac illnesses with a life expectancy of less than a year were excluded from the study group. The study population consisted of the remaining 310 patients. The Institute of Cardiovascular Diseases Timisoara’s Institutional Ethics Committee accepted the study, which was carried out in accordance with the Declaration of Helsinki’s principles. All participants gave their informed consent.
2.2. Recorded Clinical Variables
Age, sex, mean arterial pressure, heart rate, body mass index, peak high-sensitivity cardiac troponin I level (hs-cTnI), and N-terminal pro-brain natriuretic peptide (NT-proBNP) levels were clinical characteristics that were noted and incorporated into the predictive model. The main treatment classes that were prescribed were also noted.
For the purposes of this study, the following five cardiovascular risk factors were taken into account: hypertension (systolic blood pressure > 140 mmHg, diastolic blood pressure > 90 mmHg, or in drug treatment), cardiovascular disease heredity, smoking (more than one cigarette per day; cessation of smoking less than 10 years ago was still considered smoking), diabetes mellitus (fasting glycemia > 126 mg/dL or in drug treatment), and hypercholesterolemia (>200 mg/dL or in drug treatment).
2.3. Echocardiography
After PCI, an echocardiogram was performed utilizing a Vivid 9 system (General Electric, Milwaukee, WI) at the time of hospital discharge. According to the most recent recommendations, the left atrial volume (LAV) and the indexing LAV to the body surface area (LAVI) were calculated [22]. A modified version of Simpson’s formula was used to compute LVEF from apical two- and four-chamber images [22]. The mitral regurgitation’s regurgitant orifice area (ROA) and regurgitant volume (RV) were calculated [23]. An axial size 3–5 mm pulsed-sample Doppler volume was positioned between the mitral valve tips, and a four-chamber view was used to record the transmitral flow. Peak (E) and late transmitral flow (A) were assessed during end-expiratory apnoea for five consecutive cardiac cycles, and the findings were averaged [24]. The peak velocity of tricuspid regurgitation was used to determine systolic pulmonary artery pressure (SPAP). The pulsed-wave Doppler mode of the TDI program was selected. A 4–5 mm sample volume was successively placed at the septal and lateral corners of the mitral annulus in the apical four-chamber view [24]. Peak e’ and s’ were measured during end-expiratory apnoea for five consecutive cardiac cycles, and the data were averaged [7]. The average velocities of the septal and lateral sites were used to calculate E/e’.
The apical four-chamber, apical two-chamber, and apical three-chamber views were captured in two dimensions. For each view, three cardiac cycles were recorded. Aortic valve closure was determined from conventional pulsed-wave Doppler signals through the aortic valve. Peak systolic strain was measured across all LV segments, and GLS was calculated by averaging the values from each segment. The MD was calculated as the average time between the peak of the R wave and the peak of the negative strain in various LV segments [25]. Segments with strain curves swinging about the zero line and segments with solely positive strain values, known as akinetic segments and dyskinetic segments, respectively, were excluded [18]. Patients were eliminated from the study if more than three LV segments had insufficient tracking or if six or more segments lacked satisfactory monitoring. Next, the GLS/MD ratio was determined.
Four to six weeks after leaving the hospital, measurements were taken again.
For GLS, MD, and GLS/MD, the inter- and intraobserver variability was investigated. In 35 randomly chosen subjects of the study group, two investigators independently recorded measurements a few minutes apart in the absence of the other investigator. Both observes were blinded to each other’s result.
2.4. Clinical Outcome
The patients were monitored for about 24 months. Cardiac mortality, malignant ventricular arrhythmias, hospital readmission for HF, and reinfarction were the main events. Deaths specifically linked to a cardiac condition, primarily congestive heart failure, reinfarction, or sudden cardiac death, were considered cardiac deaths. The follow-up data were gathered through computerized medical records or by calling the patients or their relatives.
2.5. Statistical Analysis
For continuous variables, data were presented as means plus standard deviation (SD), while for categorical variables, they were presented as proportions. An unpaired t-test (for variables with a normal distribution) or Mann–Whitney U test was used to compare continuous variables between groups (non-normally distributed variables). With the help of the χ2 test and Fischer’s exact test, proportions were compared. Using a two-sample t-test, continuous variables were compared between groups with cardiac events vs. non-cardiac events (variables with normal distribution). Area under the ROC curves (AUC) were compared after receiver operating characteristic (ROC) curves for prediction of cardiac events were established for various parameters. At the time of death, patients who passed away from non-cardiac reasons were censored.
Cox regression models with single and multiple variables were developed to link echocardiographic results to the main outcome. To examine the predictive power of baseline predictors, the data from the univariable Cox regression were incorporated into the multivariable Cox regression. Kaplan–Meier analysis was used to determine the cardiac event-free survival rates, and a log-rank test was used to compare the event rates. A p-value of 0.05 or less was regarded as significant.
Intraclass correlation coefficients were used to quantify the intraobserver variability and interobserver variability for GLS, MD, and GLS/MD. Data were analyzed utilizing SPSS Statistics for Windows (IBM SPSS Statistics for Windows, Version 21.0. Armonk, NY, IBM).
3. Results
This prospective analysis comprised 310 consecutive patients hospitalized for NSTE-ACS from January 2018 to May 2019 who received successful PCI. The institution’s guidance was followed for the routine treatment of all patients. The average age of our study sample was 60.2 ± 11.7 years, and 70.3% of the participants were men (218 patients). No patient was lost to follow-up in this trial. A total of 109 patients (35.16%) experienced cardiac incidents during the follow-up period (34.7 ± 8 months). Cardiovascular mortality occurred in 6 patients (1.93%), and readmission occurred in 103 patients (33.2%) as the first cardiac event. Among our patients, 28 (9%) experienced non-fatal myocardial ischemia, whereas 75 (24.2%) required hospitalization for heart failure. A total of 29 patients (9.35%) experienced cardiac death over the course of the follow-up.
3.1. Patient Characteristics
Table 1 lists the initial characteristics of the patients. Higher NT-proBNP levels, SPAP, E, E/A, E/e’ ratio, GLS, and GLS/MD ratio and greater surface and diameter of the LA, LAV, and LAVI, as well as end-diastolic LV diameter and longer MD, were seen in patients who experienced cardiac events. Their LVEF, A, e’, and s’ velocities were decreased. There was also no difference in the distribution of the following factors: gender, body mass index (BMI), previous coronary artery disease, cardiovascular risk factors (diabetes, smoking, hypertension, heredity, and dyslipidaemia), presence of severe mitral regurgitation (MR), levels of peak high-sensitivity cardiac troponin I, medication (i.e., beta blockers, diuretics, and nitrates), E-deceleration time, mitral regurgitant orifice area, or mitral regurgitant volume. Patients without incidents had a mean GLS/MD at discharge of −0.418 ± 0.2, while those who had an incident had a mean GLS/MD at discharge of −0.239 ± 0.13 (p < 0.001).

Table 1.
Baseline characteristics of the study groups.
3.2. ROC Curves to Predict Cardiac Events
The most accurate echocardiographic parameters for forecasting cardiac events are shown in Figure 1 as ROC curves. The maximum accuracy for the GLS/MD index was determined by the area under the ROC curve (AUC = 0.849, 95%CI = 0.805–0.893, p < 0.001). The baseline E/e’ ratio, MD, and GLS (AUC = 0.794, 95%CI= 0.741–0.847, p < 0.001; AUC = 0.738, 95%CI = 0.684–0.792, p < 0.001; and AUC = 0.652, 95%CI = 0.587–0.717, p < 0.001, respectively) were significant for prediction of composite outcomes. Statistical comparison of the ROC curves shows substantial differences between GLS/MD and MD (p = 0.029) and between GLS/MD and E/’e (p = 0.015). The AUC was lower for every other echocardiographic parameter that was examined. The composite outcome can be predicted using GLS/MD at discharge with an appropriate cut-off value of −0.229 (82% sensitivity and 73% specificity).
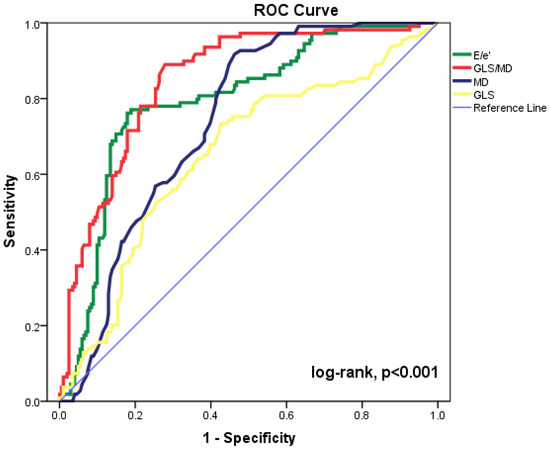
Figure 1.
Receiver operating characteristic (ROC) curves for GLS/MD, E/e’ ratio, MD, and GLS to predict cardiac events in our patient group. CI = confidence interval; E = peak early diastolic transmitral velocity; e’ = peak early diastolic mitral annular velocity; GLS = global longitudinal strain; MD = mechanical dispersion.
3.3. Predictors of Outcome
Table 2 lists the echocardiographic factors (p < 0.05) that predicted cardiac events in a univariate Cox regression analysis: LAV, LAVI, LVEF, SPAP, ROA, E, A, E/A, e’, s’, E/e’, GLS, MD, and GLS/MD. On the other hand, a univariate study revealed no significant associations between cardiac events and E-deceleration time, RV, or TAPSE. Then, to track the occurrence of the cardiac events, LAVI, LV end-diastolic volume index, LVEF, SPAP, ROA, E/A, s’, E/e’, GLS, MD, and GLS/MD were all included in a multivariate analysis. The greatest independent echocardiographic predictor of composite outcome was GLS/MD before discharge (HR = 3.621, 95%CI = 2.167–5.075, p < 0.001).
Table 2.
Echocardiographic variables at hospital discharge associated with composite end points (hospital readmission, ventricular arrythmia, or cardiac death) in Cox univariate and multivariate analysis.
3.4. Worsening of GLS/MD Ratio during Follow-Up
We found that in 100 patients (30.1%), four to six weeks after hospital release, the GLS/MD ratio had worsened. A total of 33 (33%) of these patients had a GLS/MD starting value greater than −0.229. However, as seen in Figure 2, regardless of the GLS/MD value at study inclusion, GLS/MD worsening was associated with lower event-free survival rates (18.2% versus 35.1% in patients with initial GLS/MD > −0.229 and 76.1% vs. 88% in those with GLS/MD ≤ −0.229 at hospital discharge, respectively; log-rank, p < 0.001). The worst prognosis was shown for the composite outcome (Figure 2a) of cardiac mortality (Figure 2b), and ventricular arrhythmia (Figure 2c), which occurred during follow-up in the subgroup of patients with an initial GLS/MD ratio > −0.229 and deteriorating after 4–6 weeks. Regardless of the severity of the condition, the group of patients with baseline GLS/MD > −0.229 showed a greater likelihood of hospital readmission (Figure 2d).
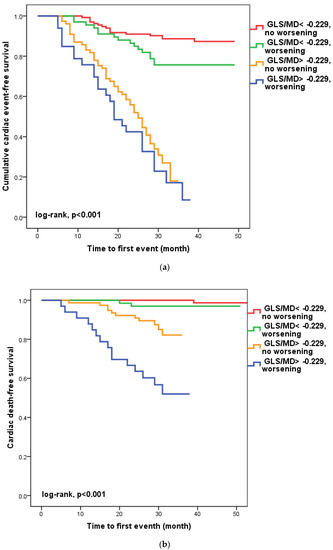
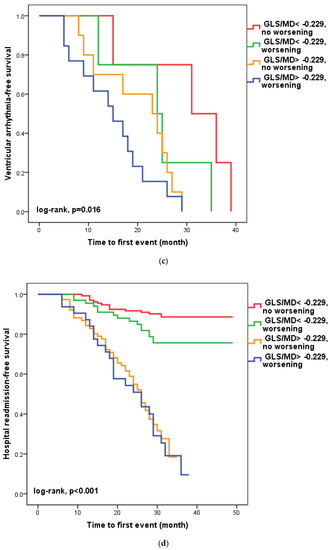
Figure 2.
Kaplan-Meier survival curves of composite outcome (a), cardiac death (b), ventricular arrythmia (c), and hospital readmission (d) according to the initial GLS/MD value below and above −0.229 and worsening after hospital discharge. GLS = global longitudinal strain; MD = mechanical dispersion.
3.5. Reproducibility
The intra- and interobserver agreements were good for GLS/MD, GLS, and MD measurements in 35 patients with ischemic heart disease. For interobserver and intraobserver variability, the intraclass correlation coefficients were 0.92 and 0.89 for GLS/MD, 0.94 and 0.93 for GLS, and 0.92 and 0.90 for MD, respectively.
4. Discussion
To the best of our knowledge, this is the first study to investigate the value of this index to predict cardiac events (cardiac death, ventricular arrhythmia, and rate of hospital readmission) in patients with NSTE-ACS who were successfully treated by PCI. In our work, GLS/MD provided the best independent echocardiographic prediction of composite outcome, showing the highest accuracy. Patients with an initial GLS/MD ratio >−0.229 and worsening after four to six weeks presented the worst prognosis regarding composite outcome, cardiac death, and ventricular arrhythmias. The group of patients with an initial GLS/MD ratio >−0.229 presented a higher occurrence of hospital readmission, irrespective of its worsening. We investigated the prognostic value of a two-dimensional strain index combining a parameter that evaluates the systolic function and is a measure of infarct size, i.e., GLS, and a parameter that can predict ventricular arrhythmias in patients with different cardiac diseases and is a measure of myocardial deformation heterogeneity, i.e., MD [26].
Predicting prognosis in patients with NSTE-ACS is of very high importance. Risk stratification and identification of high-risk NSTE-ACS patients improves the effectiveness of care because these patients benefit from an intensified treatment strategy [3,8,27]. Echocardiography plays a central role in assessing LV function after an ACS and in identifying HF diagnosis and development, as well as for follow-up [20,23].
Our investigation revealed no differences in the distribution of gender, prior cardiovascular disease, or cardiovascular risk factors between the groups with and without cardiac events, in contrast to what is reported in the literature [5]. Myocardial injury and LV filling pressure, which have an effect on LA, are connected to the prognosis of patients with NSTE-ACS. The elements that determine diastolic LV filling have a significant impact on LA size. LA size, LV volume indices, and LVEF have been shown to be reliable predictors for the monitoring of cardiovascular risk and direction of therapy in patients with ACS in prior research using standard echocardiographic imaging [6,20,28,29]. One of the best indicators of survival in ACS patients is an echocardiographic assessment of LV function before hospital discharge [30].
In our study, LAVI, SPAP, and E/A ratio were eliminated as predictors of outcome in univariate analysis on multivariate analysis.
TDI has an incremental prognostic value for routine clinical, laboratory, and imaging information; it is widely used, with proven easy accessibility and good reproducibility. Unlike LV volume and LVEF, pulsed TDI does not require tracing of the endocardial contours. The E/e’ ratio is a good Doppler predictor for evaluation of the LV filling pressure and can be used as a prognostic marker of cardiac outcome after acute coronary syndrome [7,29]. Its prognostic value has also been demonstrated in patients with NSTE-ACS who underwent PCI [9]. The superiority of TDI parameters could be explained by the dependence of the mitral flow on LA pressure, volume status, myocardial relaxation, and age. In patients with myocardial ischemia, e’ and s’ velocities have been observed to be significantly decreased, but cut-off values that could detect significant coronary disease are still not clear [6,10,27]. However, TDI has some technological limitations, such as angle dependence, signal noise, and measurement variability.
Current guidelines recommend repeated echocardiographic examination for patients with an ACS and severe LV systolic dysfunction after six to twelve weeks, using only LVEF to assess LV systolic function [20]. Thus, LVEF can be preserved in the presence of HF, and GLS and MD are not yet recommended when assessing systolic function [22]. However, it has been demonstrated that GLS provides superior prognostic information regarding the risk of HF in patients with ACS compared to other echocardiographic measurements and that it can be used as an accurate marker of LV function [5,31,32,33,34]. GLS is a well-validated marker for measuring LV longitudinal deformation and is superior to LVEF [35,36,37,38,39,40,41,42,43]. GLS has been shown to be a more sensitive and earlier marker of cardiac disfunction than conventional echocardiography, detecting subclinical abnormalities of both systolic and diastolic function [5,11,44]. GLS significantly correlates with global infarction size and is superior to LVEF in identifying small and medium-sized infarcts [45].
Moreover, in STEMI patients, MD was shown to have a relationship with systolic and diastolic function (GLS and E/e’), infarct size, and electrical dispersion (QRS duration), all of which are strong independent predictors of outcome in HF [46,47,48,49,50]. In addition, MD was shown to be a strong independent predictor of arrhythmic events, and GLS provides information for the risk stratification [16]. It has been shown that that 2D-STE strain can be superior to LVEF in assessing myocardial function after an ACS [5] and that GLS can be a measurement for risk stratification in patients with relatively preserved EF [51].
We re-evaluated GLS, MD, and the GLS/MD ratio after four to six weeks, and our result showed that a GLS/MD ratio > −0.229 before hospital discharge and its worsening in the next weeks is a strong independent predictor of an increased risk of future cardiac events (cardiac death and ventricular arrhythmias) and hospital readmission.
However, our investigation is subject to a number of limitations. Its small sample size is the most significant. Larger investigations are therefore required to confirm our findings.
5. Conclusions
In conclusion, our findings support the fact that 2D-STE could be used in patients with NSTE-ACS who have undergone successful PCI. The GLS/MD ratio can be an important independent prognosis factor of cardiac events (cardiac death, malignant ventricular arrhythmia, or hospital readmission for HF and/or reinfarction). Patients with an initial GLS/MD > −0.229 that worsened after a four- to six-week presented the worst prognosis regarding composite outcome, hospitalization, and ventricular arrhythmias. Moreover, patients with an initial GLS/MD ratio > −0.229 presented a higher occurrence of hospital readmission, irrespective of its worsening. This result may have important implications in stratifying risk in patients with NSTE-ACS.
Author Contributions
Conceptualization, C.M.; methodology, C.M. and M.-A.L.; validation, R.Ș. and C.V.; formal analysis, C.M. and M.S.; data curation, I.I. and M.S.; writing—original draft preparation, I.I.; writing—review and editing, C.M. and C.-T.L.; visualization, R.Ș.; supervision, C.V. All authors have read and agreed to the published version of the manuscript.
Funding
This research received no external funding.
Institutional Review Board Statement
This study was conducted according to the guidelines of the Declaration of Helsinki and approved by the Institutional Ethics Committee of Institute of Cardiovascular Diseases Timisoara (protocol code 1658, 28 March 2014).
Informed Consent Statement
Informed consent was obtained from all subjects involved in the study.
Data Availability Statement
The datasets used and analyzed during the current study are available from the corresponding author upon reasonable request.
Conflicts of Interest
The authors declare no conflict of interest. The funders had no role in the design of the study; in the collection, analyses, or interpretation of data; in the writing of the manuscript; or in the decision to publish the results.
References
- Turpie, A.G. Burden of disease: Medical and economic impact of acute coronary syndromes. Am. J. Manag. Care 2006, 12, S430–S434. [Google Scholar] [PubMed]
- Yeh, R.W.; Sidney, S.; Chandra, M.; Sorel, M.; Selby, J.V.; Go, A.S. Population trends in the incidence and outcomes of acute myocardial infarction. N. Engl. J. Med. 2020, 362, 2155–2165. [Google Scholar] [CrossRef] [PubMed]
- Gc, V.S.; Alshurafa, M.; Sturgess, D.J.; Ting, J.; Gregory, K.; Gonçalves, A.S.O.; Whitty, J.A. Cost-minimisation analysis alongside a pilot study of early Tissue Doppler Evaluation of Diastolic Dysfunction in Emergency Department Non-ST Elevation Acute Coronary Syndromes (TEDDy-NSTEACS). BMJ Open 2019, 9, e023920. [Google Scholar] [CrossRef] [PubMed]
- Zannad, F.; Alla, F.; Dousset, B.; Perez, A.; Pitt, B. Limitation of excessive extracellular matrix turnover may contribute to survival benefit of spironolactone therapy in patients with congestive heart failure: Insights from the randomized aldactone evaluation study (RALES). Rales Investigators. Circulation 2000, 102, 2700–2706. [Google Scholar] [CrossRef]
- Skaarup, K.G.; Iversen, A.; Jørgensen, P.G.; Olsen, F.J.; Grove, G.L.; Jensen, J.S.; Biering-Sørensen, T. Association between layer-specific global longitudinal strain and adverse outcomes following acute coronary syndrome. Eur. Heart J. Cardiovasc. Imaging 2018, 19, 1334–1342. [Google Scholar] [CrossRef]
- D’Andrea, A.; Cocchia, R.; Caso, P.; Riegler, L.; Scarafile, R.; Salerno, G.; Golia, E.; Di Salvo, G.; Calabrò, P.; Bigazzi, M.C.; et al. Global longitudinal speckle-tracking strain is predictive of left ventricular remodeling after coronary angioplasty in patients with recent non-ST elevation myocardial infarction. Int. J. Cardiol. 2011, 153, 185–191. [Google Scholar] [CrossRef]
- Nagueh, S.F.; Appleton, C.P.; Gillebert, T.C.; Marino, P.N.; Oh, J.K.; Smiseth, O.A.; Waggoner, A.D.; Flachskampf, F.A.; Pellikka, P.A.; Evangelisa, A. Recommendations for the evaluation of left ventricular diastolic function by echocardiography. Eur. J. Echocardiogr. 2009, 10, 165–193. [Google Scholar] [CrossRef]
- Mornos, C.; Petrescu, L.; Ionac, A.; Cozma, D. The prognostic value of a new tissue Doppler parameter in patients with heart failure. Int. J. Cardiovasc. Imaging 2014, 30, 47–55. [Google Scholar] [CrossRef]
- Lin, A.K.; Sippel, C.; Guppy-Coles, J.; Hammett, C.; Thomas, L.; Atherton, J.J.; Brasad, B.P. Abstract 11330: E/e’ is a Powerful Predictor of Survival After a First-Ever Non-ST Elevation Myocardial Infarction. Circulation 2016, 134 (Suppl. S1), A11330. [Google Scholar]
- Biering-Sørensen, T.; Jensen, J.S.; Pedersen, S.; Galatius, S.; Hoffmann, S.; Jensen, M.T.; Mogelvang, R. Doppler tissue imaging is an independent predictor of outcome in patients with ST-segment elevation myocardial infarction treated with primary percutaneous coronary intervention. J. Am. Soc. Echocardiogr. 2014, 27, 258–267. [Google Scholar] [CrossRef]
- Biering-Sørensen, T.; Biering-Sørensen, S.R.; Olsen, F.J.; Sengeløv, M.; Jørgensen, P.G.; Mogelvang, R.; Amil, M.; Shah, A.M.; Jensen, J.S. Global longitudinal strain by echocardiography predicts long-term risk of cardiovascular morbidity and mortality in a low-risk general population: The Copenhagen City Heart Study. Circ. Cardiovasc. Imaging 2017, 10, e005521. [Google Scholar] [CrossRef] [PubMed]
- Langeland, S.; D’hooge, J.; Wouters, P.F.; Leather, H.A.; Claus, P.; Bijnens, B.; Sutherland, G.R. Experimental validation of a new ultrasound method for the simultaneous assessment of radial and longitudinal myocardial deformation independent of insonation angle. Circulation 2005, 112, 2157–2162. [Google Scholar] [CrossRef] [PubMed]
- Radwan, H.I.; Hussein, E.M.; Shaker, A. Transmural Extent in Relation to Clinical Scoring in Non-ST Elevation Myocardial Infarction Patients: Speckle-Tracking Echocardiographic Study. J. Cardiovasc. Echogr. 2019, 29, 156–164. [Google Scholar] [CrossRef] [PubMed]
- Dandel, M.; Lehmkuhl, H.; Knosalla, C.; Suramelashvili, N.; Hetzer, R. Strain and strain rate imaging by echocardiography—Basic concepts and clinical applicability. Curr. Cardiol. Rev. 2009, 5, 133–148. [Google Scholar] [CrossRef] [PubMed]
- Golukhova, E.Z.; Bulaeva, N.I.; Mrikaev, D.V.; Alexandrova, S.A.; Berdibekov, B.S. Prognostic value of left ventricular global longitudinal strain and mechanical dispersion by speckle tracking echocardiography in patients with ischemic and nonischemic cardiomyopathy: A systematic review and meta-analysis. Russ. J. Cardiol. 2022, 27, 5034. (In Russian) [Google Scholar] [CrossRef]
- Haugaa, K.H.; Smedsrud, M.K.; Steen, T.; Kongsgaard, E.; Loennechen, J.P.; Skjaerpe, T.; Voigt, J.U.; Willems, R.; Smith, G.; Smiseth, O.A.; et al. Mechanical Dispersion Assessed by Myocardial Strain in Patients After Myocardial Infarction for Risk Prediction of Ventricular Arrhythmia. JACC Cardiovasc. Imaging 2010, 3, 247–256. [Google Scholar] [CrossRef]
- Perry, R.; Patil, S.; Marx, C.; Horsfall, M.; Chew, D.P.; Sree Raman, K.; Daril, N.D.M.; Tiver, K.; Joseph, M.X.; Ganesan, A.N.; et al. Advanced Echocardiographic Imaging for Prediction of SCD in Moderate and Severe LV Systolic Function. JACC Cardiovasc. Imaging 2020, 13, 604–612. [Google Scholar] [CrossRef]
- Haugaa, K.H.; Grenne, B.L.; Eek, C.H.; Ersbølll, M.; Valeur, N.; Svendsen, J.H.; Florian, A.; Sjøli, B.; Brunvand, H.; Køber, L.; et al. Strain echocardiography improves risk prediction of ventricular arrhythmias after myocardial infarction. JACC Cardiovasc. Imaging 2013, 6, 841–850. [Google Scholar] [CrossRef]
- Hasselberg, N.E.; Haugaa, K.H.; Bernard, A.; Ribe, M.P.; Kongsgaard, E.; Donal, E.; Edvardsen, T. Left ventricular markers of mortality and ventricular arrhythmias in heart failure patients with cardiac resynchronization therapy. Eur. Heart J. Cardiovasc. Imaging 2016, 17, 343–350. [Google Scholar] [CrossRef]
- Ibanez, B.; James, S.; Agewall, S.; Antunes, M.J.; Bucciarelli-Ducci, C.; Bueno, H.; Caforio, A.L.P.; Crea, F.; Goudevenos, J.A.; Halvorsen, S.; et al. 2017 ESC Guidelines for the management of acute myocardial infarction in patients presenting with ST-segment elevation: The Task Force for the management of acute myocardial infarction in patients presenting with ST-segment elevation of the European Society of Cardiology (ESC). Eur. Heart J. 2017, 39, 119–177. [Google Scholar]
- Roffi, M.; Patrono, C.; Collet, J.P.; Mueller, C.; Valgimigli, M.; Andreotti, F.; Bax, J.J.; Borger, M.A.; Brotons, C.; ESC Scientific Document Group; et al. 2015 ESC Guidelines for the management of acute coronary syndromes in patients presenting without persistent ST-segment elevation: Task Force for the Management of Acute Coronary Syndromes in Patients Presenting without Persistent ST-Segment Elevation of the European Society of Cardiology (ESC). Eur. Heart J. 2016, 37, 267–315. [Google Scholar] [CrossRef] [PubMed]
- Lang, R.M.; Badano, L.P.; Mor-Avi, V.; Afilalo, J.; Armstrong, A.; Ernande, L.; Flachskampf, F.A.; Foster, E.; Goldstein, S.A.; Kuznetsova, T.; et al. Recommendations for cardiac chamber quantification by echocardiography in adults: An update from the American Society of Echocardiography and the European Association of Cardiovascular Imaging. Eur. Heart J. Cardiovasc. Imaging 2015, 16, 233–270. [Google Scholar] [CrossRef] [PubMed]
- Lancellotti, P.; Tribouilloy, C.; Hagendorff, A.; Popescu, B.A.; Edvardsen, T.; Pierard, L.A.; Badano, L.; Zamorano, J.L.; Scientific Document Committee of the European Association of Cardiovascular Imaging. Recommendations for the echocardiographic assessment of native valvular regurgitation: An executive summary from the European Association of Cardiovascular Imaging. Eur. Heart J. Cardiovasc. Imaging 2013, 14, 611–644. [Google Scholar] [CrossRef] [PubMed]
- Reisner, S.A.; Lysyansky, P.; Agmon, Y.; Mutlak, D.; Lessick, J.; Friedman, Z. Global longitudinal strain: A novel index of left ventricular systolic function. J. Am. Soc. Echocardiogr. 2004, 17, 630–633. [Google Scholar] [CrossRef]
- Haugaa, K.H.; Amlie, J.P.; Berge, K.E.; Leren, T.P.; Smiseth, O.A.; Edvardsen, T. Transmural differences in myocardial contraction in long-QT syndrome: Mechanical consequences of ion channel dysfunction. Circulation 2010, 122, 1355–1363. [Google Scholar] [CrossRef]
- Kawakami, H.; Nerlekar, N.; Haugaa, K.H.; Edvardsen, T.; Marwick, T.H. Prediction of Ventricular Arrhythmias With Left Ventricular Mechanical Dispersion: A Systematic Review and Meta-Analysis. JACC Cardiovasc. Imaging 2020, 13, 562–572. [Google Scholar] [CrossRef]
- Westholm, C.; Johnson, J.; Sahlen, A.; Winter, R.; Jernberg, T. Peak systolic velocity using color-coded tissue Doppler imaging, a strong and independent predictor of outcome in acute coronary syndrome patients. Cardiovasc. Ultrasound. 2013, 11, 9. [Google Scholar] [CrossRef]
- Matsuura, H.; Yamada, A.; Sugimoto, K.; Iwase, M.; Ishikawa, T.; Ishii, J.; Ozaki, Y. Clinical implication of LAVI over A’ ratio in patients with acute coronary syndrome. Heart Asia 2018, 10, e011038. [Google Scholar] [CrossRef]
- Moller, J.E.; Hillis, G.S.; Oh, J.K.; Seward, J.B.; Reeder, G.S.; Wright, R.S.; Park, S.W.; Bailey, K.R.; Pellikka, P.A. Left atrial volume: A powerful predictor of survival after acute myocardial infarction. Circulation 2003, 107, 2207–2212. [Google Scholar] [CrossRef]
- Brezinov, O.P.; Klempfner, R.; Zekry, S.B.; Goldenberg, I.; Kuperstein, R. Prognostic value of ejection fraction in patients admitted with acute coronary syndrome: A real world study. Medicine 2017, 96, e6226. [Google Scholar] [CrossRef]
- Gjesdal, O.; Helle-Valle, T.; Hopp, E.; Lunde, K.; Vartdal, T.; Aakhus, S.; Smith, H.J.R.; Ihlen, H.; Edvardsen, T. Noninvasive separation of large, medium, and small myocardial infarcts in survivors of reperfused ST-elevation myocardial infarction: A comprehensive tissue Doppler and speckle-tracking echocardiography study. Circ. Cardiovasc. Imaging 2008, 1, 189–196. [Google Scholar] [CrossRef] [PubMed]
- Sjoli, B.; Grenne, B.; Smiseth, O.A.; Edvardsen, T.; Brunvand, H. The advantage of global strain compared to left ventricular ejection fraction to predict outcome after acute myocardial infarction. Echocardiography 2011, 28, 556–563. [Google Scholar] [CrossRef] [PubMed]
- Delgado, V.; Mollema, S.A.; Ypenburg, C.; Tops, L.F.; van der Wall, E.E.; Schalij, M.J.; Bax, J.J. Relation between global left ventricular longitudinal strain assessed with novel automated function imaging and biplane left ventricular ejection fraction in patients with coronary artery disease. J. Am. Soc. Echocardiogr. 2008, 21, 1244–1250. [Google Scholar] [CrossRef] [PubMed]
- Belghitia, H.; Brette, S.; Lafitte, S.; Reant, P.; Picard, F.; Serri, K.; Lafitte, M.; Courregelongue, M.; Dos, S.P.; Douard, H.; et al. Automated function imaging: A new operator-independent strain method for assessing left ventricular function. Arch. Cardiovasc. Dis. 2008, 101, 163–169. [Google Scholar] [CrossRef]
- Cho, G.-Y.; Marwick, T.H.; Kim, H.-S.; Kim, M.-K.; Hong, K.-S.; Oh, D.-J. Global 2-dimensional strain as a new prognosticator in patients with heart failure. J. Am. Coll. Cardiol. 2009, 54, 618–624. [Google Scholar] [CrossRef]
- Ersbøll, M.; Valeur, N.; Mogensen, U.M.; Andersen, M.J.; Mller, J.E.; Velazquez, E.J.; Hassager, C.; Søgaard, P.; Køber, L. Prediction of all-cause mortality and heart failure admissions from global left ventricular longitudinal strain in patients with acute myocardial infarction and preserved left ventricular ejection fraction. J. Am. Coll. Cardiol. 2013, 61, 2365–2373. [Google Scholar] [CrossRef]
- Haugaa, K.H.; Goebel, B.; Dahlslett, T.; Meyer, K.; Jung, C.; Lauten, A.; Figulla, H.R.; Poerner, T.C.; Edvardsen, T. Risk assessment of ventricular arrhythmias in patients with nonischemic dilated cardiomyopathy by strain echocardiography. J. Am. Soc. Echocardiogr. 2012, 25, 667–673. [Google Scholar] [CrossRef]
- Iacoviello, M.; Puzzovivo, A.; Guida, P.; Forleo, C.; Monitillo, F.; Catanzaro, R.; Lattarulo, M.S.; Antoncecchi, V.; Favale, S. Independent role of left ventricular global longitudinal strain in predicting prognosis of chronic heart failure patients. Echocardiography 2013, 30, 803–811. [Google Scholar] [CrossRef]
- Kalam, K.; Otahal, P.; Marwick, T.H. Prognostic implications of global LV dysfunction: A systematic review and meta-analysis of global longitudinal strain and ejection fraction. Heart 2014, 100, 1673–1680. [Google Scholar] [CrossRef]
- Mignot, A.; Donal, E.; Zaroui, A.; Reant, P.; Salem, A.; Hamon, C.; Monzy, S.; Roudaut, R.; Habib, G.; Lafitte, S. Global longitudinal strain as a major predictor of cardiac events in patients with depressed left ventricular function: A multicenter study. J. Am. Soc. Echocardiogr. 2010, 23, 1019–1024. [Google Scholar] [CrossRef]
- Russo, C.; Jin, Z.; Elkind, M.S.; Rundek, T.; Homma, S.; Sacco, R.L.; Di Tullio, M.R. Prevalence and prognostic value of subclinical left ventricular systolic dysfunction by global longitudinal strain in a community based cohort. Eur. J. Heart Fail. 2014, 16, 1301–1309. [Google Scholar] [CrossRef] [PubMed]
- Smiseth, O.A.; Torp, H.; Opdahl, A.; Haugaa, K.H.; Urheim, S. Myocardial strain imaging: How useful is it in clinical decision making? Eur. Heart J. 2016, 37, 1196–1207. [Google Scholar] [CrossRef] [PubMed]
- Stanton, T.; Leano, R.; Marwick, T.H. Prediction of all-cause mortality from global longitudinal speckle strain: Comparison with ejection fraction and wall motion scoring. Circ. Cardiovasc. Imaging 2009, 2, 356–364. [Google Scholar] [CrossRef] [PubMed]
- Silbiger, J.J. Pathophysiology and Echocardiographic Diagnosis of Left Ventricular Diastolic Dysfunction. J. Am. Soc. Echocardiogr. 2019, 32, 216–232.e2. [Google Scholar] [CrossRef] [PubMed]
- Gjesdal, O.; Vartdal, T.; Hopp, E.; Lunde, K.; Brunvand, H.; Smith, H.J.; Edvardsen, T. Left ventricle longitudinal deformation assessment by mitral annulus displacement or global longitudinal strain in chronic ischemic heart disease: Are they interchangeable? J. Am. Soc. Echocardiogr. 2009, 22, 823–830. [Google Scholar] [CrossRef]
- Iwahashi, N.; Kirigaya, J.; Gohbara, M.; Abe, T.; Horii, M.; Hanajima, Y.; Toya, N.; Takahashi, H.; Kirigaya, H.; Minamimoto, Y.; et al. Mechanical dispersion combined with global longitudinal strain estimated by three dimensional speckle tracking in patients with ST elevation myocardial infarction. Int. J. Cardiol. Heart Vasc. 2022, 40, 101028. [Google Scholar] [CrossRef] [PubMed]
- Joseph, J.; Claggett, B.C.; Anand, I.S.; Fleg, J.L.; Huynh, T.; Desai, A.S.; Solomon, S.D.; O’Meara, E.; Mckinlay, S.; Pitt, B.; et al. QRS Duration Is a Predictor of Adverse Outcomes in Heart Failure With Preserved Ejection Fraction. JACC Heart Fail. 2016, 4, 477–486. [Google Scholar] [CrossRef]
- Shah, A.M.; Shah, S.J.; Anand, I.S.; Sweitzer, N.K.; O’Meara, E.; Heitner, J.F.; Sopko, G.; Li, G.; Assmann, S.F.; McKinlay, S.M.; et al. Cardiac structure and function in heart failure with preserved ejection fraction: Baseline findings from the echocardiographic study of the Treatment of Preserved Cardiac Function Heart Failure with an Aldosterone Antagonist trial. Circ. Heart Fail. 2014, 7, 104–115. [Google Scholar] [CrossRef]
- Shah, A.M.; Claggett, B.; Sweitzer, N.K.; Shah, S.J.; Anand, I.S.; Liu, L.i.; Pitt, B.; Pfeffer, M.A.; Solomon, S.D. Prognostic Importance of Impaired Systolic Function in Heart Failure With Preserved Ejection Fraction and the Impact of Spironolactone. Circulation 2015, 132, 402–414. [Google Scholar] [CrossRef]
- Donal, E.; Lund, L.H.; Oger, E.; Hage, C.; Persson, H.; Reynaud, A.; Ennezat, P.-V.; Bauer, F.; Drouet, E.; Linde, C.; et al. New echocardiographic predictors of clinical outcome in patients presenting with heart failure and a preserved left ventricular ejection fraction: A subanalysis of the Ka (Karolinska) Ren (Rennes) Study. Eur. J. Heart Fail. 2015, 17, 680–688. [Google Scholar] [CrossRef]
- Ersbøll, M.; Valeur, N.; Andersen, M.J.; Mogensen, U.M.; Vinther, M.; Svendsen, J.H.; Møller, J.E.; Kisslo, J.; Velazquez, E.J.; Hassager, C.; et al. Early Echocardiographic Deformation Analysis for the Prediction of Sudden Cardiac Death and Life-Threatening Arrhythmias After Myocardial Infarction. JACC Cardiovasc. Imaging 2013, 6, 851–860. [Google Scholar] [CrossRef]


Disclaimer/Publisher’s Note: The statements, opinions and data contained in all publications are solely those of the individual author(s) and contributor(s) and not of MDPI and/or the editor(s). MDPI and/or the editor(s) disclaim responsibility for any injury to people or property resulting from any ideas, methods, instructions or products referred to in the content. |
© 2023 by the authors. Licensee MDPI, Basel, Switzerland. This article is an open access article distributed under the terms and conditions of the Creative Commons Attribution (CC BY) license (https://creativecommons.org/licenses/by/4.0/).