

Methods of Visualizing the Results of an Artificial-Intelligence-Based Computer-Aided Detection System for Chest Radiographs: Effect on the Diagnostic Performance of Radiologists
 , , , , ,
Abstract
:1. Introduction
2. Materials and Methods
2.1. Patients
2.2. Chest Radiographs
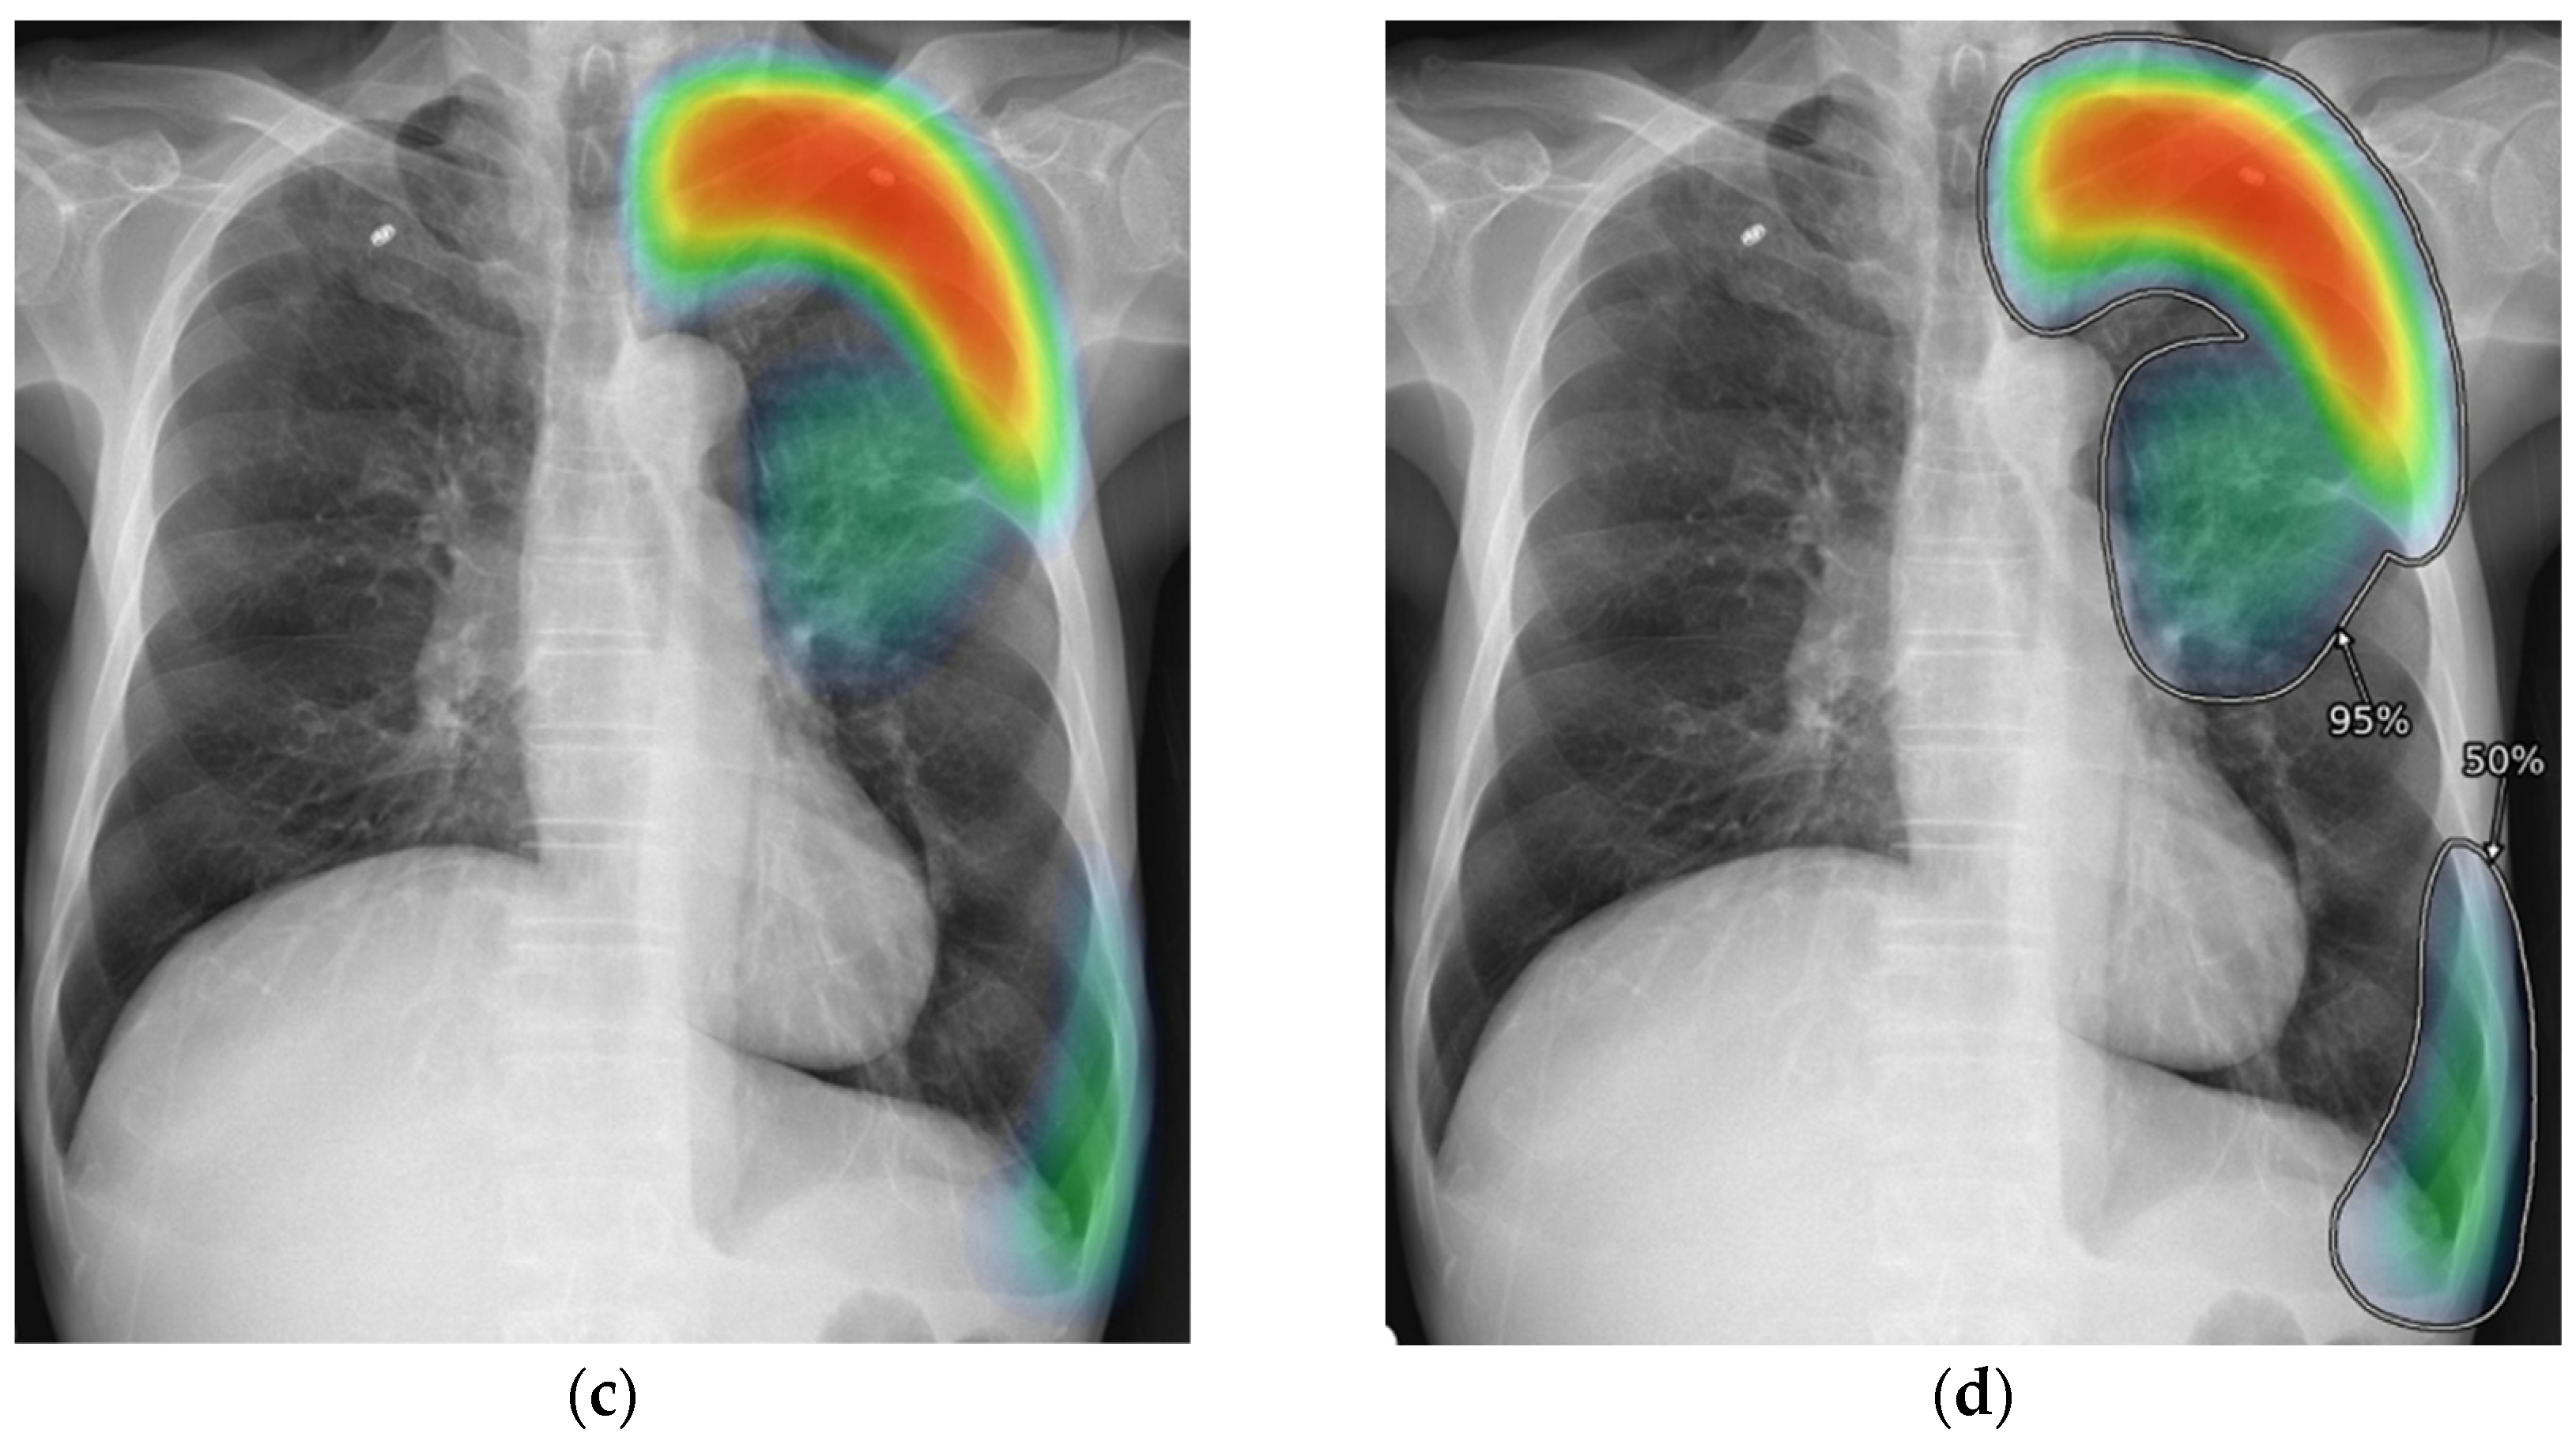
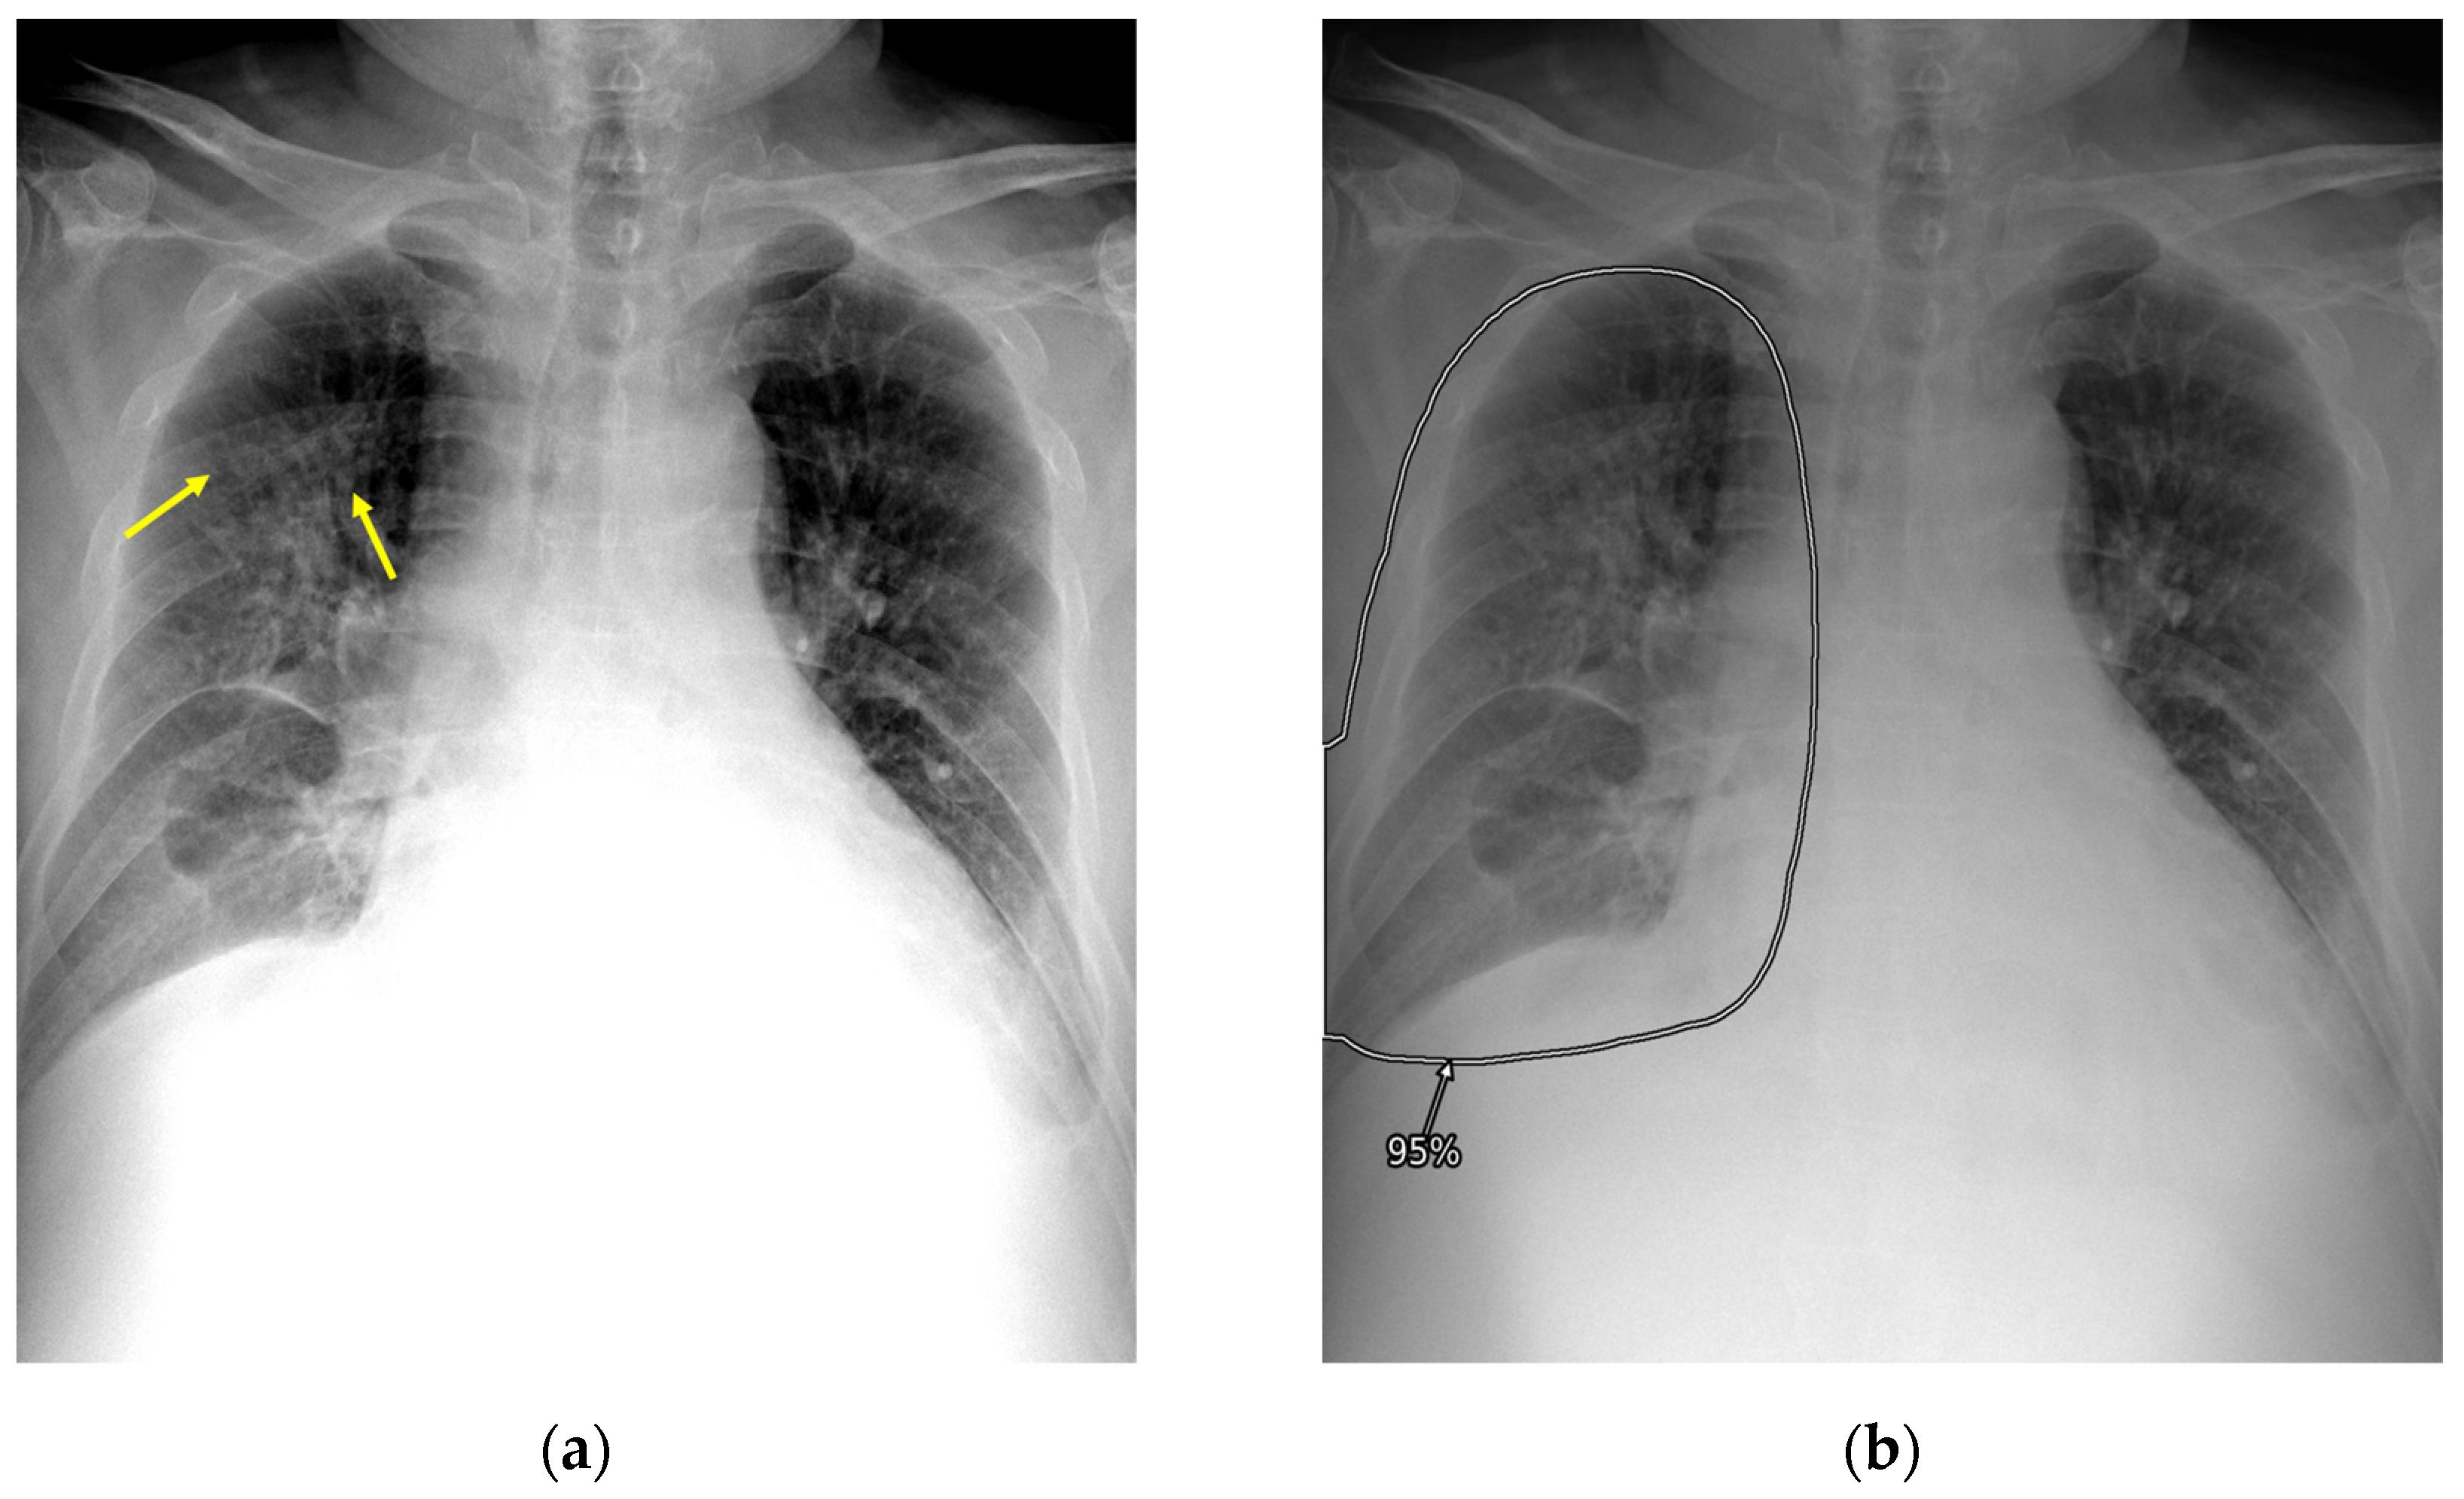
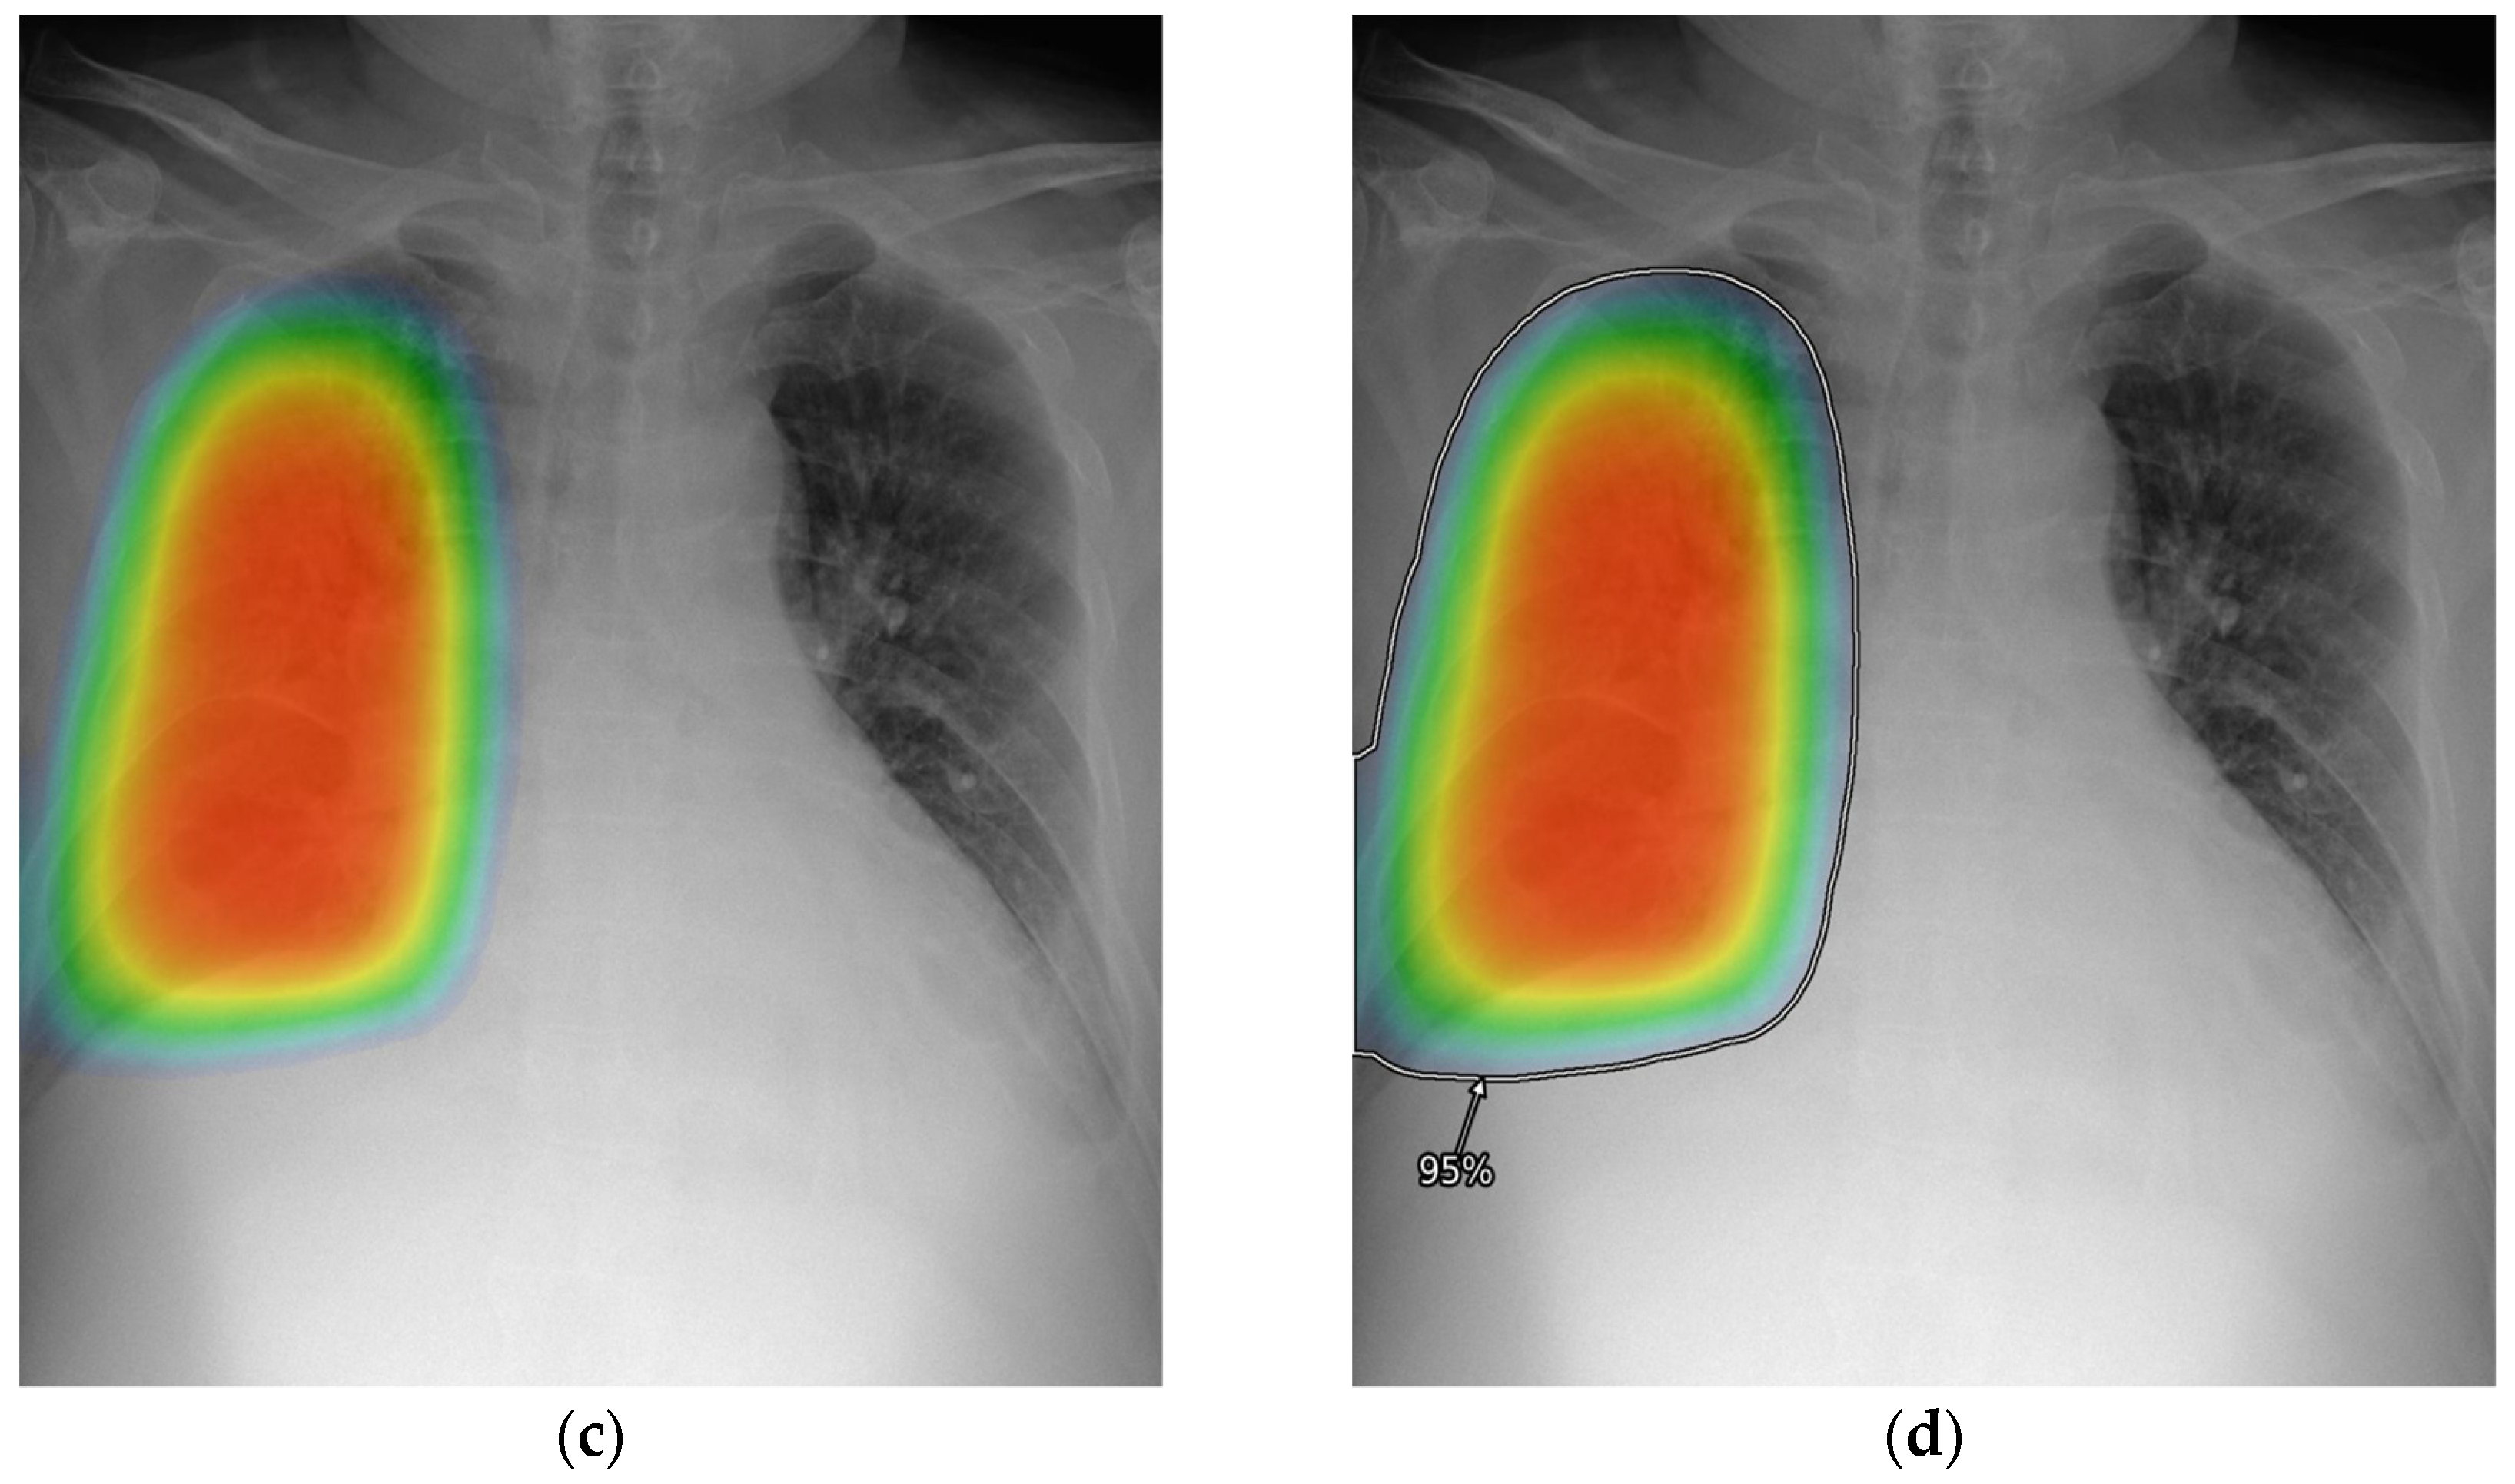
2.3. AI-CAD
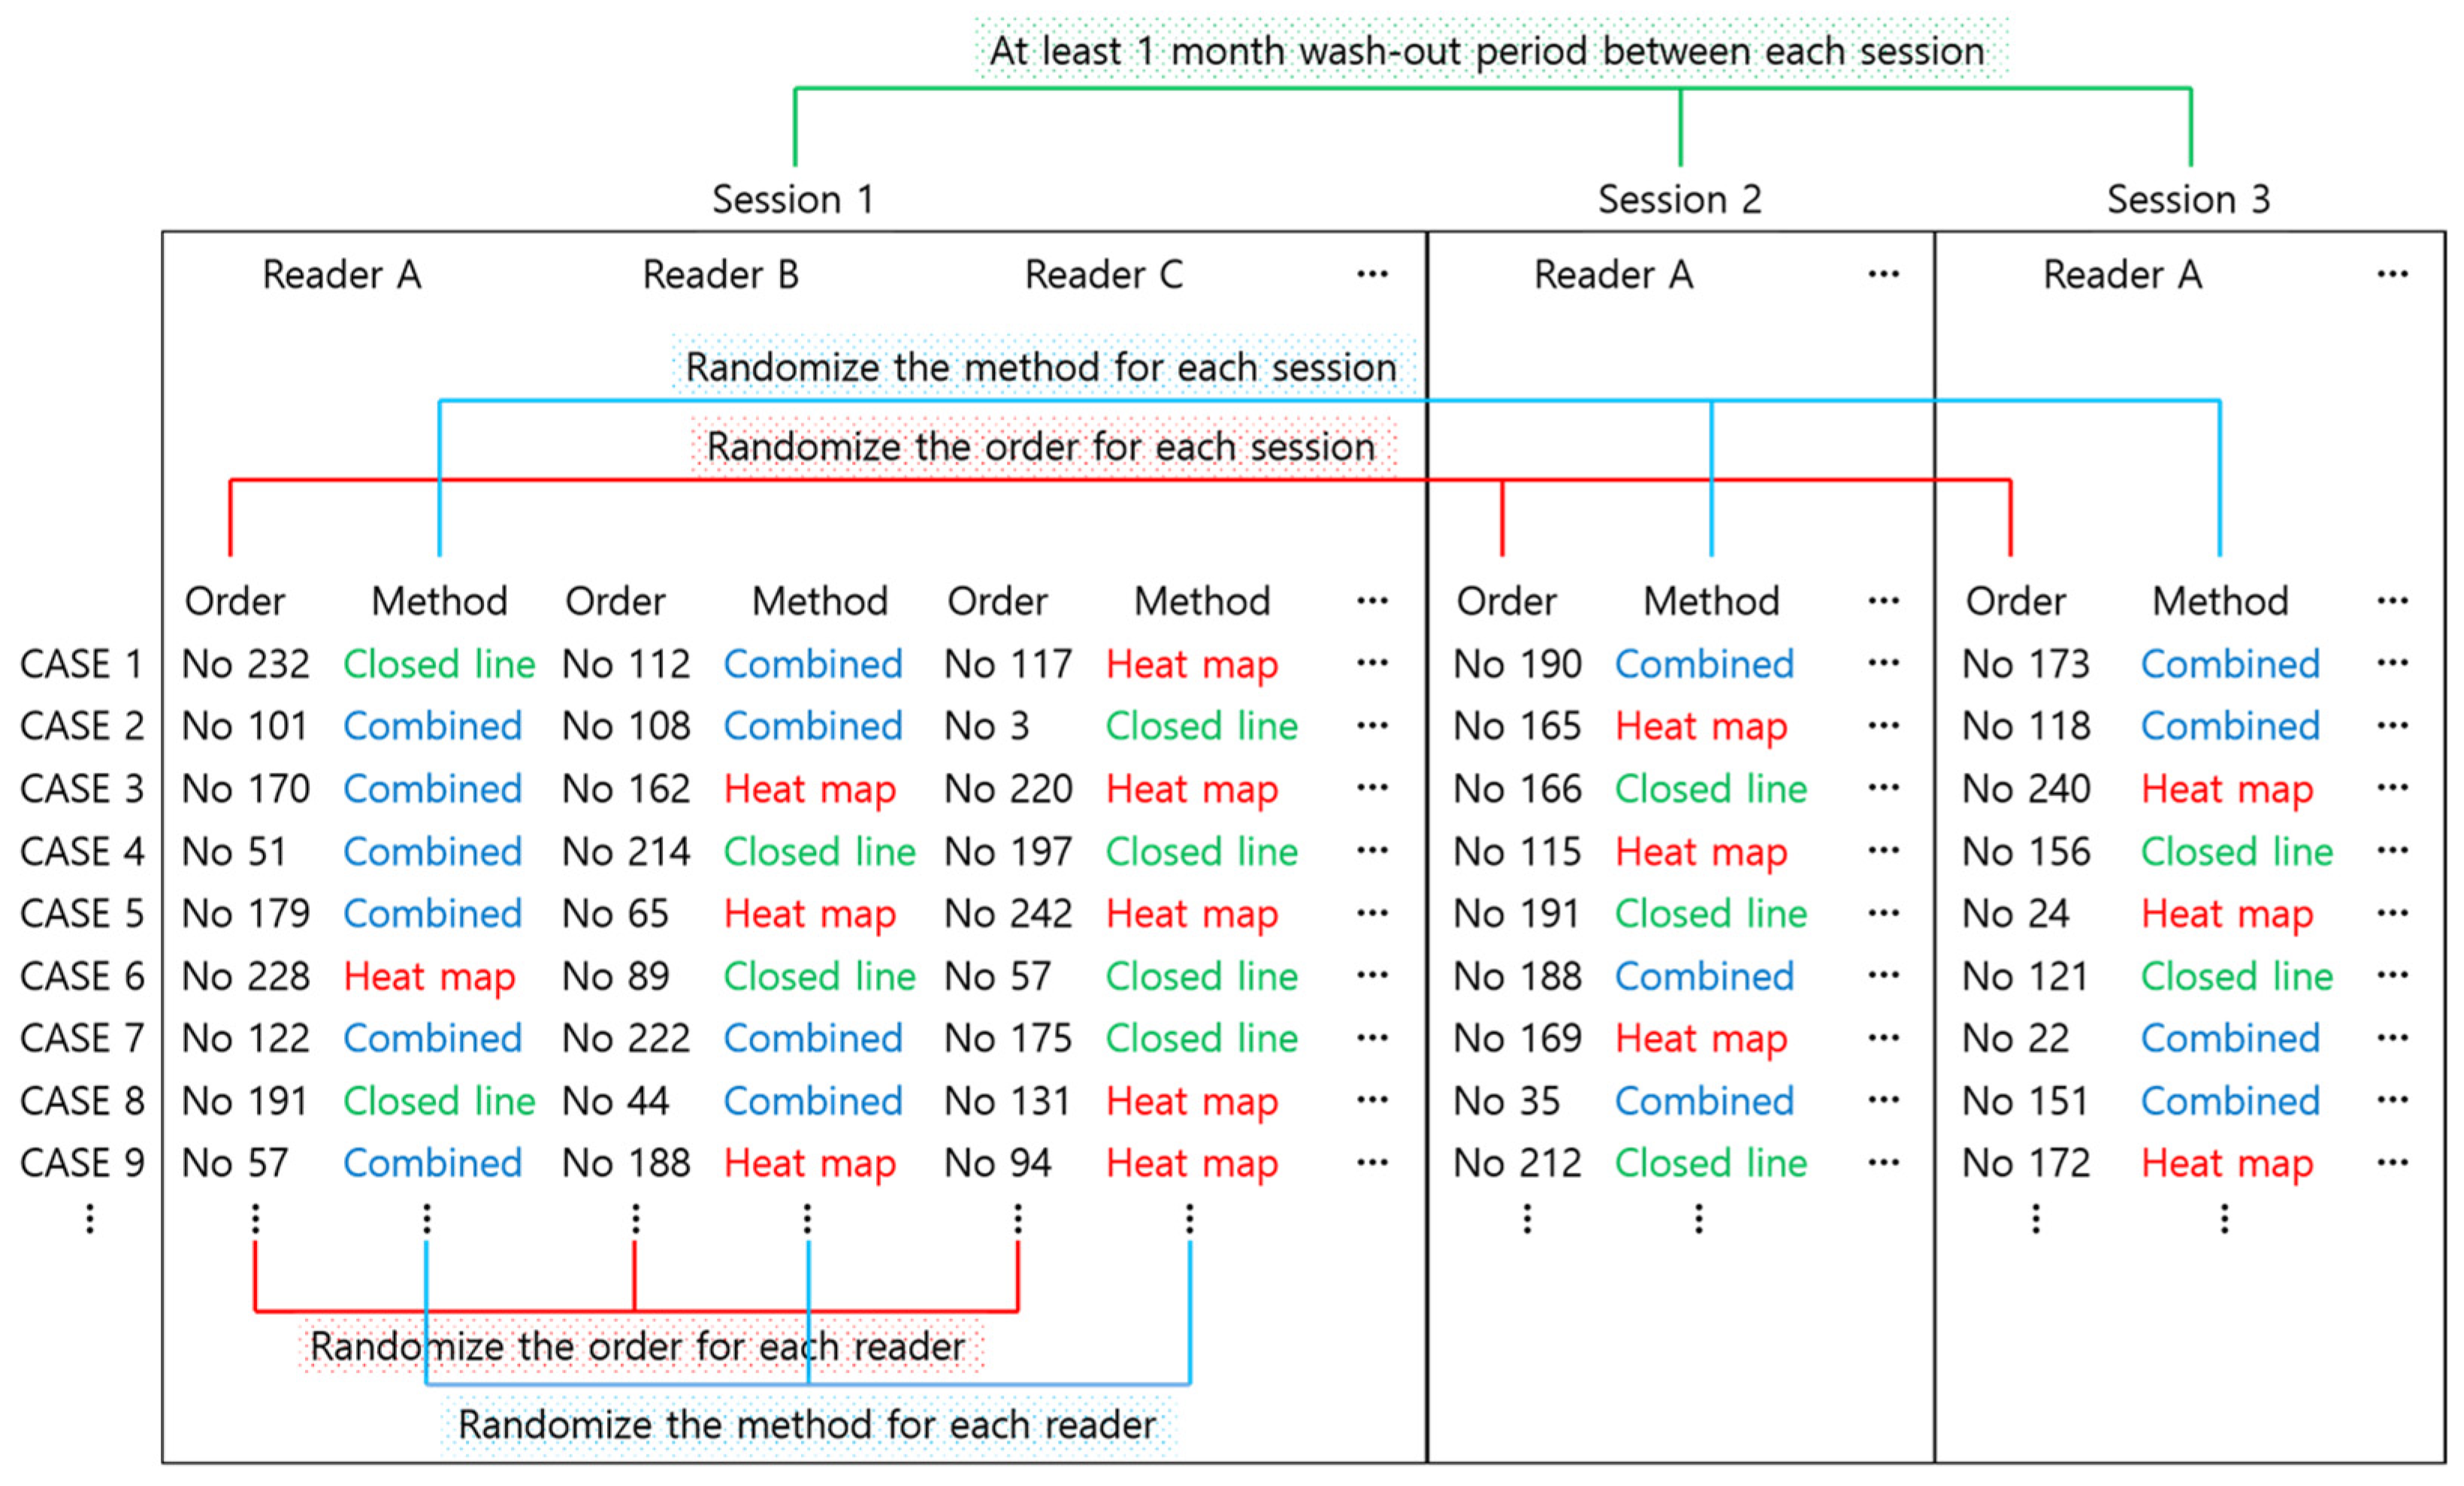
2.4. Reader Test
2.5. Reference Standard and Performance Metrics
2.6. Preference Survey
2.7. Statistical Analysis
3. Results
3.1. Patient Demographics and Clinical Characteristics
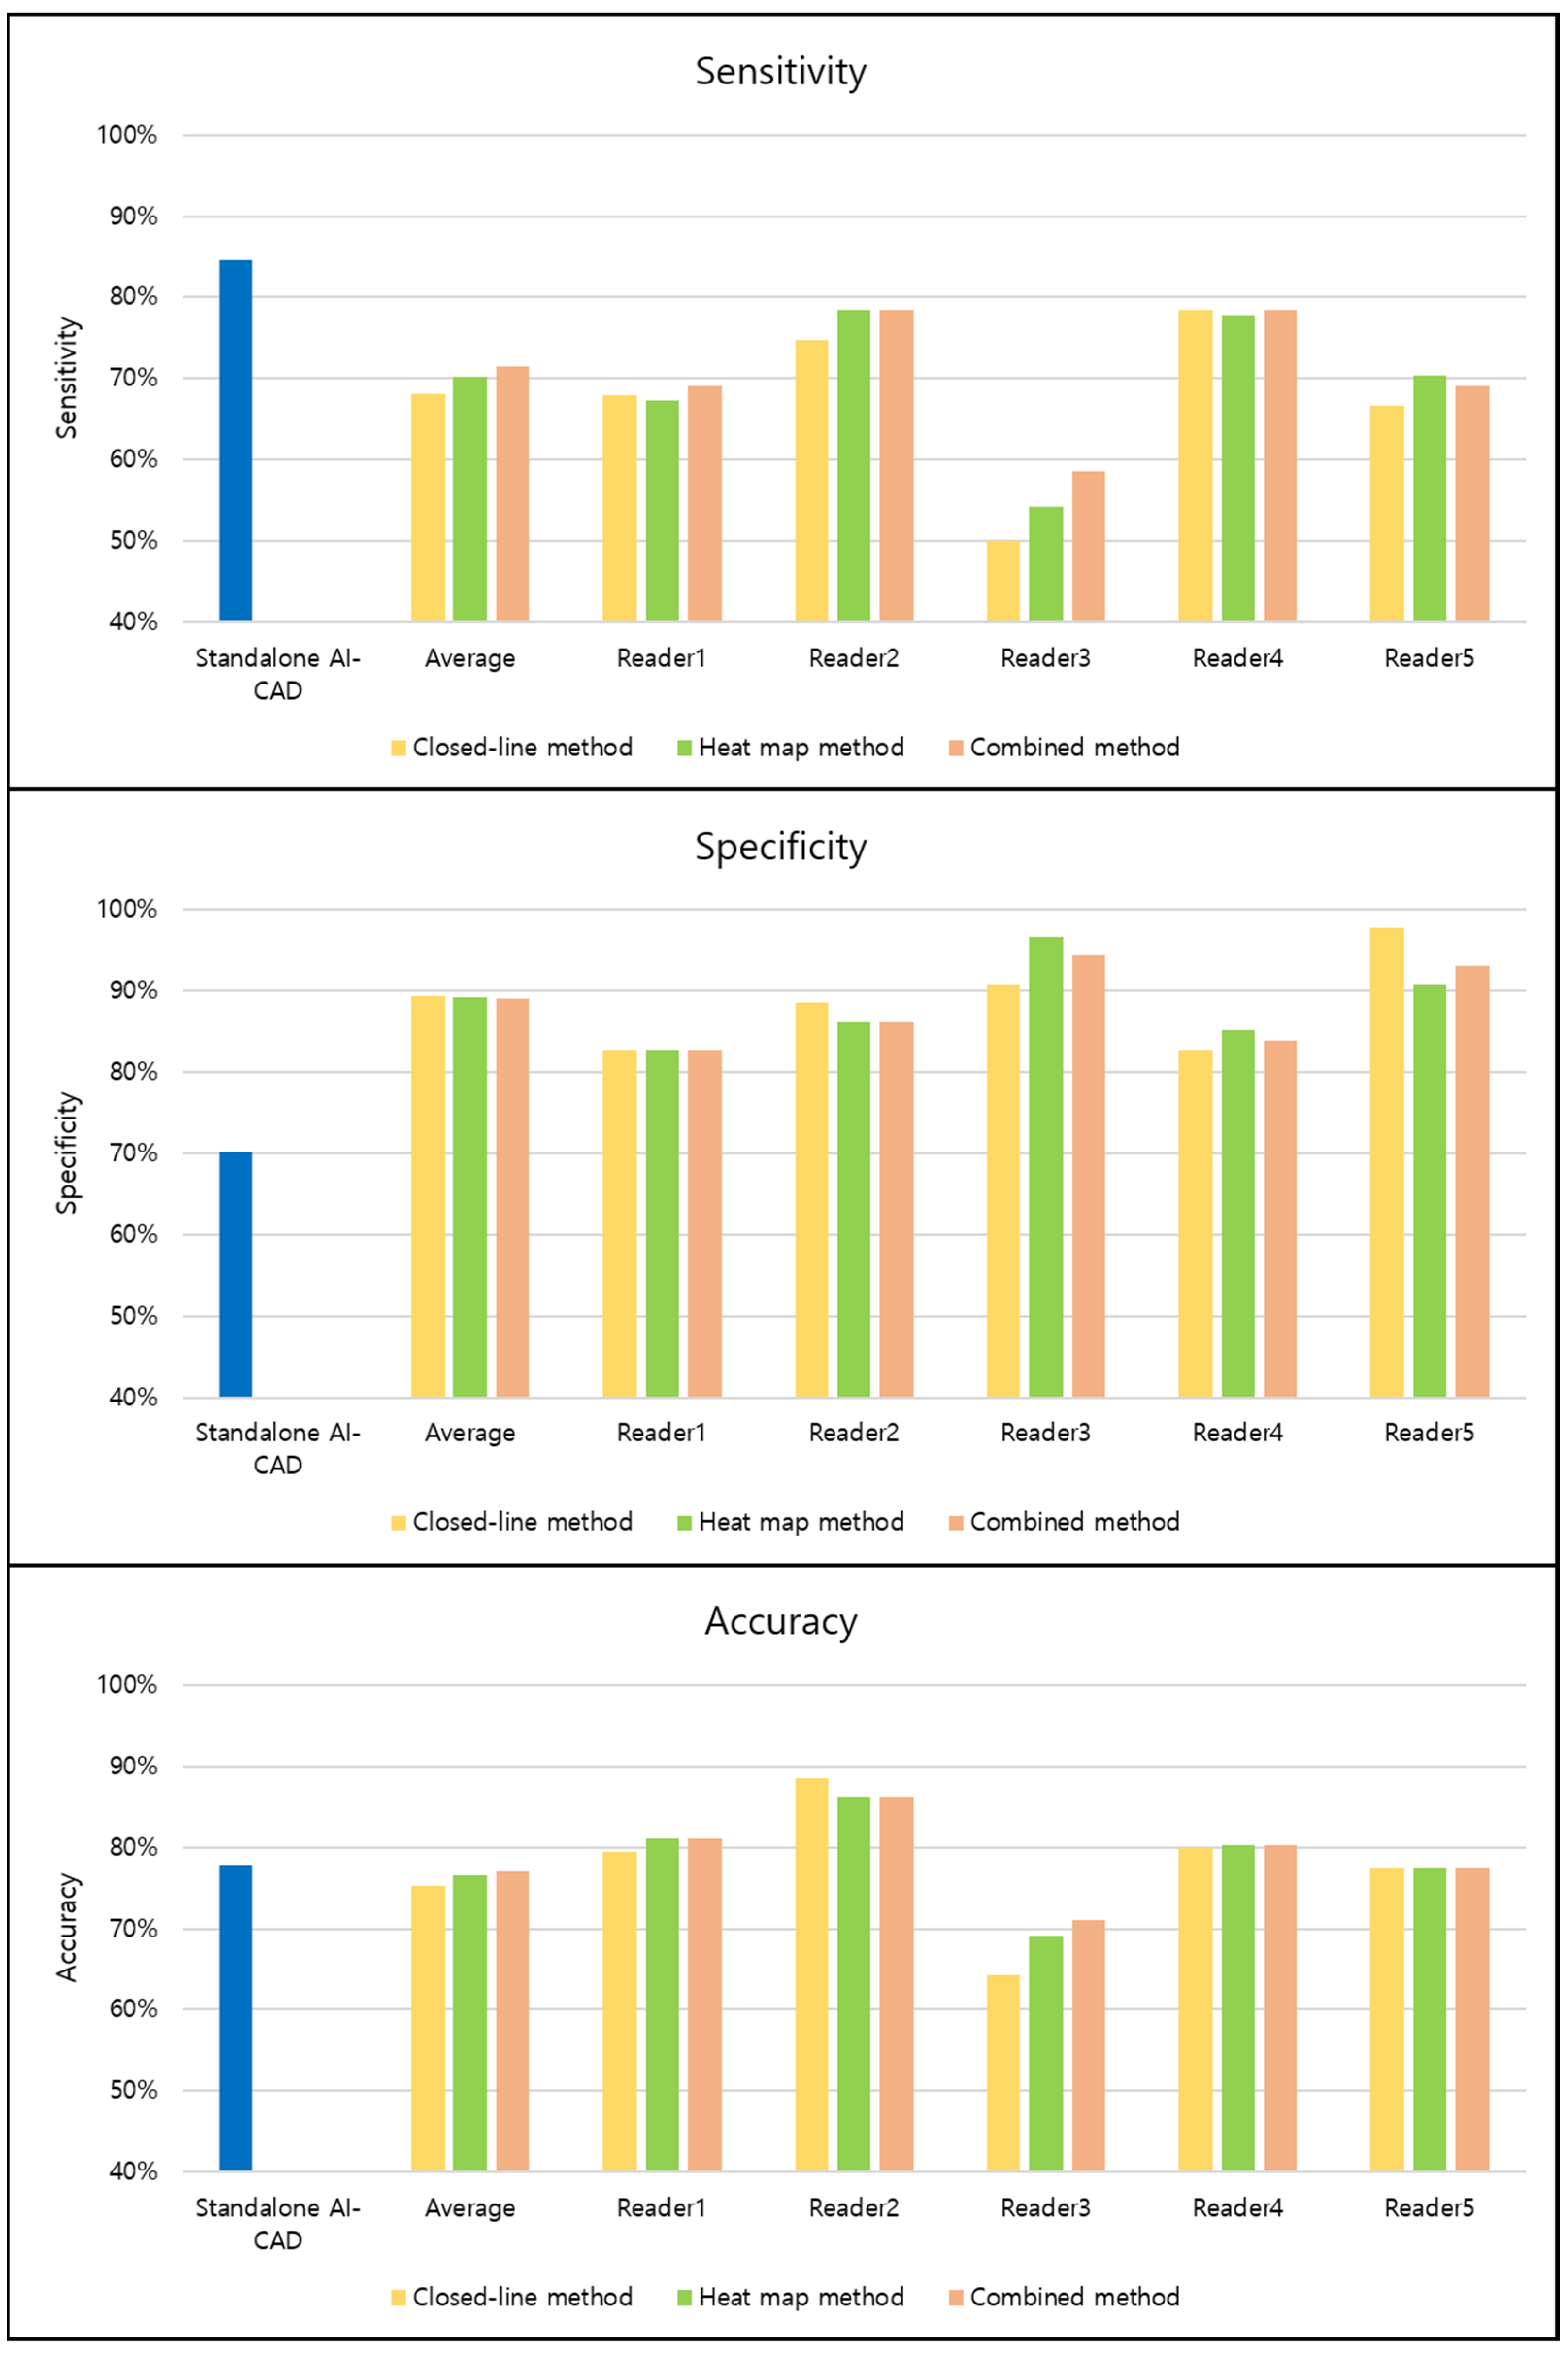
3.2. Examination-Level Classification Performances
3.3. Lesion-Level Detection Performances
3.4. Variation of Performances across Readers
3.5. Preference Survey
4. Discussion
5. Conclusions
Supplementary Materials
Author Contributions
Funding
Institutional Review Board Statement
Informed Consent Statement
Data Availability Statement
Acknowledgments
Conflicts of Interest
References
- European Society of Radiology. Current practical experience with artificial intelligence in clinical radiology: A survey of the European Society of Radiology. Insights Imaging 2022, 13, 107. [Google Scholar] [CrossRef] [PubMed]
- Hwang, E.J.; Goo, J.M.; Yoon, S.H.; Beck, K.S.; Seo, J.B.; Choi, B.W.; Chung, M.J.; Park, C.M.; Jin, K.N.; Lee, S.M. Use of Artificial Intelligence-Based Software as Medical Devices for Chest Radiography: A Position Paper from the Korean Society of Thoracic Radiology. Korean J. Radiol. 2021, 22, 1743–1748. [Google Scholar] [CrossRef]
- Lee, S.; Shin, H.J.; Kim, S.; Kim, E.K. Successful Implementation of an Artificial Intelligence-Based Computer-Aided Detection System for Chest Radiography in Daily Clinical Practice. Korean J. Radiol. 2022, 23, 847–852. [Google Scholar] [CrossRef]
- Hwang, E.J.; Park, C.M. Clinical Implementation of Deep Learning in Thoracic Radiology: Potential Applications and Challenges. Korean J. Radiol. 2020, 21, 511–525. [Google Scholar] [CrossRef] [Green Version]
- Kapoor, N.; Lacson, R.; Khorasani, R. Workflow Applications of Artificial Intelligence in Radiology and an Overview of Available Tools. J. Am. Coll. Radiol. 2020, 17, 1363–1370. [Google Scholar] [CrossRef] [PubMed]
- Tang, A.; Tam, R.; Cadrin-Chênevert, A.; Guest, W.; Chong, J.; Barfett, J.; Chepelev, L.; Cairns, R.; Mitchell, J.R.; Cicero, M.D.; et al. Canadian Association of Radiologists White Paper on Artificial Intelligence in Radiology. Can. Assoc. Radiol. J. 2018, 69, 120–135. [Google Scholar] [CrossRef] [Green Version]
- Ahn, J.S.; Ebrahimian, S.; McDermott, S.; Lee, S.; Naccarato, L.; Di Capua, J.F.; Wu, M.Y.; Zhang, E.W.; Muse, V.; Miller, B.; et al. Association of Artificial Intelligence-Aided Chest Radiograph Interpretation with Reader Performance and Efficiency. JAMA Netw. Open 2022, 5, e2229289. [Google Scholar] [CrossRef] [PubMed]
- Calli, E.; Sogancioglu, E.; van Ginneken, B.; van Leeuwen, K.G.; Murphy, K. Deep learning for chest X-ray analysis: A survey. Med. Image Anal. 2021, 72, 102125. [Google Scholar] [CrossRef]
- Meedeniya, D.; Kumarasinghe, H.; Kolonne, S.; Fernando, C.; De la Torre Díez, I.; Marques, G. Chest X-ray analysis empowered with deep learning: A systematic review. Appl. Soft Comput. 2022, 126, 109319. [Google Scholar] [CrossRef] [PubMed]
- Hong, W.; Hwang, E.J.; Lee, J.H.; Park, J.; Goo, J.M.; Park, C.M. Deep Learning for Detecting Pneumothorax on Chest Radiographs after Needle Biopsy: Clinical Implementation. Radiology 2022, 303, 433–441. [Google Scholar] [CrossRef] [PubMed]
- Hwang, E.J.; Lee, J.S.; Lee, J.H.; Lim, W.H.; Kim, J.H.; Choi, K.S.; Choi, T.W.; Kim, T.H.; Goo, J.M.; Park, C.M. Deep Learning for Detection of Pulmonary Metastasis on Chest Radiographs. Radiology 2021, 301, 455–463. [Google Scholar] [CrossRef]
- Hwang, E.J.; Nam, J.G.; Lim, W.H.; Park, S.J.; Jeong, Y.S.; Kang, J.H.; Hong, E.K.; Kim, T.M.; Goo, J.M.; Park, S.; et al. Deep Learning for Chest Radiograph Diagnosis in the Emergency Department. Radiology 2019, 293, 573–580. [Google Scholar] [CrossRef] [Green Version]
- Hwang, E.J.; Kim, H.; Lee, J.H.; Goo, J.M.; Park, C.M. Automated identification of chest radiographs with referable abnormality with deep learning: Need for recalibration. Eur. Radiol. 2020, 30, 6902–6912. [Google Scholar] [CrossRef]
- Hwang, E.J.; Park, S.; Jin, K.N.; Im Kim, J.; Choi, S.Y.; Lee, J.H.; Goo, J.M.; Aum, J.; Yim, J.J.; Cohen, J.G.; et al. Development and Validation of a Deep Learning-Based Automated Detection Algorithm for Major Thoracic Diseases on Chest Radiographs. JAMA Netw. Open 2019, 2, e191095. [Google Scholar] [CrossRef] [PubMed] [Green Version]
- Leisenring, W.; Pepe, M.S.; Longton, G. A marginal regression modelling framework for evaluating medical diagnostic tests. Stat. Med. 1997, 16, 1263–1281. [Google Scholar] [CrossRef]
- Ploug, T.; Sundby, A.; Moeslund, T.B.; Holm, S. Population Preferences for Performance and Explainability of Artificial Intelligence in Health Care: Choice-Based Conjoint Survey. J. Med. Internet Res. 2021, 23, e26611. [Google Scholar] [CrossRef]
- Ghassemi, M.; Oakden-Rayner, L.; Beam, A.L. The false hope of current approaches to explainable artificial intelligence in health care. Lancet Digit. Health 2021, 3, e745–e750. [Google Scholar] [CrossRef] [PubMed]
- Reddy, S. Explainability and artificial intelligence in medicine. Lancet Digit. Health 2022, 4, e214–e215. [Google Scholar] [CrossRef]
- Selvaraju, R.R.; Cogswell, M.; Das, A.; Vedantam, R.; Parikh, D.; Batra, D. Grad-cam: Visual explanations from deep networks via gradient-based localization. In Proceedings of the IEEE International Conference on Computer Vision, Venice, Italy, 22–29 October 2017; pp. 618–626. [Google Scholar]
- Redmon, J.; Divvala, S.; Girshick, R.; Farhadi, A. You only look once: Unified, real-time object detection. In Proceedings of the IEEE Conference on Computer Vision and Pattern Recognition, Las Vegas, NV, USA, 26 June–1 July 2016; pp. 779–788. [Google Scholar]
- Ren, S.; He, K.; Girshick, R.; Sun, J. Faster r-cnn: Towards real-time object detection with region proposal networks. IEEE Trans. Pattern Anal. Mach. Intell. 2017, 39, 1137–1149. [Google Scholar] [CrossRef] [Green Version]
- van Leeuwen, K.G.; Schalekamp, S.; Rutten, M.J.; van Ginneken, B.; de Rooij, M. Artificial intelligence in radiology: 100 commercially available products and their scientific evidence. Eur. Radiol. 2021, 31, 3797–3804. [Google Scholar] [CrossRef]
- Gaube, S.; Suresh, H.; Raue, M.; Merritt, A.; Berkowitz, S.J.; Lermer, E.; Coughlin, J.F.; Guttag, J.V.; Colak, E.; Ghassemi, M. Do as AI say: Susceptibility in deployment of clinical decision-aids. NPJ Digit. Med. 2021, 4, 1–8. [Google Scholar] [CrossRef] [PubMed]
- Hwang, E.J.; Goo, J.M.; Kim, H.Y.; Yi, J.; Yoon, S.H.; Kim, Y. Implementation of the cloud-based computerized interpretation system in a nationwide lung cancer screening with low-dose CT: Comparison with the conventional reading system. Eur. Radiol. 2021, 31, 475–485. [Google Scholar] [CrossRef] [PubMed]


| Variables | Number of Patients (%) |
|---|---|
| Male patients | 148 (59.4%) |
| Chest radiographs from fixed scanner | 189 (75.9%) |
| Chief complaint for visiting emergency department | |
| Dyspnea | 47 (18.9%) |
| Chest pain | 38 (15.3%) |
| Fever | 29 (11.6%) |
| Hemoptysis | 26 (10.4%) |
| Cough | 19 (7.6%) |
| Generalized weakness | 13 (5.2%) |
| Others | 77 (30.9%) |
| Variables | Number of Patients (%) |
|---|---|
| Chest radiographs with significant abnormality | 162 (65.1%) |
| Type of abnormality | |
| Pulmonary air-space opacity | 89 (54.9%) |
| Pulmonary nodule or mass | 27 (16.0%) |
| Pulmonary interstitial opacity | 13 (7.7%) |
| Pleural effusion | 32 (18.9%) |
| Pneumothorax | 7 (4.3%) |
| Others * | 7 (4.3%) |
| Interpretation Method | Sensitivity | Specificity | Accuracy |
|---|---|---|---|
| Readers with closed-line method | 68.2% (547/810; 62.2–73.6%) | 89.4% (385/435; 83.6–93.4%) | 75.2% (932/1295; 70.7–79.2%) |
| Readers with heat map method | 70.3% (564/810; 64.3–75.7%) | 89.2% (384/435; 83.0–93.4%) | 76.5% (948/1295; 72.0–80.5%) |
| Readers with combined method | 71.5% (573/810; 65.4–76.8%) | 89.0% (383/435; 83.1–93.0%) | 77.0% (956/1295; 72.6–80.9%) |
| p-value (closed-line vs. heat map method) | 0.129 | 0.884 | 0.224 |
| p-value (closed-line vs. combined method) | 0.007 | 0.745 | 0.037 |
| p-value (heat map vs. combined method) | 0.383 | 0.881 | 0.516 |
| Standalone AI-CAD | 84.6% (137/162; 78.1–89.8%) | 70.1% (61/87; 59.4–79.5%) | 77.8% (198/249; 70.8–83.4%) |
| p-value (vs. readers with closed-line method) | <0.001 | 0.004 | 0.521 |
| p-value (vs. readers with heat map method) | <0.001 | 0.002 | 0.485 |
| p-value (vs. readers with combined method) | <0.001 | 0.003 | 0.492 |
| Interpretation Method | All Abnormalities | Pulmonary Air-Space Opacity | Pulmonary Nodule or Mass | Pulmonary Interstitial Opacity | Pleural Effusion | Pneumothorax | Others |
|---|---|---|---|---|---|---|---|
| Readers with closed-line method | 63.9% (562/885; 58.1–69.3%) | 66.0% (290/445; 57.8–73.3%) | 61.8% (89/145; 46.3–75.3%) | 53.0% (34/65; 33.0–72.0%) | 74.6% (117/160; 60.5–84.9%) | 82.9% (29/35; 66.7–92.1%) | 8.6% (3/35; 2.8–23.4%) |
| Readers with heat map method | 66.8% (587/885; 61.0–72.1%) | 69.5% (305/445; 61.4–76.5%) | 57.5% (83/145; 42.4–71.3%) | 60.0% (38/65; 38.0–78.0%) | 79.0% (124/160; 66.0–87.9%) | 97.1% (34/35; 82.3–99.6%) | 8.6% (3/35; 2.8–23.4%) |
| Readers with combined method | 67.5% (593/885; 61.7–72.8%) | 71.3% (313/445; 63.0–78.5%) | 61.8% (89/145; 46.7–75.0%) | 58.0% (37/65; 38.0–76.0%) | 75.2% (118/160; 62.5–84.7%) | 97.1% (34/35; 82.3–99.6%) | 5.7% (2/35; 1.4–20.2%) |
| p-value (closed-line vs. heat map method) | 0.043 | 0.067 | 0.168 | 0.454 | 0.152 | 0.040 | >0.999 |
| p-value (closed-line vs. combined method) | 0.004 | 0.003 | >0.999 | 0.395 | 0.808 | 0.040 | 0.642 |
| p-value (heat map vs. combined method) | 0.580 | 0.343 | 0.147 | 0.736 | 0.122 | >0.999 | 0.642 |
| Standalone AI-CAD | 81.4% (144/177; 74.8–86.8%) | 89.9% (80/89; 81.7–95.3%) | 72.4% (21/29; 52.8–87.3%) | 100% (13/13; 75.3–100%) | 68.8% (22/32; 50–83.9%) | 100% (7/7; 59.0–100%) | 14.3% (1/7; 0.4–57.9%) |
| p-value (vs. readers with closed-line method | <0.001 | <0.001 | 0.110 | <0.001 | 0.058 | 0.006 | 0.907 |
| p-value (vs. readers with heat map method) | <0.001 | <0.001 | 0.021 | <0.001 | 0.032 | 0.280 | 0.907 |
| p-value (vs. readers with combined method) | <0.001 | <0.001 | 0.125 | <0.001 | 0.060 | 0.280 | 0.673 |
| Sensitivity | Specificity | Accuracy | Detection Rate | |
|---|---|---|---|---|
| Closed-line method | 0.162 | 0.070 | 0.087 | 0.171 |
| Heat map method | 0.142 | 0.062 | 0.067 | 0.154 |
| Combined method | 0.116 | 0.060 | 0.055 | 0.133 |
| p-value | 0.930 | 0.957 | 0.893 | 0.978 |
| Survey Item | Closed-Line Method | Heat Map Method | Combined Method |
|---|---|---|---|
| Conspicuity of result | 4 (3–5) | 4 (3–5) | 5 (5–5) |
| Interpretability of result | 4 (3–4) | 4 (2–5) | 5 (5–5) |
| Convenience of the correlation between original image and AI-CAD result | 4 (3–4) | 4 (4–5) | 4 (4–5) |
| Degree of visual fatigue | 2 (1–3) | 2 (1–3) | 3 (1–5) |
| Subjective impression to improve interpretation speed | 4 (3–5) | 4 (1–5) | 4 (2–5) |
| Subjective impression to improve interpretation accuracy | 4 (3–5) | 4 (4–5) | 5 (4–5) |
| Overall preference | 4 (3–5) | 4 (2–4) | 5 (3–5) |
Disclaimer/Publisher’s Note: The statements, opinions and data contained in all publications are solely those of the individual author(s) and contributor(s) and not of MDPI and/or the editor(s). MDPI and/or the editor(s) disclaim responsibility for any injury to people or property resulting from any ideas, methods, instructions or products referred to in the content. |
© 2023 by the authors. Licensee MDPI, Basel, Switzerland. This article is an open access article distributed under the terms and conditions of the Creative Commons Attribution (CC BY) license (https://creativecommons.org/licenses/by/4.0/).
Share and Cite
Hong, S.; Hwang, E.J.; Kim, S.; Song, J.; Lee, T.; Jo, G.D.; Choi, Y.; Park, C.M.; Goo, J.M. Methods of Visualizing the Results of an Artificial-Intelligence-Based Computer-Aided Detection System for Chest Radiographs: Effect on the Diagnostic Performance of Radiologists. Diagnostics 2023, 13, 1089. https://doi.org/10.3390/diagnostics13061089
Hong S, Hwang EJ, Kim S, Song J, Lee T, Jo GD, Choi Y, Park CM, Goo JM. Methods of Visualizing the Results of an Artificial-Intelligence-Based Computer-Aided Detection System for Chest Radiographs: Effect on the Diagnostic Performance of Radiologists. Diagnostics. 2023; 13(6):1089. https://doi.org/10.3390/diagnostics13061089
Chicago/Turabian StyleHong, Sungho, Eui Jin Hwang, Soojin Kim, Jiyoung Song, Taehee Lee, Gyeong Deok Jo, Yelim Choi, Chang Min Park, and Jin Mo Goo. 2023. "Methods of Visualizing the Results of an Artificial-Intelligence-Based Computer-Aided Detection System for Chest Radiographs: Effect on the Diagnostic Performance of Radiologists" Diagnostics 13, no. 6: 1089. https://doi.org/10.3390/diagnostics13061089
APA StyleHong, S., Hwang, E. J., Kim, S., Song, J., Lee, T., Jo, G. D., Choi, Y., Park, C. M., & Goo, J. M. (2023). Methods of Visualizing the Results of an Artificial-Intelligence-Based Computer-Aided Detection System for Chest Radiographs: Effect on the Diagnostic Performance of Radiologists. Diagnostics, 13(6), 1089. https://doi.org/10.3390/diagnostics13061089