
Comparison of Mandibular Volume and Linear Measurements in Patients with Mandibular Asymmetry

 , ,
, ,
Abstract
:1. Introduction
2. Materials and Methods
2.1. Participants
- Selection criteria for study participants:
- (1)
- Patients who were at least 18 years old.
- (2)
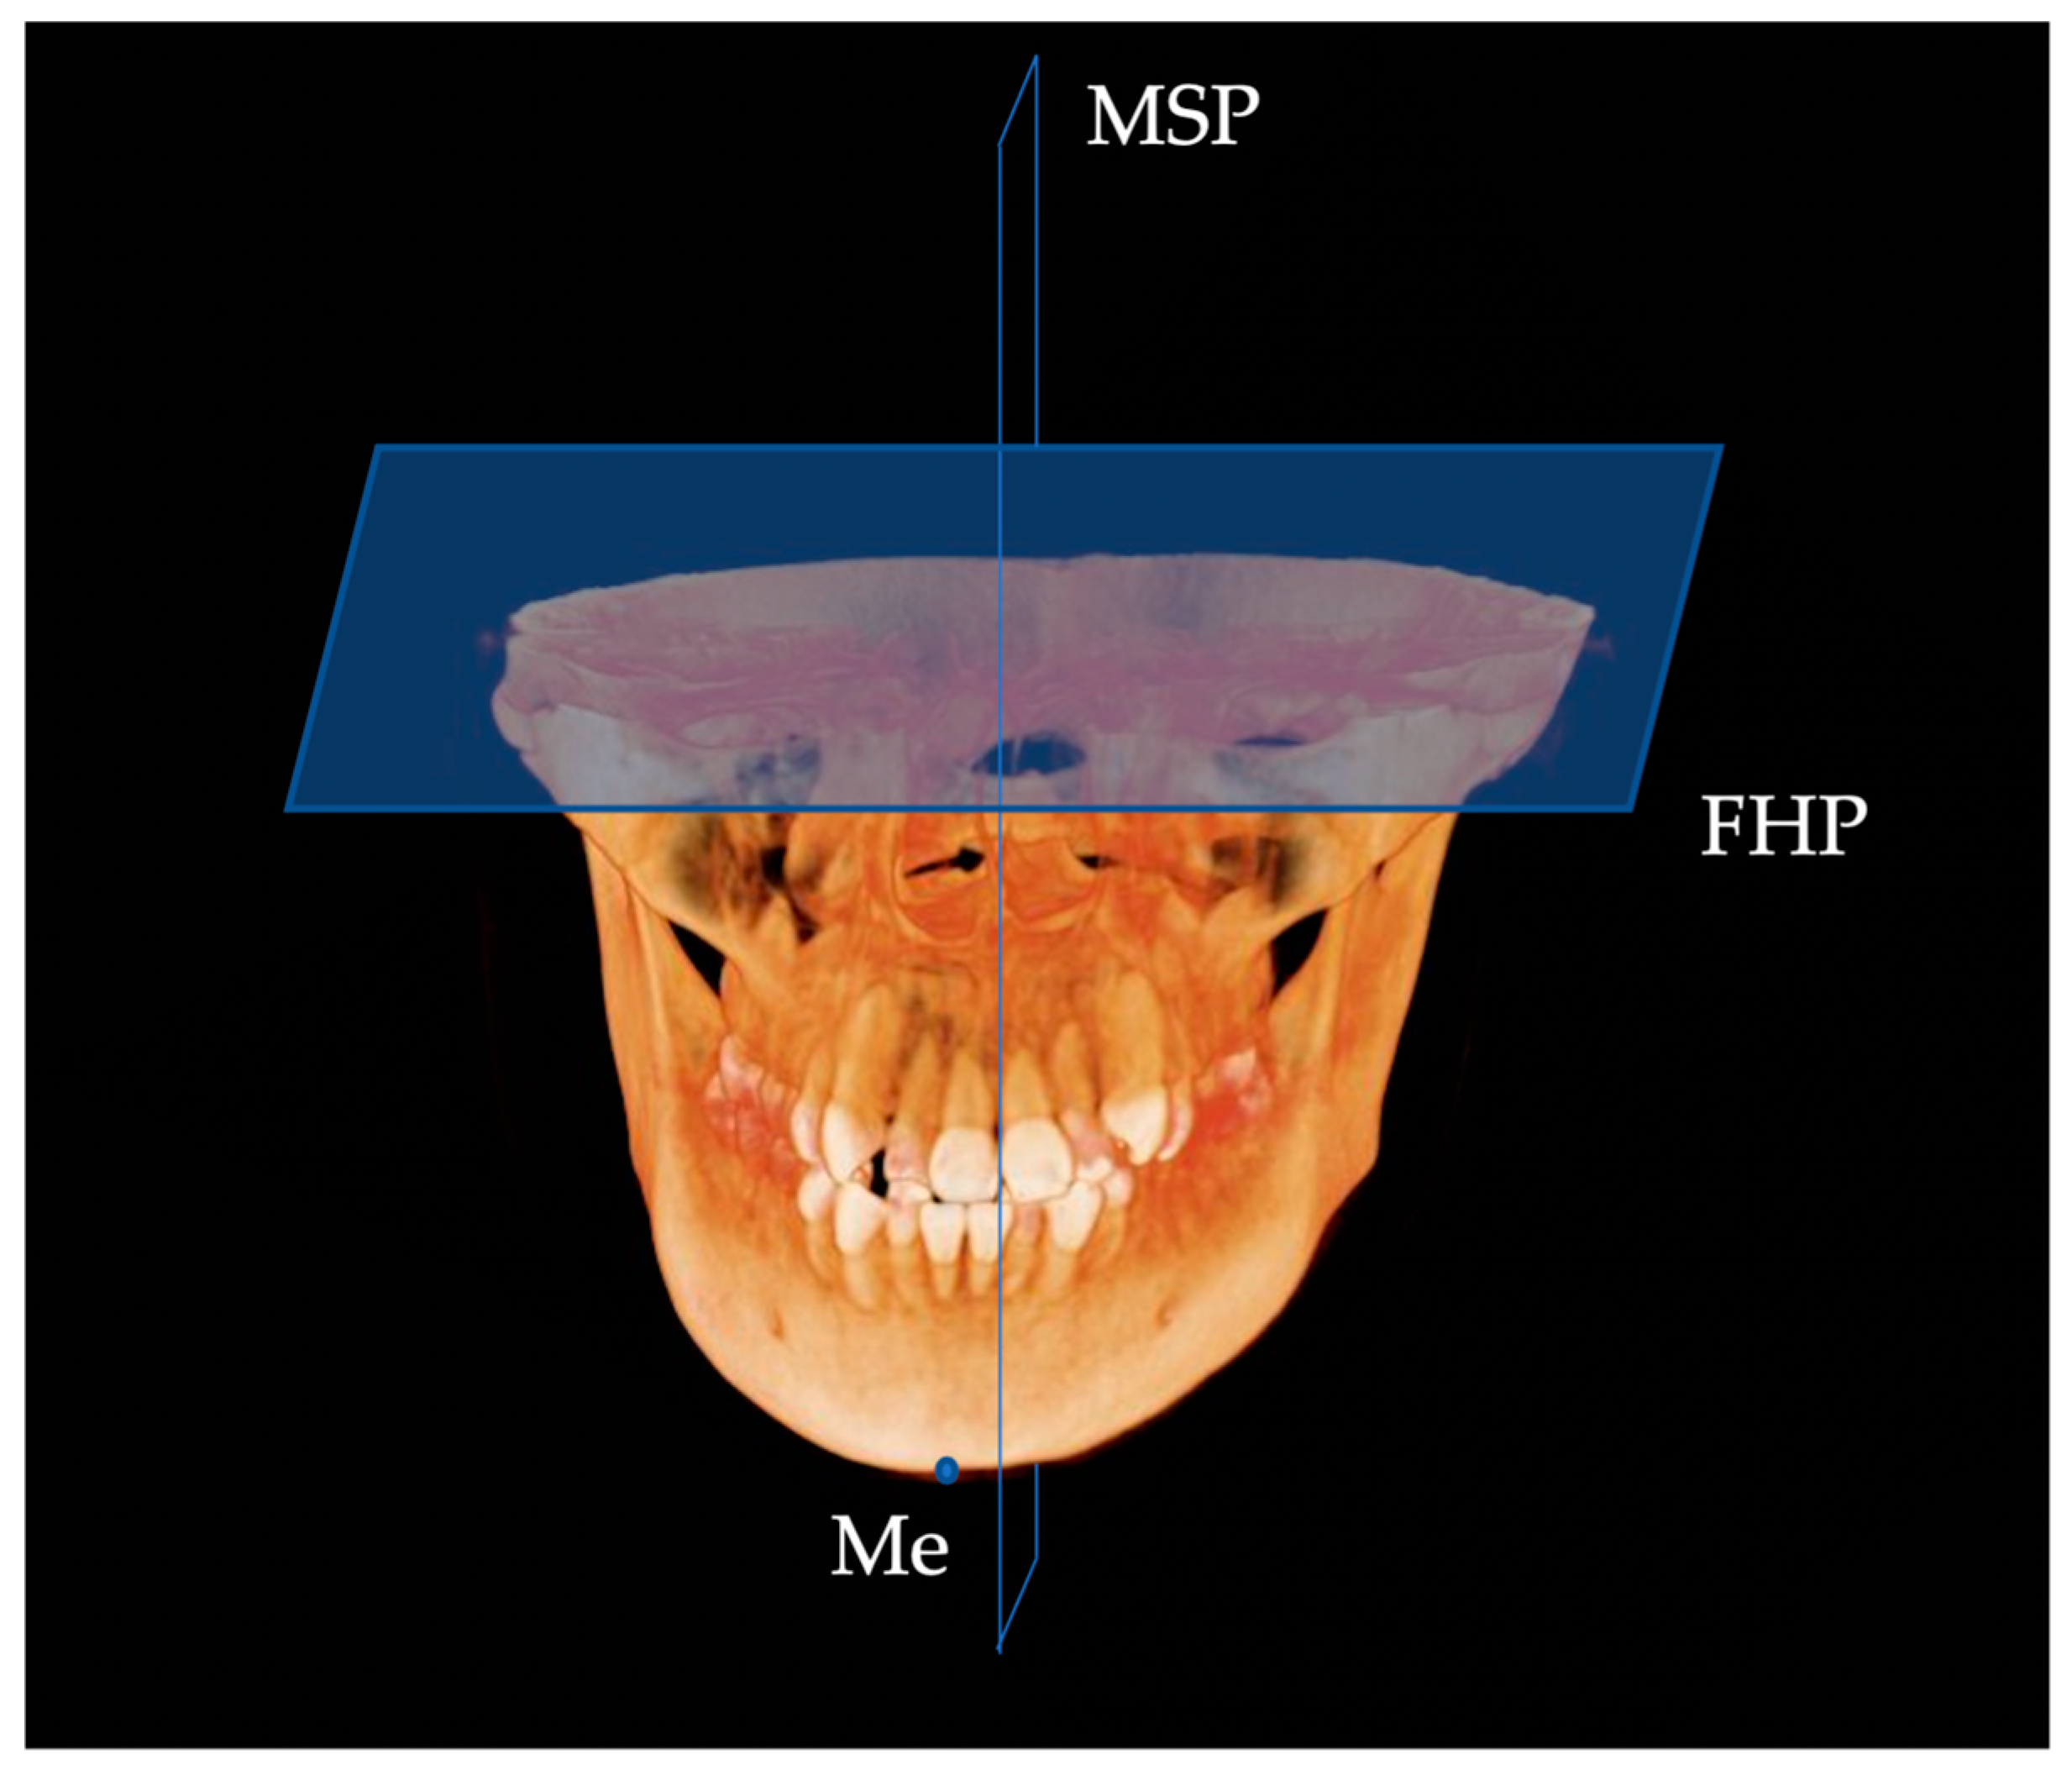
- Patients with a Menton (Me) deviation ≥ 4.0 mm or more from the midsagittal plane (MSP) of the face.
- Exclusion criteria for this study:
- (1)
- Patients with pre-existing congenital diseases, such as cleft lip or palate.
- (2)
- History of orthodontic treatment or orthognathic surgery.
- (3)
- History of maxillofacial trauma.
- (4)
- CBCT images of inadequate quality owing to artifacts.
- (5)
- CBCT images with inadequate coverage.
2.2. Data Acquisition and 3D Landmarks
2.3. Measurements
2.4. Statistical Analysis
3. Results
4. Discussion
5. Conclusions
Author Contributions
Funding
Institutional Review Board Statement
Informed Consent Statement
Data Availability Statement
Conflicts of Interest
References
- Severt, T.R.; Proffit, W.R. The prevalence of facial asymmetry in the dentofacial deformities population at the University of North Carolina. Int. J. Adult Orthod. Orthognath. Surg. 1997, 12, 171–176. [Google Scholar]
- Galluccio, G.; Caridi, V.; Impellizzeri, A.; Chudan, A.P.; Vernucci, R.; Barbato, E. Familiar occurrence of facial asymmetry: A pilot study. Minerva Stomatol. 2020, 69, 349–359. [Google Scholar] [CrossRef] [PubMed]
- Iodice, G.; Danzi, G.; Cimino, R.; Paduano, S.; Michelotti, A. Association between posterior crossbite, skeletal, and muscle asymmetry: A systematic review. Eur. J. Orthod. 2016, 38, 638–651. [Google Scholar] [CrossRef] [PubMed] [Green Version]
- McCrea, S.J.; Troy, M. Prevalence and severity of mandibular asymmetry in non-syndromic, non-pathological caucasian adult. Ann. Maxillofac. Surg. 2018, 8, 254–258. [Google Scholar] [CrossRef]
- McAvinchey, G.; Maxim, F.; Nix, B.; Djordjevic, J.; Linklater, R.; Landini, G. The perception of facial asymmetry using 3-dimensional simulated images. Angle Orthod. 2014, 84, 957–965. [Google Scholar] [CrossRef] [Green Version]
- Priscilla, B.C.B.; Pâmela, L.S.; João, P.C.; Paulo, H.L.F.; Matheus, M.P.; Luiz, R.P. Aesthetic facial perception and need for intervention in laterognathism in women of different ethnicities. J. Craniomaxillofac. Surg. 2017, 45, 1600–1606. [Google Scholar]
- Palone, M.; Spedicato, G.A.; Lombardo, L. Analysis of tooth anatomy in adults with ideal occlusion: A preliminary study. Am. J. Orthod. Dentofac. Orthop. 2020, 157, 218–227. [Google Scholar] [CrossRef]
- Foster, J.; Ahluwalia, R.; Sherburn, M.; Kelly, K.; Sellyn, G.E.; Kiely, C.; Wiseman, A.L.; Gannon, S.; Shannon, C.N.; Bonfield, C.M. Pediatric cranial deformations: Demographic associations. J. Neurosurg. Pediatr. 2020, 26, 415–420. [Google Scholar] [CrossRef]
- Burstone, C.J. Diagnosis and treatment planning of patients with asymmetries. Semin. Orthod. 1998, 4, 153–164. [Google Scholar] [CrossRef]
- Reyneke, J.P.; Tsakiris, P.; Kienle, F. A simple classification for surgical treatment planning of maxillomandibular asymmetry. Br. J. Oral Maxillofac. Surg. 1997, 35, 349–351. [Google Scholar] [CrossRef]
- Maeda, M.; Katsumata, A.; Ariji, Y.; Muramatsu, A.; Yoshida, K.; Goto, S.; Kurita, K.; Ariji, E. 3D-CT evaluation of facial asymmetry in patients with maxillofacial deformities. Oral Surg. Oral Med. Oral Pathol. Oral Radiol. 2006, 102, 382–390. [Google Scholar] [CrossRef] [PubMed]
- Kwon, S.M.; Baik, H.S.; Jung, H.D.; Jang, W.; Choi, Y.J. Diagnosis and surgical outcomes of facial asymmetry according to the occlusal cant and menton deviation. J. Oral Maxillofac. Surg. 2019, 77, 1261–1275. [Google Scholar] [CrossRef]
- Kwon, S.M.; Hwang, J.J.; Jung, Y.H.; Cho, B.H.; Lee, K.J.; Hwang, C.J.; Choi, S.H. Similarity index for intuitive assessment of three-dimensional facial asymmetry. Sci. Rep. 2019, 9, 10959. [Google Scholar] [CrossRef] [PubMed] [Green Version]
- You, K.H.; Lee, K.J.; Lee, S.H.; Baik, H.S. Three-dimensional computed tomography analysis of mandibular morphology in patients with facial asymmetry and mandibular prognathism. Am. J. Orthod. Dentofac. Orthop. 2010, 138, 540–541. [Google Scholar] [CrossRef]
- Springate, S.D. The effect of sample size and bias on the reliability of estimates of error: A comparative study of Dahlberg’s formula. Eur. J. Orthod. 2012, 34, 158–163. [Google Scholar] [CrossRef] [PubMed] [Green Version]
- Hasebe, A.; Yamaguchi, T.; Nakawaki, T.; Hikita, Y.; Katayama, K.; Maki, K. Comparison of condylar size among different anteroposterior and vertical skeletal patterns using cone-beam computed tomography. Angle Orthod. 2019, 89, 306–311. [Google Scholar] [CrossRef] [Green Version]
- Al-koshab, M.; Nambiar, P.; John, J. Assessment of condyle and glenoid fossa morphology using CBCT in South-East Asians. PLoS ONE 2015, 10, e0121682. [Google Scholar] [CrossRef]
- Chang, M.S.; Choi, J.H.; Yang, I.H.; An, J.S.; Heo, M.S.; Ahn, S.J. Relationships between temporomandibular joint disk displacements and condylar volume. Oral Surg. Oral Med. Oral Pathol. Oral Radiol. 2018, 125, 192–198. [Google Scholar]
- Huang, M.; Hu, Y.; Yu, J.; Sun, J.; Ming, Y.; Zheng, L. Cone-beam computed tomographic evaluation of the temporomandibular joint and dental characteristics of patients with Class II subdivision malocclusion and asymmetry. Korean J. Orthod. 2017, 47, 277–288. [Google Scholar] [CrossRef] [Green Version]
- Katayama, K.; Yamaguchi, T.; Sugiura, M.; Haga, S.; Maki, K. Evaluation of mandibular volume using cone-beam computed tomography and correlation with cephalometric values. Angle Orthod. 2014, 84, 337–342. [Google Scholar] [CrossRef] [Green Version]
- Hujoel, P.P.; Masterson, E.E.; Bollen, A.M. Lower face asymmetry as a marker for developmental instability. Am. J. Hum. Biol. 2017, 29, e23005. [Google Scholar] [CrossRef]
- Chaweeborisuit, P.; Yurasakpong, L.; Kruepunga, N.; Tubbs, R.S.; Chaiyamoon, A.; Suwannakhan, A. The prevalence of Stafne bone cavity: A meta-analysis of 355,890 individuals. J. Dent. Sci. 2023, 18, 594–603. [Google Scholar] [CrossRef]
- Peck, S.; Peck, L.; Kataja, M. Skeletal asymmetry in esthetically pleasing faces. Angle Orthod. 1991, 61, 43–48. [Google Scholar] [PubMed]
- Oh, M.H.; Cho, J.H. The three-dimensional morphology of mandible and glenoid fossa as contributing factors to menton deviation in facial asymmetry-retrospective study. Prog. Orthod. 2020, 21, 33. [Google Scholar] [CrossRef] [PubMed]
- Kim, E.J.; Palomo, J.M.; Kim, S.; Lim, H.J.; Lee, K.M.; Hwang, H.S. Maxillofacial characteristics affecting chin deviation between mandibular retrusion and prognathism patients. Angle Orthod. 2011, 81, 988–993. [Google Scholar] [CrossRef] [PubMed]
- Kirveskari, P.; Alanen, P. Right-left asymmetry of maximum jaw opening. Acta Odontol. Scand. 1989, 47, 101–103. [Google Scholar] [CrossRef]
- Kheir, N.A.; Kau, C.H. Measuring mandibular asymmetry in Class I normal subjects using 3D novel coordinate system. Ann. Maxillofac. Surg. 2014, 4, 34–38. [Google Scholar]
- Lindell, A. Lateralization of the expression of facial emotion in humans. Prog. Brain Res. 2018, 238, 249–270. [Google Scholar]
- Naini, F.B.; Donaldson, A.N.; McDonald, F.; Cobourne, M.T. Assessing the influence of asymmeftry affecting the mandible and chin point on perceived attractiveness in the orthognathic patient, clinician, and layperson. J. Oral Maxillofac. Surg. 2012, 70, 192–206. [Google Scholar] [CrossRef]
- Dong, T.; Ye, N.; Yuan, L.; Wu, S.; Xia, L.; Fang, B. Assessing the influence of chin asymmetry on perceived facial esthetics with 3-Dimensional images. J. Oral Maxillofac. Surg. 2020, 78, 1389–1396. [Google Scholar] [CrossRef]
- Machida, N.; Yamada, K.; Takata, Y.; Yamada, Y. Relationship between facial asymmetry and masseter reflex activity. J. Oral Maxillofac. Surg. 2003, 61, 298–303. [Google Scholar] [CrossRef] [Green Version]
- Dong, Y.; Wang, X.M.; Wang, M.Q.; Widmalm, S.E. Asymmetric muscle function in patients with developmental mandibular asymmetry. J. Oral Rehabil. 2008, 35, 27–36. [Google Scholar] [CrossRef] [PubMed] [Green Version]
- Takada, J.; Ono, T.; Miyamoto, J.J.; Yokota, T.; Moriyama, K. Association between intraoral pressure and molar position and inclination in subjects with facial asymmetry. Eur. J. Orthod. 2011, 33, 243–249. [Google Scholar] [CrossRef] [PubMed] [Green Version]
- Kitai, N.; Fujii, Y.; Murakami, S.; Furukawa, S.; Kreiborg, S.; Takada, K. Human masticatory muscle volume and zygomatico-mandibular form in adults with mandibular prognathism. J. Dent. Res. 2002, 81, 752–756. [Google Scholar] [CrossRef] [PubMed]
- Moss, M.L. The functional matrix hypothesis revisited. 3. The genomic thesis. Am. J. Orthod. Dentofac. Orthop. 1997, 112, 338–342. [Google Scholar] [CrossRef]
- Qu, G.L.; Xu, J.; Zhou, Q. Evaluation of the spatial position and correlation of mandibular ramus in skeletal class III patients with mandibular asymmetry. J. Craniofac. Surg. 2019, 30, 439–442. [Google Scholar] [CrossRef]
- Maki, K.; Miller, A.J.; Okano, T.; Hatcher, D.; Yamaguchi, T.; Kobayashi, H.; Shibasaki, Y. Cortical bone mineral density in asymmetrical mandibles: A three-dimensional quantitative computed tomography study. Eur. J. Orthod. 2001, 23, 217–232. [Google Scholar] [CrossRef]
- Kim, H.J.; Hong, M.; Park, H.S. Analysis of dental compensation in patients with facial asymmetry using cone-beam computed tomography. Am. J. Orthod. Dentofac. Orthop. 2019, 156, 493–501. [Google Scholar] [CrossRef]
- Nicot, R.; Chung, K.; Vieira, A.R.; Raoul, G.; Ferri, J.; Sciote, J.J. Condyle modeling stability, craniofacial asymmetry and ACTN3 genotypes: Contribution to TMD prevalence in a cohort of dentofacial deformities. PLoS ONE 2020, 15, e0236425. [Google Scholar] [CrossRef]
- Almeida, L.E.; Zacharias, J.; Pierce, S. Condylar hyperplasia: An updated review of the literature. Korean J. Orthod. 2015, 45, 333–340. [Google Scholar] [CrossRef] [Green Version]
- Bishara, S.E.; Burkey, P.S.; Kharouf, J.G. Dental and facial asymmetries: A review. Angle Orthod. 1994, 64, 89–98. [Google Scholar] [PubMed]


| Landmark | Definition | |
|---|---|---|
| N | nasion | Middle point of nasofrontal suture |
| S | sella | Centre of sella turcica |
| Or | orbitale | Most inferior point of the lower margin of the orbit |
| Po | porion | Most superior point of the external auditory meatus |
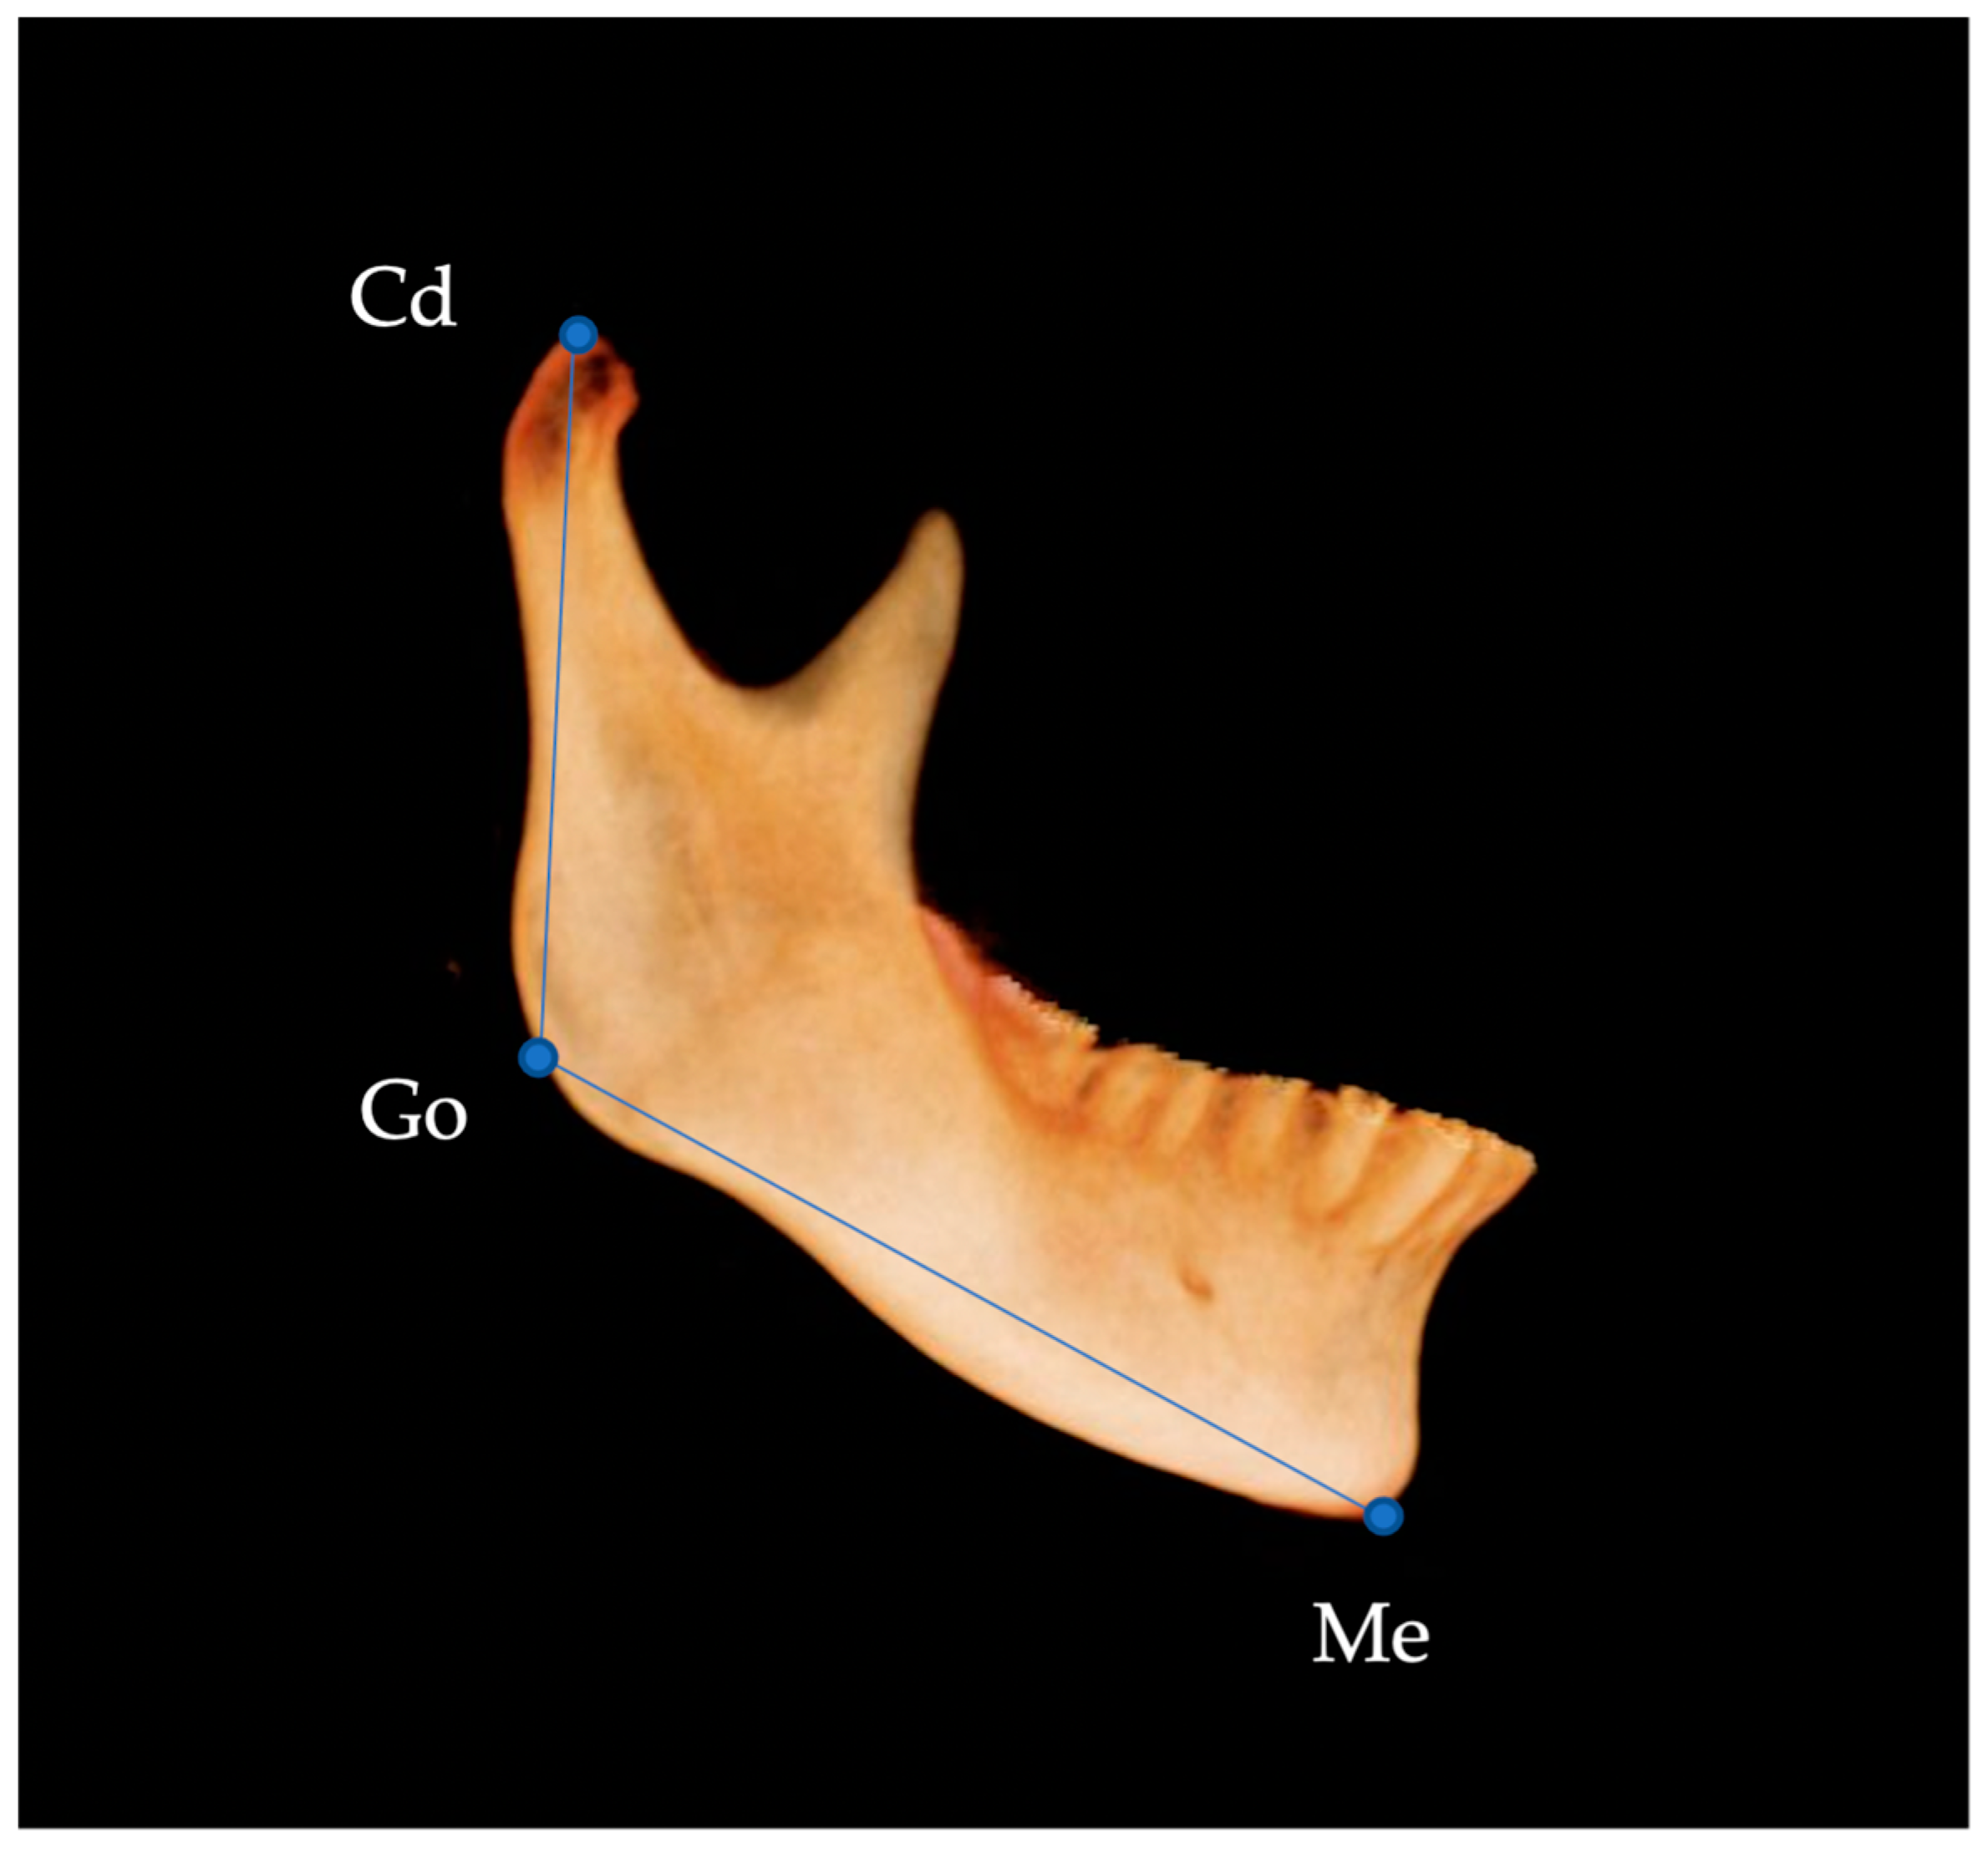
| Con | condylion | Most superior point of the condylar head |
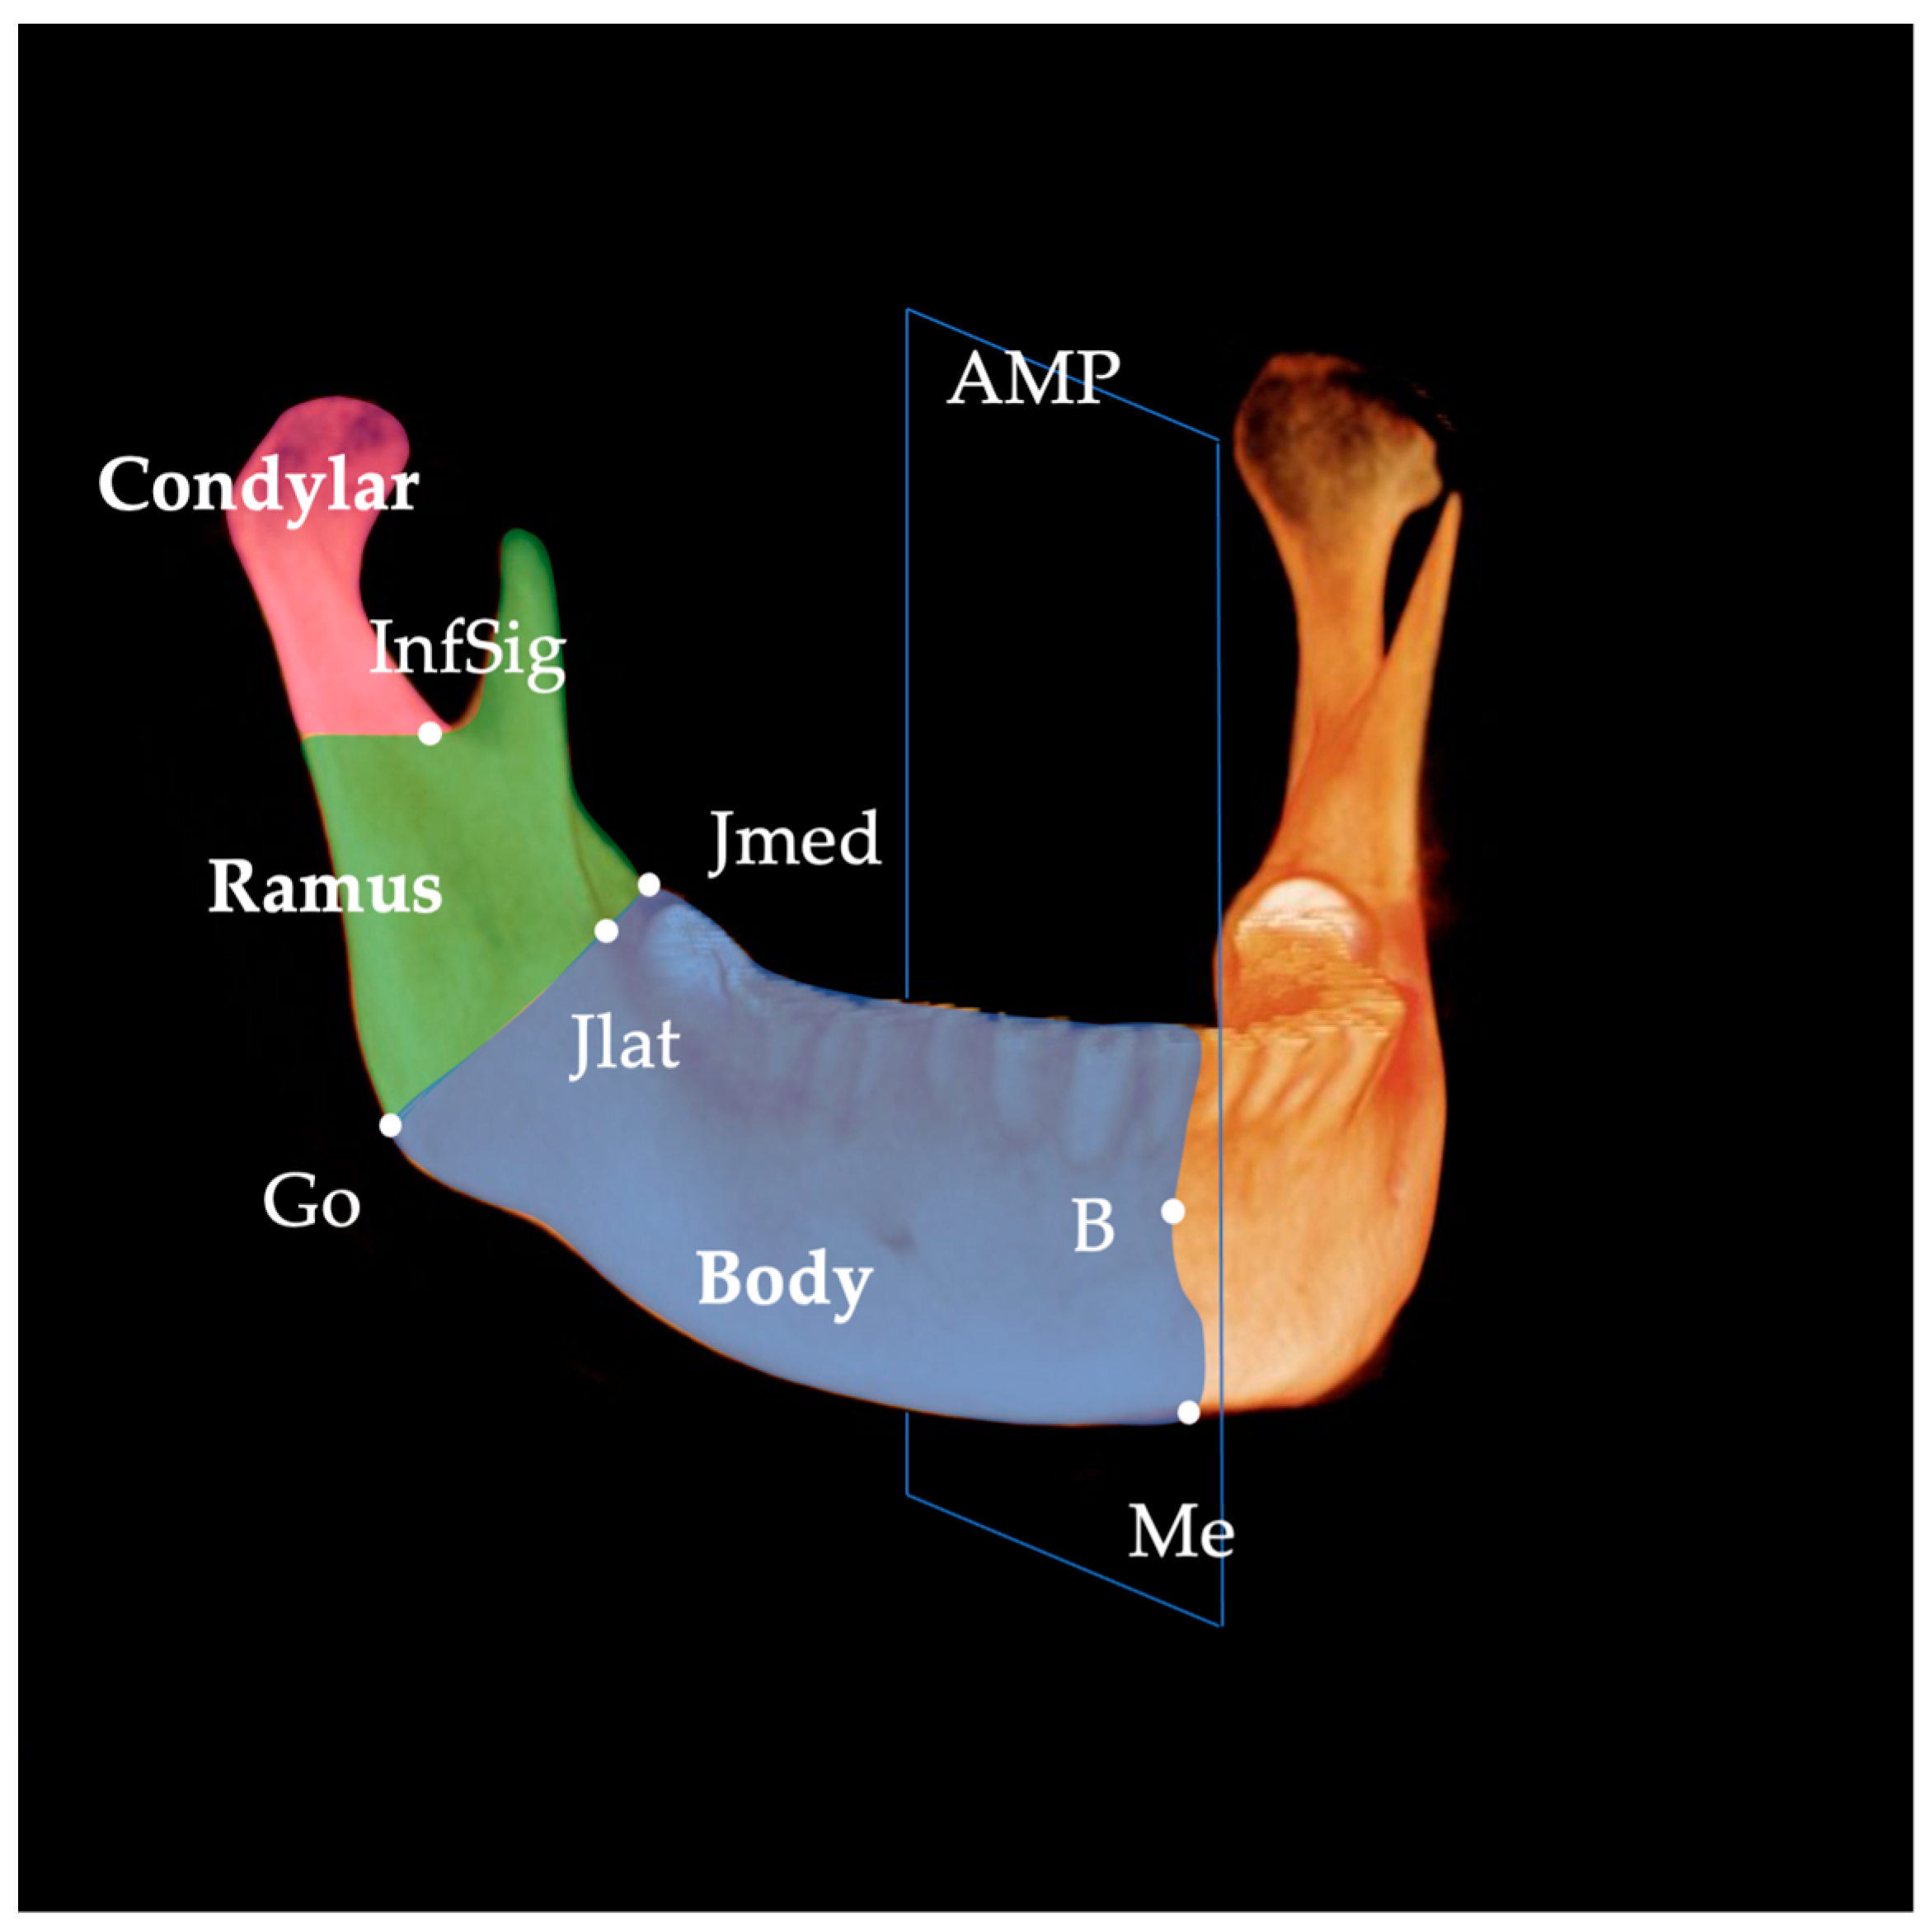
| Jlat | junction lateral | Most lateral and deepest point of curvature formed at the junction of the mandibular ramus and body |
| Jmed | junction medial | Most medial and deepest point of curvature formed at the junction of the mandibular ramus and body |
| Go | gonion | Most inferior, posterior, and lateral point on the external angle of the mandible |
| Me | menton | Most inferior midpoint on the symphysis |
| Pog | pogonion | Most anterior midpoint on the symphysis |
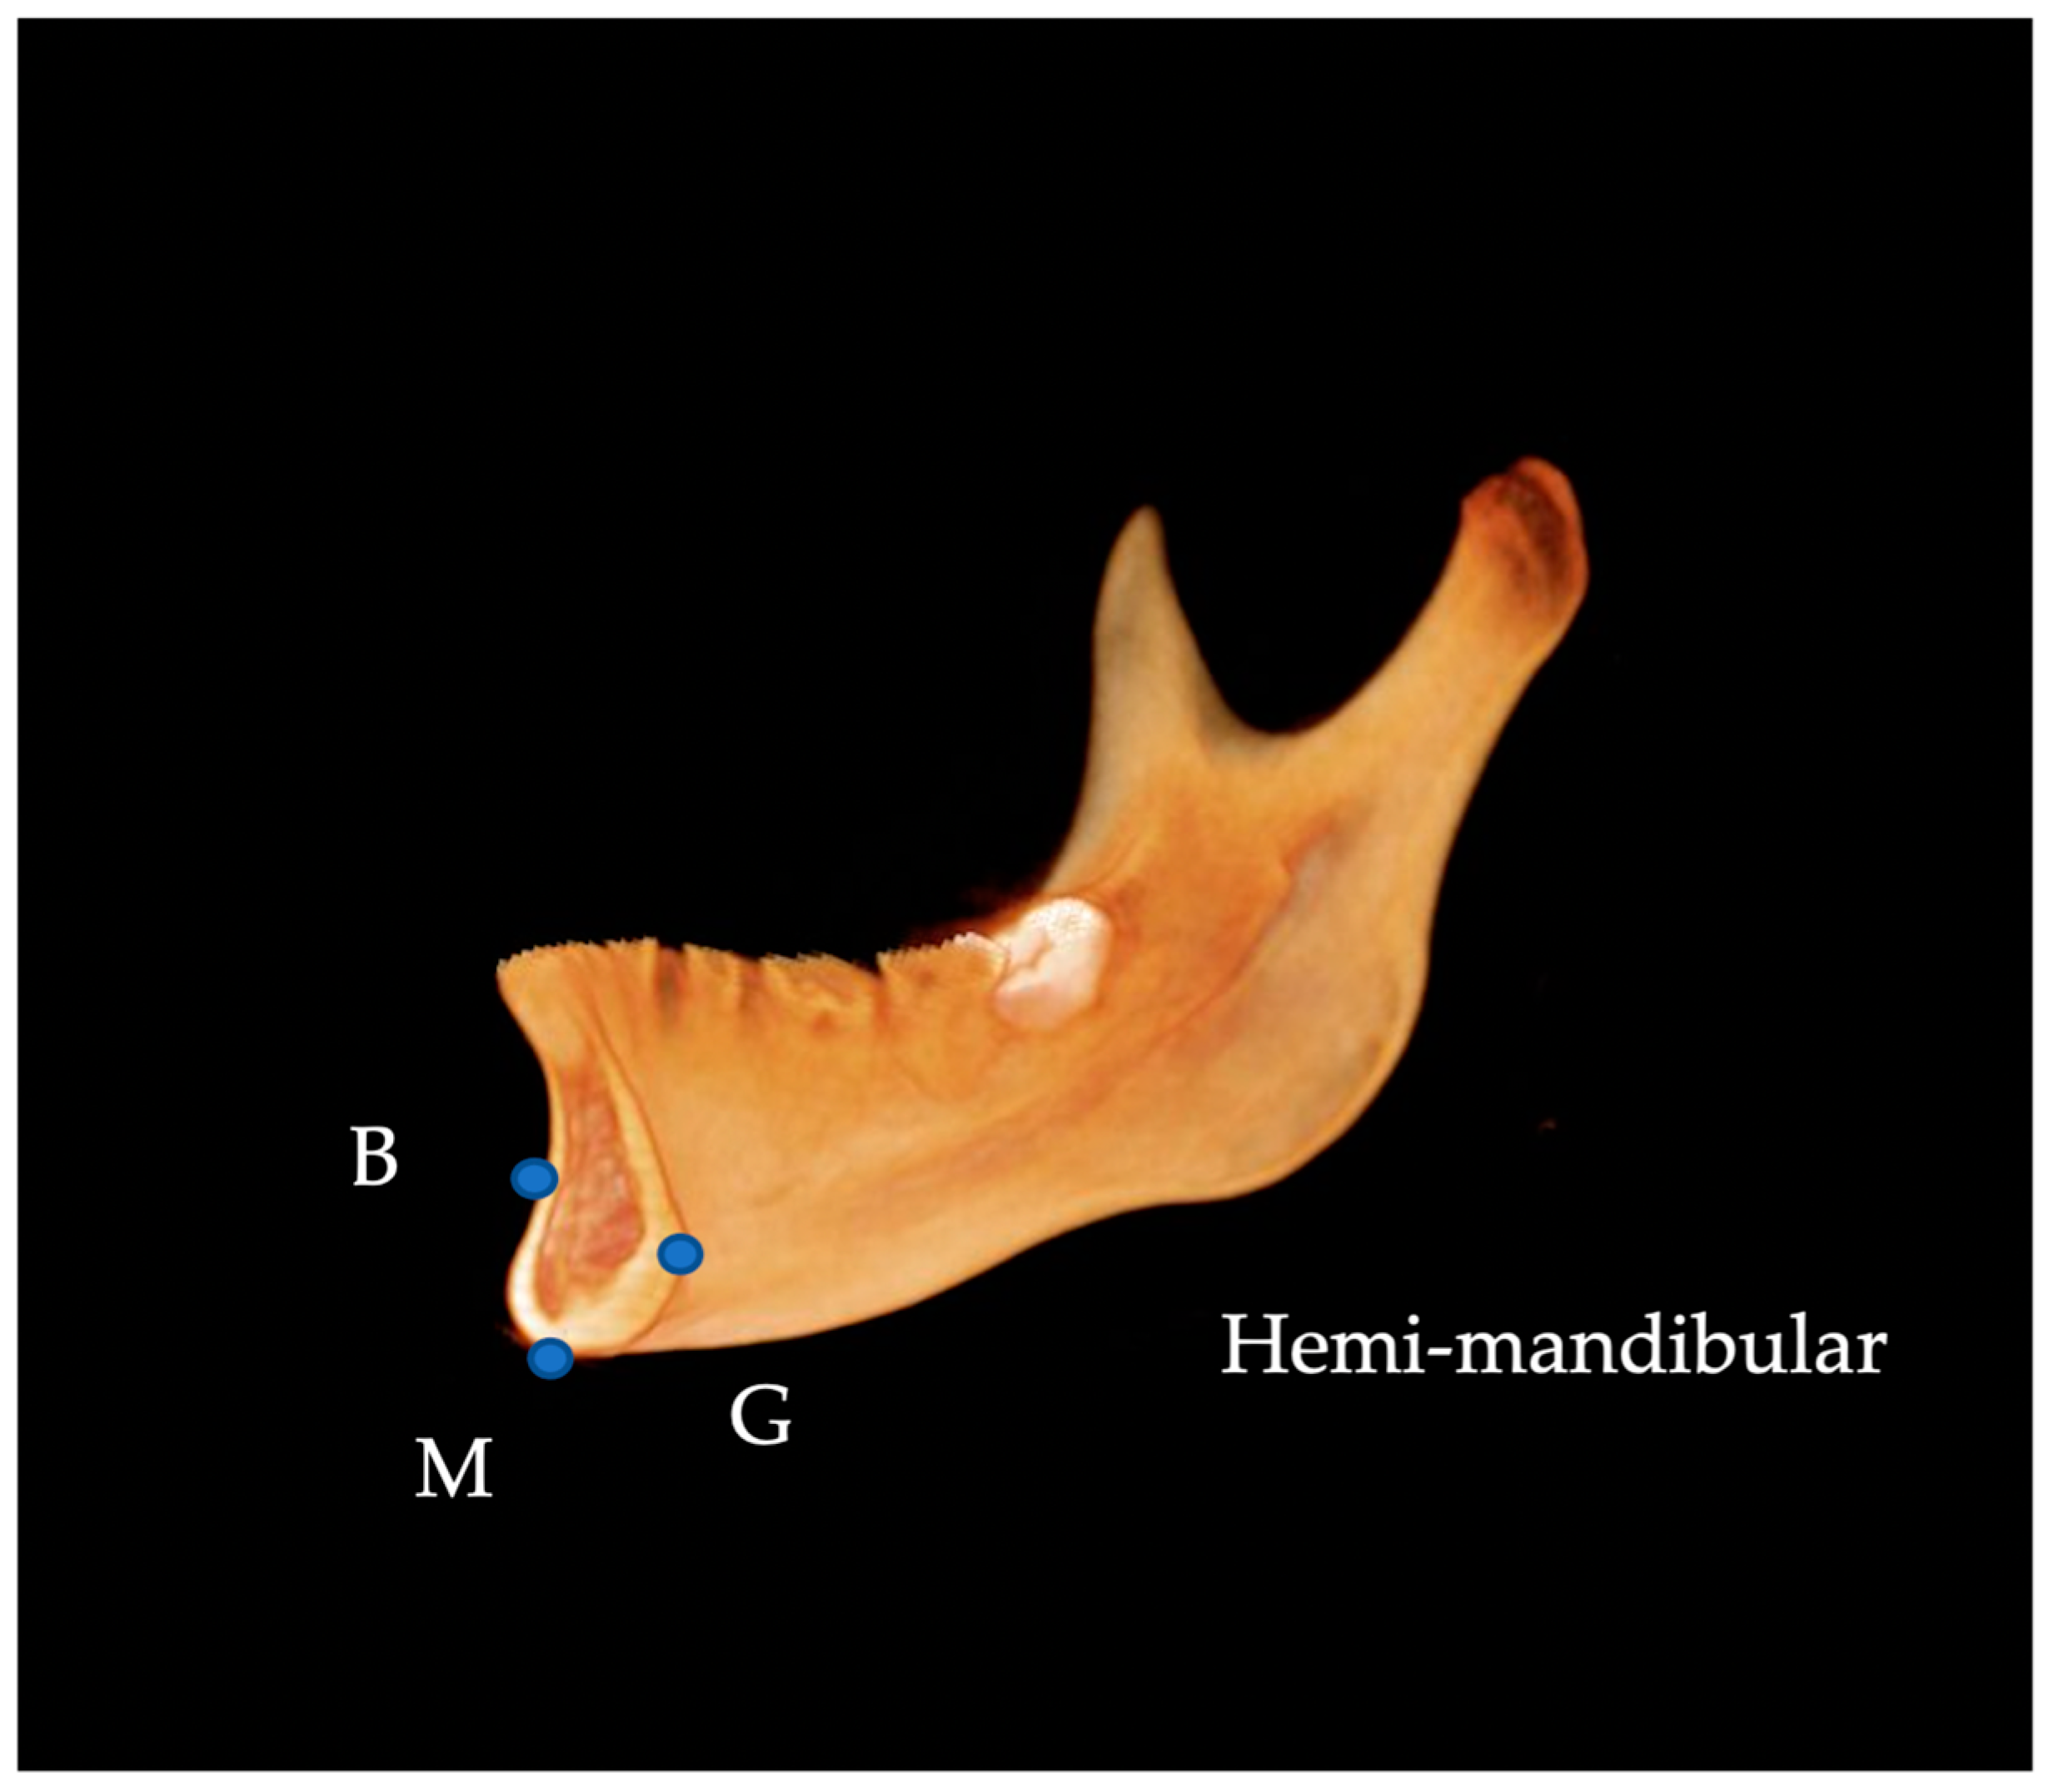
| B | supramentale | Midpoint of greatest concavity on the anterior border of the symphysis |
| G | genial tubercle | Midpoint on genial tubercle |
| InfSig | inferior sigmoid | Most inferior point of the sigmoid notch |
| Mandibular Body Length (mm) | Ramus Length (mm) | Condyle Length (mm) | |||||||
|---|---|---|---|---|---|---|---|---|---|
| Dev side | 84.6 ± 7.2 | M: 87.7 ± 6.4 | J: 81.1 ± 7.0 | 59.6 ± 6.7 | M: 63.1 ± 5.6 | J: 58.7 ± 5.5 | 22.5 ± 4.4 | M: 23.0 ± 4.7 | J: 25.0 ± 3.8 |
| F: 80.9 ± 6.3 | K: 89.4 ± 6.2 | F: 55.5 ± 5.6 | K: 63.1 ± 5.5 | F: 21.8 ± 4.2 | K: 22.7 ± 4.2 | ||||
| E: 80.8 ± 4.9 | E: 55.8 ± 6.9 | E: 20.6 ± 4.4 | |||||||
| N-Dev side | 87.4 ± 7.3 | M: 91.0 ± 6.2 | J: 84.4 ± 7.7 | 63.4 ± 7.1 | M: 67.1 ± 5.5 | J: 64.2 ± 5.2 | 25.6 ± 4.9 | M: 26.2 ± 4.7 | J: 28.8 ± 3.9 |
| F: 83.0 ± 6.2 | K: 92.7 ± 5.6 | F: 59.1 ± 6.5 | K: 67.1 ± 5.7 | F: 24.8 ± 5.0 | K: 26.3 ± 4.8 | ||||
| E: 82.6 ± 4.2 | E: 58.4 ± 7.1 | E: 22.7 ± 4.1 | |||||||
| p | <0.001 | <0.001 | <0.001 | ||||||
| Factor | SS | df | MS | F | p |
|---|---|---|---|---|---|
| Condyle | 174.395 | 1 | 174.395 | 28.434 | 0.000 |
| Condyle × sex | 0.102 | 1 | 0.102 | 0.017 | 0.898 |
| Error | 214.669 | 35 | 6.133 | ||
| Ramus | 264.337 | 1 | 264.337 | 28.894 | 0.000 |
| Ramus × sex | 0.681 | 1 | 0.681 | 0.074 | 0.787 |
| Error | 320.193 | 35 | 9.148 | ||
| Mandibular body | 134.577 | 1 | 134.577 | 55.113 | 0.000 |
| Mandibular body × sex | 5.742 | 1 | 5.742 | 2.352 | 0.134 |
| Error | 85.464 | 35 | 2.442 |
| Factor | SS | df | MS | F | p |
|---|---|---|---|---|---|
| Condyle | 167.697 | 1 | 167.697 | 27.849 | 0.000 |
| Condyle × Population | 10.040 | 2 | 5.020 | 0.834 | 0.443 |
| Error | 204.732 | 34 | 6.022 | ||
| Ramus | 271.593 | 1 | 271.593 | 30.695 | 0.000 |
| Ramus × Population | 20.042 | 2 | 10.021 | 1.133 | 0.334 |
| Error | 300.832 | 34 | 8.848 | ||
| Mandibular body | 131.338 | 1 | 131.338 | 55.506 | 0.000 |
| Mandibular body × Population | 10.756 | 2 | 5.378 | 2.273 | 0.118 |
| Error | 80.451 | 34 | 2.366 |
| Volumetric Measurements (mm3) | Hemi-Mandibular | Mandibular Body | Ramus | Condyle | ||||
|---|---|---|---|---|---|---|---|---|
| N-Dev side—Dev side | 2.7 ± 4.1 (p < 0.001) | M: 2.3 ± 3.9 | 1.5 ± 4.2 (p = 0.030) | M: 0.8 ± 3.6 | 1.2 ± 2.3 (p = 0.004) | M: 1.4 ± 1.3 | 0.6 ± 1.1 (p = 0.002) | M: 0.6 ± 0.7 |
| F: 3.3 ± 4.4 | F: 2.3 ± 4.7 | F: 1.0 ± 3.2 | F: 0.6 ± 1.5 | |||||
| J: 1.6 ± 4.2 | J: 0.1 ± 3.9 | J: 1.5 ± 1.4 | J: 0.5 ± 0.7 | |||||
| K: 3.2 ± 3.5 | K: 1.2 ± 2.2 | K: 2.0 ± 2.2 | K: 0.9 ± 1.5 | |||||
| E: 2.9 ± 4.1 | E: 2.9 ± 5.8 | E: 0.0 ± 2.6 | E: 0.3 ± 0.7 | |||||
| Factor | SS | df | MS | F | p |
|---|---|---|---|---|---|
| Condyle | 6.954 | 1 | 6.954 | 10.821 | 0.002 |
| Condyle × sex | 0.007 | 1 | 0.007 | 0.012 | 0.915 |
| Error | 22.494 | 35 | 0.643 | ||
| Ramus | 25.545 | 1 | 25.545 | 9.087 | 0.005 |
| Ramus × sex | 0.939 | 1 | 0.939 | 0.334 | 0.567 |
| Error | 98.396 | 35 | 2.811 | ||
| Mandibular body | 47.526 | 1 | 47.526 | 5.470 | 0.025 |
| Mandibular body × sex | 9.877 | 1 | 9.877 | 1.137 | 0.294 |
| Error | 304.089 | 35 | 8.688 | ||
| Hemi-mandibular | 141.900 | 1 | 141.900 | 16.549 | 0.000 |
| Hemi-mandibular × sex | 4.662 | 1 | 4.662 | 0.544 | 0.466 |
| Error | 300.101 | 35 | 8.574 |
| Factor | SS | df | MS | F | p |
|---|---|---|---|---|---|
| Condyle | 5.674 | 1 | 5.674 | 9.044 | 0.005 |
| Condyle × Population | 1.172 | 2 | 0.586 | 0.934 | 0.403 |
| Error | 21.330 | 34 | 0.627 | ||
| Ramus | 23.400 | 1 | 23.400 | 9.553 | 0.004 |
| Ramus × Population | 16.055 | 2 | 8.028 | 3.277 | 0.050 |
| Error | 83.279 | 34 | 2.449 | ||
| Mandibular body | 32.907 | 1 | 32.907 | 3.830 | 0.059 |
| Mandibular body × Population | 21.836 | 2 | 10.918 | 1.271 | 0.294 |
| Error | 292.130 | 34 | 8.592 | ||
| Hemi-mandibular | 110.995 | 1 | 110.995 | 12.682 | 0.001 |
| Hemi-mandibular × Population | 7.195 | 2 | 3.598 | 0.411 | 0.666 |
| Error | 297.569 | 34 | 8.752 |
Disclaimer/Publisher’s Note: The statements, opinions and data contained in all publications are solely those of the individual author(s) and contributor(s) and not of MDPI and/or the editor(s). MDPI and/or the editor(s) disclaim responsibility for any injury to people or property resulting from any ideas, methods, instructions or products referred to in the content. |
© 2023 by the authors. Licensee MDPI, Basel, Switzerland. This article is an open access article distributed under the terms and conditions of the Creative Commons Attribution (CC BY) license (https://creativecommons.org/licenses/by/4.0/).
Share and Cite
Hikosaka, Y.; Koizumi, S.; Kim, Y.-I.; Adel, M.; Nadim, M.; Hikita, Y.; Yamaguchi, T. Comparison of Mandibular Volume and Linear Measurements in Patients with Mandibular Asymmetry. Diagnostics 2023, 13, 1331. https://doi.org/10.3390/diagnostics13071331
Hikosaka Y, Koizumi S, Kim Y-I, Adel M, Nadim M, Hikita Y, Yamaguchi T. Comparison of Mandibular Volume and Linear Measurements in Patients with Mandibular Asymmetry. Diagnostics. 2023; 13(7):1331. https://doi.org/10.3390/diagnostics13071331
Chicago/Turabian StyleHikosaka, Yuki, So Koizumi, Yong-Il Kim, Mohamed Adel, Mohamed Nadim, Yu Hikita, and Tetsutaro Yamaguchi. 2023. "Comparison of Mandibular Volume and Linear Measurements in Patients with Mandibular Asymmetry" Diagnostics 13, no. 7: 1331. https://doi.org/10.3390/diagnostics13071331
APA StyleHikosaka, Y., Koizumi, S., Kim, Y.-I., Adel, M., Nadim, M., Hikita, Y., & Yamaguchi, T. (2023). Comparison of Mandibular Volume and Linear Measurements in Patients with Mandibular Asymmetry. Diagnostics, 13(7), 1331. https://doi.org/10.3390/diagnostics13071331