
The Assessment of Serum Fibronectin Levels as a Potential Biomarker for the Severity of Drug-Sensitive Pulmonary Tuberculosis: A Pilot Study

 , , , , , , ,
Abstract
:1. Introduction
2. Materials and Methods
2.1. Definitions
2.2. Inclusion and Exclusion Criteria
- Inclusion criteria for cases:
- Exclusion criteria for cases:
- Inclusion criteria for the controls:
- Exclusion criteria for the controls:
2.3. Chest X-ray Assessment
2.4. Sputum Examination
2.5. Cartridge-Based Nucleic Acid Amplification Test (CB-NAAT, GeneXpert)
2.6. Collection of Blood for Analysis
2.7. Enzyme-Linked Immunosorbent Assay
2.8. Statistical Analysis
3. Results
4. Discussion
5. Conclusions
Supplementary Materials
Author Contributions
Funding
Institutional Review Board Statement
Informed Consent Statement
Data Availability Statement
Acknowledgments
Conflicts of Interest
References
- Global Tuberculosis Report, 2022; World Health Organization: Geneva, Switzerland, 2022; Available online: https://www.who.int/publications/i/item/9789240061729 (accessed on 17 September 2023).
- Subbaraman, R.; Thomas, B.E.; Kumar, J.V.; Thiruvengadam, K.; Khandewale, A.; Kokila, S.; Lubeck-Schricker, M.; Ranjith Kumar, M.; Gaurkhede, G.R.; Walgude, A.S.; et al. Understanding Nonadherence to Tuberculosis Medications in India Using Urine Drug Metabolite Testing: A Cohort Study. Open Forum Infect. Dis. 2021, 8, ofab190. [Google Scholar] [CrossRef] [PubMed]
- National Strategic Plan for Tuberculosis Elimination 2017–2025, Central TB Division, Directorate General of Health Services, Ministry of Health with Family Welfare. 2017. Available online: https://tbcindia.gov.in (accessed on 26 November 2023).
- Schorey, J.S.; Holsti, M.A.; Ratliff, T.L.; Allen, P.M.; Brown, E.J. Characterization of the Fibronectin-Attachment Protein of Mycobacterium avium Reveals a Fibronectin-Binding Motif Conserved among Mycobacteria. Mol. Microbiol. 1996, 21, 321–329. [Google Scholar] [CrossRef] [PubMed]
- Verbelen, C.; Dufrêne, Y.F. Direct Measurement of Mycobacterium–Fibronectin Interactions. Integr. Biol. 2009, 1, 296. [Google Scholar] [CrossRef] [PubMed]
- Meena, P.R.; Monu; Meena, L.S. Fibronectin Binding Protein and Ca2+ Play an Access Key Role to Mediate Pathogenesis in Mycobacterium Tuberculosis: An Overview: Role of FnBP and Ca2+ in Pathogenesis. Biotechnol. Appl. Biochem. 2016, 63, 820–826. [Google Scholar] [CrossRef] [PubMed]
- Pasula, R.; Wisniowski, P.; Martin, W.J. Fibronectin Facilitates Mycobacterium Tuberculosis Attachment to Murine Alveolar Macrophages. Infect. Immun. 2002, 70, 1287–1292. [Google Scholar] [CrossRef] [PubMed]
- Hall-Stoodley, L.; Watts, G.; Crowther, J.E.; Balagopal, A.; Torrelles, J.B.; Robison-Cox, J.; Bargatze, R.F.; Harmsen, A.G.; Crouch, E.C.; Schlesinger, L.S. Mycobacterium tuberculosis Binding to Human Surfactant Proteins A and D, Fibronectin, and Small Airway Epithelial Cells under Shear Conditions. Infect. Immun. 2006, 74, 3587–3596. [Google Scholar] [CrossRef] [PubMed]
- Bentley-Hibbert, S.I.; Quan, X.; Newman, T.; Huygen, K.; Godfrey, H.P. Pathophysiology of Antigen 85 in Patients with Active Tuberculosis: Antigen 85 Circulates as Complexes with Fibronectin and Immunoglobulin G. Infect. Immun. 1999, 67, 581–588. [Google Scholar] [CrossRef]
- Vinod, V.; Vijayrajratnam, S.; Vasudevan, A.K.; Biswas, R. The Cell Surface Adhesins of Mycobacterium tuberculosis. Microbiol. Res. 2020, 232, 126392. [Google Scholar] [CrossRef]
- Kuo, C.-J.; Gao, J.; Huang, J.-W.; Ko, T.-P.; Zhai, C.; Ma, L.; Liu, W.; Dai, L.; Chang, Y.-F.; Chen, T.-H.; et al. Functional and Structural Investigations of Fibronectin-Binding Protein Apa from Mycobacterium tuberculosis. Biochim. Biophys. Acta BBA Gen. Subj. 2019, 1863, 1351–1359. [Google Scholar] [CrossRef]
- Speziale, P.; Arciola, C.R.; Pietrocola, G. Fibronectin and Its Role in Human Infective Diseases. Cells 2019, 8, 1516. [Google Scholar] [CrossRef]
- Abou-Zeid, C.; Garbe, T.; Lathigra, R.; Wiker, H.G.; Harboe, M.; Rook, G.A.; Young, D.B. Genetic and Immunological Analysis of Mycobacterium tuberculosis Fibronectin-Binding Proteins. Infect. Immun. 1991, 59, 2712–2718. [Google Scholar] [CrossRef] [PubMed]
- Villar, M.; Garcia-Bragado, F.; Rodrigo, M.J.; Schwartz, S.; Vilardell, M. Fibronectin Concentration in Pleural Effusions. Chest 1987, 92, 1129–1130. [Google Scholar] [CrossRef] [PubMed]
- Albera, C.; Mabritto, I.; Ghio, P.; Solidoro, P.; Marchetti, L.; Pozzi, E. Adenosine Deaminase Activity and Fibronectin Levels in Bronchoalveolar Lavage Fluid in Sarcoidosis and Tuberculosis. Sarcoidosis 1993, 10, 18–25. [Google Scholar] [PubMed]
- Wang, C.; Li, Y.-Y.; Li, X.; Wei, L.-L.; Yang, X.-Y.; Xu, D.-D.; Jiang, T.-T.; Li, Z.-J.; Chen, Z.-L.; Zhang, X.; et al. Serum Complement C4b, Fibronectin, and Prolidase Are Associated with the Pathological Changes of Pulmonary Tuberculosis. BMC Infect. Dis. 2014, 14, 52. [Google Scholar] [CrossRef] [PubMed]
- Technical and Operational Guidelines for TB Control in India 2016: Central TB Division. Available online: https://tbcindia.gov.in/index1.php?lang=1&level=2&sublinkid=4573&lid=3177 (accessed on 20 November 2023).
- Goodman, L.R. Felson’s Principles of Chest Roentgenology, A Programmed Text, 5th ed.; Elsevier: Amsterdam, The Netherlands, 2020; Available online: https://www.asia.elsevierhealth.com/felsons-principles-of-chest-roentgenology-a-programmed-text-9780323625678.html (accessed on 20 November 2023).
- Lindberg, A.; Jonsson, A.-C.; Rönmark, E.; Lundgren, R.; Larsson, L.-G.; Lundbäck, B. Ten-Year Cumulative Incidence of COPD and Risk Factors for Incident Disease in a Symptomatic Cohort. Chest 2005, 127, 1544–1552. [Google Scholar] [CrossRef] [PubMed]
- American Diabetes Association. Diagnosis and Classification of Diabetes Mellitus. Diabetes Care 2010, 33, S62–S69. [Google Scholar] [CrossRef] [PubMed]
- Handbook on Tuberculosis Laboratory Diagnostic Methods in the European Union—Updated 2018. Available online: https://www.ecdc.europa.eu/en/publications-data/handbook-tuberculosis-laboratory-diagnostic-methods-european-union-updated-2018 (accessed on 17 September 2023).
- Chandra, R.K. Numerical and Functional Deficiency in T Helper Cells in Protein Energy Malnutrition. Clin. Exp. Immunol. 1983, 51, 126–132. [Google Scholar] [PubMed]
- Chandra, R. Nutrition and the Immune System: An Introduction. Am. J. Clin. Nutr. 1997, 66, 460S–463S. [Google Scholar] [CrossRef]
- De Rosa, V.; Galgani, M.; Santopaolo, M.; Colamatteo, A.; Laccetti, R.; Matarese, G. Nutritional Control of Immunity: Balancing the Metabolic Requirements with an Appropriate Immune Function. Semin. Immunol. 2015, 27, 300–309. [Google Scholar] [CrossRef]
- Schwenk, A.; Macallan, D.C. Tuberculosis, Malnutrition and Wasting. Curr. Opin. Clin. Nutr. Metab. Care 2000, 3, 285–291. [Google Scholar] [CrossRef]
- Harries, A.D.; Nkhoma, W.A.; Thompson, P.J.; Nyangulu, D.S.; Wirima, J.J. Nutritional Status in Malawian Patients with Pulmonary Tuberculosis and Response to Chemotherapy. Eur. J. Clin. Nutr. 1988, 42, 445–450. [Google Scholar]
- Onwubalili, J.K. Malnutrition among Tuberculosis Patients in Harrow, England. Eur. J. Clin. Nutr. 1988, 42, 363–366. [Google Scholar]
- Zachariah, R.; Spielmann, M.P.; Harries, A.D.; Salaniponi, F.M.L. Moderate to Severe Malnutrition in Patients with Tuberculosis Is a Risk Factor Associated with Early Death. Trans. R. Soc. Trop. Med. Hyg. 2002, 96, 291–294. [Google Scholar] [CrossRef]
- Bernabe-Ortiz, A.; Carcamo, C.P.; Sanchez, J.F.; Rios, J. Weight Variation over Time and Its Association with Tuberculosis Treatment Outcome: A Longitudinal Analysis. PLoS ONE 2011, 6, e18474. [Google Scholar] [CrossRef]
- Nandennavar, M.; Cyriac, S.; Krishnakumar; Sagar, T. Immune Hemolytic Anemia in a Patient with Tuberculous Lymphadenitis. J. Glob. Infect. Dis. 2011, 3, 89. [Google Scholar] [CrossRef]
- Saboor, M. Disorders Associated with Malabsorption of Iron; a Critical Review. Pak. J. Med. Sci. 2015, 31, 1549–1553. [Google Scholar] [CrossRef]
- Chhabra, S.; Kashyap, A.; Bhagat, M.; Mahajan, R.; Sethi, S. Anemia and Nutritional Status in Tuberculosis Patients. Int. J. Appl. Basic Med. Res. 2021, 11, 226. [Google Scholar] [CrossRef]
- Davis, S.L.; Littlewood, T.J. The Investigation and Treatment of Secondary Anaemia. Blood Rev. 2012, 26, 65–71. [Google Scholar] [CrossRef]
- Dorhoi, A.; Kaufmann, S.H.E. Pathology and Immune Reactivity: Understanding Multidimensionality in Pulmonary Tuberculosis. Semin. Immunopathol. 2016, 38, 153–166. [Google Scholar] [CrossRef]
- Weiss, G.; Goodnough, L.T. Anemia of Chronic Disease. N. Engl. J. Med. 2005, 352, 1011–1023. [Google Scholar] [CrossRef]
- Ludwiczek, S.; Aigner, E.; Theurl, I.; Weiss, G. Cytokine-Mediated Regulation of Iron Transport in Human Monocytic Cells. Blood 2003, 101, 4148–4154. [Google Scholar] [CrossRef] [PubMed]
- Pietrangelo, A. Physiology of Iron Transport and the Hemochromatosis Gene. Am. J. Physiol. Gastrointest. Liver Physiol. 2002, 282, G403–G414. [Google Scholar] [CrossRef] [PubMed]
- Ganz, T. Molecular Pathogenesis of Anemia of Chronic Disease. Pediatr. Blood Cancer 2006, 46, 554–557. [Google Scholar] [CrossRef] [PubMed]
- Nemeth, E.; Rivera, S.; Gabayan, V.; Keller, C.; Taudorf, S.; Pedersen, B.K.; Ganz, T. IL-6 Mediates Hypoferremia of Inflammation by Inducing the Synthesis of the Iron Regulatory Hormone Hepcidin. J. Clin. Investig. 2004, 113, 1271–1276. [Google Scholar] [CrossRef] [PubMed]
- Ganz, T.; Nemeth, E. Hepcidin and Iron Homeostasis. Biochim. Biophys. Acta BBA Mol. Cell Res. 2012, 1823, 1434–1443. [Google Scholar] [CrossRef] [PubMed]
- Collins, J.F.; Wessling-Resnick, M.; Knutson, M.D. Hepcidin Regulation of Iron Transport. J. Nutr. 2008, 138, 2284–2288. [Google Scholar] [CrossRef]
- Cronje, L.; Bornman, L. Iron Overload and Tuberculosis: A Case for Iron Chelation Therapy. Int. J. Tuberc. Lung Dis. Off. J. Int. Union Tuberc. Lung Dis. 2005, 9, 2–9. [Google Scholar]
- Konijn, A.M. Iron Metabolism in Inflammation. Baillières Clin. Haematol. 1994, 7, 829–849. [Google Scholar] [CrossRef]
- Aisen, P. Transferrin Metabolism and the Liver. Semin. Liver Dis. 1984, 4, 193–206. [Google Scholar] [CrossRef]
- Di Girolamo, N.; Underwood, A.; McCluskey, P.J.; Wakefield, D. Functional Activity of Plasma Fibronectin in Patients with Diabetes Mellitus. Diabetes 1993, 42, 1606–1613. [Google Scholar] [CrossRef]
- Roy, S.; Sala, R.; Cagliero, E.; Lorenzi, M. Overexpression of Fibronectin Induced by Diabetes or High Glucose: Phenomenon with a Memory. Proc. Natl. Acad. Sci. USA 1990, 87, 404–408. [Google Scholar] [CrossRef]
- Roy, S.; Cagliero, E.; Lorenzi, M. Fibronectin Overexpression in Retinal Microvessels of Patients with Diabetes. Investig. Ophthalmol. Vis. Sci. 1996, 37, 258–266. [Google Scholar]
- Gorin, Y.; Block, K.; Hernandez, J.; Bhandari, B.; Wagner, B.; Barnes, J.L.; Abboud, H.E. Nox4 NAD(P)H Oxidase Mediates Hypertrophy and Fibronectin Expression in the Diabetic Kidney. J. Biol. Chem. 2005, 280, 39616–39626. [Google Scholar] [CrossRef]
- Khan, Z.A.; Cukiernik, M.; Gonder, J.R.; Chakrabarti, S. Oncofetal Fibronectin in Diabetic Retinopathy. Investig. Ophthalmol. Vis. Sci. 2004, 45, 287–295. [Google Scholar] [CrossRef]

| Normal (n = 11) | PTB (n = 78) | Total (n = 89) | p Value | |
|---|---|---|---|---|
| Age (years) | 0.1681 † | |||
| Mean (SD) | 40.3 ± 15.3 | 47.0 ± 15.1 | 46.2 ± 15.2 | |
| Range | 26.0–75.0 | 19.0–75.0 | 19.0–75.0 | |
| Gender | 0.5342 † | |||
| Female | 3.0 (27.3%) | 15.0 (19.2%) | 18.0 (20.2%) | |
| Male | 8.0 (72.7%) | 63.0 (80.8%) | 71.0 (79.8%) | |
| Weight (kg) | <0.001 * | |||
| Mean (SD) | 72.5 ± 0.8 | 55.6 ± 10.9 | 57.7 ± 11.9 | |
| Range | 58.0–84.0 | 36.0–84.0 | 36.0–84.0 | |
| Smoking | 0.708 † | |||
| No | 7.0 (63.6%) | 45.0 (57.7%) | 52.0 (58.4%) | |
| Yes | 4.0 (36.4%) | 33.0 (42.3%) | 37.0 (41.6%) | |
| Fibronectin (ng/mL) | 0.431 * | |||
| Mean (SD) | 108.8 ± 6.8 | 102.4 ± 26.7 | 103.2 ± 25.2 | |
| Range | 94.9–118.0 | 1.5–226.8 | 1.5–226.8 | |
| Total Protein (g/dL) | 0.094 * | |||
| Mean (SD) | 7.0 ± 0.4 | 6.6 ± 0.7 | 6.6 ± 0.7 | |
| Range | 6.2–7.6 | 5.2–8.5 | 5.2–8.5 | |
| Albumin (g/dL) | <0.001 * | |||
| Mean (SD) | 3.9 ± 0.5 | 3.3 ± 0.5 | 3.4 ± 0.5 | |
| Range | 3.4–4.9 | 2.1–4.6 | 2.1–4.9 | |
| RBS (mg/dL) | 0.0591 * | |||
| Mean (SD) | 97.3 ± 34.1 | 164.0 ± 114.4 | 155.7 ± 109.9 | |
| Range | 45.0–170.0 | 58.0–643.0 | 45.0–643.0 | |
| HB (g/dL) | <0.001 * | |||
| Mean (SD) | 14.7 ± 2.2 | 11.5 ± 1.9 | 11.9 ± 2.2 | |
| Range | 10.2–18.3 | 8.0–17.1 | 8.0–18.3 |
| Fibronectin | Mean (pg/dL) ± SD | p Value |
|---|---|---|
| Normal | 108.8 ± 6.8 | 0.4311 * |
| PTB | 102.4 ± 26.7 | |
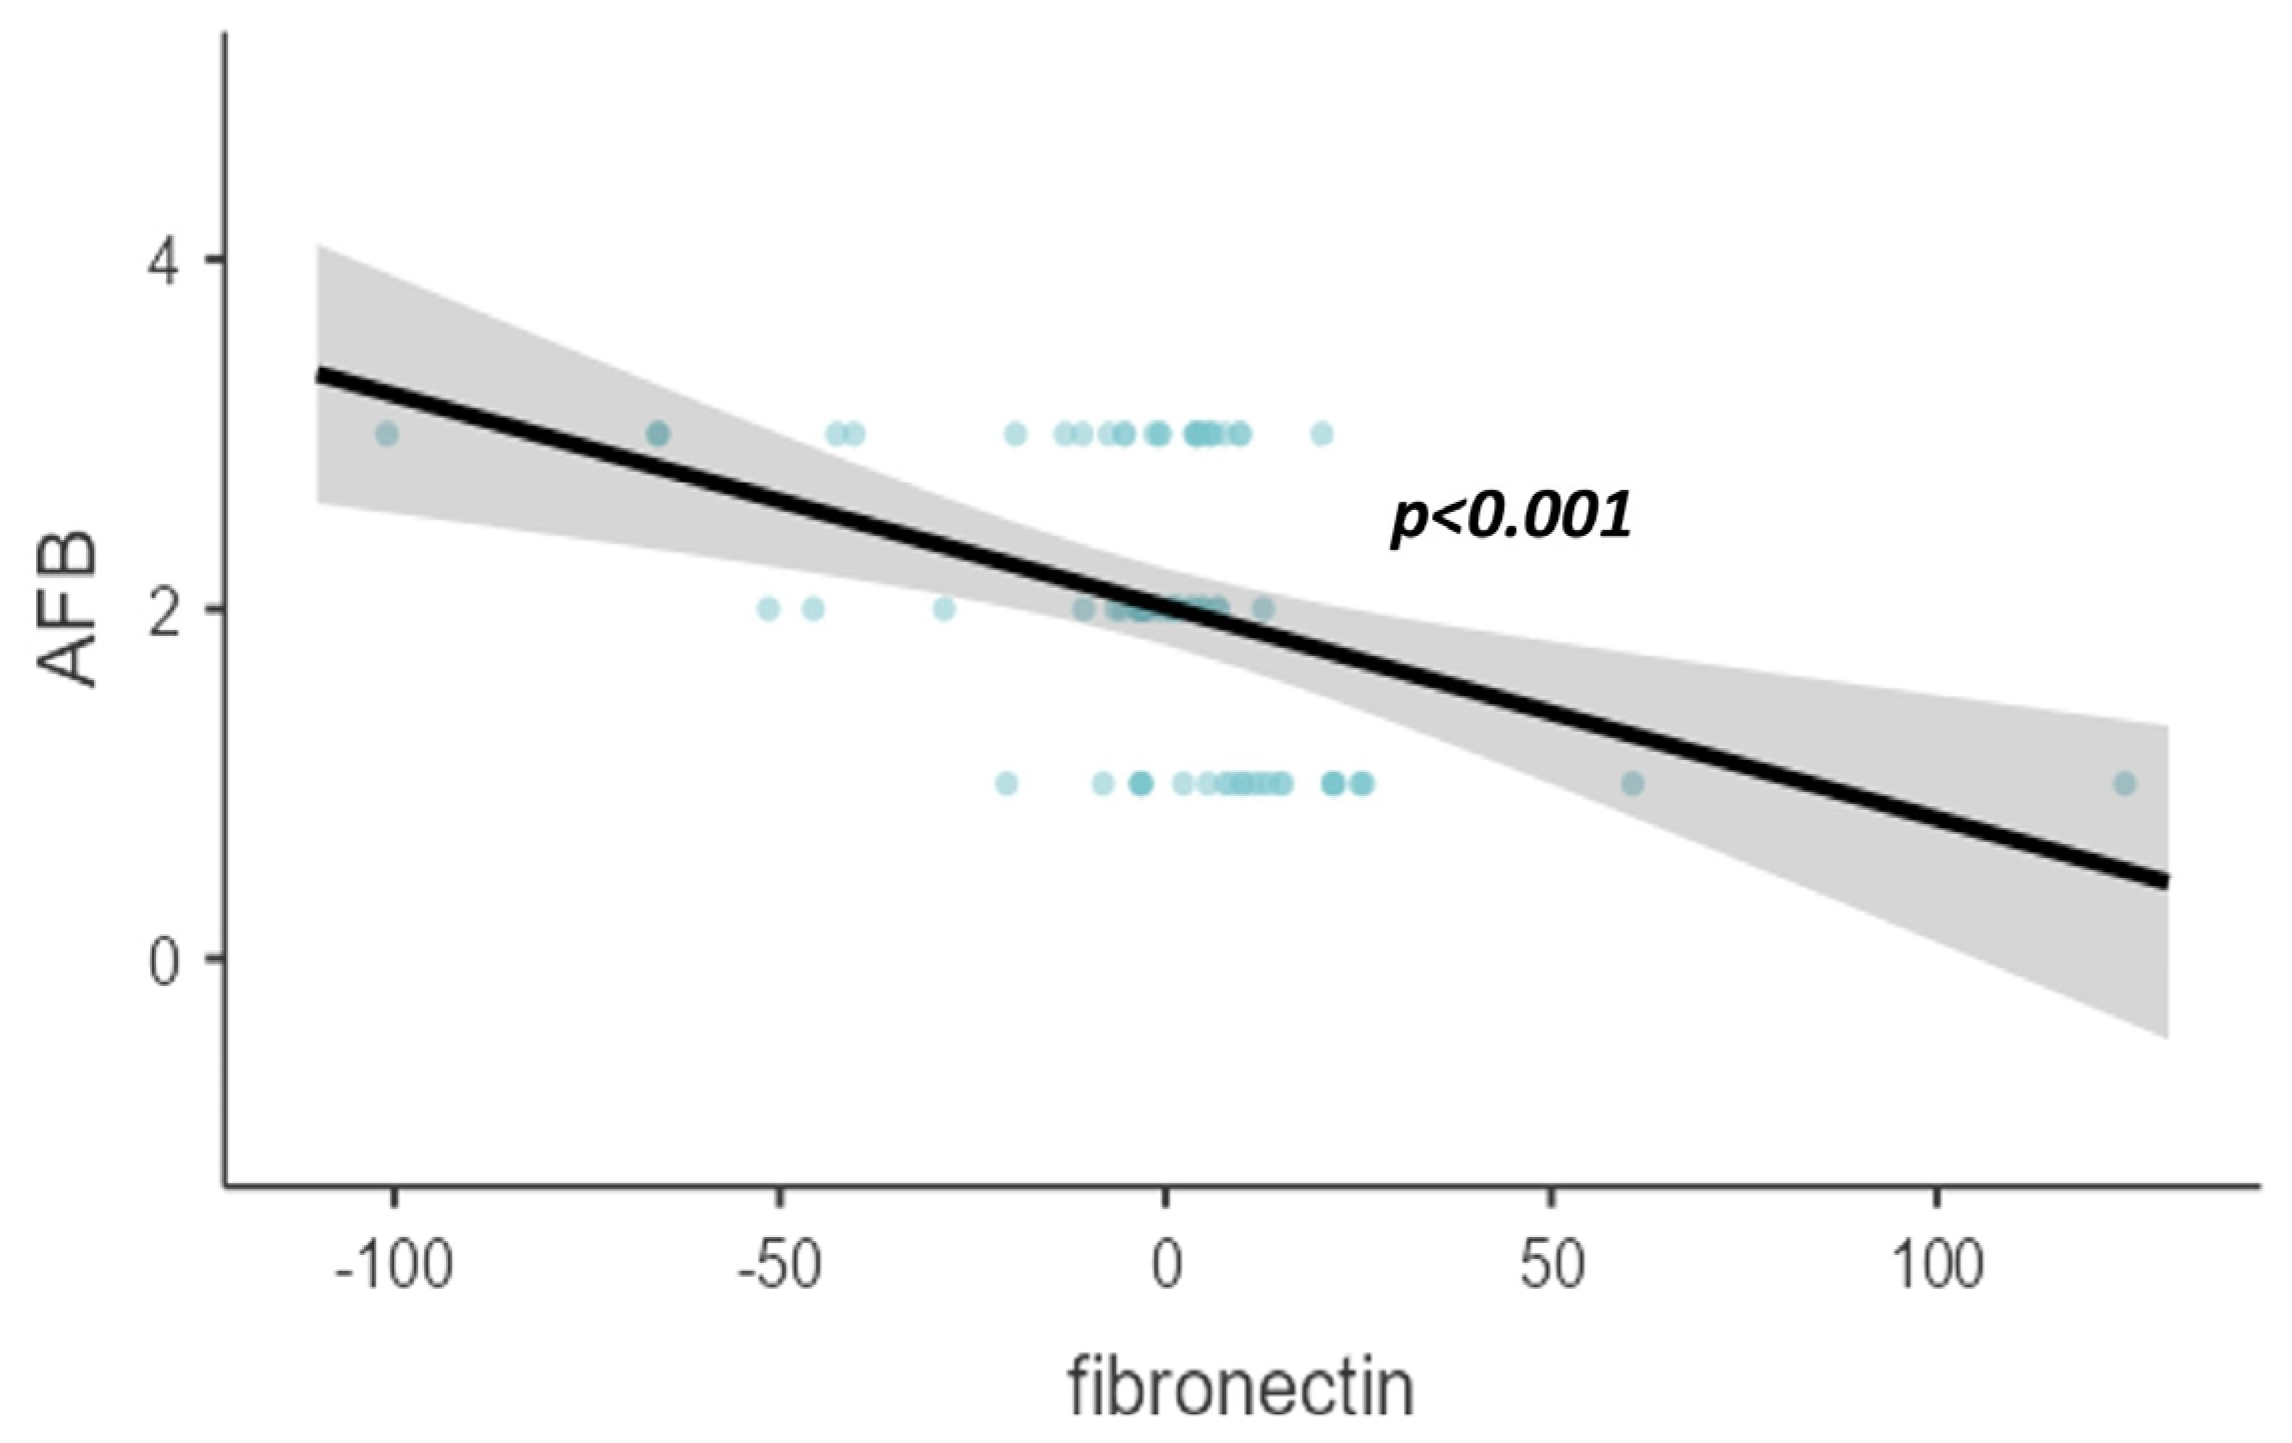
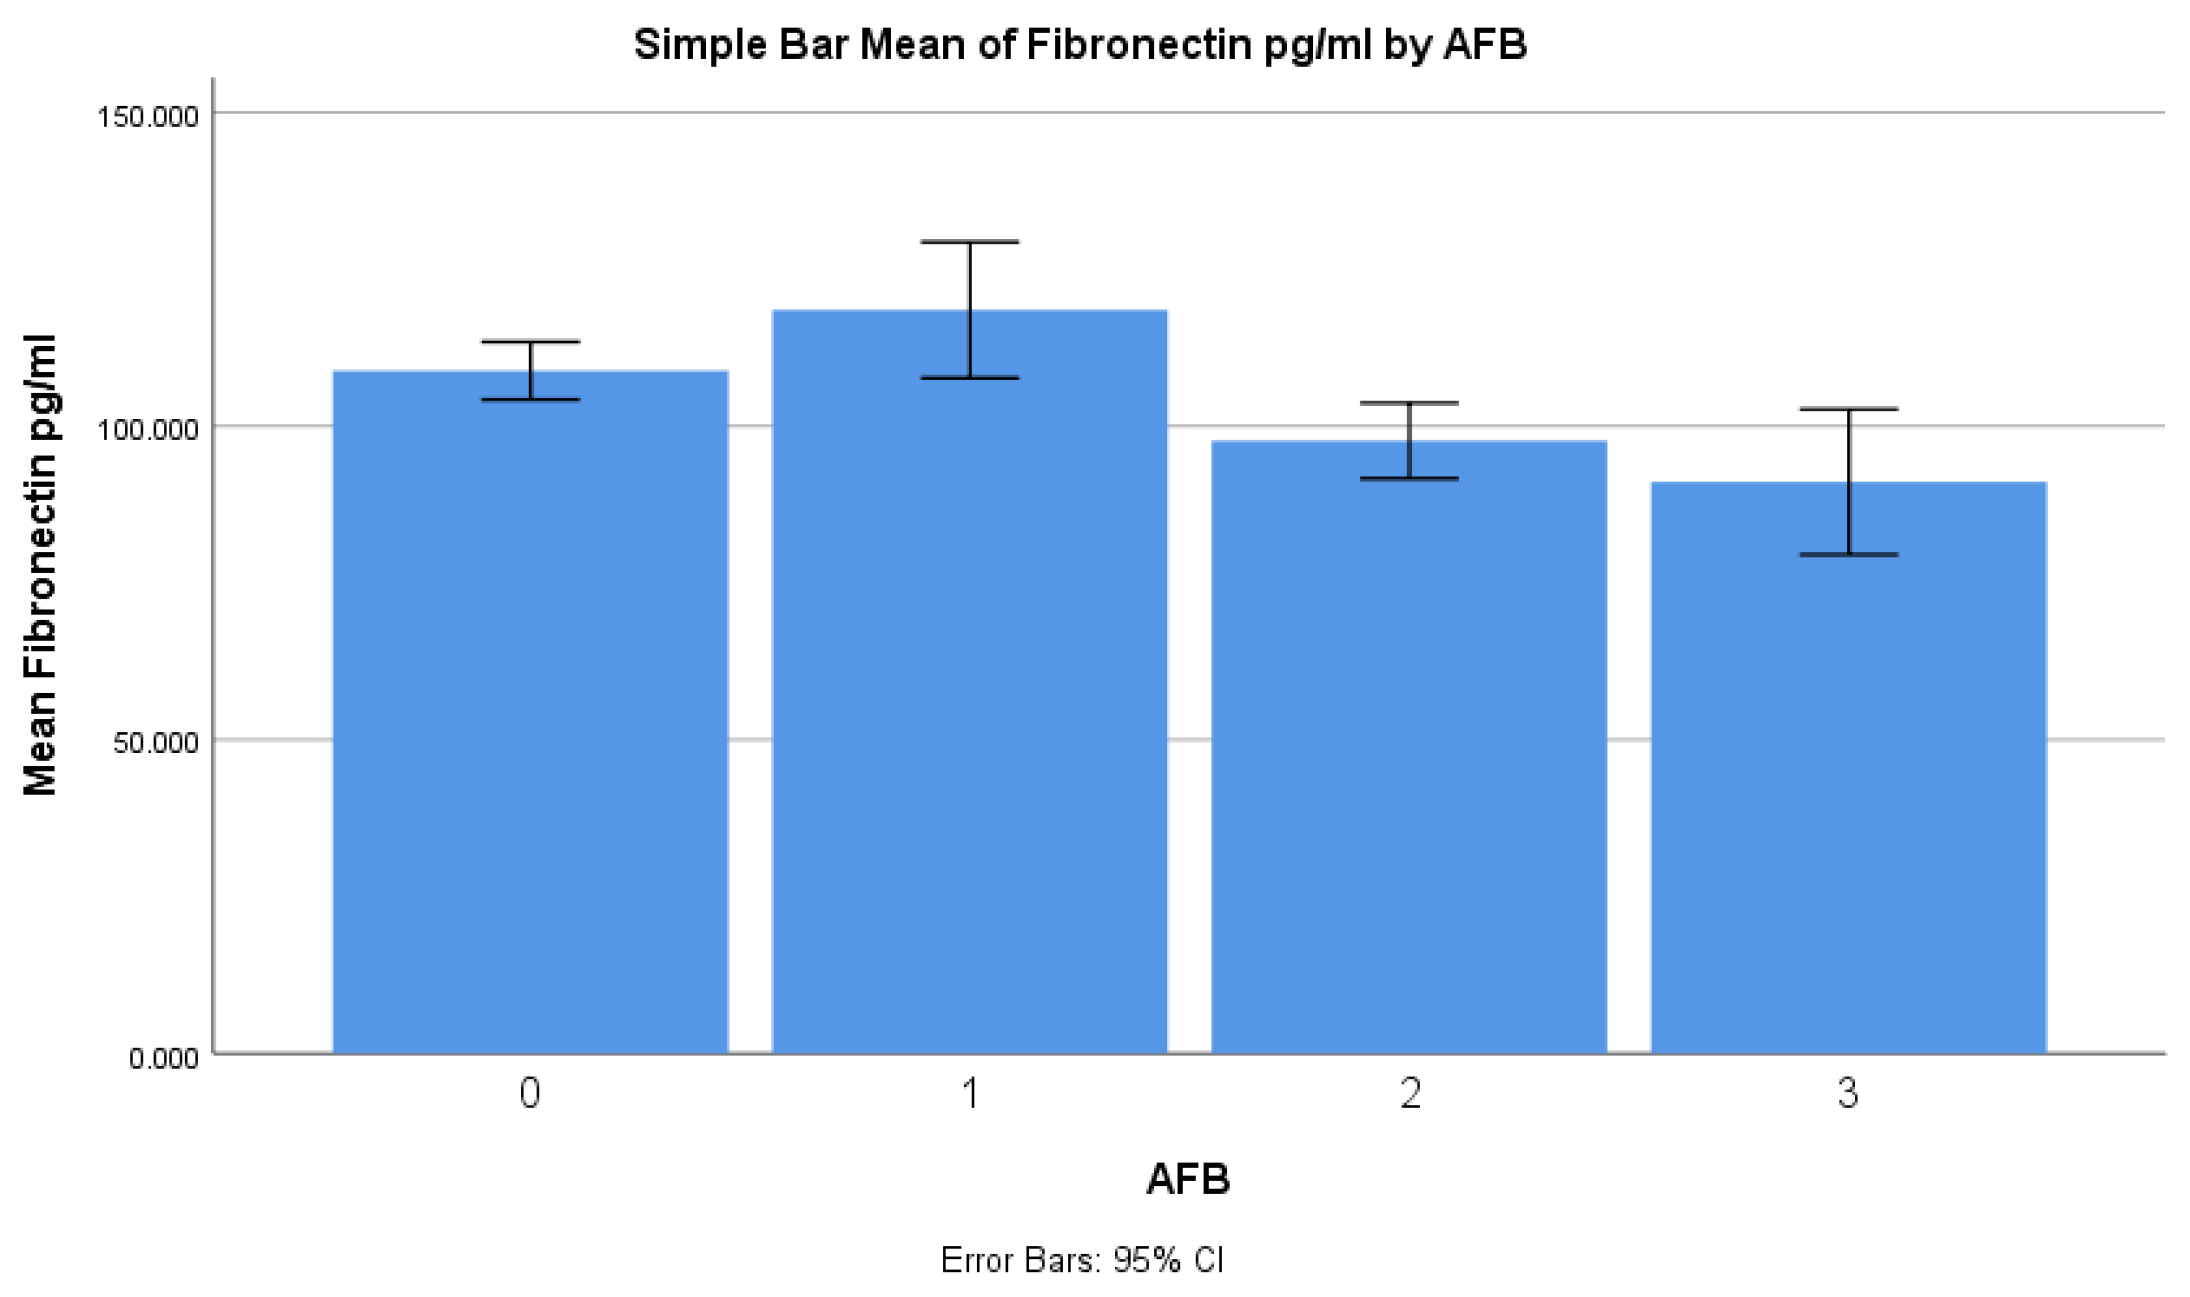
| Based on AFB | <0.001 * | |
| 1+ | 118.5 ± 26.9 | |
| 2+ | 97.7 ± 14.9 | |
| 3+ or 4+ | 91.1 ± 28.7 | |
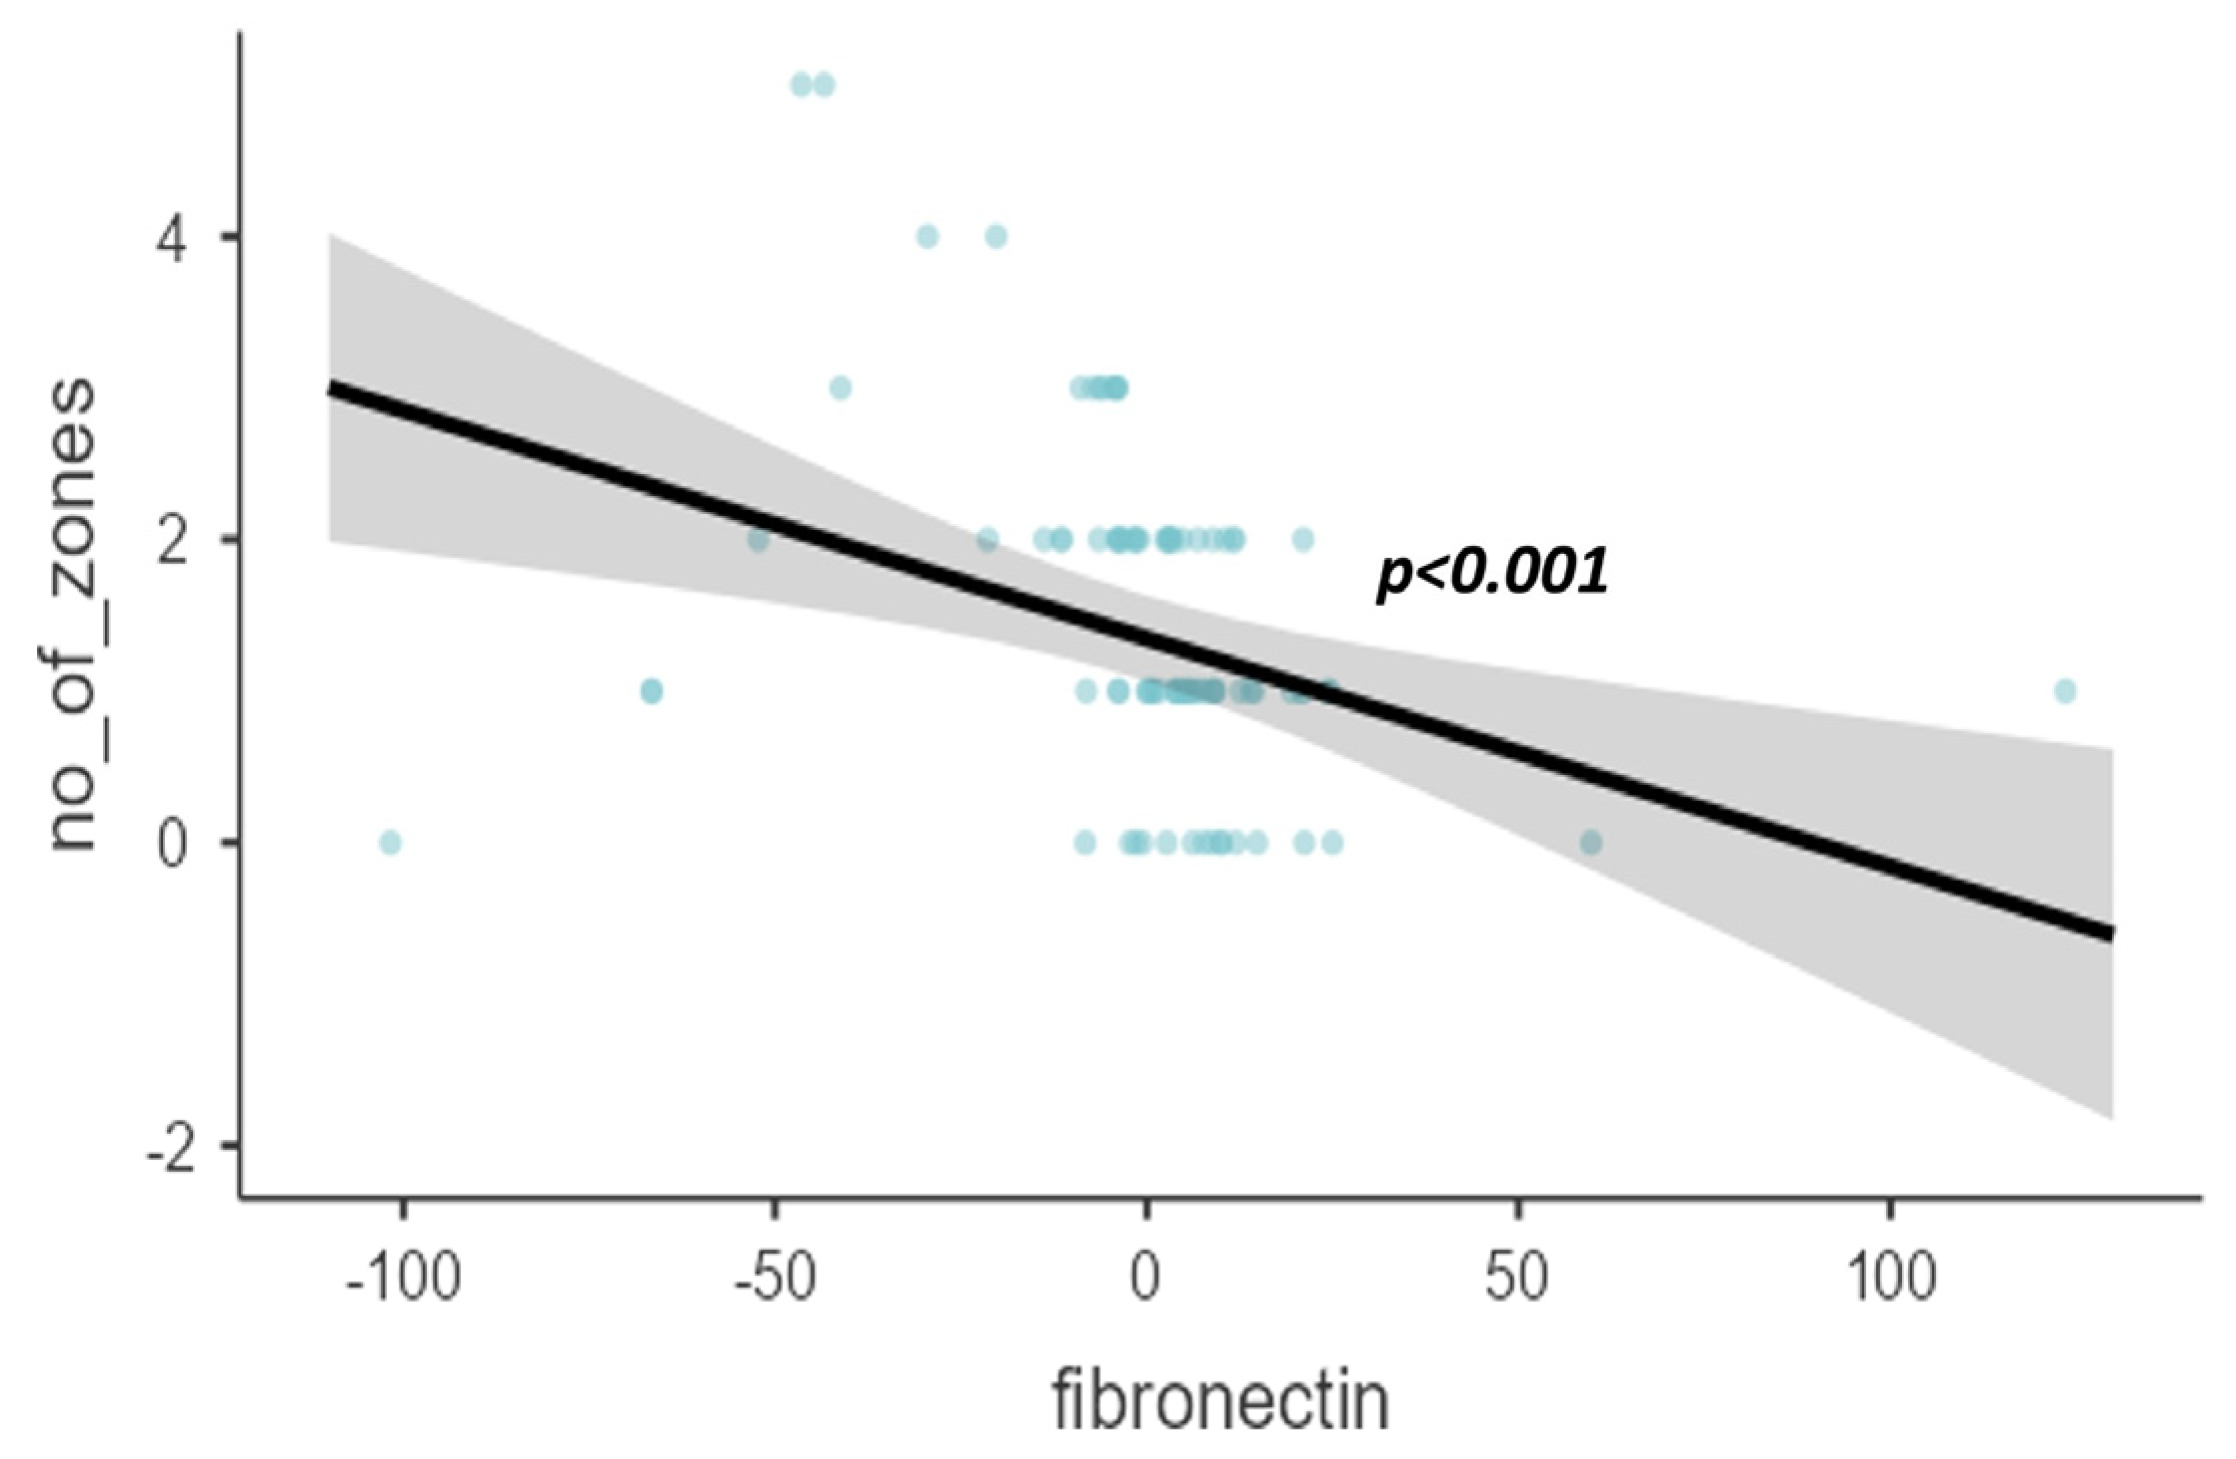
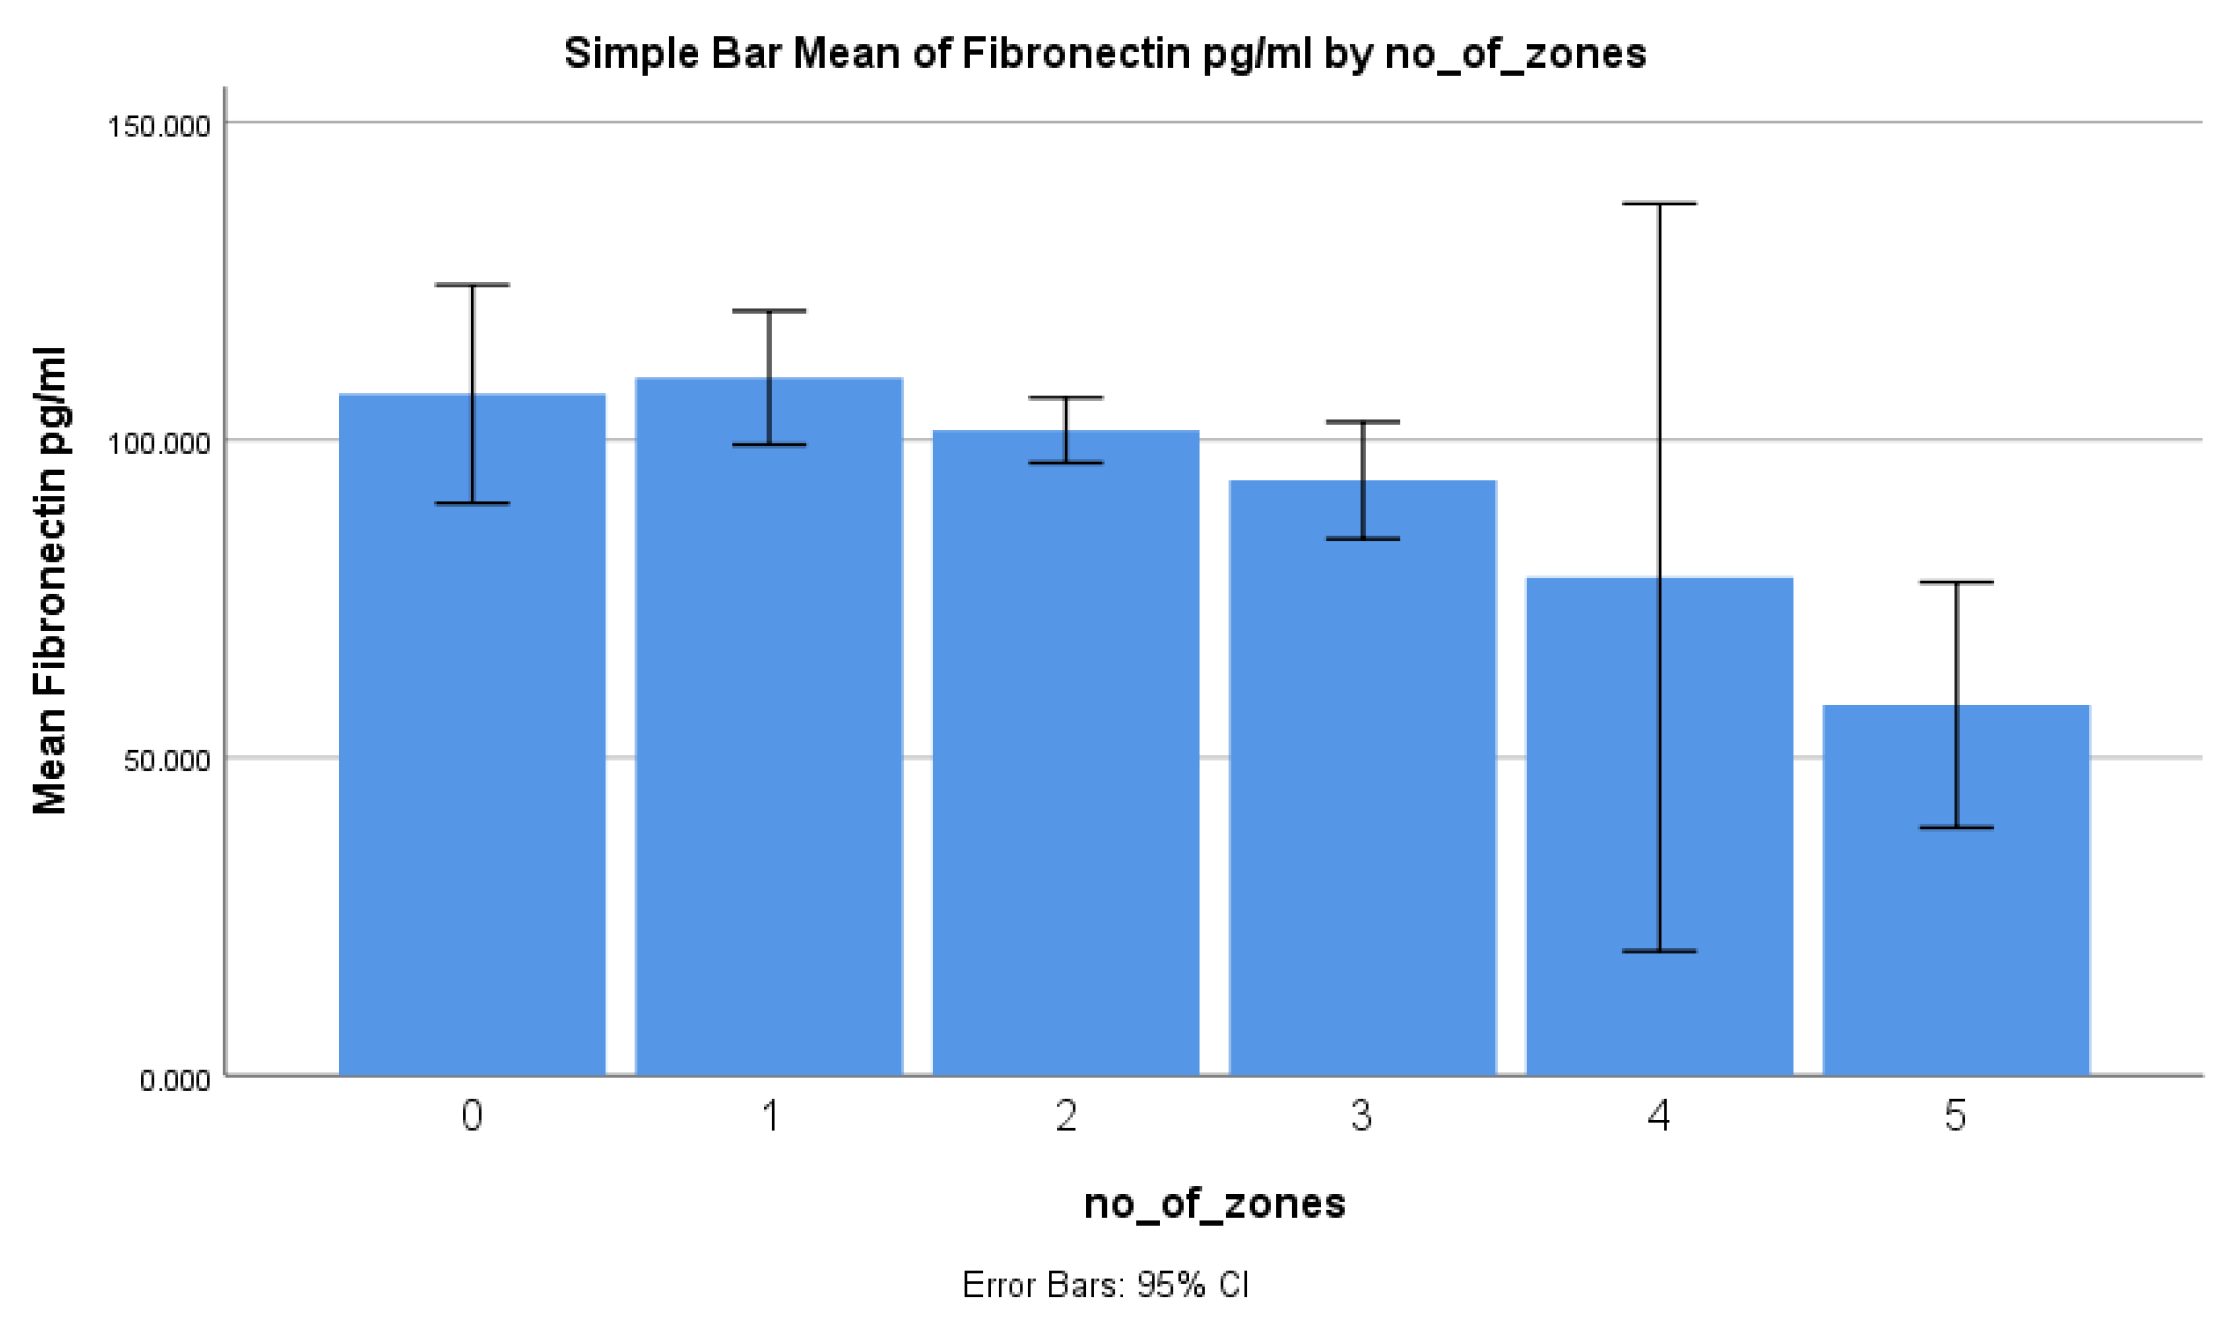
| Based on the number of zones | 0.0261 * | |
| 0 | 107.2 ± 32.2 | |
| 1 | 109.8 ± 29.2 | |
| 2 | 101.5 ± 13.2 | |
| 3 | 93.6 ± 12 | |
| 4 | 78.3 ± 6.5 | |
| 5 | 58.3 ± 2.1 | |
| Smoking | 0.0901 * | |
| No | 99.4 ± 25.4 | |
| Yes | 108.6 ± 24.2 | |
| Based on type of lesion on radiograph | 0.725 * | |
| Normal | 107.2 ± 32.2 | |
| Cavity | 102.1 ± 15.2 | |
| Consolidation | 102.4 ± 26.1 |
| Study Groups | <200 mg/dL | >200 mg/dL | Total | p Value |
|---|---|---|---|---|
| Total (n) | 57 | 21 | 78 | |
| Male (n, %) | 42.0 (73.7%) | 21.0 (100.0%) | 63.0 (80.8%) | 0.009 1 |
| Female (n, %) | 15.0 (26.3%) | 0.0 (0.0%) | 15.0 (19.2%) | |
| Fibronectin (pg/mL) (mean ± SD) | 104.2 ± 28.1 | 97.5 ± 22.4 | 102.4 ± 26.7 | 0.325 2 |
| Age < 40 (n, %) | 22.0 (38.6%) | 4.0 (19.0%) | 26.0 (33.3%) | 0.104 1 |
| Age > 40 (n, %) | 35.0 (61.4%) | 17.0 (81.0%) | 52.0 (66.7%) | |
| Non-smokers (n, %) | 34.0 (59.6%) | 11.0 (52.4%) | 45.0 (57.7%) | 0.564 1 |
| Smokers (n, %) | 23.0 (40.4%) | 10.0 (47.6%) | 33.0 (42.3%) | |
| AFB 0 (n, %) | - | - | - | 0.822 1 |
| AFB 1 (n, %) | 19.0 (33.3%) | 7.0 (33.3%) | 26.0 (33.3%) | |
| AFB 2 (n, %) | 20.0 (35.1%) | 6.0 (28.6%) | 26.0 (33.3%) | |
| AFB 3 (n, %) | 18.0 (31.6%) | 8.0 (38.1%) | 26.0 (33.3%) |
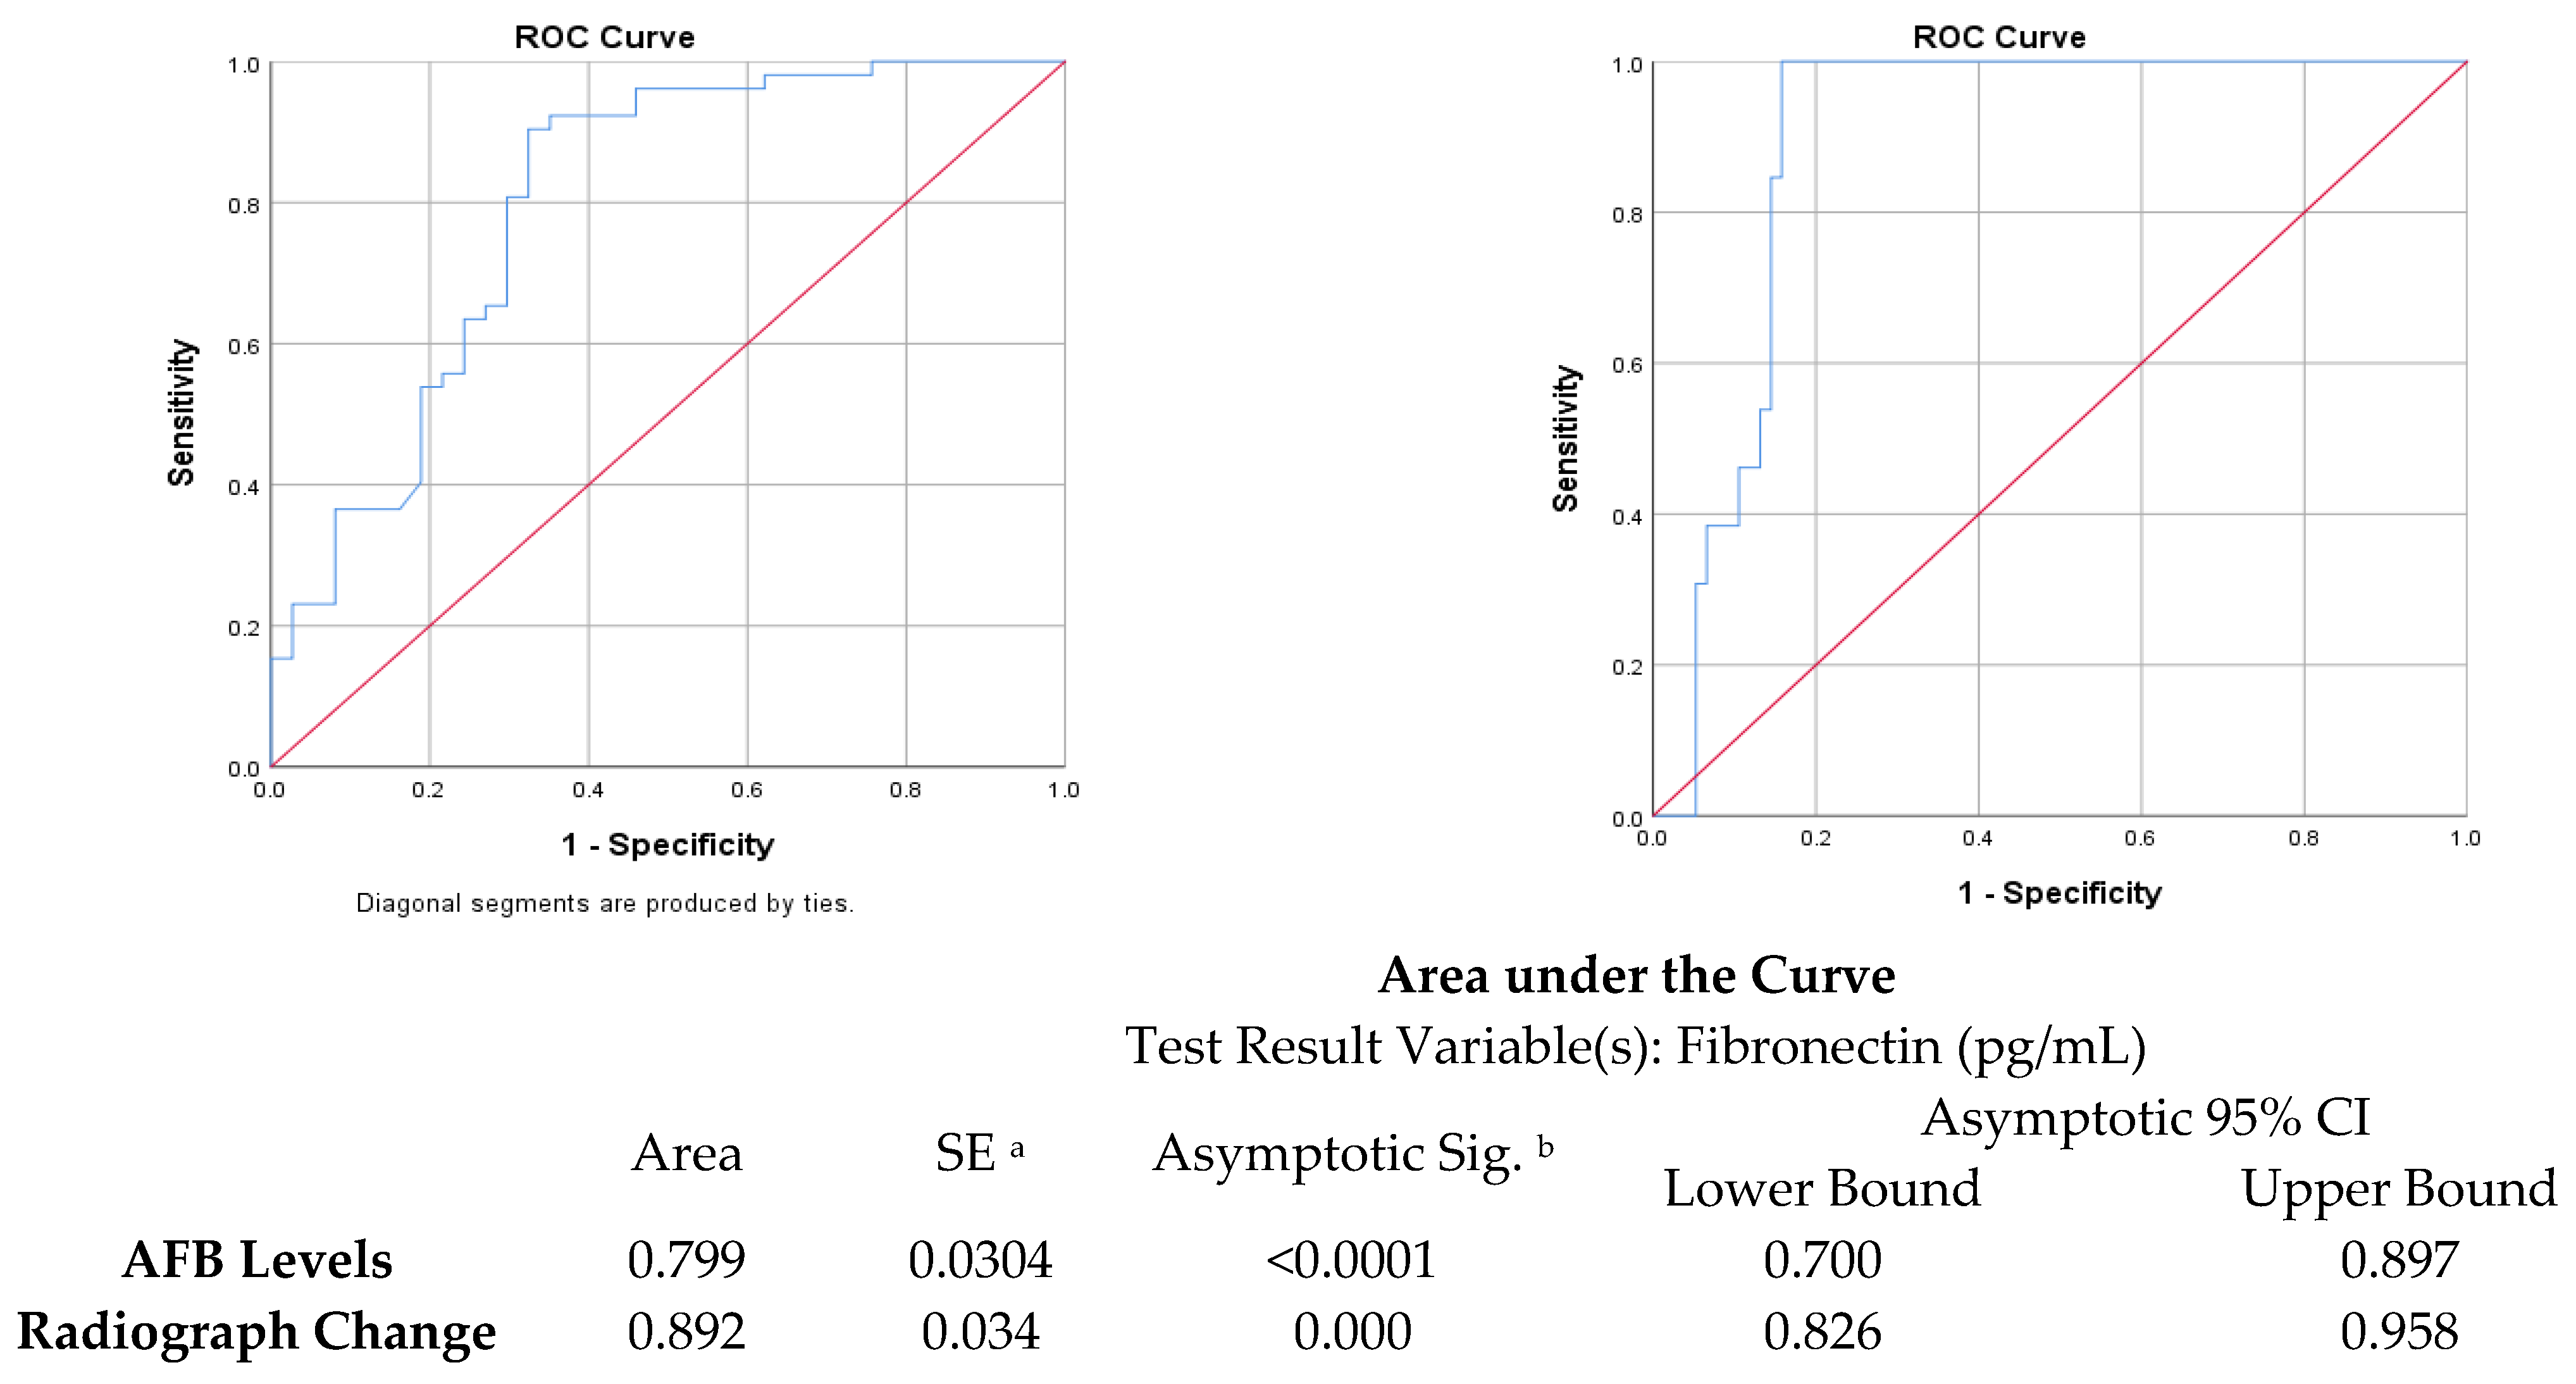
| Cut Point | Sensitivity (%) | Specificity (%) | Youden’s Index | AUC | |
|---|---|---|---|---|---|
| Fibronectin vs. chest X-ray zones | 99.3 ng/mL | 84.21% | 100% | 0.842 | 0.892 |
| Fibronectin vs. sputum AFB | 109.4 ng/mL | 67.57% | 90.38% | 0.58 | 0.799 |
Disclaimer/Publisher’s Note: The statements, opinions and data contained in all publications are solely those of the individual author(s) and contributor(s) and not of MDPI and/or the editor(s). MDPI and/or the editor(s) disclaim responsibility for any injury to people or property resulting from any ideas, methods, instructions or products referred to in the content. |
© 2023 by the authors. Licensee MDPI, Basel, Switzerland. This article is an open access article distributed under the terms and conditions of the Creative Commons Attribution (CC BY) license (https://creativecommons.org/licenses/by/4.0/).
Share and Cite
Kulkarni, S.; Arunachala, S.; Chaya, S.K.; ShankaraSetty, R.V.; Karnik, M.; Bansal, N.; Ravindran, S.; Lokesh, K.S.; Mohan, M.; Kaleem Ullah, M.; et al. The Assessment of Serum Fibronectin Levels as a Potential Biomarker for the Severity of Drug-Sensitive Pulmonary Tuberculosis: A Pilot Study. Diagnostics 2024, 14, 50. https://doi.org/10.3390/diagnostics14010050
Kulkarni S, Arunachala S, Chaya SK, ShankaraSetty RV, Karnik M, Bansal N, Ravindran S, Lokesh KS, Mohan M, Kaleem Ullah M, et al. The Assessment of Serum Fibronectin Levels as a Potential Biomarker for the Severity of Drug-Sensitive Pulmonary Tuberculosis: A Pilot Study. Diagnostics. 2024; 14(1):50. https://doi.org/10.3390/diagnostics14010050
Chicago/Turabian StyleKulkarni, Shreedhar, Sumalatha Arunachala, Sindaghatta Krishnarao Chaya, Rekha Vaddarahalli ShankaraSetty, Medha Karnik, Nidhi Bansal, Sukanya Ravindran, Komarla Sundararaja Lokesh, Mikash Mohan, Mohammed Kaleem Ullah, and et al. 2024. "The Assessment of Serum Fibronectin Levels as a Potential Biomarker for the Severity of Drug-Sensitive Pulmonary Tuberculosis: A Pilot Study" Diagnostics 14, no. 1: 50. https://doi.org/10.3390/diagnostics14010050
APA StyleKulkarni, S., Arunachala, S., Chaya, S. K., ShankaraSetty, R. V., Karnik, M., Bansal, N., Ravindran, S., Lokesh, K. S., Mohan, M., Kaleem Ullah, M., Siddaiah, J. B., & Mahesh, P. A. (2024). The Assessment of Serum Fibronectin Levels as a Potential Biomarker for the Severity of Drug-Sensitive Pulmonary Tuberculosis: A Pilot Study. Diagnostics, 14(1), 50. https://doi.org/10.3390/diagnostics14010050