
Evaluating the Margins of Breast Cancer Tumors by Using Digital Breast Tomosynthesis with Deep Learning: A Preliminary Assessment

 , , ,
, , ,
Abstract
1. Introduction
2. Materials and Methods
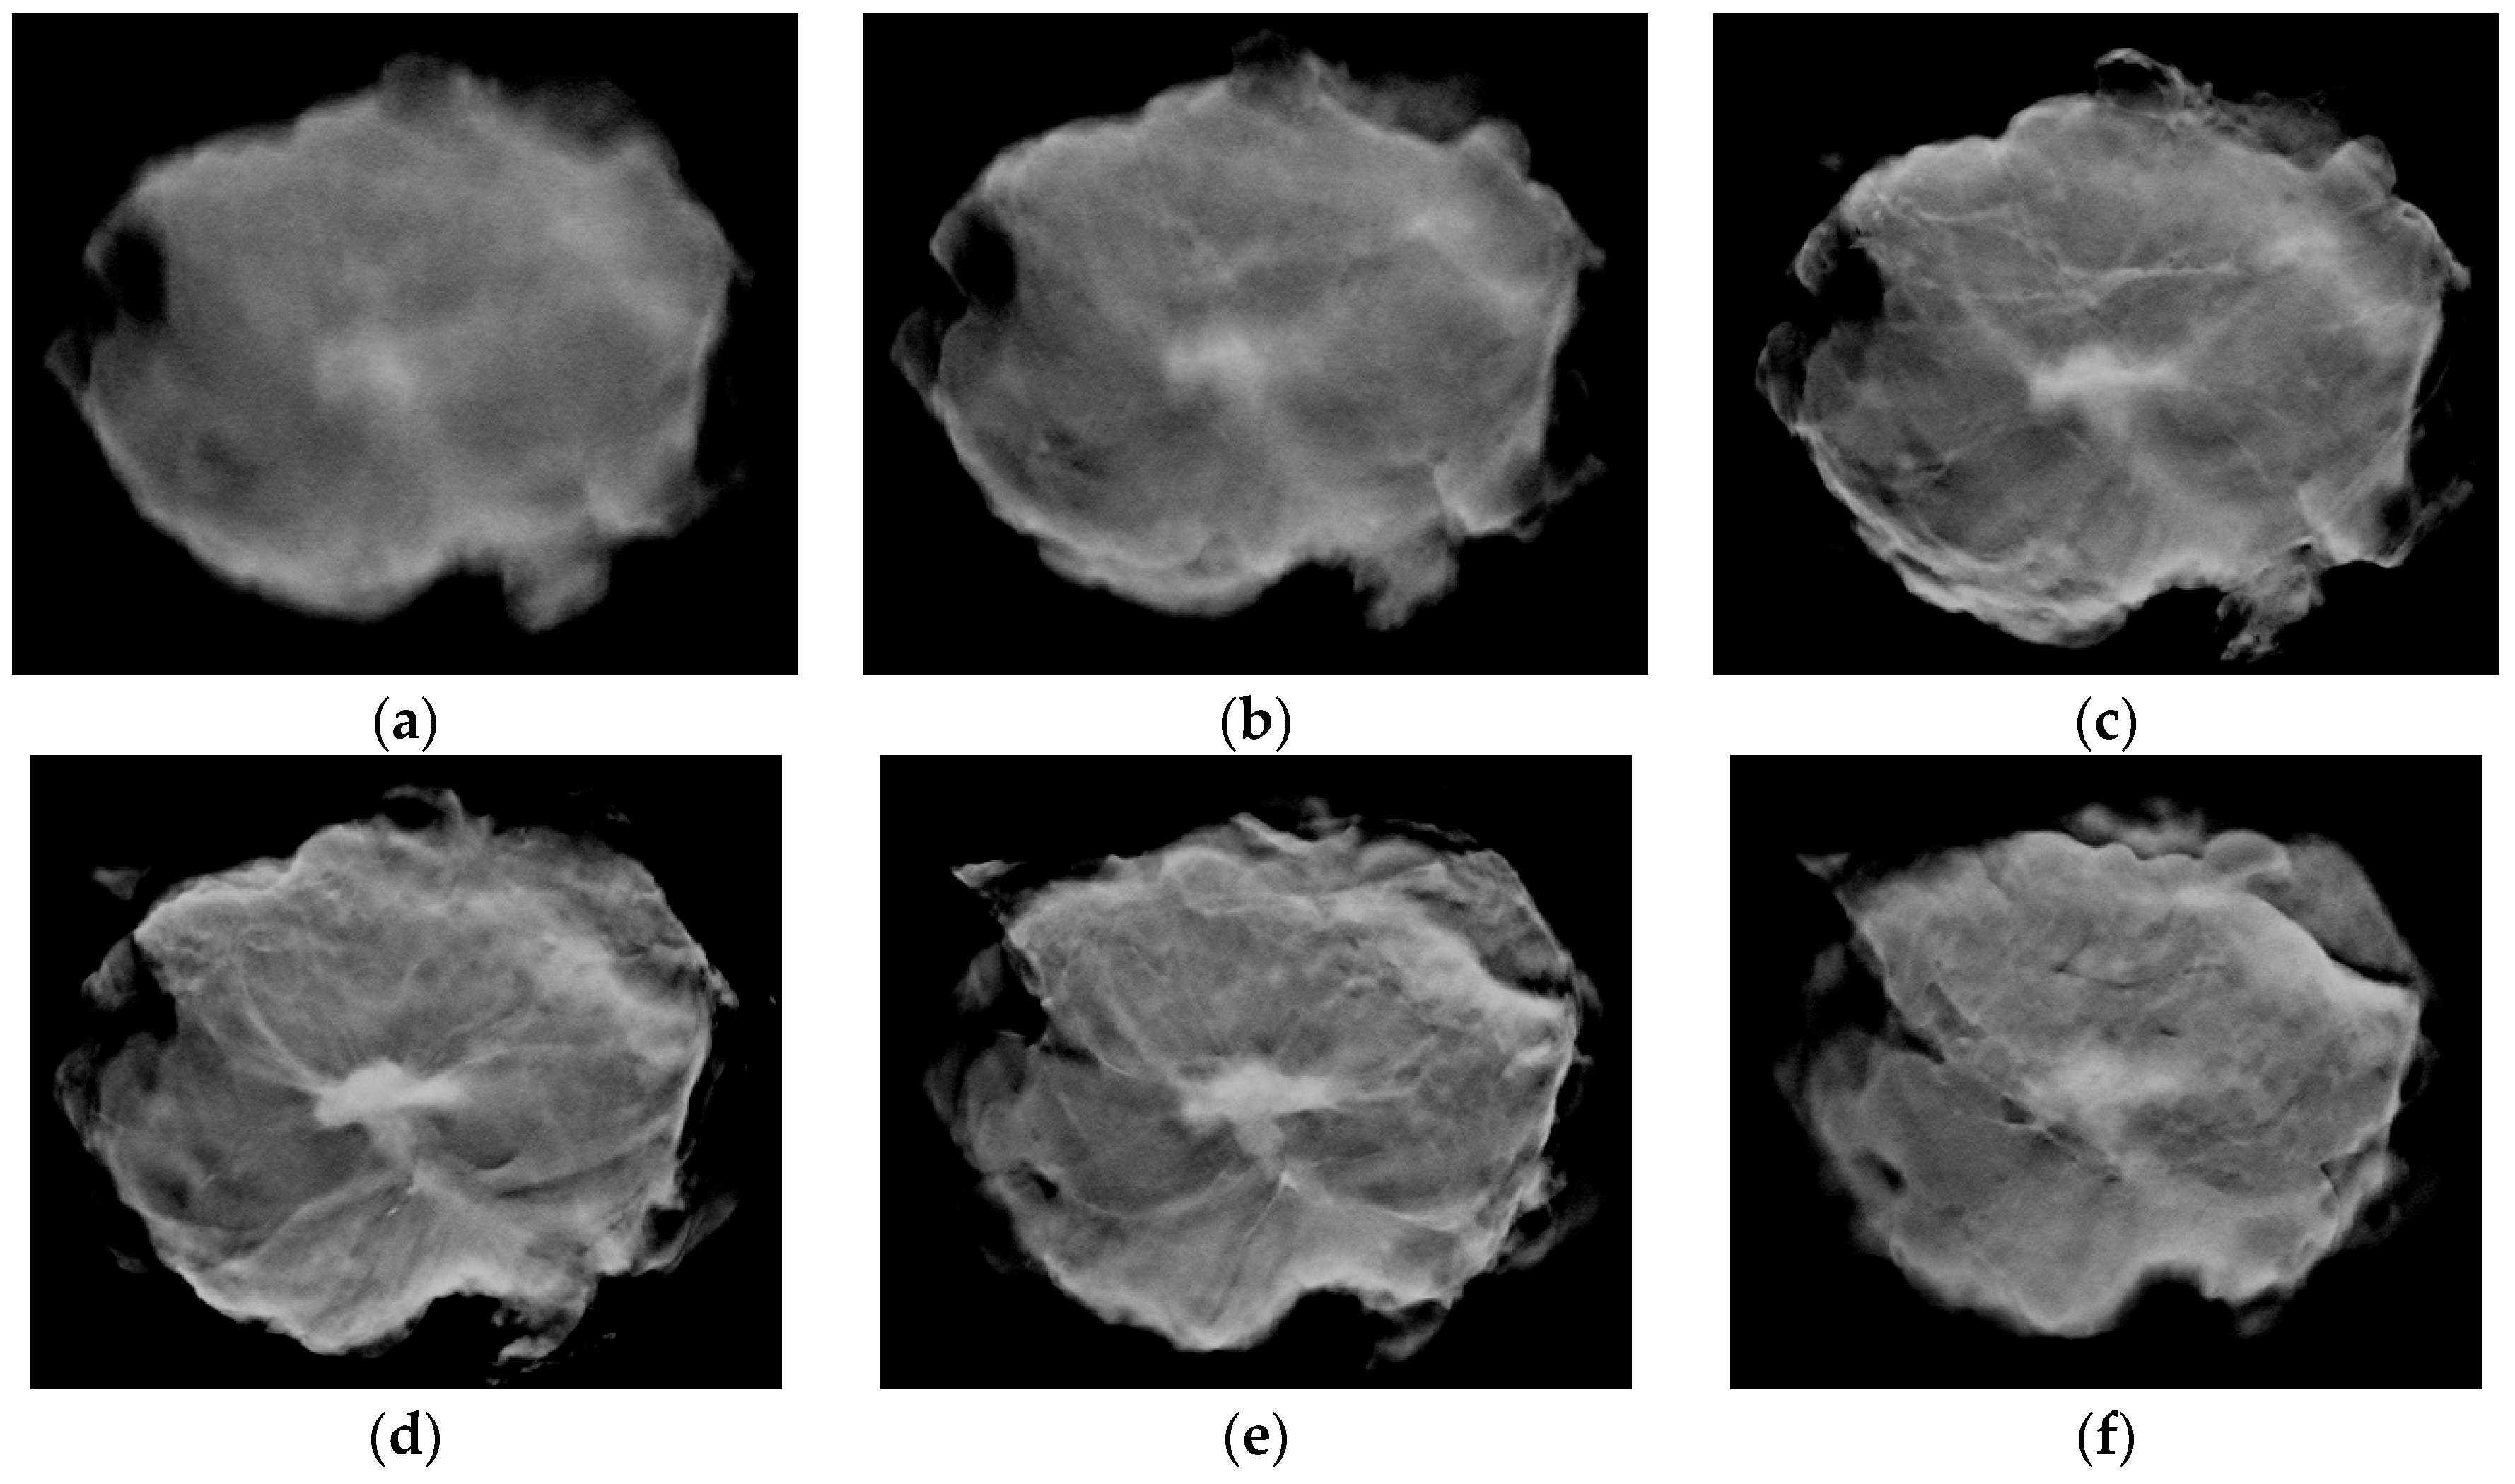
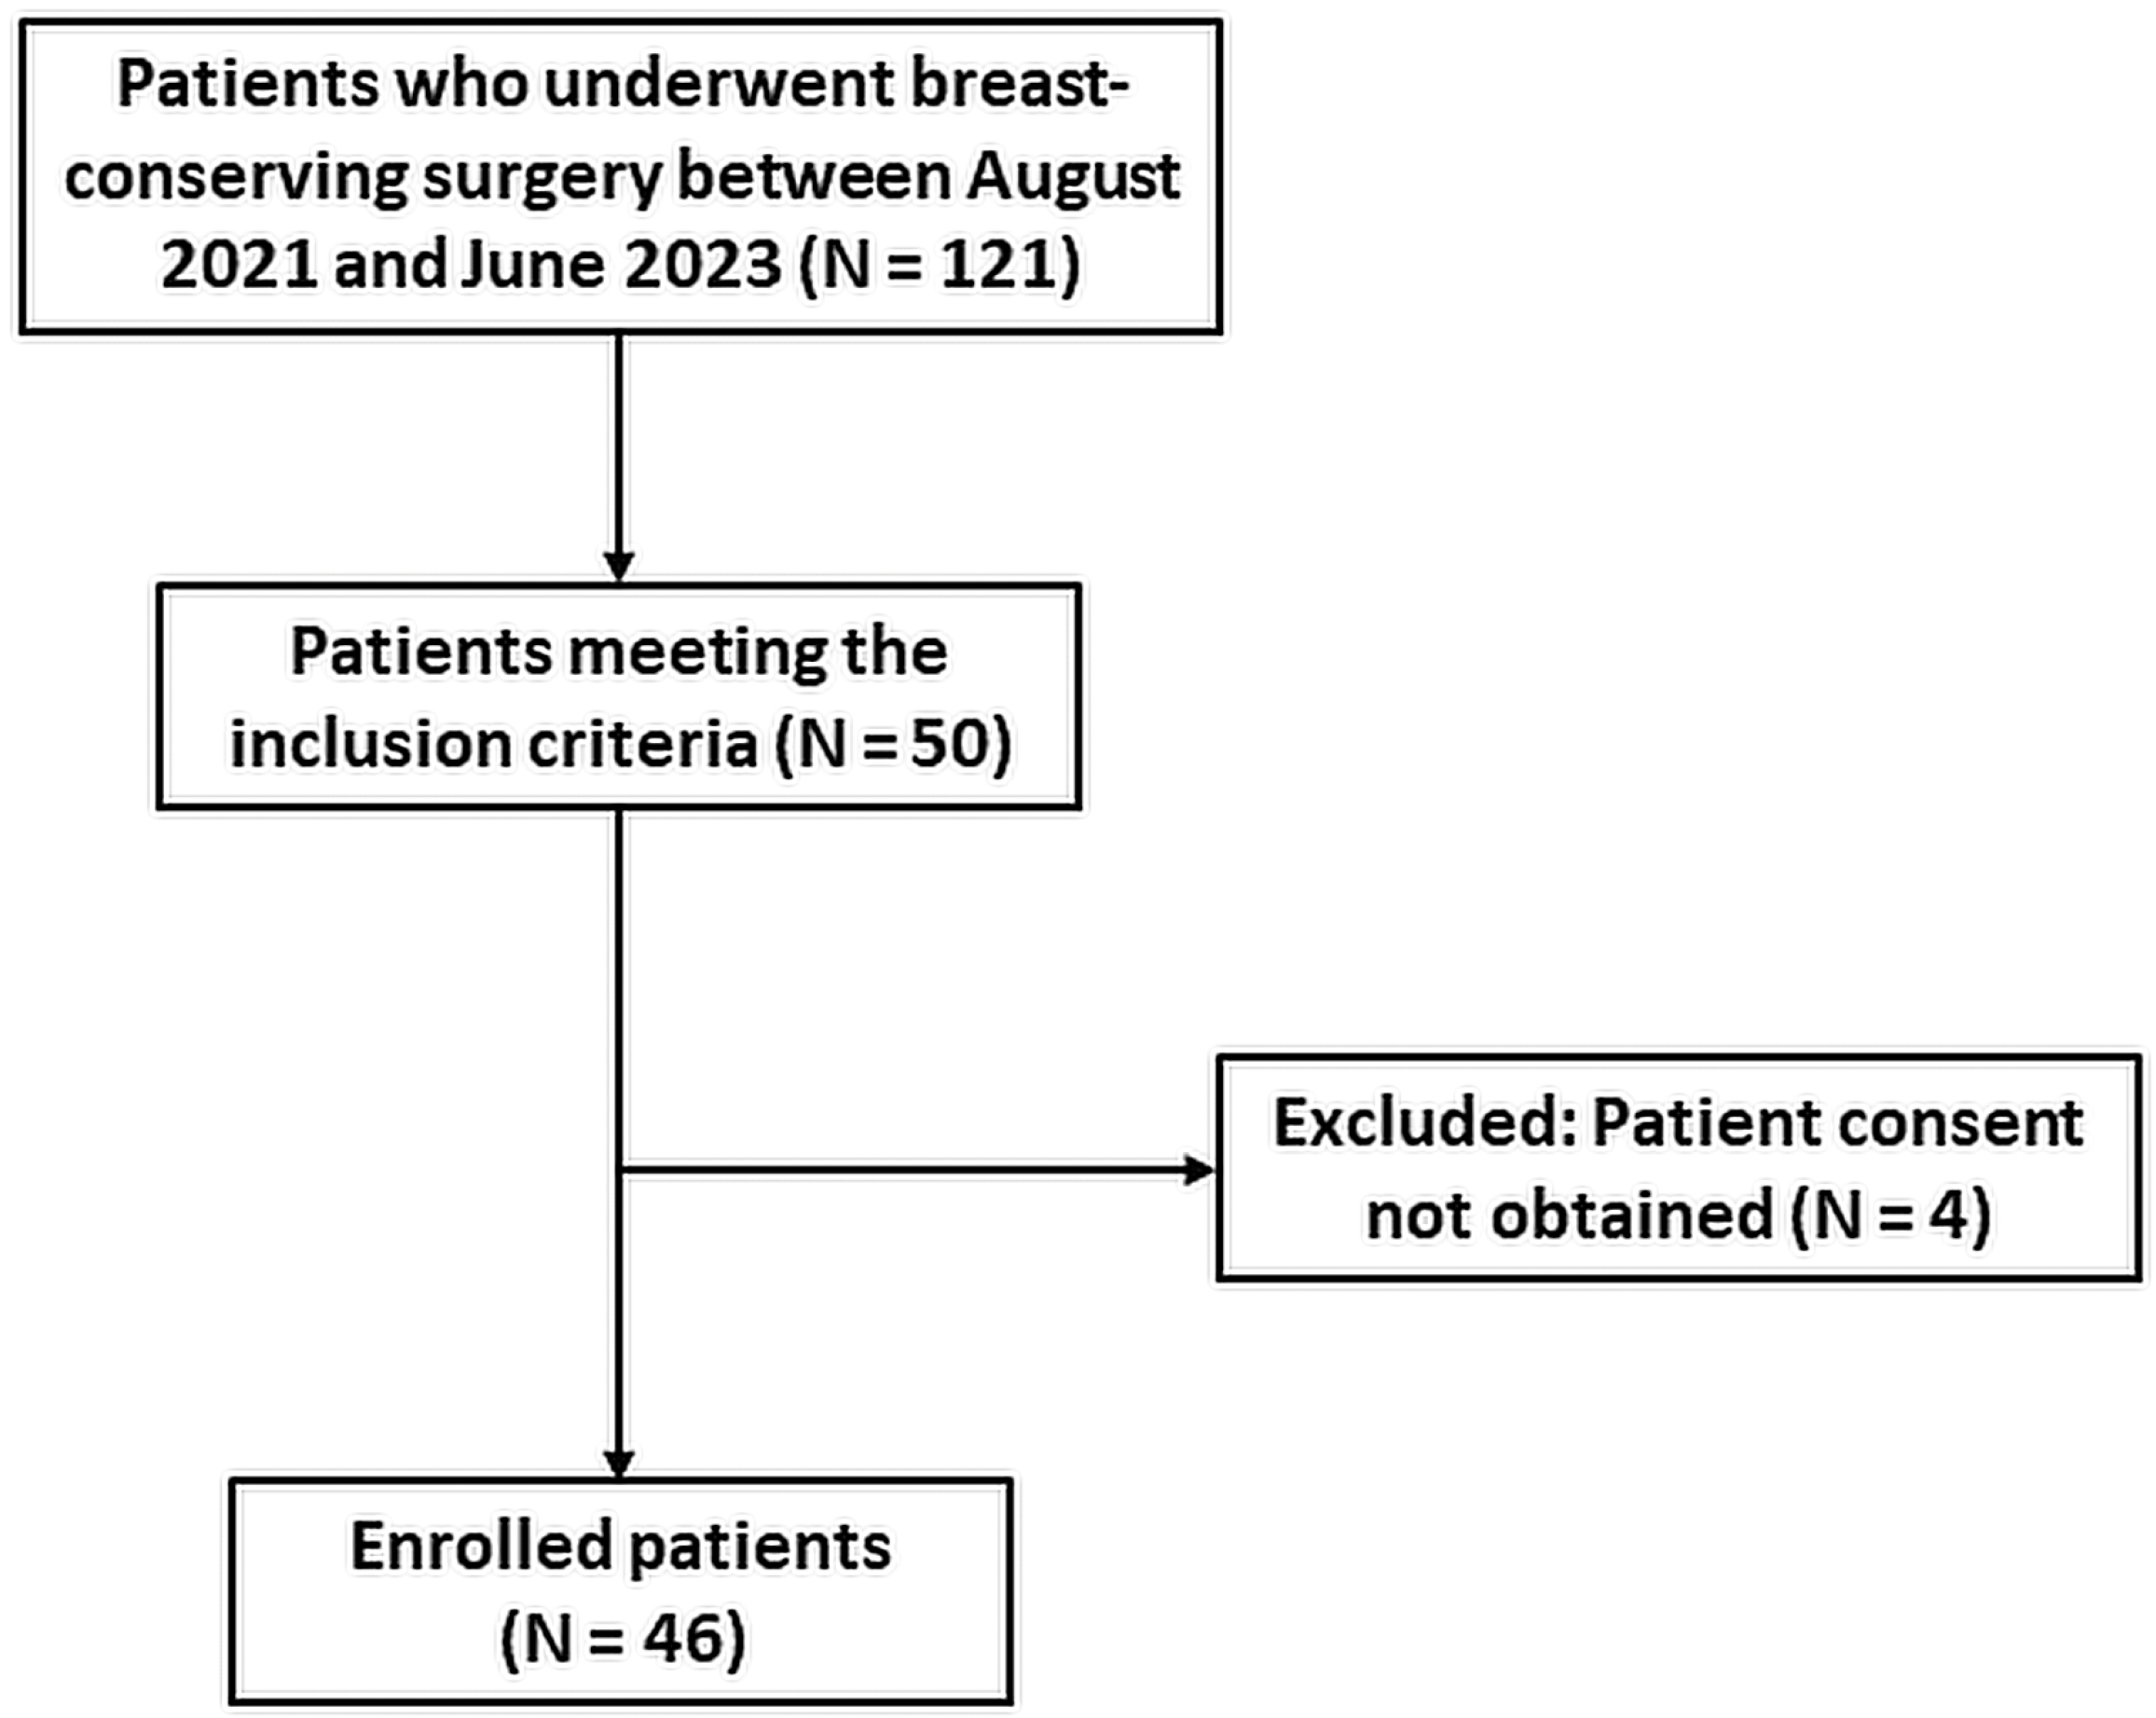
2.1. Image Data Collection Procedures
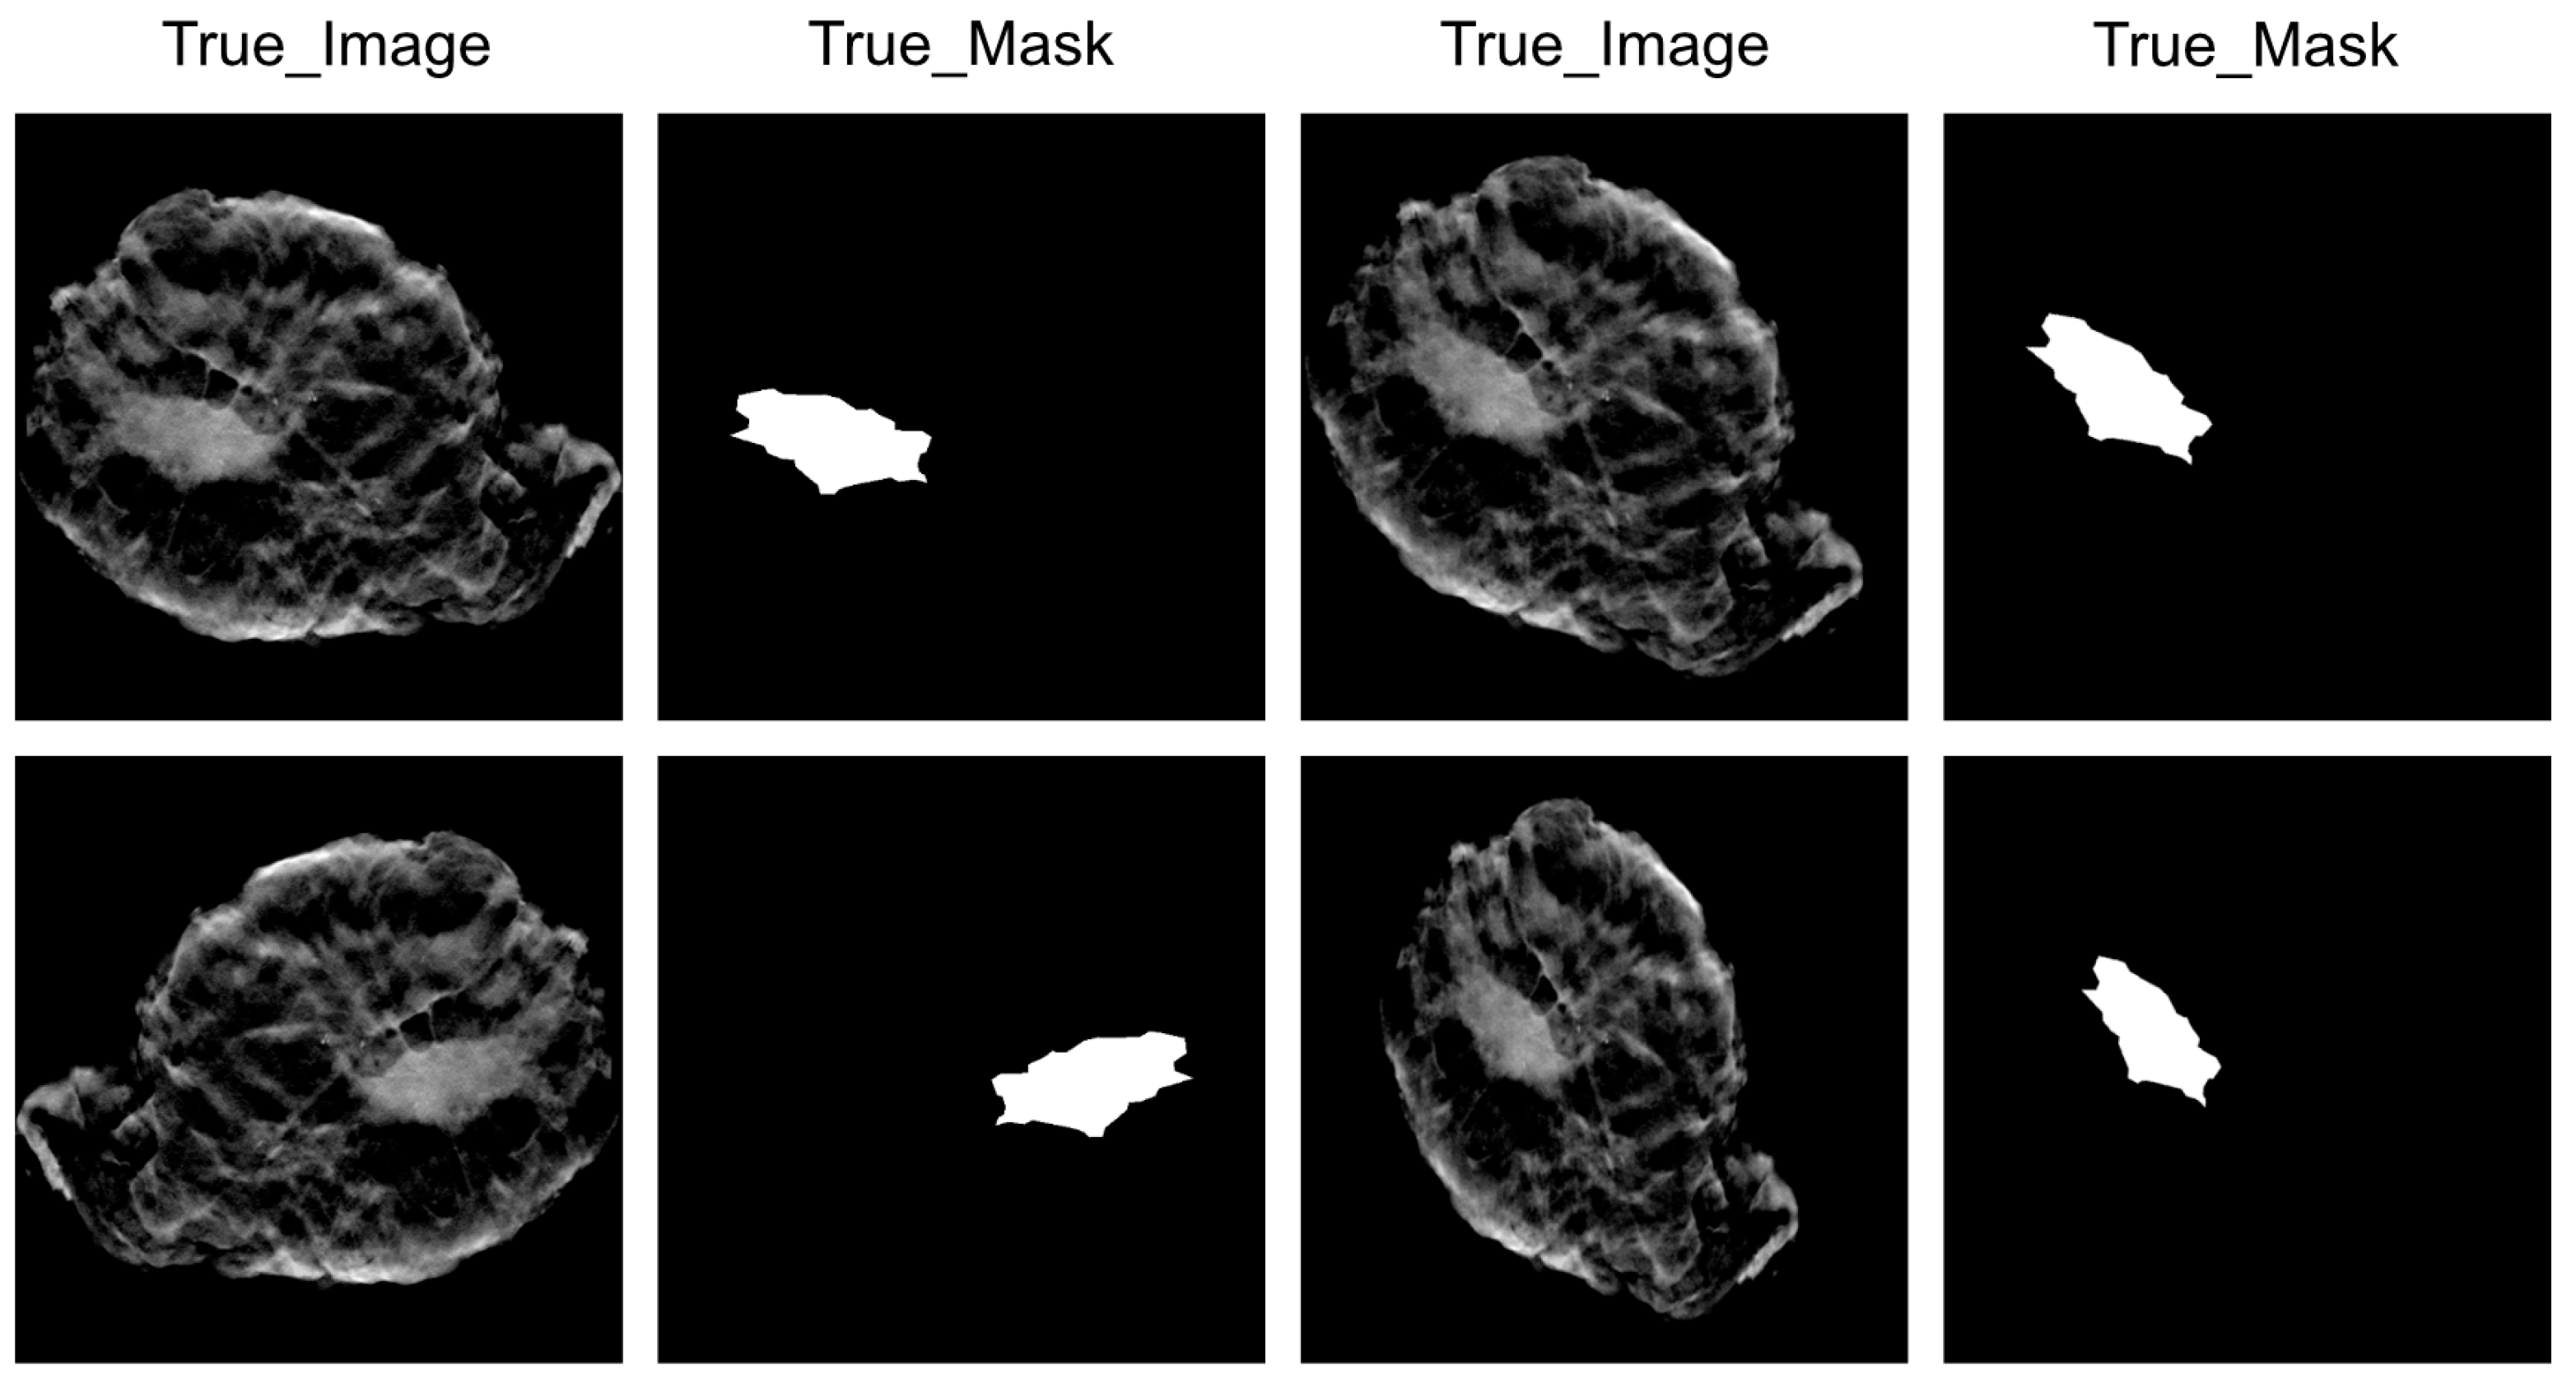
2.2. Image Data Preprocessing
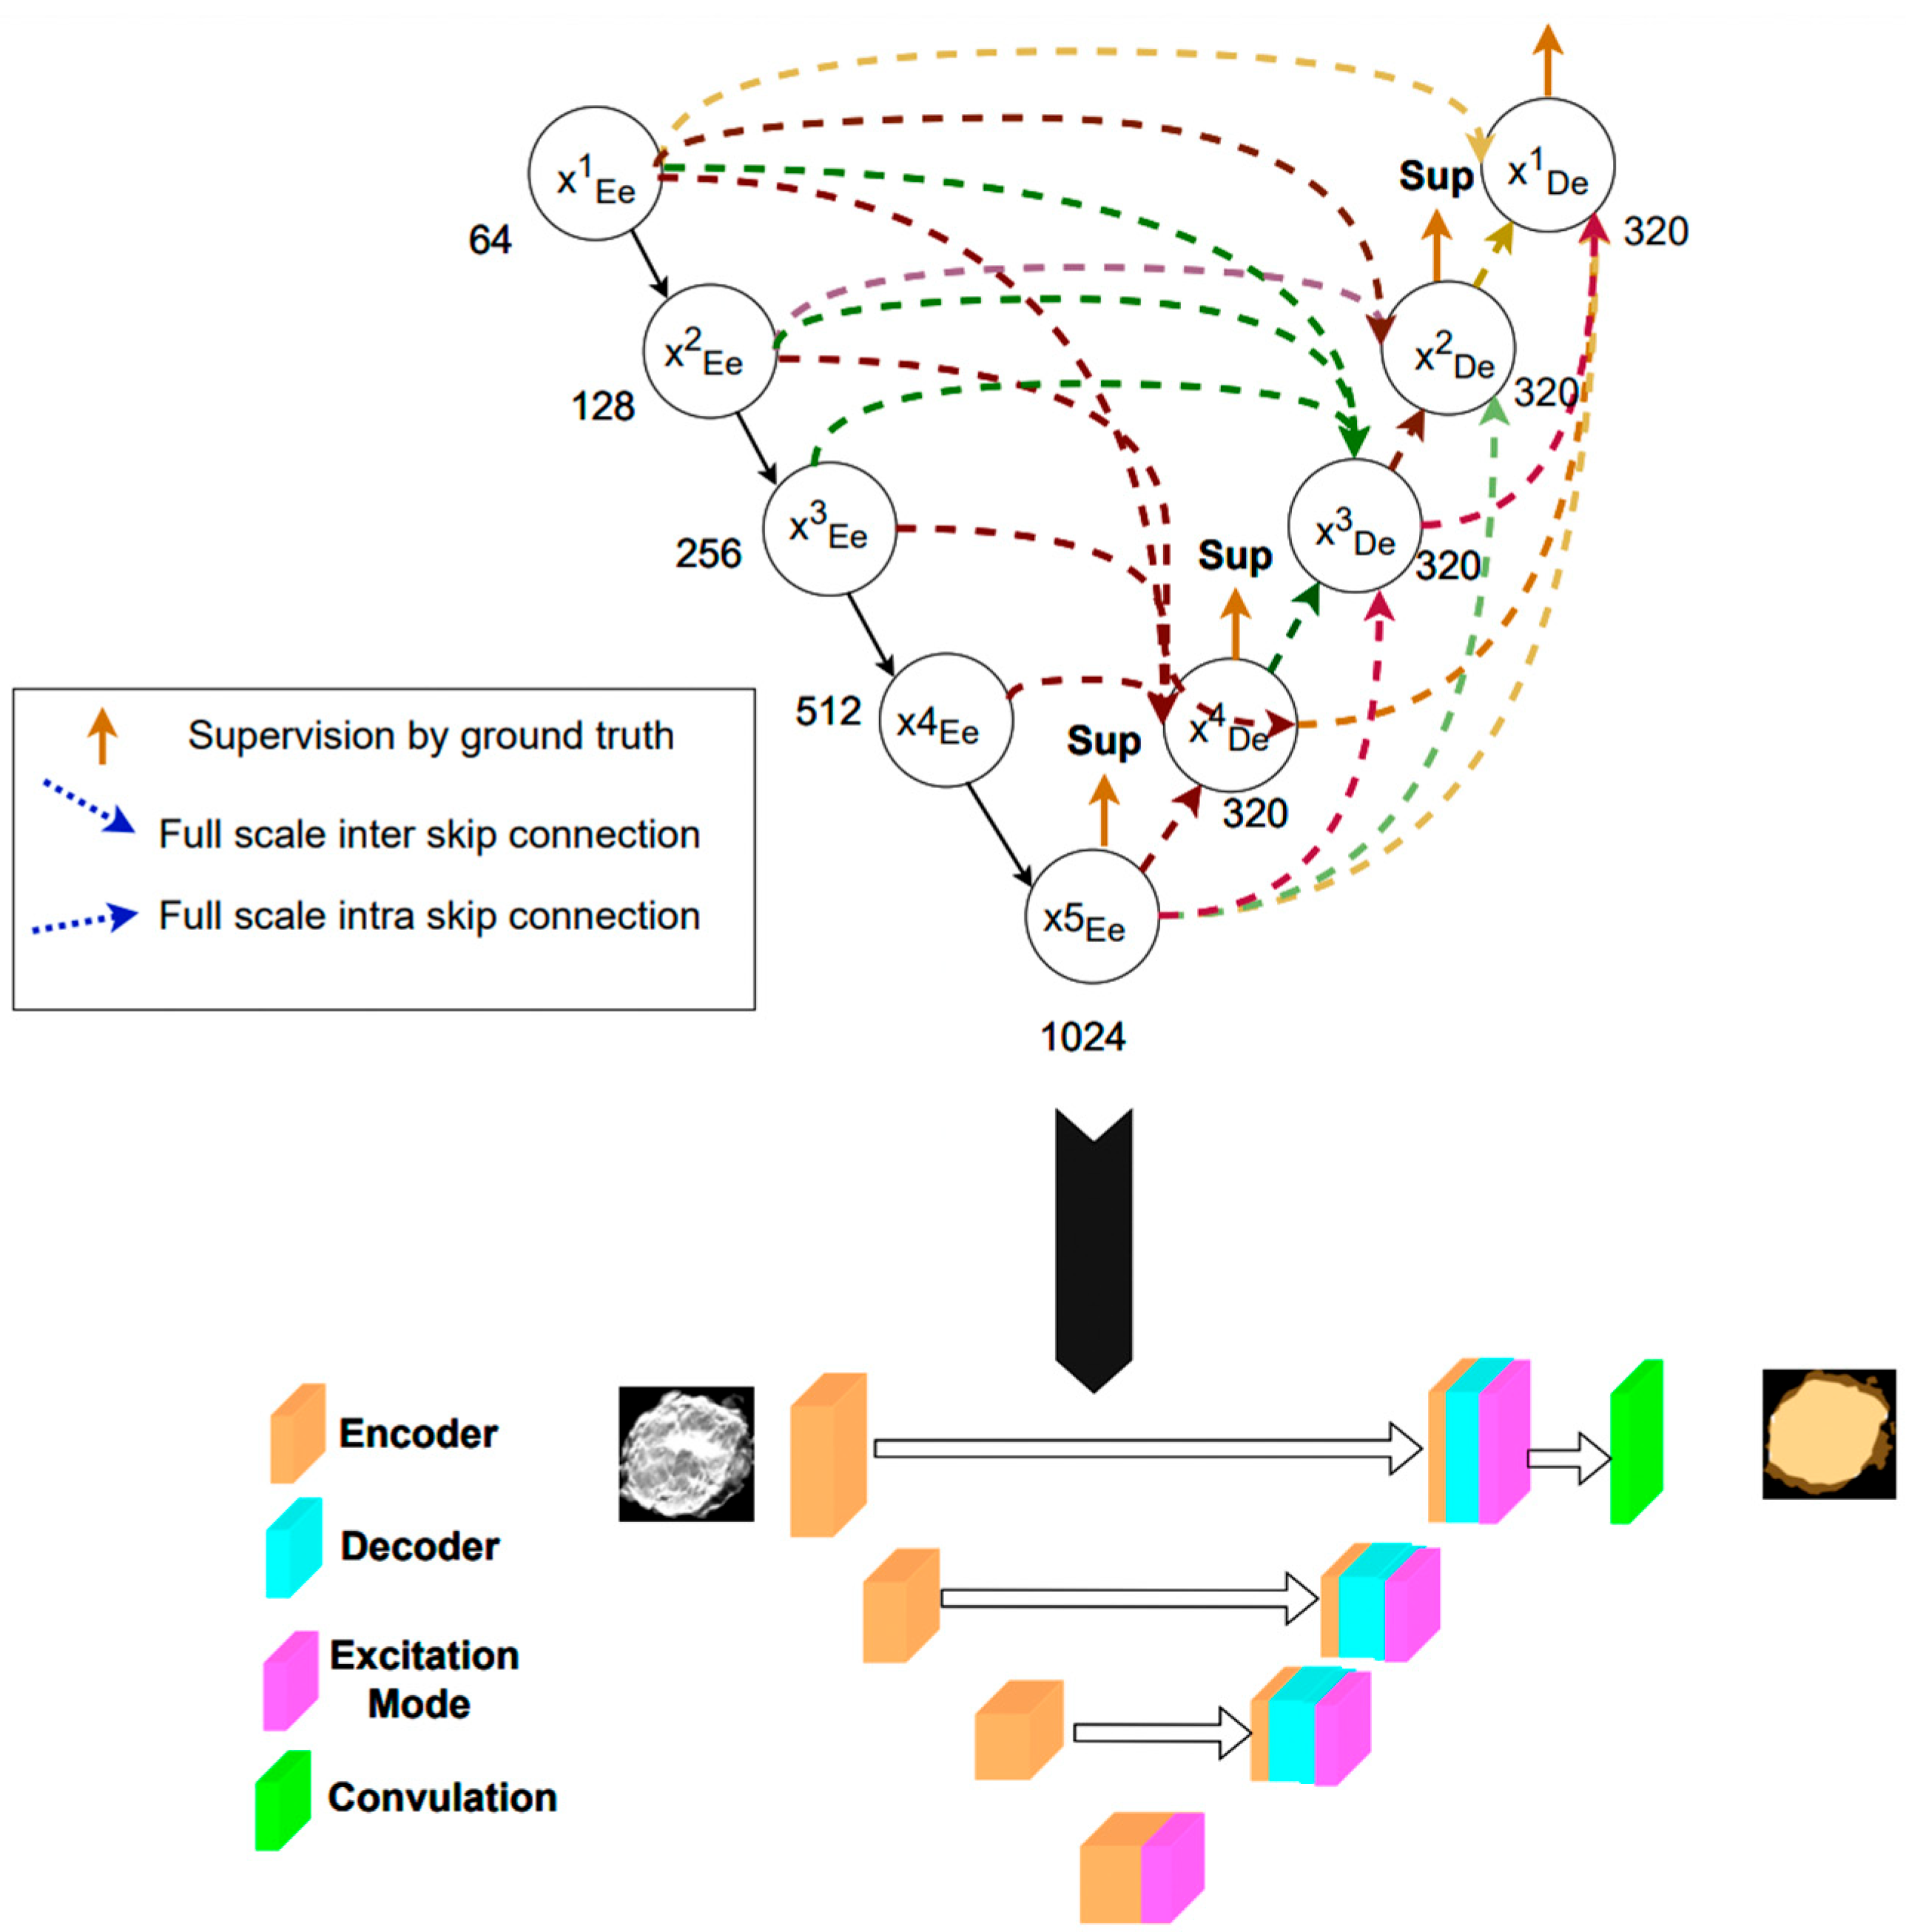
2.3. Deep Learning Model
2.4. Training Protocol and Infrastructure
2.5. Performance Evaluation
3. Results
4. Discussion
5. Conclusions
Author Contributions
Funding
Institutional Review Board Statement
Informed Consent Statement
Data Availability Statement
Acknowledgments
Conflicts of Interest
References
- Sharma, G.N.; Dave, R.; Sanadya, J.; Sharma, P.; Sharma, K. Various types and management of breast cancer: An overview. J. Adv. Pharm. Technol. Res. 2010, 1, 109. [Google Scholar] [PubMed]
- Morrow, M.; Jagsi, R.; Alderman, A.K.; Griggs, J.J.; Hawley, S.T.; Hamilton, A.S.; Graff, J.J.; Katz, S.J. Surgeon recommendations and receipt of mastectomy for treatment of breast cancer. JAMA 2009, 302, 1551–1556. [Google Scholar] [CrossRef] [PubMed]
- McCahill, L.E.; Single, R.M.; Aiello Bowles, E.J.; Feigelson, H.S.; James, T.A.; Barney, T.; Engel, J.M.; Onitilo, A.A. Variability in reexcision following breast conservation surgery. JAMA 2012, 307, 467–475. [Google Scholar] [CrossRef] [PubMed]
- Keating, J.J.; Fisher, C.; Batiste, R.; Singhal, S. Advances in Intraoperative Margin Assessment for Breast Cancer. Curr. Surg. Rep. 2016, 4, 15. [Google Scholar] [CrossRef]
- Rosenthal, E.L.; Warram, J.M.; Bland, K.I.; Zinn, K.R. The status of contemporary image-guided modalities in oncologic surgery. Ann. Surg. 2015, 261, 46–55. [Google Scholar] [CrossRef] [PubMed]
- Valdes, E.K.; Boolbol, S.K.; Ali, I.; Feldman, S.M.; Cohen, J.-M. Intraoperative Touch Preparation Cytology for Margin Assessment in Breast-Conservation Surgery: Does It Work for Lobular Carcinoma? Ann. Surg. Oncol. 2007, 14, 2940–2945. [Google Scholar] [CrossRef] [PubMed]
- Rannen Triki, A.; Blaschko, M.B.; Jung, Y.M.; Song, S.; Han, H.J.; Kim, S.I.; Joo, C. Intraoperative margin assessment of human breast tissue in optical coherence tomography images using deep neural networks. Comput. Med. Imaging Graph. 2018, 69, 21–32. [Google Scholar] [CrossRef] [PubMed]
- Shipp, D.W.; Rakha, E.A.; Koloydenko, A.A.; Macmillan, R.D.; Ellis, I.O.; Notingher, I. Intra-operative spectroscopic assessment of surgical margins during breast conserving surgery. Breast Cancer Res. 2018, 20, 69. [Google Scholar] [CrossRef]
- Kerlikowske, K.; Grady, D.; Barclay, J.; Sickles, E.A.; Ernster, V. Effect of age, breast density, and family history on the sensitivity of first screening mammography. JAMA 1996, 276, 33–38. [Google Scholar] [CrossRef]
- Rosenberg, R.D.; Hunt, W.C.; Williamson, M.R.; Gilliland, F.D.; Wiest, P.W.; Kelsey, C.A.; Key, C.R.; Linver, M.N. Effects of age, breast density, ethnicity, and estrogen replacement therapy on screening mammographic sensitivity and cancer stage at diagnosis: Review of 183,134 screening mammograms in Albuquerque, New Mexico. Radiology 1998, 209, 511–518. [Google Scholar] [CrossRef]
- Burgess, A.E.; Jacobson, F.L.; Judy, P.F. Human observer detection experiments with mammograms and power-law noise. Med. Phys. 2001, 28, 419–437. [Google Scholar] [CrossRef]
- Vedantham, S.; Karellas, A.; Vijayaraghavan, G.R.; Kopans, D.B. Digital Breast Tomosynthesis: State of the Art. Radiology 2015, 277, 663–684. [Google Scholar] [CrossRef]
- Skaane, P.; Bandos, A.I.; Gullien, R.; Eben, E.B.; Ekseth, U.; Haakenaasen, U.; Izadi, M.; Jebsen, I.N.; Jahr, G.; Krager, M.; et al. Comparison of digital mammography alone and digital mammography plus tomosynthesis in a population-based screening program. Radiology 2013, 267, 47–56. [Google Scholar] [CrossRef]
- Skaane, P.; Bandos, A.I.; Gullien, R.; Eben, E.B.; Ekseth, U.; Haakenaasen, U.; Izadi, M.; Jebsen, I.N.; Jahr, G.; Krager, M.; et al. Prospective trial comparing full-field digital mammography (FFDM) versus combined FFDM and tomosynthesis in a population-based screening programme using independent double reading with arbitration. Eur. Radiol. 2013, 23, 2061–2071. [Google Scholar] [CrossRef]
- Li, H.; Giger, M.L.; Huo, Z.; Olopade, O.I.; Lan, L.; Weber, B.L.; Bonta, I. Computerized analysis of mammographic parenchymal patterns for assessing breast cancer risk: Effect of ROI size and location. Med. Phys. 2004, 31, 549–555. [Google Scholar] [CrossRef]
- Díaz-Cortés, M.-A.; Ortega-Sánchez, N.; Hinojosa, S.; Oliva, D.; Cuevas, E.; Rojas, R.; Demin, A. A multi-level thresholding method for breast thermograms analysis using Dragonfly algorithm. Infrared Phys. Technol. 2018, 93, 346–361. [Google Scholar] [CrossRef]
- Baso, A.O.B.S.A. Surgical guidelines for the management of breast cancer. Eur. J. Surg. Oncol. (EJSO) 2009, 35, S1–S22. [Google Scholar]
- Lovelace, D.L.; McDaniel, L.R.; Golden, D. Long-term effects of breast cancer surgery, treatment, and survivor care. J. Midwifery Women's Health 2019, 64, 713–724. [Google Scholar] [CrossRef]
- Mussurakis, S.; Buckley, D.L.; Horsman, A. Dynamic MRI of invasive breast cancer: Assessment of three region-of-interest analysis methods. J. Comput. Assist. Tomogr. 1997, 21, 431–438. [Google Scholar] [CrossRef]
- Namozov, A.; Im Cho, Y. An improvement for medical image analysis using data enhancement techniques in deep learning. In Proceedings of the 2018 International Conference on Information and Communication Technology Robotics (ICT-ROBOT), Busan, Republic of Korea, 6–8 September 2018; pp. 1–3. [Google Scholar]
- Yang, Q.; Li, L.; Zhang, J.; Shao, G.; Zheng, B. A new quantitative image analysis method for improving breast cancer diagnosis using DCE-MRI examinations. Med. Phys. 2015, 42, 103–109. [Google Scholar] [CrossRef]
- Huang, H.; Lin, L.; Tong, R.; Hu, H.; Zhang, Q.; Iwamoto, Y.; Han, X.; Chen, Y.-W.; Wu, J. Unet 3+: A full-scale connected unet for medical image segmentation. In Proceedings of the ICASSP 2020–2020 IEEE international conference on acoustics, speech and signal processing (ICASSP), Barcelona, Spain, 4–9 May 2020; pp. 1055–1059. [Google Scholar]
- Ronneberger, O.; Fischer, P.; Brox, T. U-net: Convolutional networks for biomedical image segmentation. In Proceedings of the Medical Image Computing and Computer-Assisted Intervention–MICCAI 2015: 18th International Conference, Munich, Germany, 5–9 October 2015; Proceedings, Part III 18. pp. 234–241. [Google Scholar]
- Swain, B.R.; Cheoi, K.J.; Ko, J. Nuclei Segmentation in Histopathological Images with Enhanced U-Net3+. In Proceedings of the Medical Imaging with Deep Learning, Paris, France, 3–5 July 2024. [Google Scholar]
- Paszke, A.; Gross, S.; Chintala, S.; Chanan, G.; Yang, E.; DeVito, Z.; Lin, Z.; Desmaison, A.; Antiga, L.; Lerer, A. Automatic differentiation in pytorch. In Proceedings of the 31st Conference on Neural Information Processing Systems (NIPS 2017), Long Beach, CA, USA, 4–9 December 2017. [Google Scholar]
- Rezatofighi, H.; Tsoi, N.; Gwak, J.; Sadeghian, A.; Reid, I.; Savarese, S. Generalized intersection over union: A metric and a loss for bounding box regression. In Proceedings of the IEEE/CVF Conference on Computer Vision and Pattern Recognition, Long Beach, CA, USA, 15–20 June 2019; pp. 658–666. [Google Scholar]
- Pradipta, A.R.; Tanei, T.; Morimoto, K.; Shimazu, K.; Noguchi, S.; Tanaka, K. Emerging Technologies for Real-Time Intraoperative Margin Assessment in Future Breast-Conserving Surgery. Adv. Sci. 2020, 7, 1901519. [Google Scholar] [CrossRef] [PubMed]
- Nguyen, F.T.; Zysk, A.M.; Chaney, E.J.; Kotynek, J.G.; Oliphant, U.J.; Bellafiore, F.J.; Rowland, K.M.; Johnson, P.A.; Boppart, S.A. Intraoperative evaluation of breast tumor margins with optical coherence tomography. Cancer Res. 2009, 69, 8790–8796. [Google Scholar] [CrossRef] [PubMed]
- Duan, Y.; Guo, D.; Zhang, X.; Lan, L.; Meng, H.; Wang, Y.; Sui, C.; Qu, Z.; He, G.; Wang, C.; et al. Diagnostic accuracy of optical coherence tomography for margin assessment in breast-conserving surgery: A systematic review and meta-analysis. Photodiagn. Photodyn. Ther. 2023, 43, 103718. [Google Scholar] [CrossRef] [PubMed]
- Veluponnar, D.; de Boer, L.L.; Geldof, F.; Jong, L.S.; Da Silva Guimaraes, M.; Vrancken Peeters, M.; van Duijnhoven, F.; Ruers, T.; Dashtbozorg, B. Toward Intraoperative Margin Assessment Using a Deep Learning-Based Approach for Automatic Tumor Segmentation in Breast Lumpectomy Ultrasound Images. Cancers 2023, 15, 1652. [Google Scholar] [CrossRef]
- Keys, R. Cubic convolution interpolation for digital image processing. IEEE Trans. Acoust. Speech Signal Process. 1981, 29, 1153–1160. [Google Scholar] [CrossRef]
- Li, H.; Zeng, Y.; Lu, Z.; Cao, X.; Su, X.; Sui, X.; Wang, J.; Chai, X. An optimized content-aware image retargeting method: Toward expanding the perceived visual field of the high-density retinal prosthesis recipients. J. Neural Eng. 2018, 15, 026025. [Google Scholar] [CrossRef] [PubMed]
- Chen, H.; Yang, B.-W.; Qian, L.; Meng, Y.-S.; Bai, X.-H.; Hong, X.-W.; He, X.; Jiang, M.-J.; Yuan, F.; Du, Q.-W.; et al. Deep Learning Prediction of Ovarian Malignancy at US Compared with O-RADS and Expert Assessment. Radiology 2022, 304, 106–113. [Google Scholar] [CrossRef] [PubMed]
- Mitranovici, M.I.; Chiorean, D.M.; Mureșan, M.C.; Buicu, C.F.; Moraru, R.; Moraru, L.; Cotoi, T.C.; Cotoi, O.S.; Toru, H.S.; Apostol, A.; et al. Diagnosis and Management of Dysgerminomas with a Brief Summary of Primitive Germ Cell Tumors. Diagnostics 2022, 12, 3105. [Google Scholar] [CrossRef] [PubMed]
- Mitranovici, M.-I.; Chiorean, D.M.; Turdean, S.G.; Mureșan, M.C.; Buicu, C.-F.; Moraru, R.; Moraru, L.; Cotoi, T.C.; Toru, H.S.; Apostol, A.; et al. A Rare Case of Malignant Ovarian Germ Cell Tumor: Dysgerminoma and Seminoma in the Same Patient. Reports 2023, 6, 14. [Google Scholar] [CrossRef]
- Chiorean, D.M.; Mitranovici, M.-I.; Mureșan, M.C.; Buicu, C.-F.; Moraru, R.; Moraru, L.; Cotoi, T.C.; Cotoi, O.S.; Apostol, A.; Turdean, S.G.; et al. The Approach of Artificial Intelligence in Neuroendocrine Carcinomas of the Breast: A Next Step towards Precision Pathology?—A Case Report and Review of the Literature. Medicina 2023, 59, 672. [Google Scholar] [CrossRef]
- Orosco, R.K.; Tapia, V.J.; Califano, J.A.; Clary, B.; Cohen, E.E.W.; Kane, C.; Lippman, S.M.; Messer, K.; Molinolo, A.; Murphy, J.D.; et al. Positive Surgical Margins in the 10 Most Common Solid Cancers. Sci. Rep. 2018, 8, 5686. [Google Scholar] [CrossRef] [PubMed]


| Characteristics | Total (n = 46) |
|---|---|
| Pathology | |
| IDC | 32 |
| ILC | 4 |
| DCIS/LCIS | 6 |
| MUC | 4 |
| Lymph node status | |
| Negative | 12 |
| Positive | 34 |
| Histologic grade | |
| 1/2 | 43 |
| ≥3 | 3 |
| Tumor Size | |
| ≥2 cm | 32 |
| 1 to 2 cm | 11 |
| ≤1 cm | 3 |
| U-Net3+ | Training Dataset | Test Dataset |
|---|---|---|
| Mean Intersection over Union (MIoU) | 0.91 | 0.83 |
| Global accuracy | 0.99 | 0.97 |
| Precision | 0.98 | 0.87 |
| Recall | 0.83 | 0.69 |
| F1 score | 0.89 | 0.76 |
| Dice coefficient | 0.93 | 0.86 |
| Data size | 1140 | 152 |
Disclaimer/Publisher’s Note: The statements, opinions and data contained in all publications are solely those of the individual author(s) and contributor(s) and not of MDPI and/or the editor(s). MDPI and/or the editor(s) disclaim responsibility for any injury to people or property resulting from any ideas, methods, instructions or products referred to in the content. |
© 2024 by the authors. Licensee MDPI, Basel, Switzerland. This article is an open access article distributed under the terms and conditions of the Creative Commons Attribution (CC BY) license (https://creativecommons.org/licenses/by/4.0/).
Share and Cite
Shia, W.-C.; Kuo, Y.-H.; Hsu, F.-R.; Lin, J.; Wu, W.-P.; Wu, H.-K.; Yeh, W.-C.; Chen, D.-R. Evaluating the Margins of Breast Cancer Tumors by Using Digital Breast Tomosynthesis with Deep Learning: A Preliminary Assessment. Diagnostics 2024, 14, 1032. https://doi.org/10.3390/diagnostics14101032
Shia W-C, Kuo Y-H, Hsu F-R, Lin J, Wu W-P, Wu H-K, Yeh W-C, Chen D-R. Evaluating the Margins of Breast Cancer Tumors by Using Digital Breast Tomosynthesis with Deep Learning: A Preliminary Assessment. Diagnostics. 2024; 14(10):1032. https://doi.org/10.3390/diagnostics14101032
Chicago/Turabian StyleShia, Wei-Chung, Yu-Hsun Kuo, Fang-Rong Hsu, Joseph Lin, Wen-Pei Wu, Hwa-Koon Wu, Wei-Cheng Yeh, and Dar-Ren Chen. 2024. "Evaluating the Margins of Breast Cancer Tumors by Using Digital Breast Tomosynthesis with Deep Learning: A Preliminary Assessment" Diagnostics 14, no. 10: 1032. https://doi.org/10.3390/diagnostics14101032
APA StyleShia, W.-C., Kuo, Y.-H., Hsu, F.-R., Lin, J., Wu, W.-P., Wu, H.-K., Yeh, W.-C., & Chen, D.-R. (2024). Evaluating the Margins of Breast Cancer Tumors by Using Digital Breast Tomosynthesis with Deep Learning: A Preliminary Assessment. Diagnostics, 14(10), 1032. https://doi.org/10.3390/diagnostics14101032