

Accuracy and Consistency of Confidence Limits for Monosyllable Identification Scores Derived Using Simulation, the Harrell–Davis Estimator, and Nonlinear Quantile Regression

 , , , , , and
Abstract
1. Introduction
2. Materials and Methods
2.1. Participants
2.2. Procedure
2.2.1. Basic Audiological Evaluation
2.2.2. Speech Recognition Threshold (SRT)
2.2.3. Maximum Speech Identification Score (PBmax)
2.2.4. Statistical Analyses
2.3. Derivation of 95% CL Using Three Methods
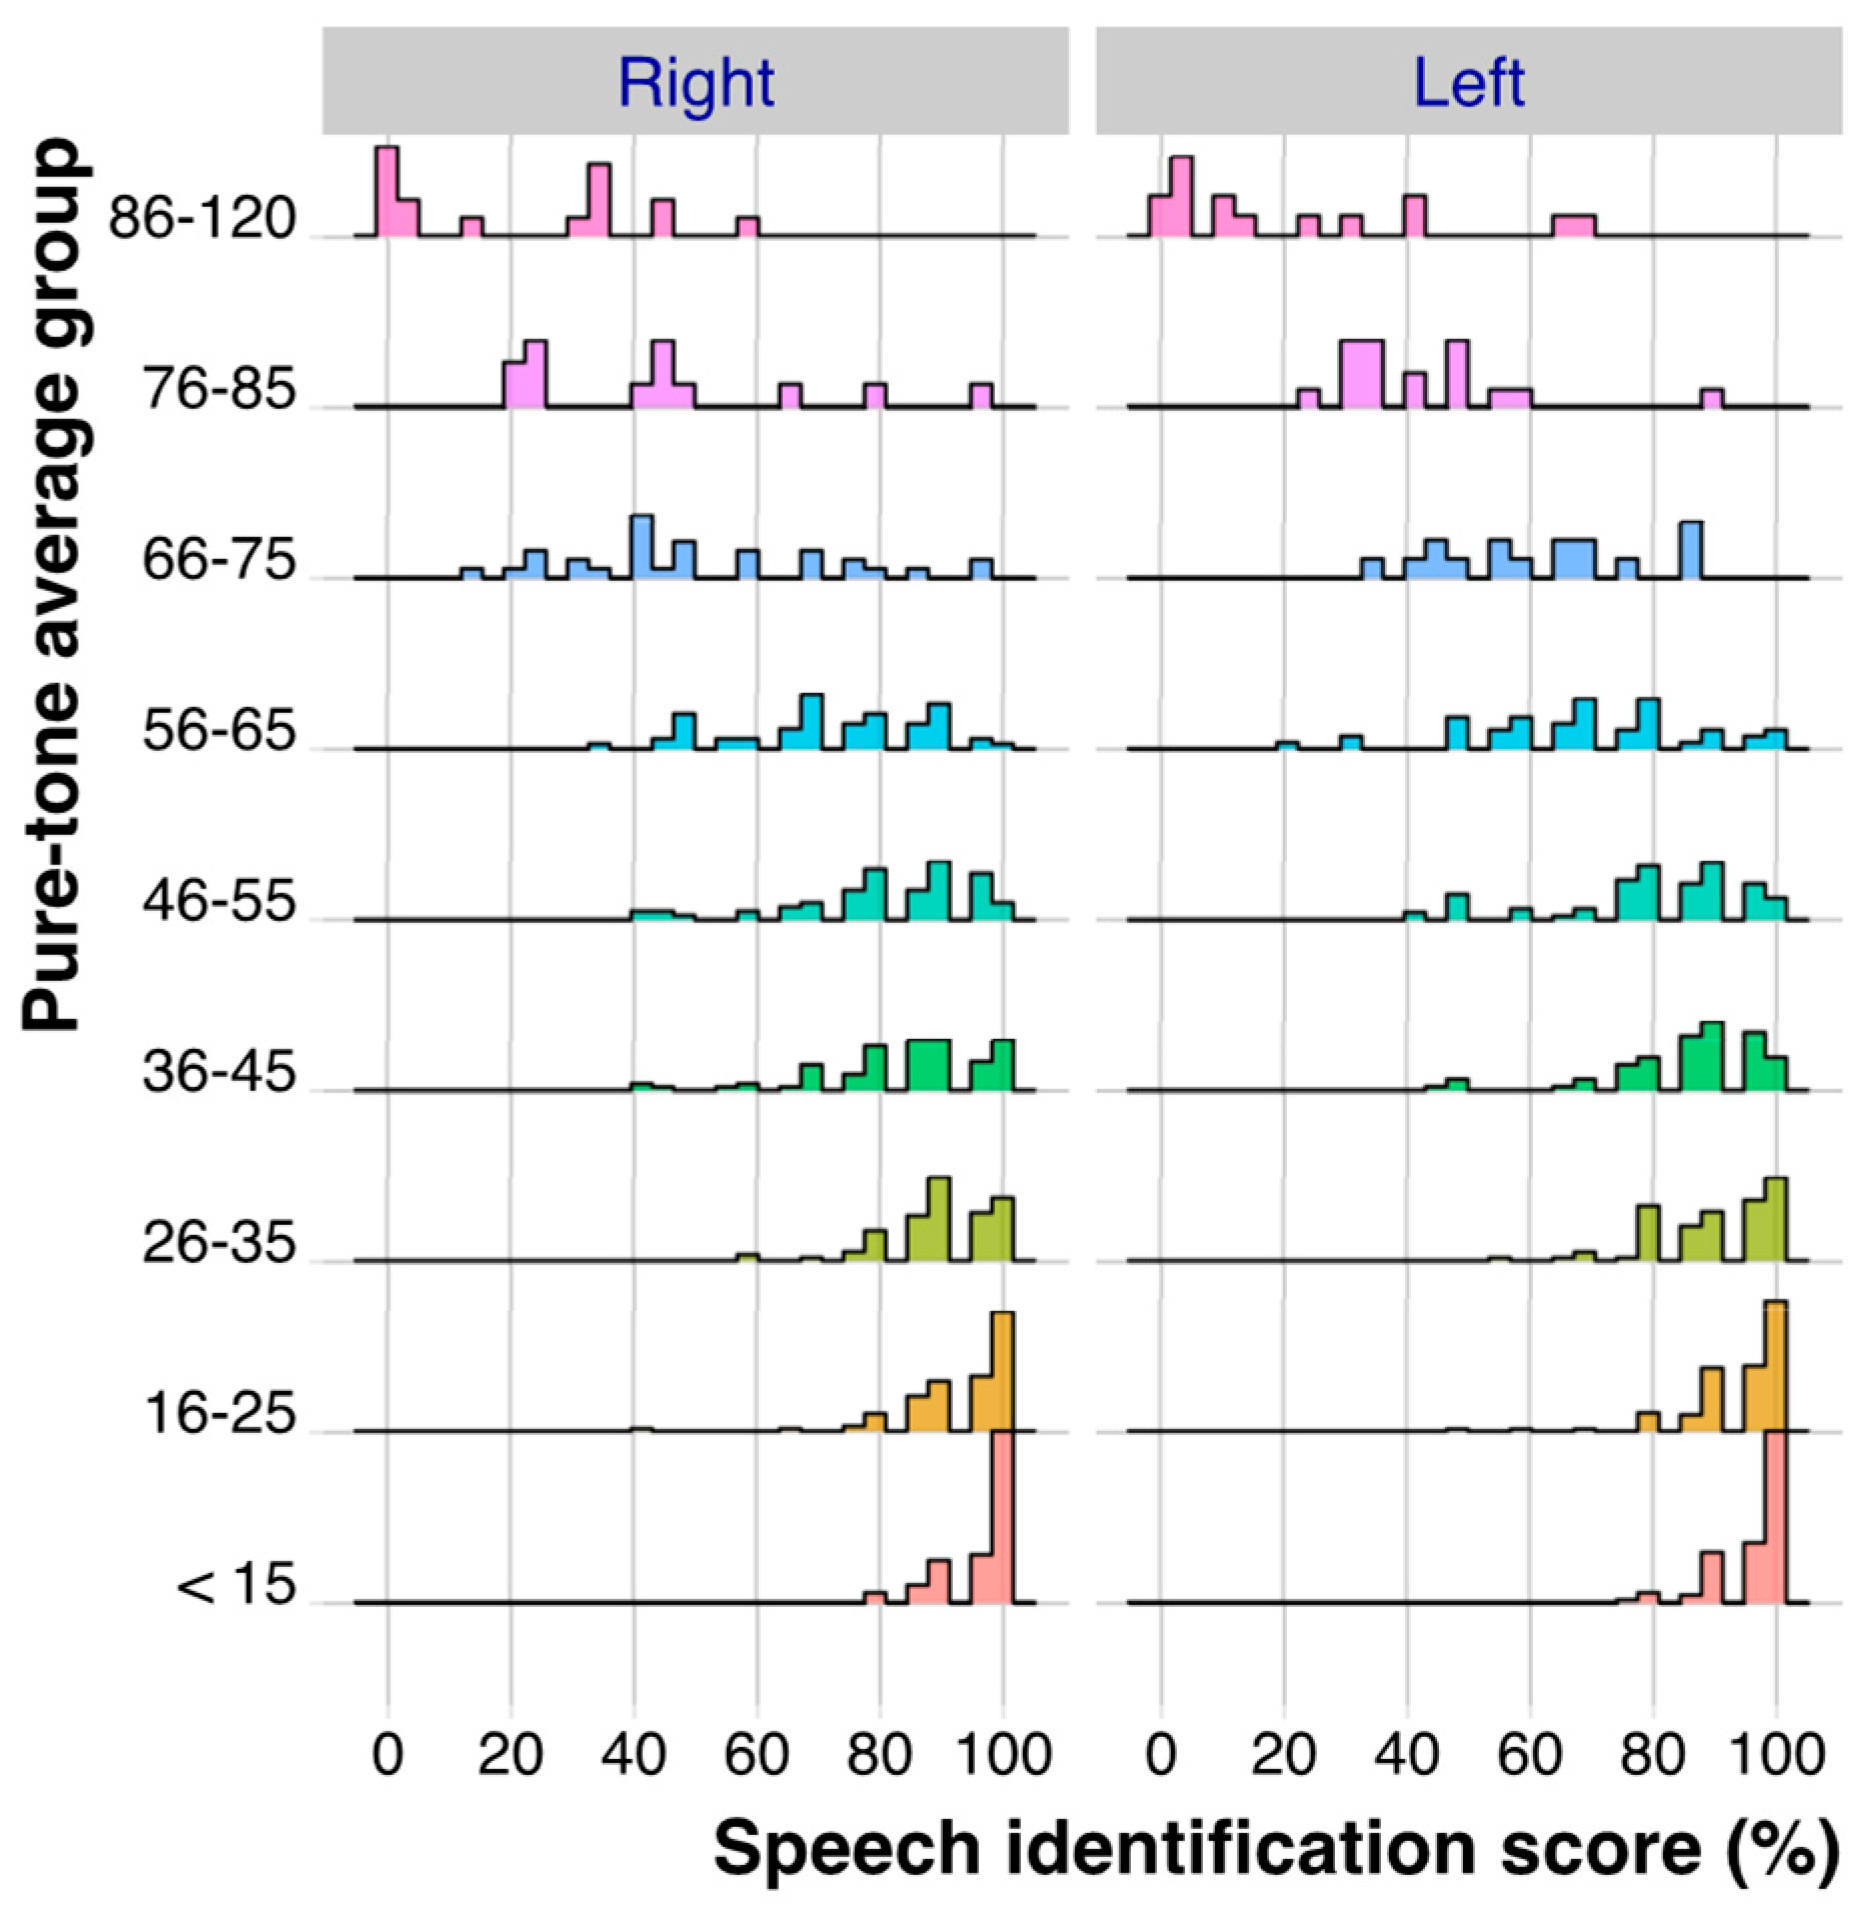
2.4. Distribution of PBmax Values as a Function of PTA
2.5. Method 1: Deriving the Means and 95% CL for PBmax Using the Simulation Method
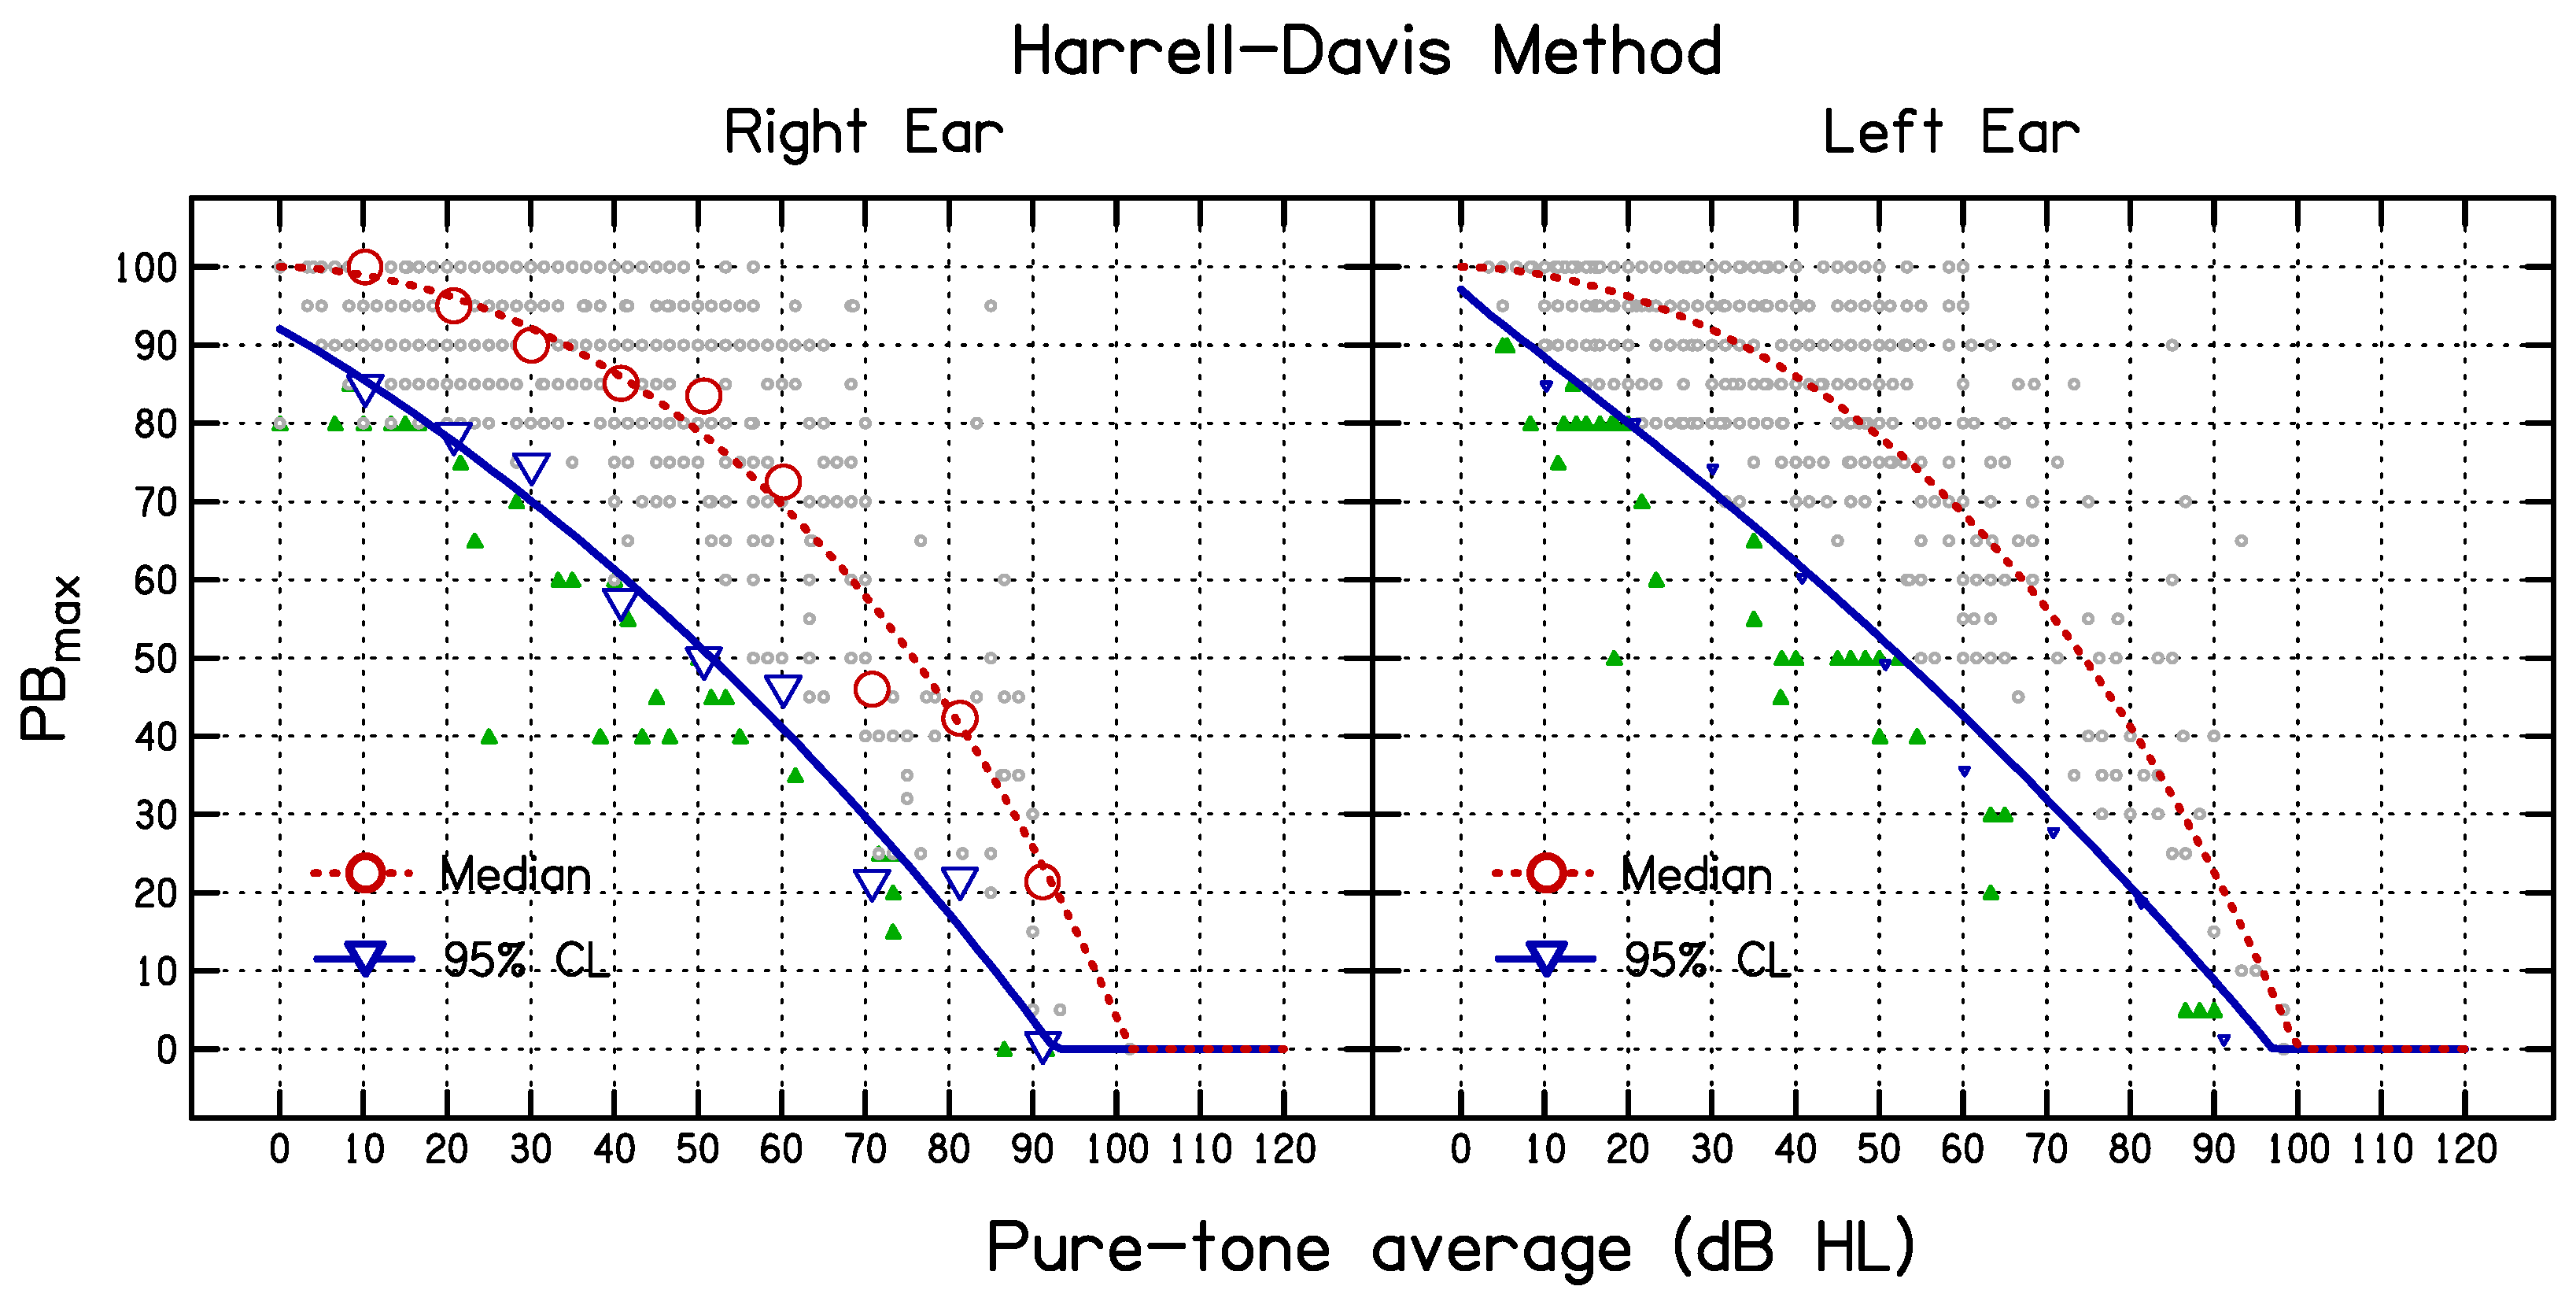
2.6. Method 2: Deriving the Median and 95% CL for PBmax Using the HD Method [16]
2.7. Fitting the Means or Medians and 95% CL Values as a Function of PTA for the Simulation and HD Methods
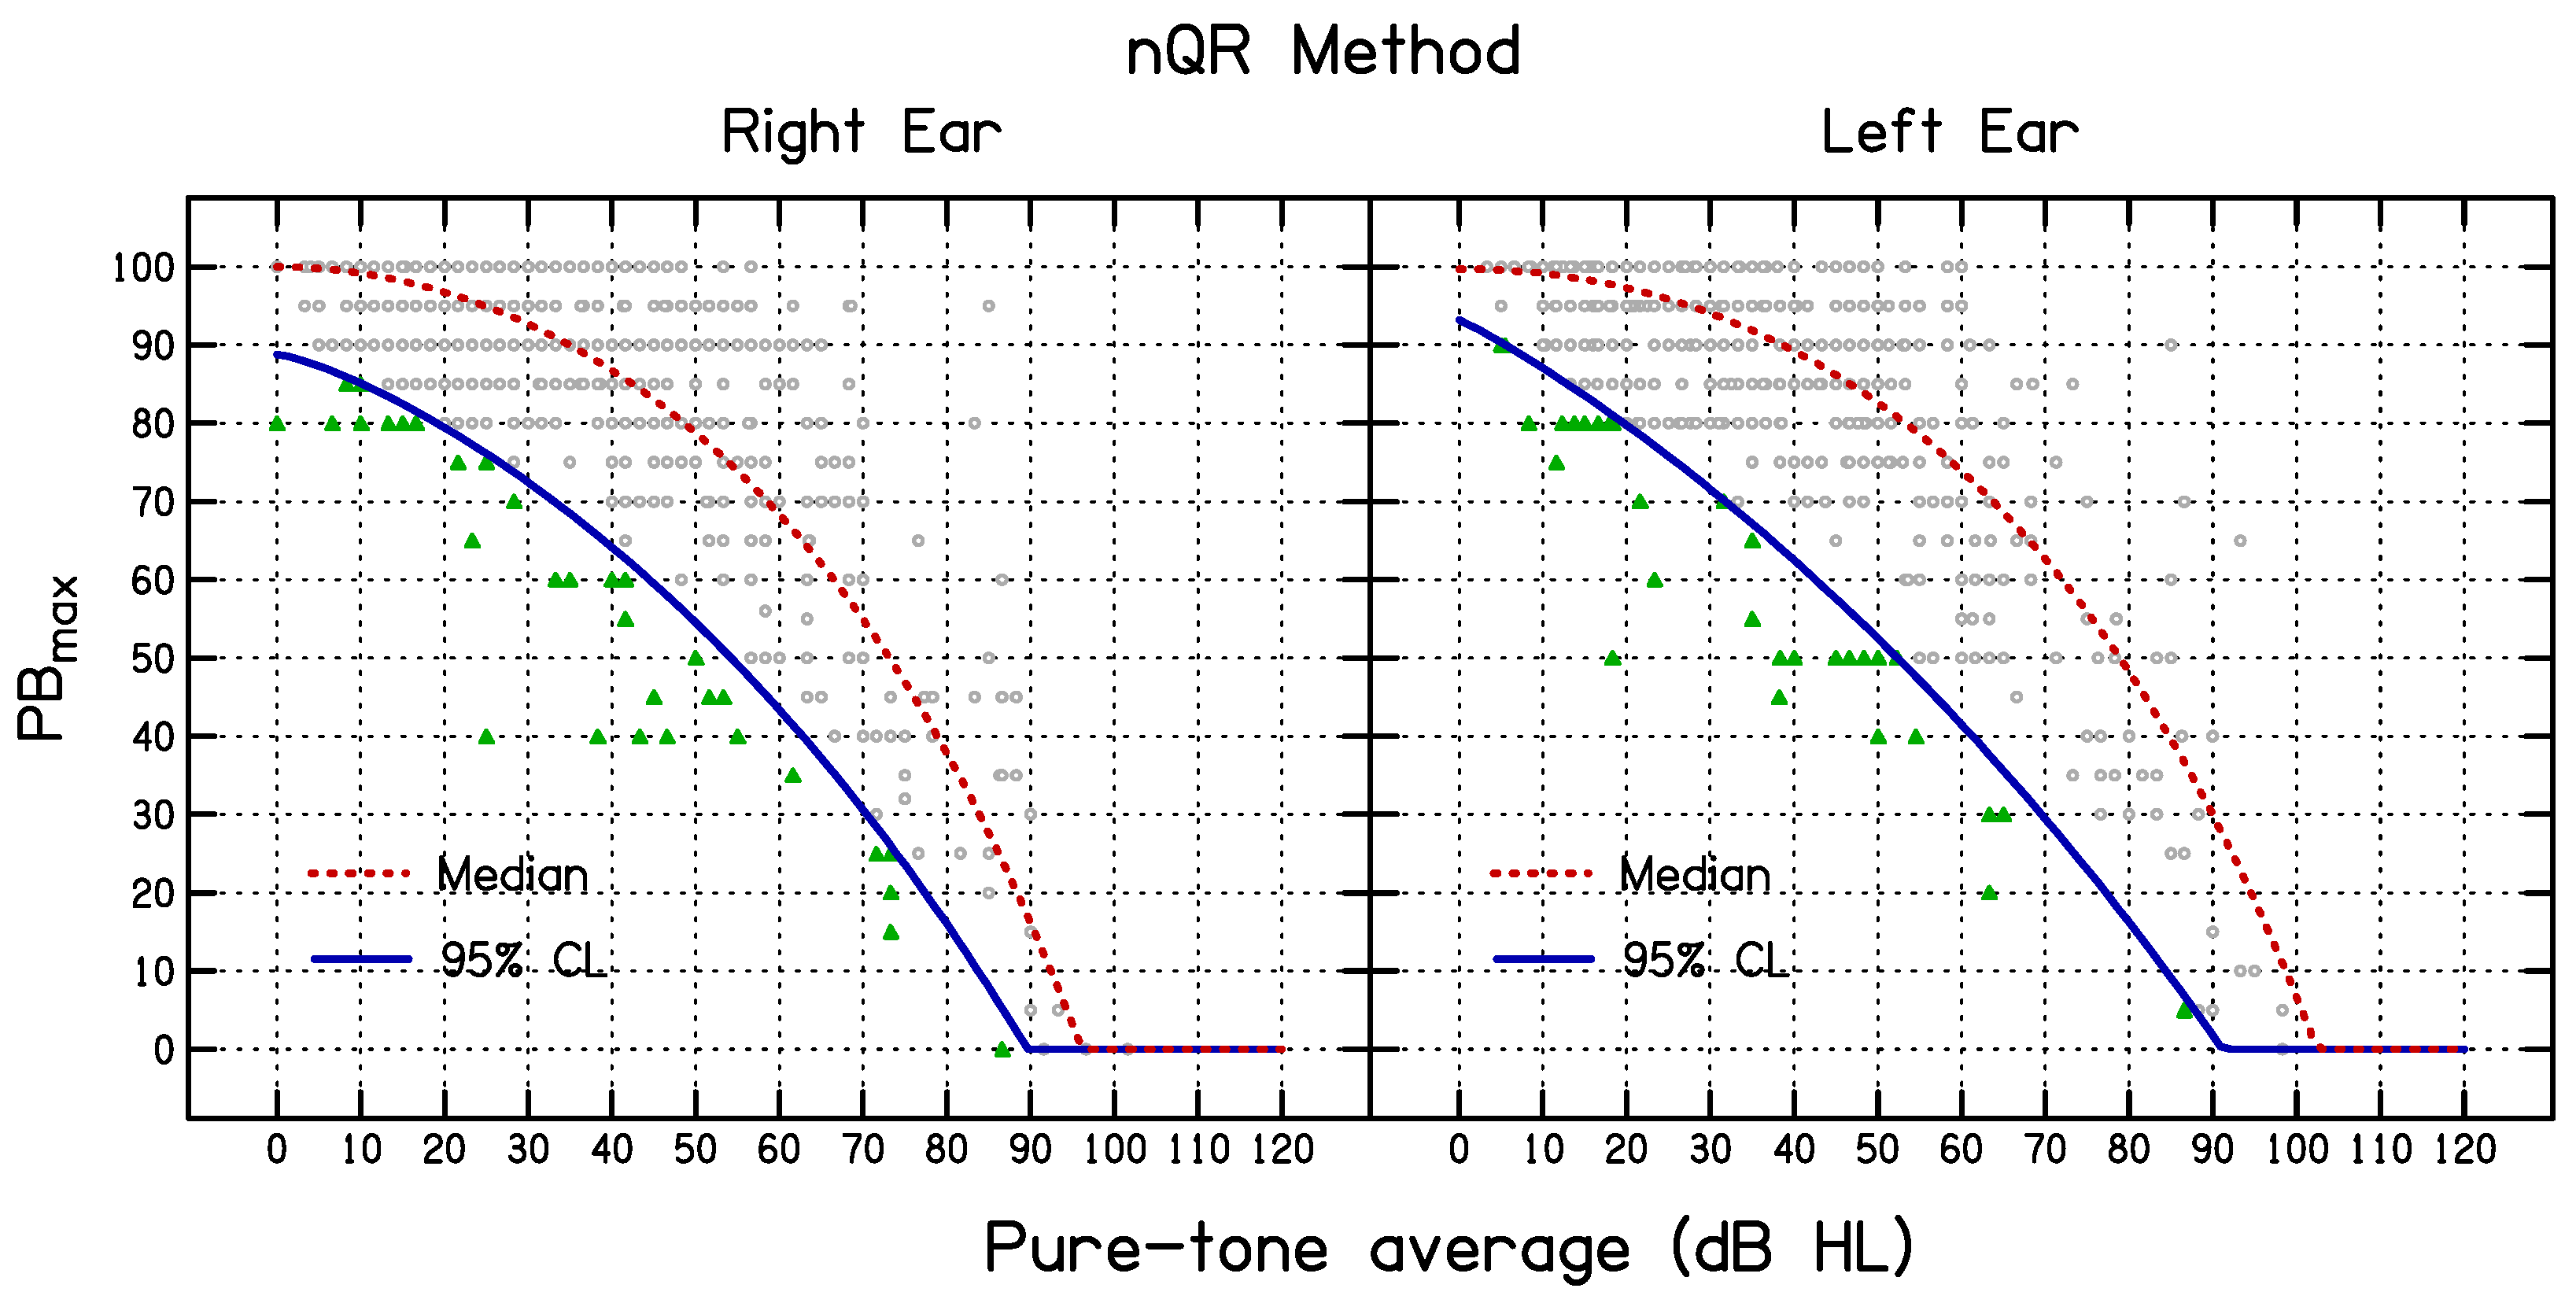
2.8. Method 3: Non-Linear Quantile Regression
2.9. Evaluation of the Three Methods Using Random Draws
3. Results
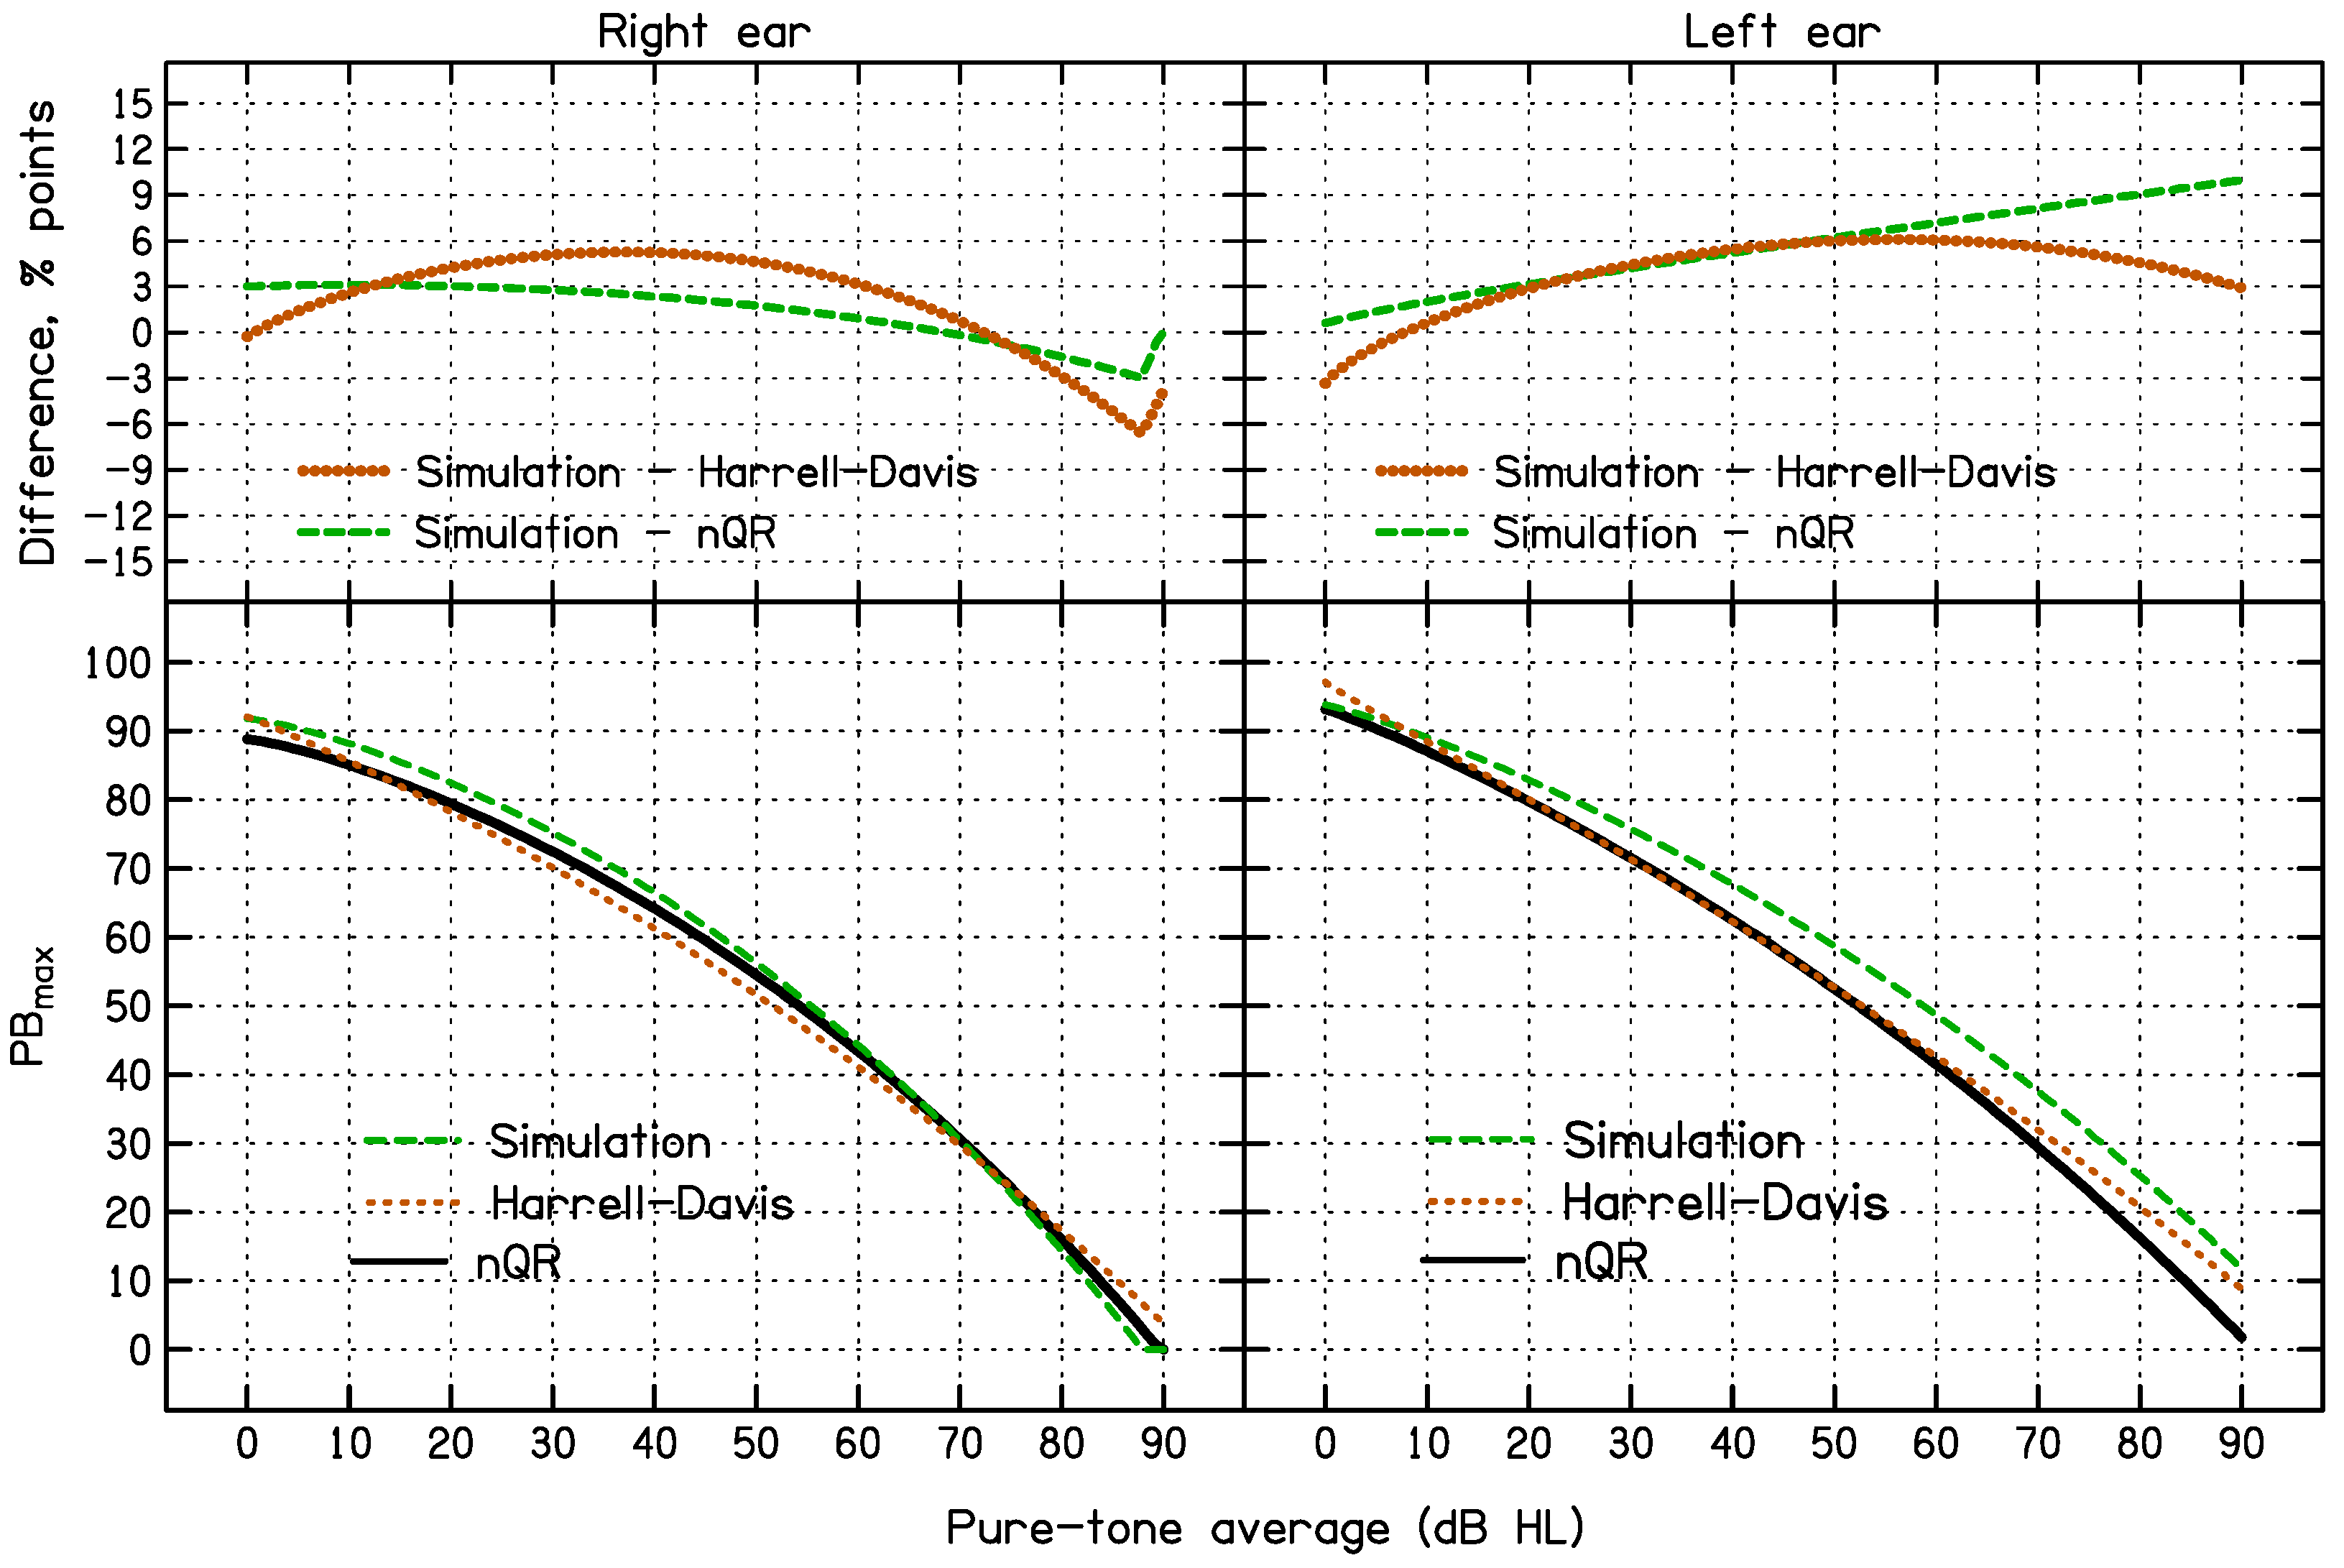
3.1. Comparison of the 95% CL Predicted Using the Three Methods for All Data
3.2. Accuracy and Consistency of the 95% CL Predicted Using the Three Methods
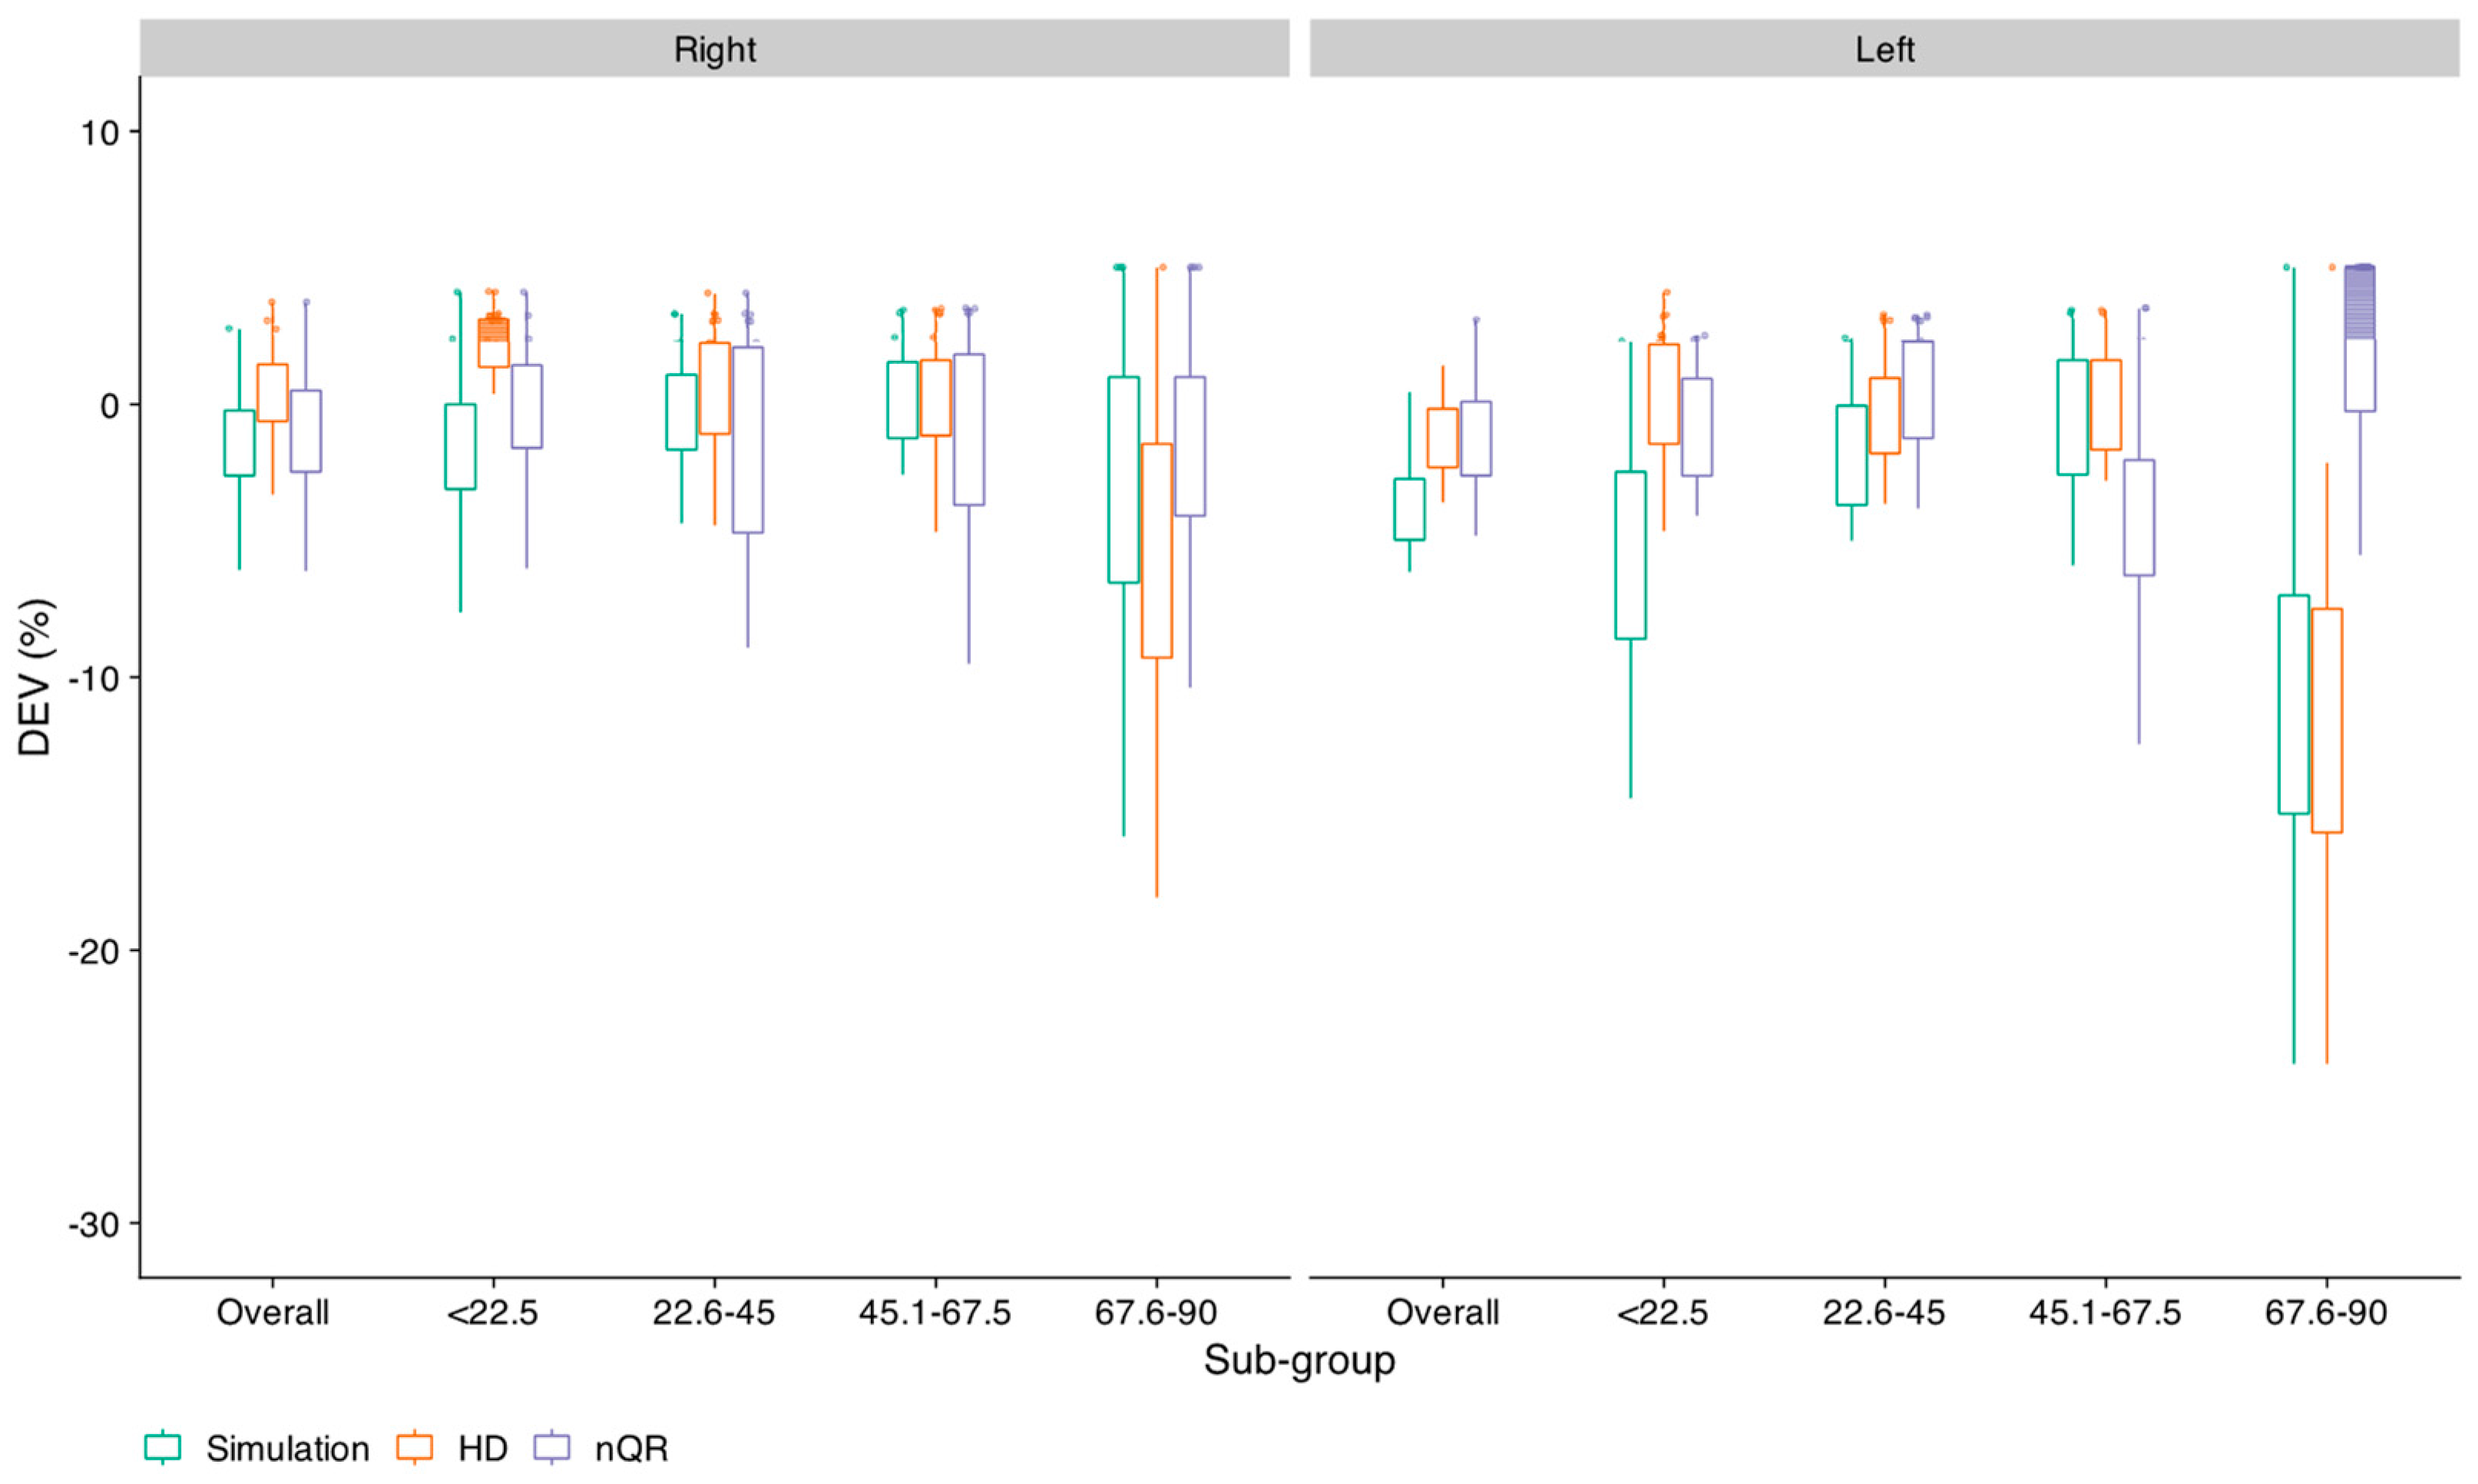
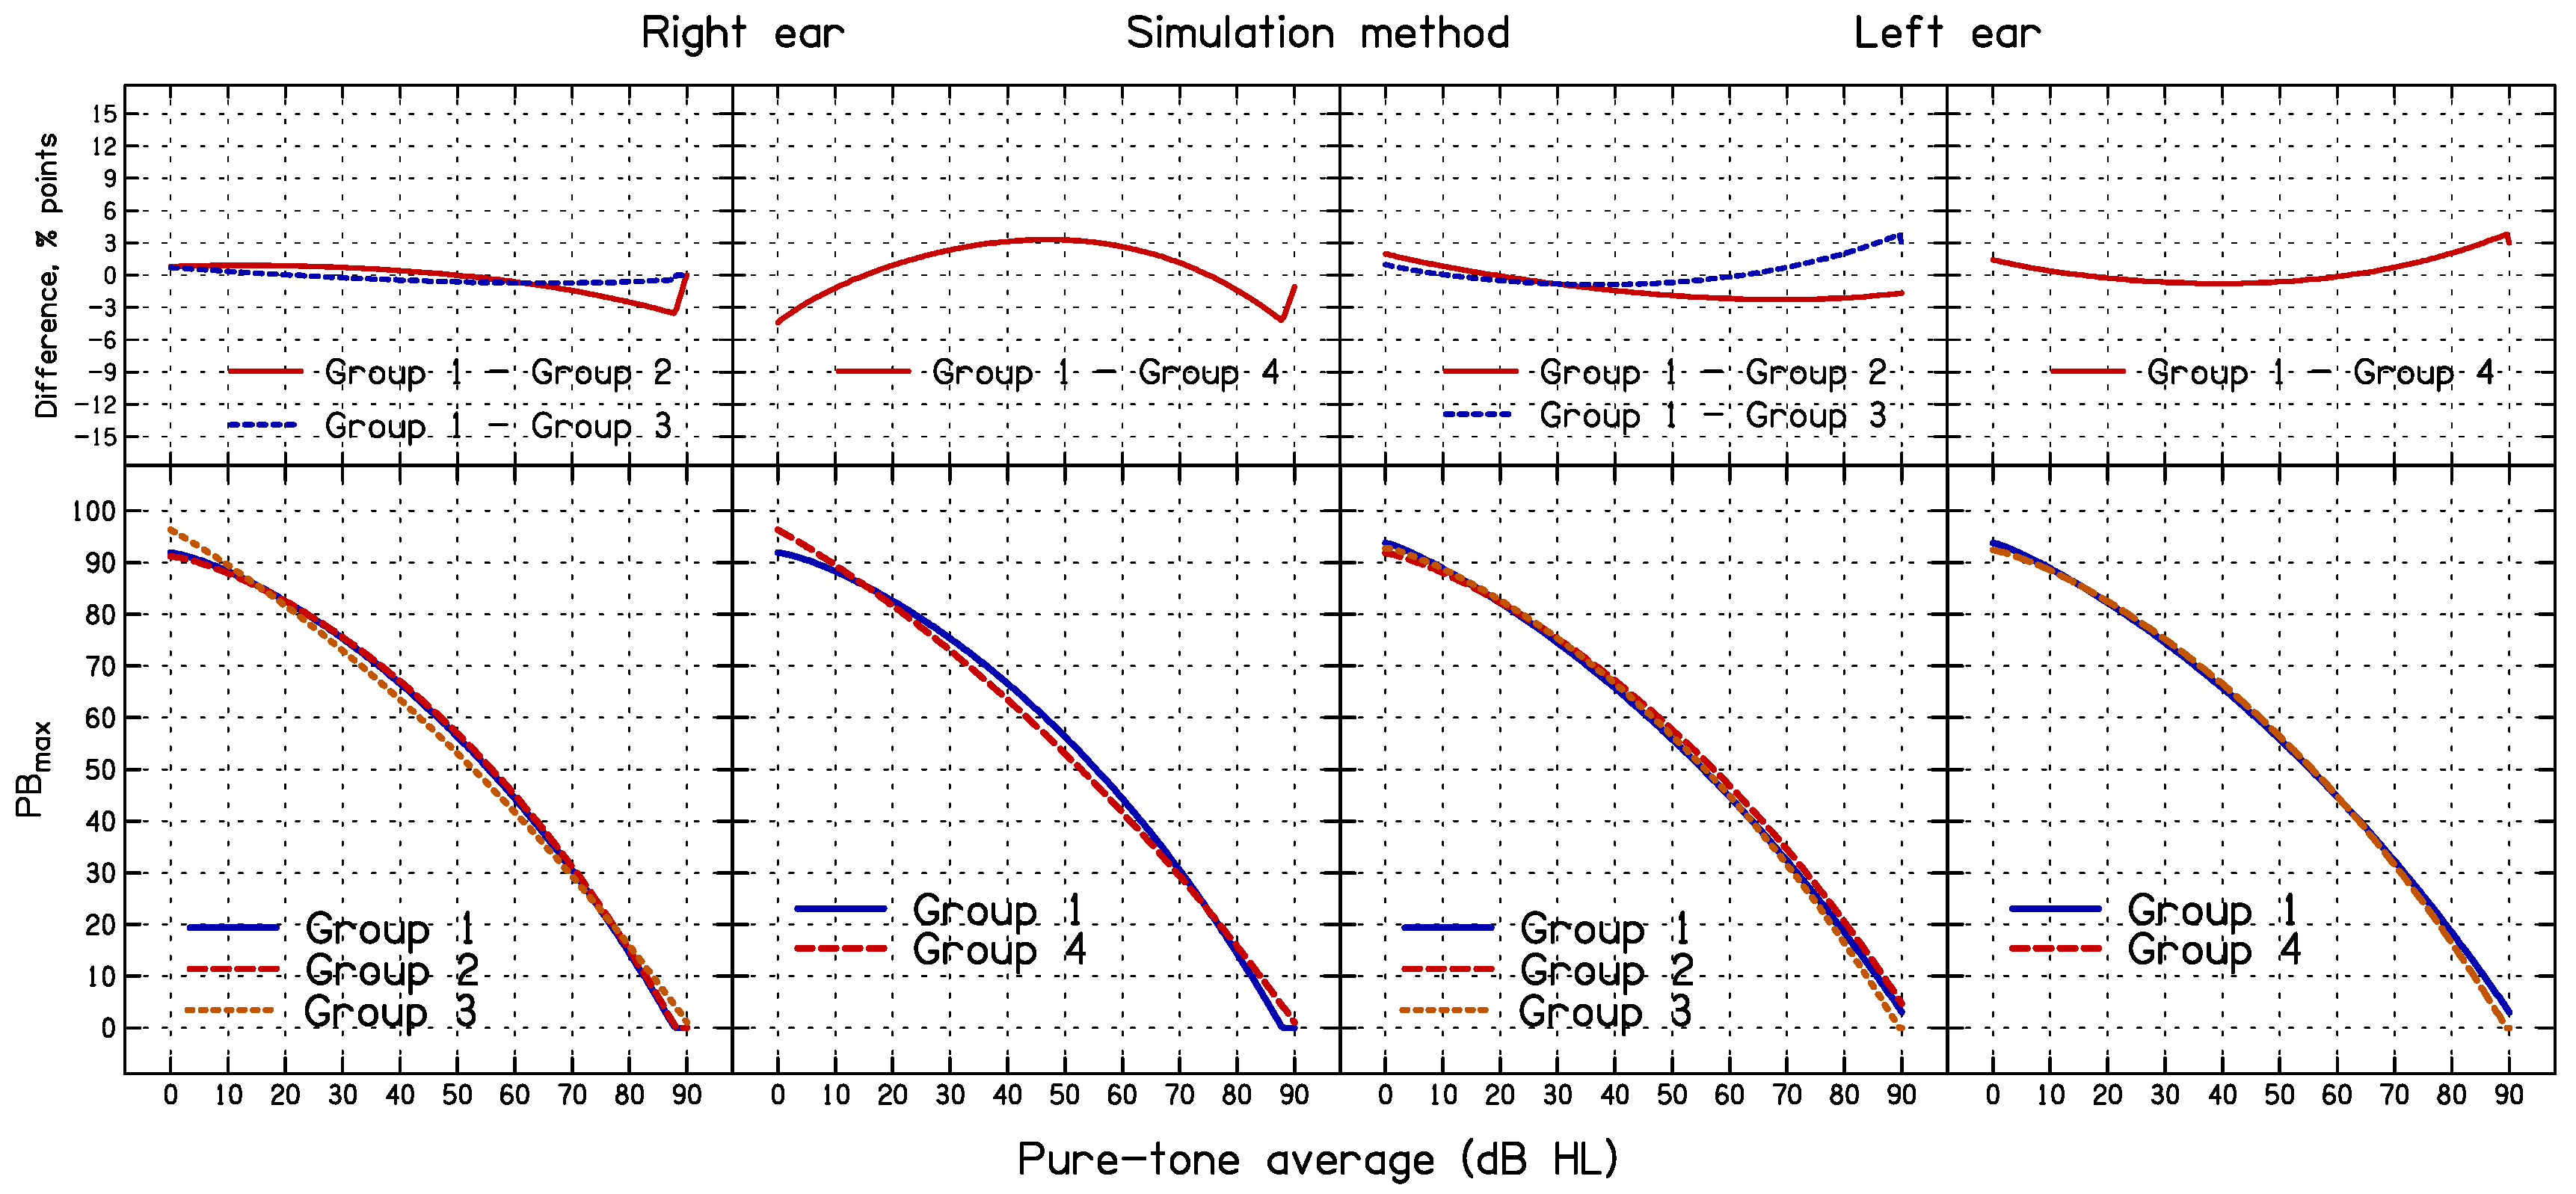
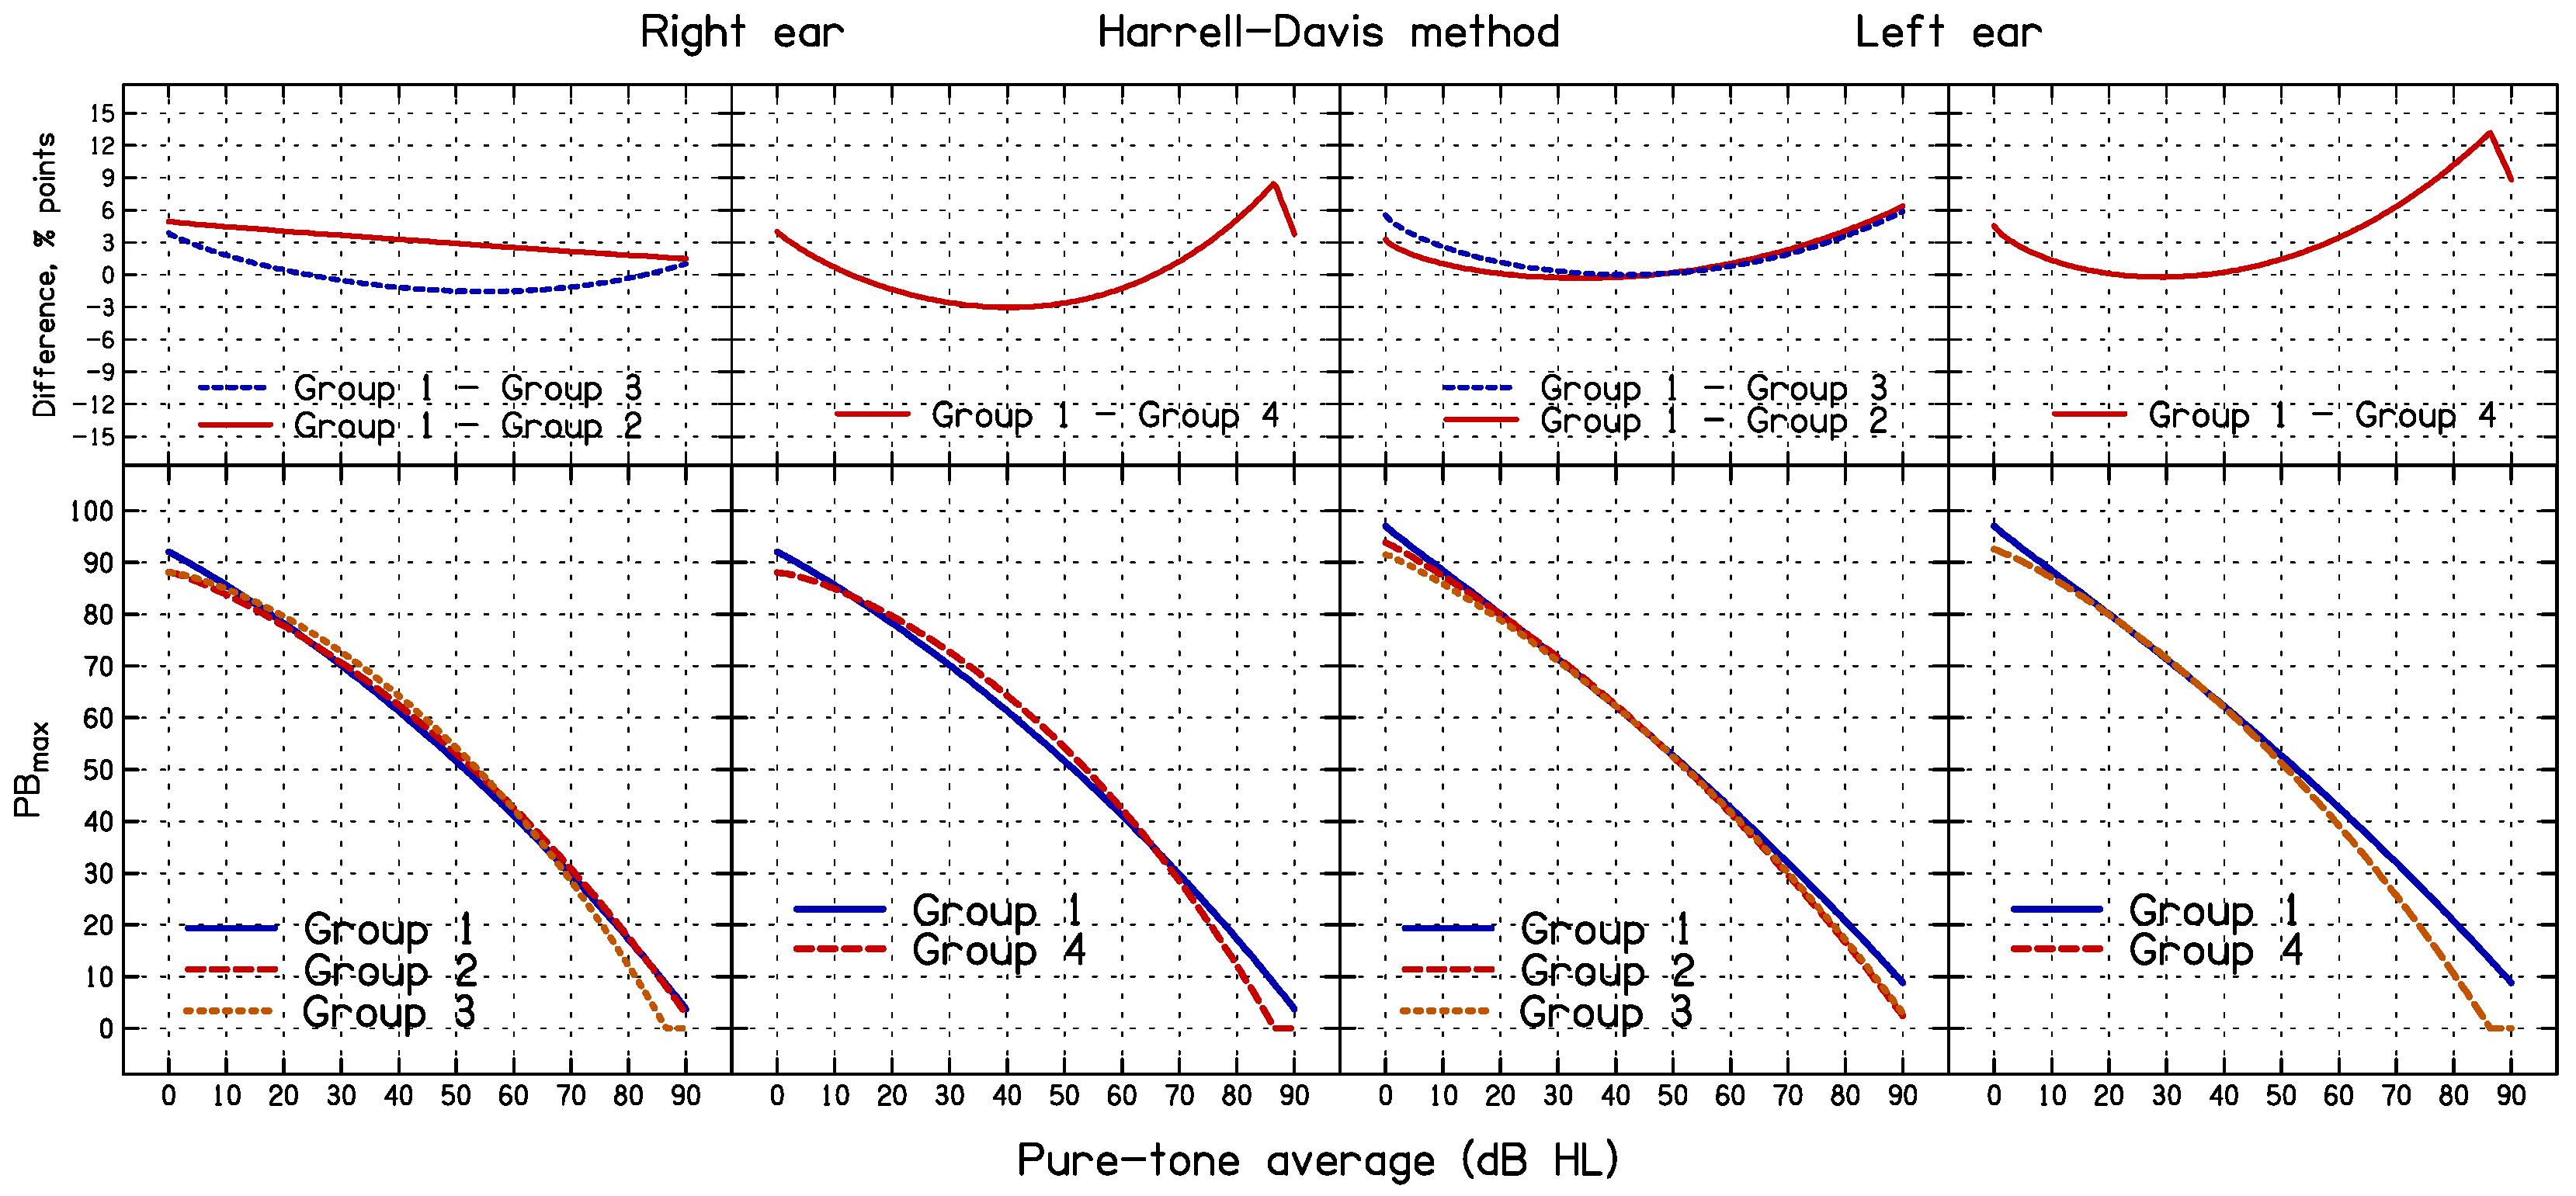
3.3. Effect of Sub-Group Formation on the Outcome of the Simulation and HD Methods
4. Discussion
5. Conclusions
Author Contributions
Funding
Institutional Review Board Statement
Informed Consent Statement
Data Availability Statement
Acknowledgments
Conflicts of Interest
References
- Martin, F.; Morris, L. Current audiologic practices in the United States. Hear. J. 1989, 42, 25–44. [Google Scholar]
- DeBow, A.; Green, W.B. A Survey of Canadian Audiological Practices: Pure Tone and Speech Audiometry Enquete sur les pratiques en audiologie au Canada: Audiometrie tonale liminaire et vocale. J. Speech Lang. Pathol. Audiol. 2000, 24. [Google Scholar]
- Martin, F.N.; Champlin, C.A.; Chambers, J.A. Seventh survey of audiometric practices in the United States. J. Am. Acad. Audiol. 1998, 9, 95–104. [Google Scholar] [PubMed]
- McArdle, R.; Hnath-Chisolm, T. Speech audiometry. In Handbook of Clinical Audiology, 7th ed.; Katz, J., Burkard, R.F., Medwetsky, L., Hood, L., Eds.; Lippincott Williams & Wilkins: Baltimore, MD, USA, 2010; pp. 61–76. [Google Scholar]
- Gelfand, S. Pure Tone Audiometry. In Essentials of Audiology, 4th ed.; Thieme Medical Publishers: New York, NY, USA, 2016. [Google Scholar]
- Schlauch, R.S.; Nelson, P. Puretone Evaluation. In Handbook of Clinical Audiology, 7th ed.; Katz, J., Chasin, M., English, K.M., Hood, L.J., Tillery, K.L., Eds.; Lippincott Williams & Wilkins: Philadelphia, PA, USA, 2015; pp. 29–47. [Google Scholar]
- Dubno, J.R.; Lee, F.S.; Klein, A.J.; Matthews, L.J.; Lam, C.F. Confidence limits for maximum word-recognition scores. J. Speech Lang. Hear. Res. 1995, 38, 490–502. [Google Scholar] [CrossRef] [PubMed]
- Narne, V.K.; Möller, S.; Wolff, A.; Houmøller, S.S.; Loquet, G.; Hammershøi, D.; Schmidt, J.H. Confidence Limits of Word Identification Scores Derived Using Nonlinear Quantile Regression. Trends Hear. 2021, 25, 2331216520983110. [Google Scholar] [CrossRef] [PubMed]
- Mueller, H.G.; Hornsby, B.W.Y. 20Q: Word recognition testing—Let’s just agree to do it right! Audiol. Online 2020, 26478. [Google Scholar]
- Thibodeau, L.M. Speech audiometry. In Audiology: Diagnosis, 2nd ed.; Roeser, R.J., Michael, V., Hosford-Dunn, H., Eds.; Thieme: New York, NY, USA, 2007; pp. 288–313. [Google Scholar]
- Yellin, M.W.; Jerger, J.; Fifer, R.C. Norms for disproportionate loss in speech intelligibility. Ear Hear. 1989, 10, 231–234. [Google Scholar] [CrossRef]
- Margolis, R.H.; Wilson, R.H.; Saly, G.L. Clinical Interpretation of Word-Recognition Scores for Listeners with Sensorineural Hearing Loss: Confidence Intervals, Limits, and Levels. Ear Hear. 2023, 44, 1133–1139. [Google Scholar] [CrossRef] [PubMed]
- Causey, G.D.; Hermanson, C.L.; Hood, L.J.; Bowling, L.S. A comparative evaluation of the Maryland NU 6 auditory test. J. Speech Hear. Disord. 1983, 48, 62–69. [Google Scholar] [CrossRef]
- Wilcox, R.R. Introduction to Robust Estimation and Hypothesis Testing, 5th ed.; Elsevier Science: San Diego, CA, USA, 2021. [Google Scholar]
- Harris, E.K.; Boyd, J.C. Statistical Bases of Reference Values in Laboratory Medicine; CRC Press LLC: Boca Raton, FL, USA, 2019. [Google Scholar]
- Harrell, F.E.; Davis, C.E. A New Distribution-Free Quantile Estimator. Biometrika 1982, 69, 635–640. [Google Scholar] [CrossRef]
- Dielman, T.; Lowry, C.; Pfaffenberger, R. A comparison of quantile estimators. Commun. Stat. Simul. Comput. 1994, 23, 355–371. [Google Scholar] [CrossRef]
- Feng, X.; He, X.; Hu, J. Wild Bootstrap for Quantile Regression; Oxford University Press: Oxford, UK, 2011; Volume 98, pp. 995–999. [Google Scholar]
- Koenker, R.; Park, B.J. An interior point algorithm for nonlinear quantile regression. J. Econom. 1996, 71, 265–283. [Google Scholar] [CrossRef]
- Parrish, R.S. Comparison of Quantile Estimators in Normal Sampling. Biometrics 1990, 46, 247–257. [Google Scholar] [CrossRef]
- Gerke, O. Nonparametric Limits of Agreement in Method Comparison Studies: A Simulation Study on Extreme Quantile Estimation. Int. J. Environ. Res. Public Health 2020, 17, 8330. [Google Scholar] [CrossRef]
- Carhart, R.; Jerger, J. Preferred method for clinical determination of pure-tone thresholds. J. Speech Hear. Disord. 1959, 24, 330–345. [Google Scholar] [CrossRef]
- American Speech-Language-Hearing Association. Determining threshold level for speech (No. GL1988-00008). ASHA 1988, 30, 85–89. [Google Scholar] [CrossRef]
- Mayadevi; Vyasamurthy, M. N. Development and Standardization of a Common Speech Discrimination Test for Indians; University of Mysore: Mysore, India, 1974. [Google Scholar]
- Thakor, H. South African Audiologists’ Use of Speech-in-Noise Testing for Adults with Hearing Difficulties. Master’s Thesis, University of the Witwatersrand, Johannesburg, South Africa, 2020. [Google Scholar]
- Myles, A.J. The clinical use of Arthur Boothroyd (AB) word lists in Australia: Exploring evidence-based practice. Int. J. Audiol. 2017, 56, 870–875. [Google Scholar] [CrossRef]
- Parmar, B.J.; Rajasingam, S.L.; Bizley, J.K.; Vickers, D.A. Factors Affecting the Use of Speech Testing in Adult Audiology. Am. J. Audiol. 2022, 31, 528–540. [Google Scholar] [CrossRef]
- Roeser, R.J.; Clark, J.L. Clinical Masking. In Audiology: Diagnosis, 2nd ed.; Roeser, R.J., Michael, V., Hosford-Dunn, H., Eds.; Thieme: New York, NY, USA, 2007; pp. 602–658. [Google Scholar]
- R Core Team. R: A Language and Environment for Statistical Computing; 4.2.1 (2022); R Foundation for Statistical Computing: Vienna, Austria, 2019. [Google Scholar]
- RStudio Team. RStudio: Integrated Development for R, 2022.12.0+353; RStudio, Inc: Boston, MA, USA, 2022. [Google Scholar]
- Koenker, R. Quantreg: Quantile Regression in R Package (Version 5.95), R Package Version 5.51; 2023. Available online: https://cran.r-project.org/web/packages/quantreg/quantreg.pdf (accessed on 8 June 2024).
- Wilcox, R.R.; Schönbrodt, F.D. The WRS Package for Robust Statistics in R (Version 0.40). 2022. Available online: https://rdrr.io/rforge/WRS/ (accessed on 8 June 2024).
- Dowd, K. Model Risk. In Measuring Market Risk; Wiley: Hoboken, NJ, USA, 2005; pp. 351–363. [Google Scholar] [CrossRef]
- Koenker, R.; Machado, J.A.F. Goodness of Fit and Related Inference Processes for Quantile Regression. J. Am. Stat. Assoc. 1999, 94, 1296–1310. [Google Scholar] [CrossRef]
- Xu, Q.; Niu, X.; Jiang, C.; Huang, X. The Phillips curve in the US: A nonlinear quantile regression approach. Econ. Model. 2015, 49, 186–197. [Google Scholar] [CrossRef]
- Hughey, R.L. A survey and comparison of methods for estimating extreme right tail-area quantiles. Commun. Stat. Theory Methods 1991, 20, 1463–1496. [Google Scholar] [CrossRef]
- Lê Cook, B.; Manning, W.G. Thinking beyond the mean: A practical guide for using quantile regression methods for health services research. Shanghai Arch. Psychiatry 2013, 25, 55–59. [Google Scholar] [CrossRef] [PubMed]
- Selvin, S. Two issues concerning the analysis of grouped data. Eur. J. Epidemiol. 1987, 3, 284–287. [Google Scholar] [CrossRef] [PubMed]
- Robinson, W. Ecological Correlations and the Behavior of Individuals*. Int. J. Epidemiol. 2009, 38, 337–341. [Google Scholar] [CrossRef] [PubMed]
- Rance, G. Auditory neuropathy/dys-synchrony and its perceptual consequences. Trends Amplif. 2005, 9, 1–43. [Google Scholar] [CrossRef] [PubMed]
- Kirkwood. When it comes to hearing aids, “more” was the story on ‘04. Hear. J. 2005, 58, 28–37. [Google Scholar] [CrossRef]
- Chang, Y.S.; Choi, J.; Moon, I.J.; Hong, S.H.; Chung, W.H.; Cho, Y.S. Factors associated with self-reported outcome in adaptation of hearing aid. Acta Oto-Laryngol. 2016, 136, 905–911. [Google Scholar] [CrossRef] [PubMed]
- Brännström, K.J.; Lantz, J.; Nielsen, L.H.; Olsen, S. Prediction of IOI-HA scores using speech reception thresholds and speech discrimination scores in quiet. J. Am. Acad. Audiol. 2014, 25, 154–163. [Google Scholar] [CrossRef] [PubMed]
- Wang, X.; Zheng, Y.; Li, G.; Lu, J.; Yin, Y. Objective and Subjective Outcomes in Patients with Hearing Aids: A Cross-Sectional, Comparative, Associational Study. Audiol. Neurotol. 2022, 27, 166–174. [Google Scholar] [CrossRef]
- Dörfler, C.; Hocke, T.; Hast, A.; Hoppe, U. Speech recognition with hearing aids for 10 standard audiograms. HNO 2020, 68, 93–99. [Google Scholar] [CrossRef]
- Dornhoffer, J.R.; Meyer, T.A.; Dubno, J.R.; McRackan, T.R. Assessment of Hearing Aid Benefit Using Patient-Reported Outcomes and Audiologic Measures. Audiol. Neurotol. 2020, 25, 215–223. [Google Scholar] [CrossRef] [PubMed]
- Humes, L.E.; Wilson, D.L.; Humes, A.C. Examination of differences between successful and unsuccessful elderly hearing aid candidates matched for age, hearing loss and gender. Int. J. Audiol. 2003, 42, 432–441. [Google Scholar] [CrossRef] [PubMed]
- Fereczkowski, M.; Neher, T. Predicting Aided Outcome With Aided Word Recognition Scores Measured With Linear Amplification at Above-conversational Levels. Ear Hear. 2023, 44, 155–166. [Google Scholar] [CrossRef] [PubMed]
- Houmøller, S.S.; Wolff, A.; Möller, S.; Narne, V.K.; Narayanan, S.K.; Godballe, C.; Hougaard, D.D.; Loquet, G.; Gaihede, M.; Hammershøi, D.; et al. Prediction of successful hearing aid treatment in first-time and experienced hearing aid users: Using the International Outcome Inventory for Hearing Aids. Int. J. Audiol. 2022, 61, 119–129. [Google Scholar] [CrossRef] [PubMed]


| PTA Range | N | PTA (dB HL) | Measured Data | Simulation Method | Harrell–Davis | ||||||||||
|---|---|---|---|---|---|---|---|---|---|---|---|---|---|---|---|
| Mean | SD | Skewness | Kurtosis | Mean | SD | 95% CLS | SE of 95% CLS | Percent below 95% CLS | Median | 95% CLHD | SE of 95% CLHD | Percent below 95% CLHD | |||
| <15 | 151 | 10.2 | 96.2 | 5.6 | −1.3 | 3.8 | 94.6 | 4.1 | 88 | 0.95 | 9.3 | 100.0 | 84.1 | 0.15 | 3.7 |
| 16–25 | 115 | 20.8 | 93.0 | 8.9 | −2.4 | 13.1 | 90.8 | 6.6 | 80 | 1.8 | 3.5 | 95.0 | 78.0 | 0.45 | 3.6 |
| 26–35 | 96 | 30.1 | 89.9 | 8.4 | −1.0 | 4.7 | 88.4 | 6.6 | 76 | 1.8 | 6.3 | 90.0 | 74.1 | 0.46 | 3.4 |
| 36–45 | 91 | 40. 8 | 84.3 | 13.2 | −1.2 | 4.9 | 82.0 | 10.2 | 64 | 2.9 | 6.6 | 85.1 | 56.8 | 0.48 | 4.5 |
| 46–55 | 69 | 50.7 | 81.2 | 14.4 | −1.2 | 4.1 | 78.9 | 11.9 | 60 | 3.7 | 7.3 | 83.5 | 49.3 | 0.19 | 5.5 |
| 56–65 | 58 | 60.2 | 72.3 | 15.3 | −0.4 | 2.3 | 70.9 | 12.3 | 48 | 4.3 | 5.2 | 72.5 | 45.7 | 0.32 | 5.1 |
| 66–75 | 32 | 70.8 | 50.8 | 21.7 | 0.4 | 2.3 | 50.8 | 16.0 | 24 | 8.1 | 3.1 | 46.0 | 20.9 | 0.17 | 6.3 |
| 76–85 | 14 | 81.3 | 44.6 | 23.5 | 0.9 | 2.8 | 45.4 | 16.5 | 16 | 13.8 | 0.0 | 42.3 | 21.1 | 0.19 | 15.4 |
| 86–120 | 16 | 91.2 | 21.6 | 20.5 | 0.3 | 1.7 | 25.3 | 14.5 | 8 | 10.8 | 13.3 | 21.4 | 0.1 | 0.0 | 13.3 |
| PTA Range | N | PTA (dB HL) | Measured Data | Simulation Method | Harrell–Davis | ||||||||||
|---|---|---|---|---|---|---|---|---|---|---|---|---|---|---|---|
| Mean | SD | Skewness | Kurtosis | Mean | SD | 95% CLS | SE of 95% CLS | Percent below 95% CLS | Median | 95% CLHD | SE of 95% CHD | Percent below 95% CLHD | |||
| <15 | 126 | 12.1 | 96.2 | 5.5 | −1.5 | 5.0 | 94.6 | 4.1 | 88 | 1.1 | 6.3 | 100.0 | 84.7 | 0.06 | 4.0 |
| 16–25 | 147 | 19.9 | 93.9 | 7.8 | −2.2 | 10.9 | 91.9 | 5.8 | 80 | 1.4 | 8.2 | 95.0 | 79. 9 | 0.45 | 3.4 |
| 26–35 | 104 | 30.3 | 90.1 | 9.3 | −0.9 | 3.9 | 88.2 | 7.2 | 76 | 1.9 | 4.8 | 91.4 | 74.1 | 0.38 | 4.8 |
| 36–45 | 83 | 40.8 | 85.8 | 11.8 | −1.5 | 5.6 | 83.7 | 9.2 | 68 | 2.7 | 6.0 | 89.0 | 60.1 | 0.25 | 4.8 |
| 46–55 | 84 | 50.6 | 80.4 | 14.7 | −1.0 | 3.5 | 78.0 | 11.5 | 56 | 3.4 | 10.7 | 82.5 | 49.1 | 0.52 | 3.5 |
| 56–65 | 48 | 61.2 | 69.3 | 18.0 | −0.5 | 3.3 | 67.4 | 14.0 | 40 | 5.5 | 6.3 | 70.0 | 35.3 | 0.55 | 6.3 |
| 66–75 | 16 | 70.6 | 61.6 | 16.2 | 0.0 | 1.9 | 60.8 | 13.5 | 36 | 8.6 | 6.3 | 61.4 | 27.6 | 0.09 | 6.3 |
| 76–85 | 18 | 80.7 | 42.8 | 15.6 | 1.6 | 5.7 | 43.2 | 13.3 | 20 | 7.7 | 0.0 | 37.7 | 18.6 | 0.03 | 5.6 |
| 86–120 | 15 | 91.3 | 21.7 | 22.9 | 1.0 | 2.8 | 26.2 | 15.7 | 8 | 12.5 | 13.3 | 21.2 | 1.1 | 0.00 | 13.3 |
| Right Ear | ||||||||||||||
|---|---|---|---|---|---|---|---|---|---|---|---|---|---|---|
| Simulation method | Harrell–Davis | Nonlinear QR | ||||||||||||
| β1 | β2 | β3 | R2 | β1 | β2 | β3 | R2 | β1 | β2 | β3 | R1 | |||
| Mean (Measured) | 96.3 (2.7) | 0.0000312 (0.000051) | 2.17 (0.27) | 0.98 | ||||||||||
| Mean (Simulated) | 94.1 (2.7) | 0.0000978 (0.00018) | 1.91 (0.27) | 0.98 | Median | 100 (4.37) | 0.000154 (0.00023) | 1.82 (0.34) | 0.97 | Median | 100 (1.2) | 0.0000900 (0.000060) | 1.96 (0.15) | 0.67 |
| 95% CIS | 91.8 (6.9) | 0.00182 (0.0024) | 1.33 (0.31) | 0.97 | 95% CLHD | 92.07 (7.73) | 0.00613 (0.00063) | 1.04 (0.23) | 0.98 | 95% CLQR | 88.8 (4.6) | 0.00216 (0.0030) | 1.29 (0.36) | 0.76 |
| Left Ear | ||||||||||||||
| Simulation method | Harrell–Davis | Nonlinear QR | ||||||||||||
| β1 | β2 | β3 | R2 | β1 | β2 | β3 | R2 | β1 | β2 | β3 | R1 | |||
| Mean (Measured) | 95.8 (1.9) | 0.0000241 (0.000012) | 2.23 (0.10) | 0.99 | ||||||||||
| Mean (Simulated) | 94.1 (1.3) | 0.0000694 (0.000044) | 1.97 (0.14) | 0.98 | Median | 100 (4.53) | 0.000159 (0.00024) | 1.82 (0.34) | 0.97 | Median | 99.7 (0.8) | 0.0000500 (0.00001) | 2.06 (0.05) | 0.64 |
| 95% CIS | 93.8 (3.9) | 0.00348 (0.0021) | 1.16 (0.14) | 0.99 | 95% CLHD | 97.1 (4.68) | 0.0103 (0.0051) | 0.92 (0.11) | 0.99 | 95% CLQR | 93.2 (5.1) | 0.00536 (0.0057) | 1.08 (0.24) | 0.78 |
| Right Ear | |||||||||||
| Group 1 | Group 2 | Group 3 | Group 4 | ||||||||
| PTA Range | N | Mean | PTA Range | N | Mean | PTA Range | N | Mean | PTA Range | N | Mean |
| <15 | 151 | 10.4 | <10 | 78 | 7.5 | <10 | 78 | 7.5 | <15 | 151 | 10.4 |
| 16–25 | 115 | 20.8 | 11–20 | 136 | 15.8 | 11–15 | 73 | 13.5 | 16–30 | 169 | 23.1 |
| 26–35 | 96 | 30.4 | 21–30 | 106 | 26.0 | 16–20 | 63 | 18.4 | 31–45 | 133 | 38.4 |
| 36–45 | 91 | 40.7 | 31–40 | 89 | 36.0 | 21–25 | 52 | 23.7 | 46–60 | 104 | 53.0 |
| 46–55 | 69 | 50.5 | 41–50 | 79 | 45.3 | 26–30 | 54 | 28.2 | 61–75 | 55 | 67.6 |
| 56–65 | 58 | 60.2 | 51–60 | 69 | 55.6 | 31–35 | 42 | 33.4 | 76–120 | 30 | 86.6 |
| 66–75 | 32 | 70.7 | 61–70 | 41 | 65.7 | 36–40 | 47 | 38.4 | |||
| 76–85 | 14 | 81.6 | 71–80 | 20 | 74.3 | 41–45 | 44 | 43.1 | |||
| 86–120 | 16 | 90.8 | 81–120 | 24 | 88.6 | 46–50 | 35 | 48.0 | |||
| 51–55 | 34 | 53.0 | |||||||||
| 56–60 | 35 | 58.0 | |||||||||
| 61–70 | 41 | 65.7 | |||||||||
| 71–80 | 20 | 74.3 | |||||||||
| 81–120 | 24 | 88.6 | |||||||||
| Left Ear | |||||||||||
| Group 1 | Group 2 | Group 3 | Group 4 | ||||||||
| PTA Range | N | Mean | PTA Range | N | Mean | PTA Range | N | Mean | PTA Range | N | Mean |
| <15 | 126 | 12.1 | <10 | 30 | 8.1 | <10 | 30 | 8.1 | <15 | 126 | 12.1 |
| 16–25 | 147 | 19.9 | 11–20 | 189 | 15. 6 | 11–15 | 96 | 13.3 | 16–30 | 209 | 22.4 |
| 26–35 | 104 | 30.3 | 21–30 | 116 | 25.9 | 16–20 | 93 | 17.9 | 31–45 | 125 | 38.2 |
| 36–45 | 83 | 40.6 | 31–40 | 95 | 36.4 | 21–25 | 54 | 23.4 | 46–60 | 107 | 52.4 |
| 46–55 | 84 | 50.6 | 41–50 | 76 | 46.5 | 26–30 | 62 | 28.2 | 61–75 | 41 | 66.2 |
| 56–65 | 48 | 61.2 | 51–60 | 61 | 55.4 | 31–35 | 42 | 33.5 | 76–120 | 34 | 85.0 |
| 66–75 | 16 | 70.6 | 61–70 | 33 | 64.4 | 36–40 | 53 | 38.8 | |||
| 76–85 | 19 | 80.7 | 71–80 | 19 | 76.1 | 41–45 | 30 | 43.7 | |||
| 86–120 | 15 | 91.2 | 81–120 | 23 | 88.7 | 46–50 | 46 | 48.3 | |||
| 51–55 | 38 | 53.4 | |||||||||
| 56–60 | 23 | 58.7 | |||||||||
| 61–70 | 33 | 64.4 | |||||||||
| 71–80 | 19 | 76.1 | |||||||||
| 81–120 | 23 | 88.7 | |||||||||
Disclaimer/Publisher’s Note: The statements, opinions and data contained in all publications are solely those of the individual author(s) and contributor(s) and not of MDPI and/or the editor(s). MDPI and/or the editor(s) disclaim responsibility for any injury to people or property resulting from any ideas, methods, instructions or products referred to in the content. |
© 2024 by the authors. Licensee MDPI, Basel, Switzerland. This article is an open access article distributed under the terms and conditions of the Creative Commons Attribution (CC BY) license (https://creativecommons.org/licenses/by/4.0/).
Share and Cite
Narne, V.K.; Mohan, D.; Avileri, S.D.; Jain, S.; Ravi, S.K.; Yerraguntla, K.; Almudhi, A.; Moore, B.C.J. Accuracy and Consistency of Confidence Limits for Monosyllable Identification Scores Derived Using Simulation, the Harrell–Davis Estimator, and Nonlinear Quantile Regression. Diagnostics 2024, 14, 1397. https://doi.org/10.3390/diagnostics14131397
Narne VK, Mohan D, Avileri SD, Jain S, Ravi SK, Yerraguntla K, Almudhi A, Moore BCJ. Accuracy and Consistency of Confidence Limits for Monosyllable Identification Scores Derived Using Simulation, the Harrell–Davis Estimator, and Nonlinear Quantile Regression. Diagnostics. 2024; 14(13):1397. https://doi.org/10.3390/diagnostics14131397
Chicago/Turabian StyleNarne, Vijaya Kumar, Dhanya Mohan, Sruthi Das Avileri, Saransh Jain, Sunil Kumar Ravi, Krishna Yerraguntla, Abdulaziz Almudhi, and Brian C. J. Moore. 2024. "Accuracy and Consistency of Confidence Limits for Monosyllable Identification Scores Derived Using Simulation, the Harrell–Davis Estimator, and Nonlinear Quantile Regression" Diagnostics 14, no. 13: 1397. https://doi.org/10.3390/diagnostics14131397
APA StyleNarne, V. K., Mohan, D., Avileri, S. D., Jain, S., Ravi, S. K., Yerraguntla, K., Almudhi, A., & Moore, B. C. J. (2024). Accuracy and Consistency of Confidence Limits for Monosyllable Identification Scores Derived Using Simulation, the Harrell–Davis Estimator, and Nonlinear Quantile Regression. Diagnostics, 14(13), 1397. https://doi.org/10.3390/diagnostics14131397