Abstract
Background: This study aimed to evaluate the burden and impact of cardiac and cerebrovascular disease (CCD) on hospital inpatients with type 1 diabetes mellitus (T1DM). Methods: This is a retrospective nationwide cohort study of people with T1DM with or without CCD in the US National Inpatient Sample between 2016 and 2019. The in-hospital mortality rates, length of stay (LoS), and healthcare costs were determined. Results: A total of 59,860 T1DM patients had a primary diagnosis of CCD and 1,382,934 did not. The median LoS was longer for patients with CCD compared to no CCD (4.6 vs. 3 days). Patients with T1DM and CCD had greater in-hospital mortality compared to those without CCD (4.1% vs. 1.1%, p < 0.001). The estimated total care cost for all patients with T1DM with CCD was approximately USD 326 million. The adjusted odds of mortality compared to patients with non-CCD admission was greatest for intracranial hemorrhage (OR 17.37, 95%CI 12.68–23.79), pulmonary embolism (OR 4.39, 95%CI 2.70–7.13), endocarditis (OR 3.46, 95%CI 1.22–9.84), acute myocardial infarction (OR 2.31, 95%CI 1.92–2.77), and stroke (OR 1.47, 95%CI 1.04–2.09). Conclusions: The burden of CCD in patients with T1DM is substantial and significantly associated with increased hospital mortality and high healthcare expenditures.
1. Introduction
Type 1 diabetes mellitus (T1DM) is a chronic progressive lifelong condition associated with significant morbidity and increased mortality mainly from cardiovascular disease [1,2]. A large Swedish National Diabetes Registry showed that excess mortality was significant among patients with T1DM, and this was mainly due to cardiorenal complications, thus showing an unmet need in improvement in secondary prevention in this vulnerable patient strata [3]. Many adults with T1DM experience a low health-related quality of life, are more likely to be unemployed, and have more sickness days compared to the general population [4]. The morbidity from T1DM is substantial since it starts early in life and thus has a strong propensity for the development of microvascular and macrovascular complications [5,6]. Chronic hyperglycemia sustains and promotes oxidative stress, vascular inflammation, monocyte adhesion, and perturbations in the arterial wall and endothelium that leads to development of overt cardiovascular disease [7]. The T1DM accelerates atherosclerosis chiefly through the promotion of chronic and “low-grade” systemic inflammation and this contributes to the progression of valvular diseases and coronary artery disease [8,9]. These pathologic changes, in turn, can cause myocardial dysfunction and lead to heart failure with this risk being significantly greater in patients with T1DM due to the fact that disease duration is longer than in T2DM, which makes the likelihood of microvascular complications and detrimental effects of hyperglycemia greater [10]. It has been well established that diabetes inflicts adverse structural and metabolic changes of the myocardium with this entity being recognized as diabetic cardiomyopathy [11].
A meta-analysis by Cai et al. showed that the diagnosis of T1DM was strongly associated with an increased risk of several types of cardiovascular diseases including ischemic heart disease, myocardial infarction, heart failure, atrial fibrillation, and stroke [12]. Independent factors for ischemic stroke among patients with T1DM were the duration of diabetes, presence of diabetic nephropathy, higher hemoglobin A1c, higher systolic blood pressure, smoking, and degree of insulin resistance [13]. Interestingly, T1DM carries significantly greater risk of hemorrhagic stroke as well, compared to patients with type 2 diabetes mellitus, therefore highlighting general propensity of T1DM for potential cerebrovascular complications [14]. In line with this, the life expectancy in someone with T1DM is about 11 years shorter in men and 13 years in women, most of it being driven by a cardiovascular disease [15].
Taken together, there is a great clinical and public health interest in preventing and managing cardiovascular and cerebrovascular disease in patients with T1DM.
The burden and impact of cardiac and cerebrovascular disease (CCD) on patients who are admitted to a hospital with T1DM are largely unknown. The underlying pathology in these conditions may be related to diseases of the peripheral vasculature, coronary arteries, and myocardium; structural cardiac changes; or cardiac electrical activity, which contributes to inpatient hospital admission. How frequently these conditions account for hospitalizations among patients with T1DM and how they affect outcomes on a large nationwide scale are not known and have not been examined yet. Hence, the need to consider population-level data is required to capture the frequency of relevant clinical events, especially those that are less common.
In this comprehensive analysis, we examined a representative, large, nationwide database consisting of hospital records from the United States to evaluate the CCD burden among patients with T1DM and their respective outcomes. In-hospital mortality, length of stay, and cost were explored in detail across a range of CCD conditions.
2. Materials and Methods
This manuscript was prepared in accordance with the recommendations of the STROBE checklist [16]. Ethical approval was not required as we analyzed a non-identifiable public large-scale dataset. We analyzed nationally representative data in the United States from the National Inpatient Sample (NIS). The NIS is a database created by the Healthcare Cost and Utilization Project, which is the largest publicly available all-payer inpatient healthcare database in the United States, which can be utilized to provide national estimates of inpatient utilization, access, costs, quality, and outcomes [17].
A retrospective nationwide cohort study was undertaken of all hospital records in the United States with a discharge diagnosis of T1DM between 2016 and 2019. These years were chosen because the hospital admission information was in ICD-9 codes prior to 2016 and excluded years beyond 2019 to avoid a possible confounding effect of the COVID-19 pandemic. We excluded patients with age < 18 years and missing values for death and sex. From this group of patients, the first ICD-10 diagnostic code was used to define CCD as described in detail in Appendix A Table A1. CCD included angina pectoris, acute myocardial infarction, pulmonary embolism, acute pericarditis, aortic valve disorder, mitral valve disorder, right-sided heart valve disorder, endocarditis, myocarditis, cardiomyopathy, heart failure, atrial fibrillation or flutter, 2° or 3° atrioventricular block, intracranial hemorrhage, subarachnoid hemorrhage, and cerebral infarction. The discharge diagnosis codes, which were up to 40, were used to define coexisting illnesses, and demographic, hospital information and outcome data (in-hospital mortality, length of stay, and costs) were available in the NIS dataset.
Statistical Methods
A statistical analysis was performed on Stata 13 (College Station, TX, USA). A p-value < 0.05 was considered as statistically significant. The hospital admissions were stratified by those who had CCD and those without CCD. Descriptive statistics were presented with the median and interquartile range (IQR) for continuous variables, and as a percent for categorical variables. The non-parametric equality-of-medians test on Stata was used to determine if there were any statistical differences for continuous variables and the Chi2 test was used for categorical variables. The frequency of the different individual diagnoses that composed CCD was determined together with the rate of mortality associated with each diagnosis. Both the median and mean length of stay for the individual diagnoses were presented. The total cost in USD was derived from the total charge multiplied by the charge-to-cost ratio and the average cost was used together with the frequency of the condition to estimate the total cost per year for the hospitalizations associated with CCD.
3. Results
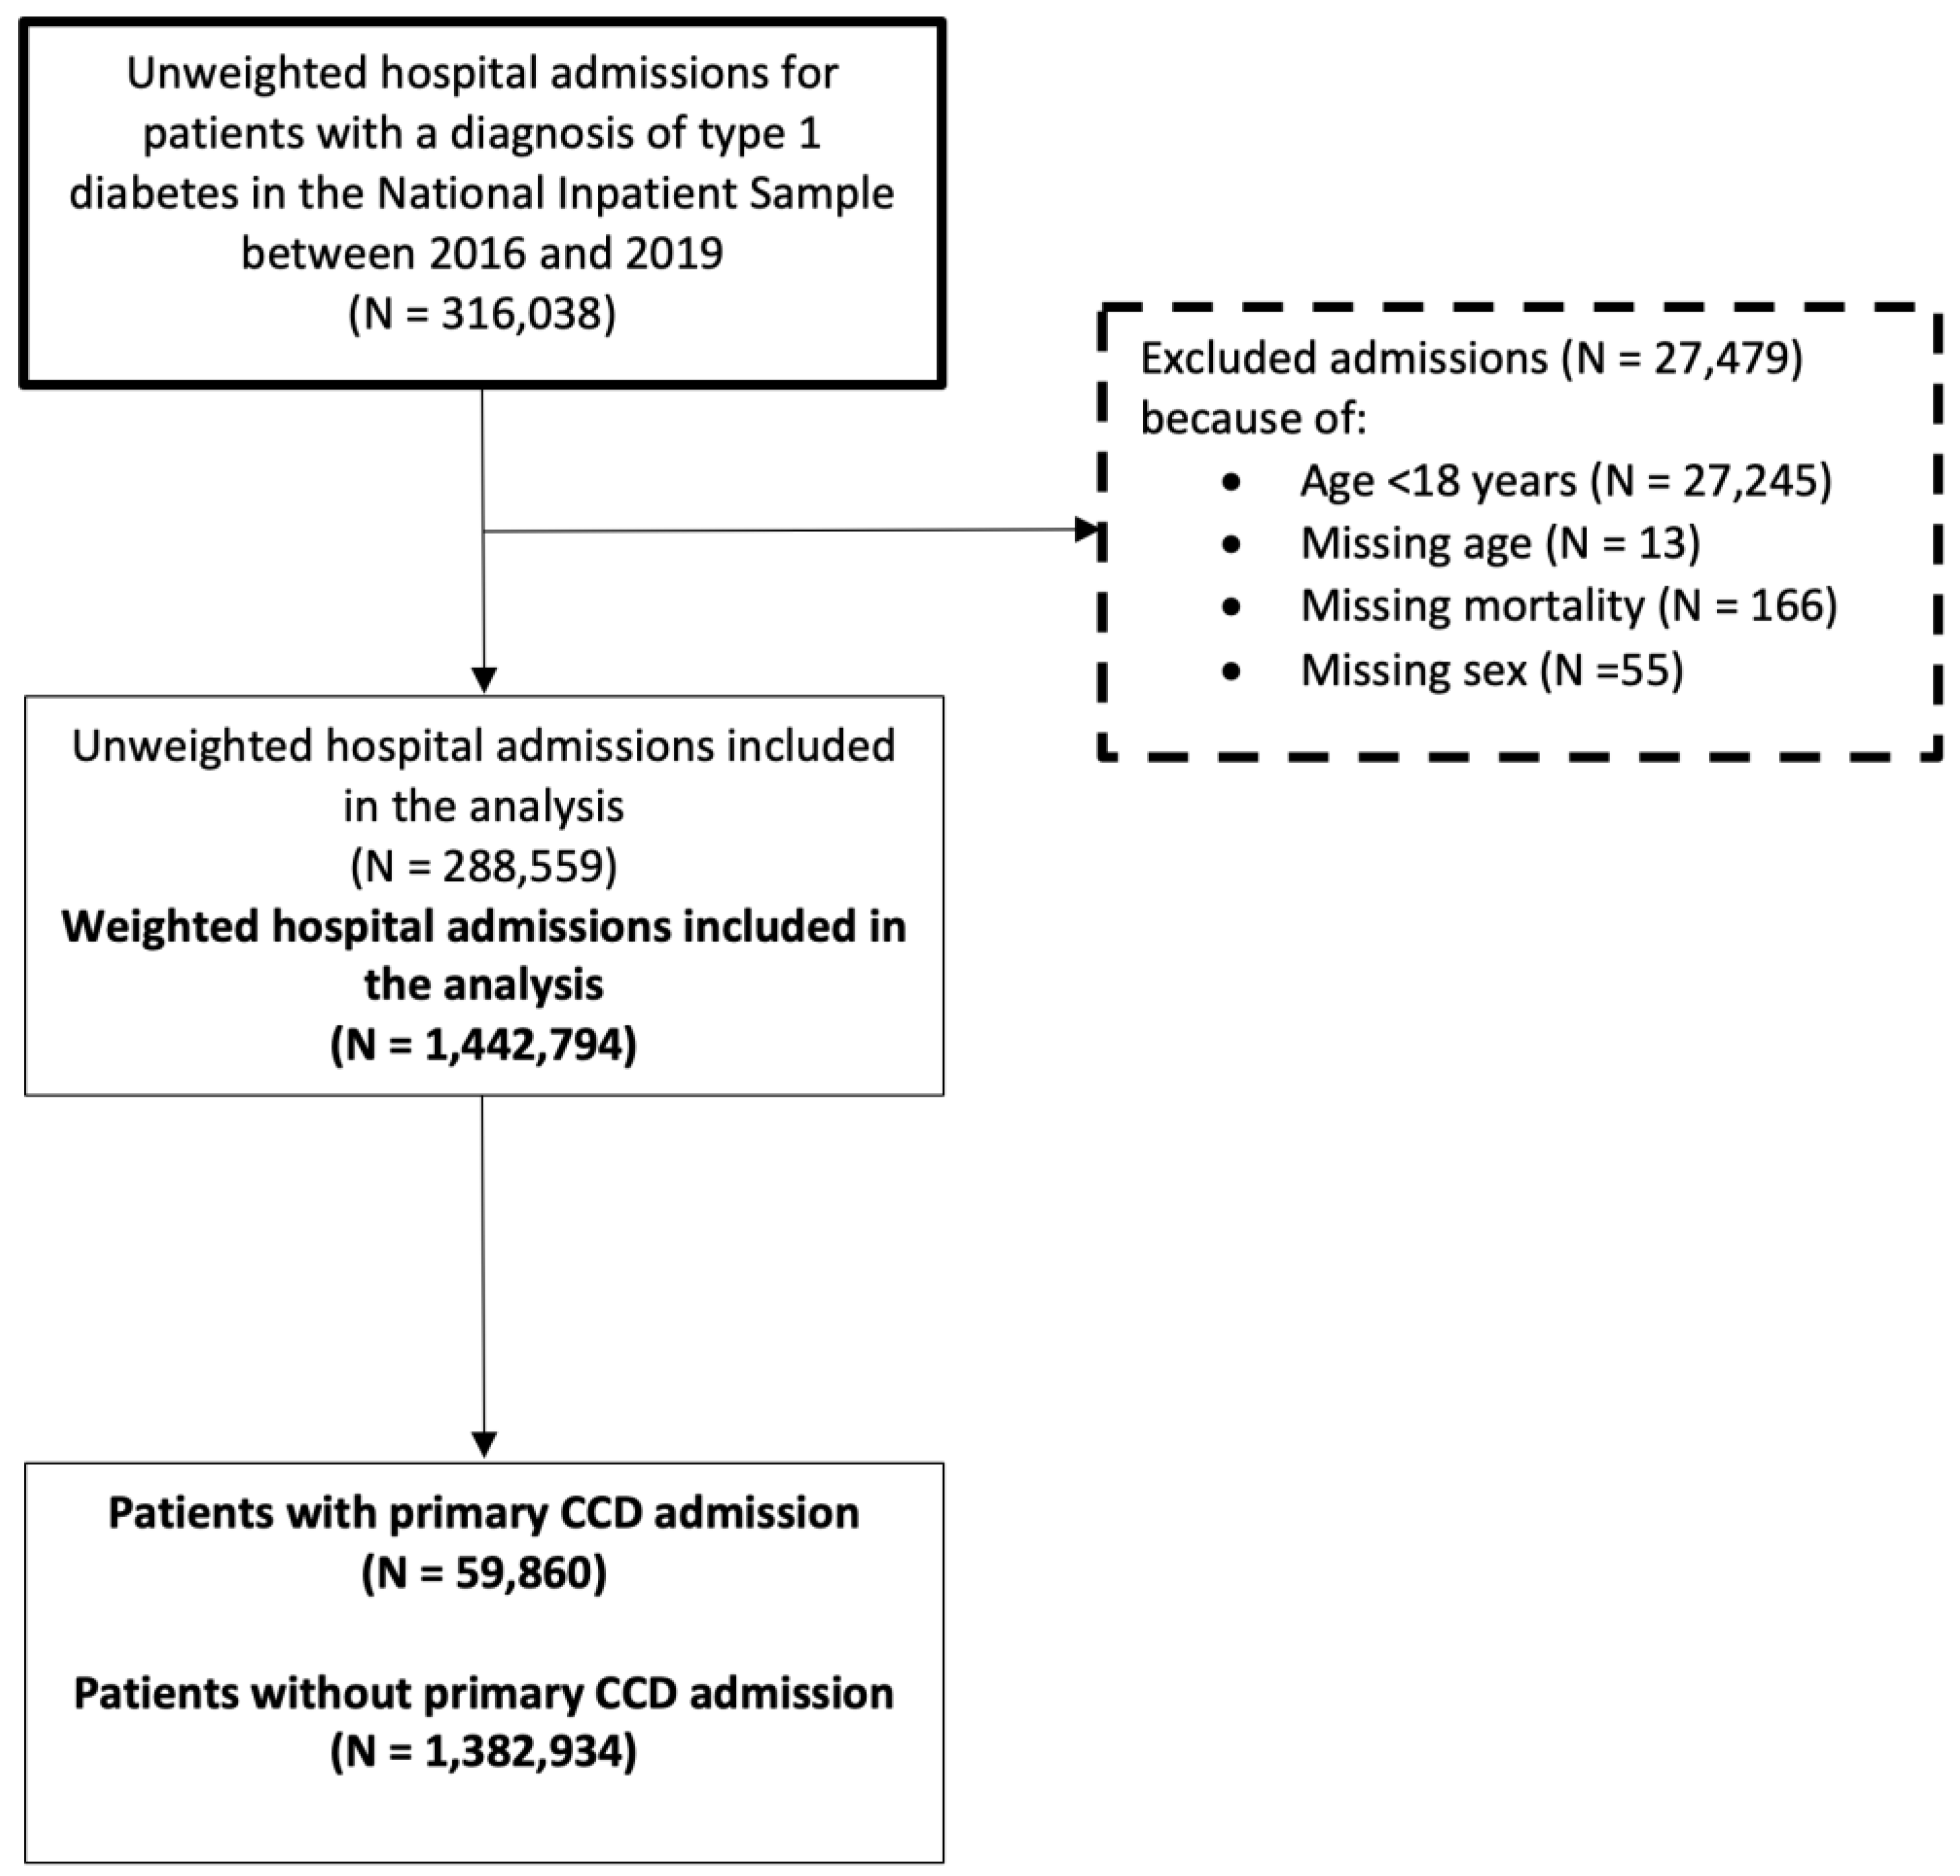
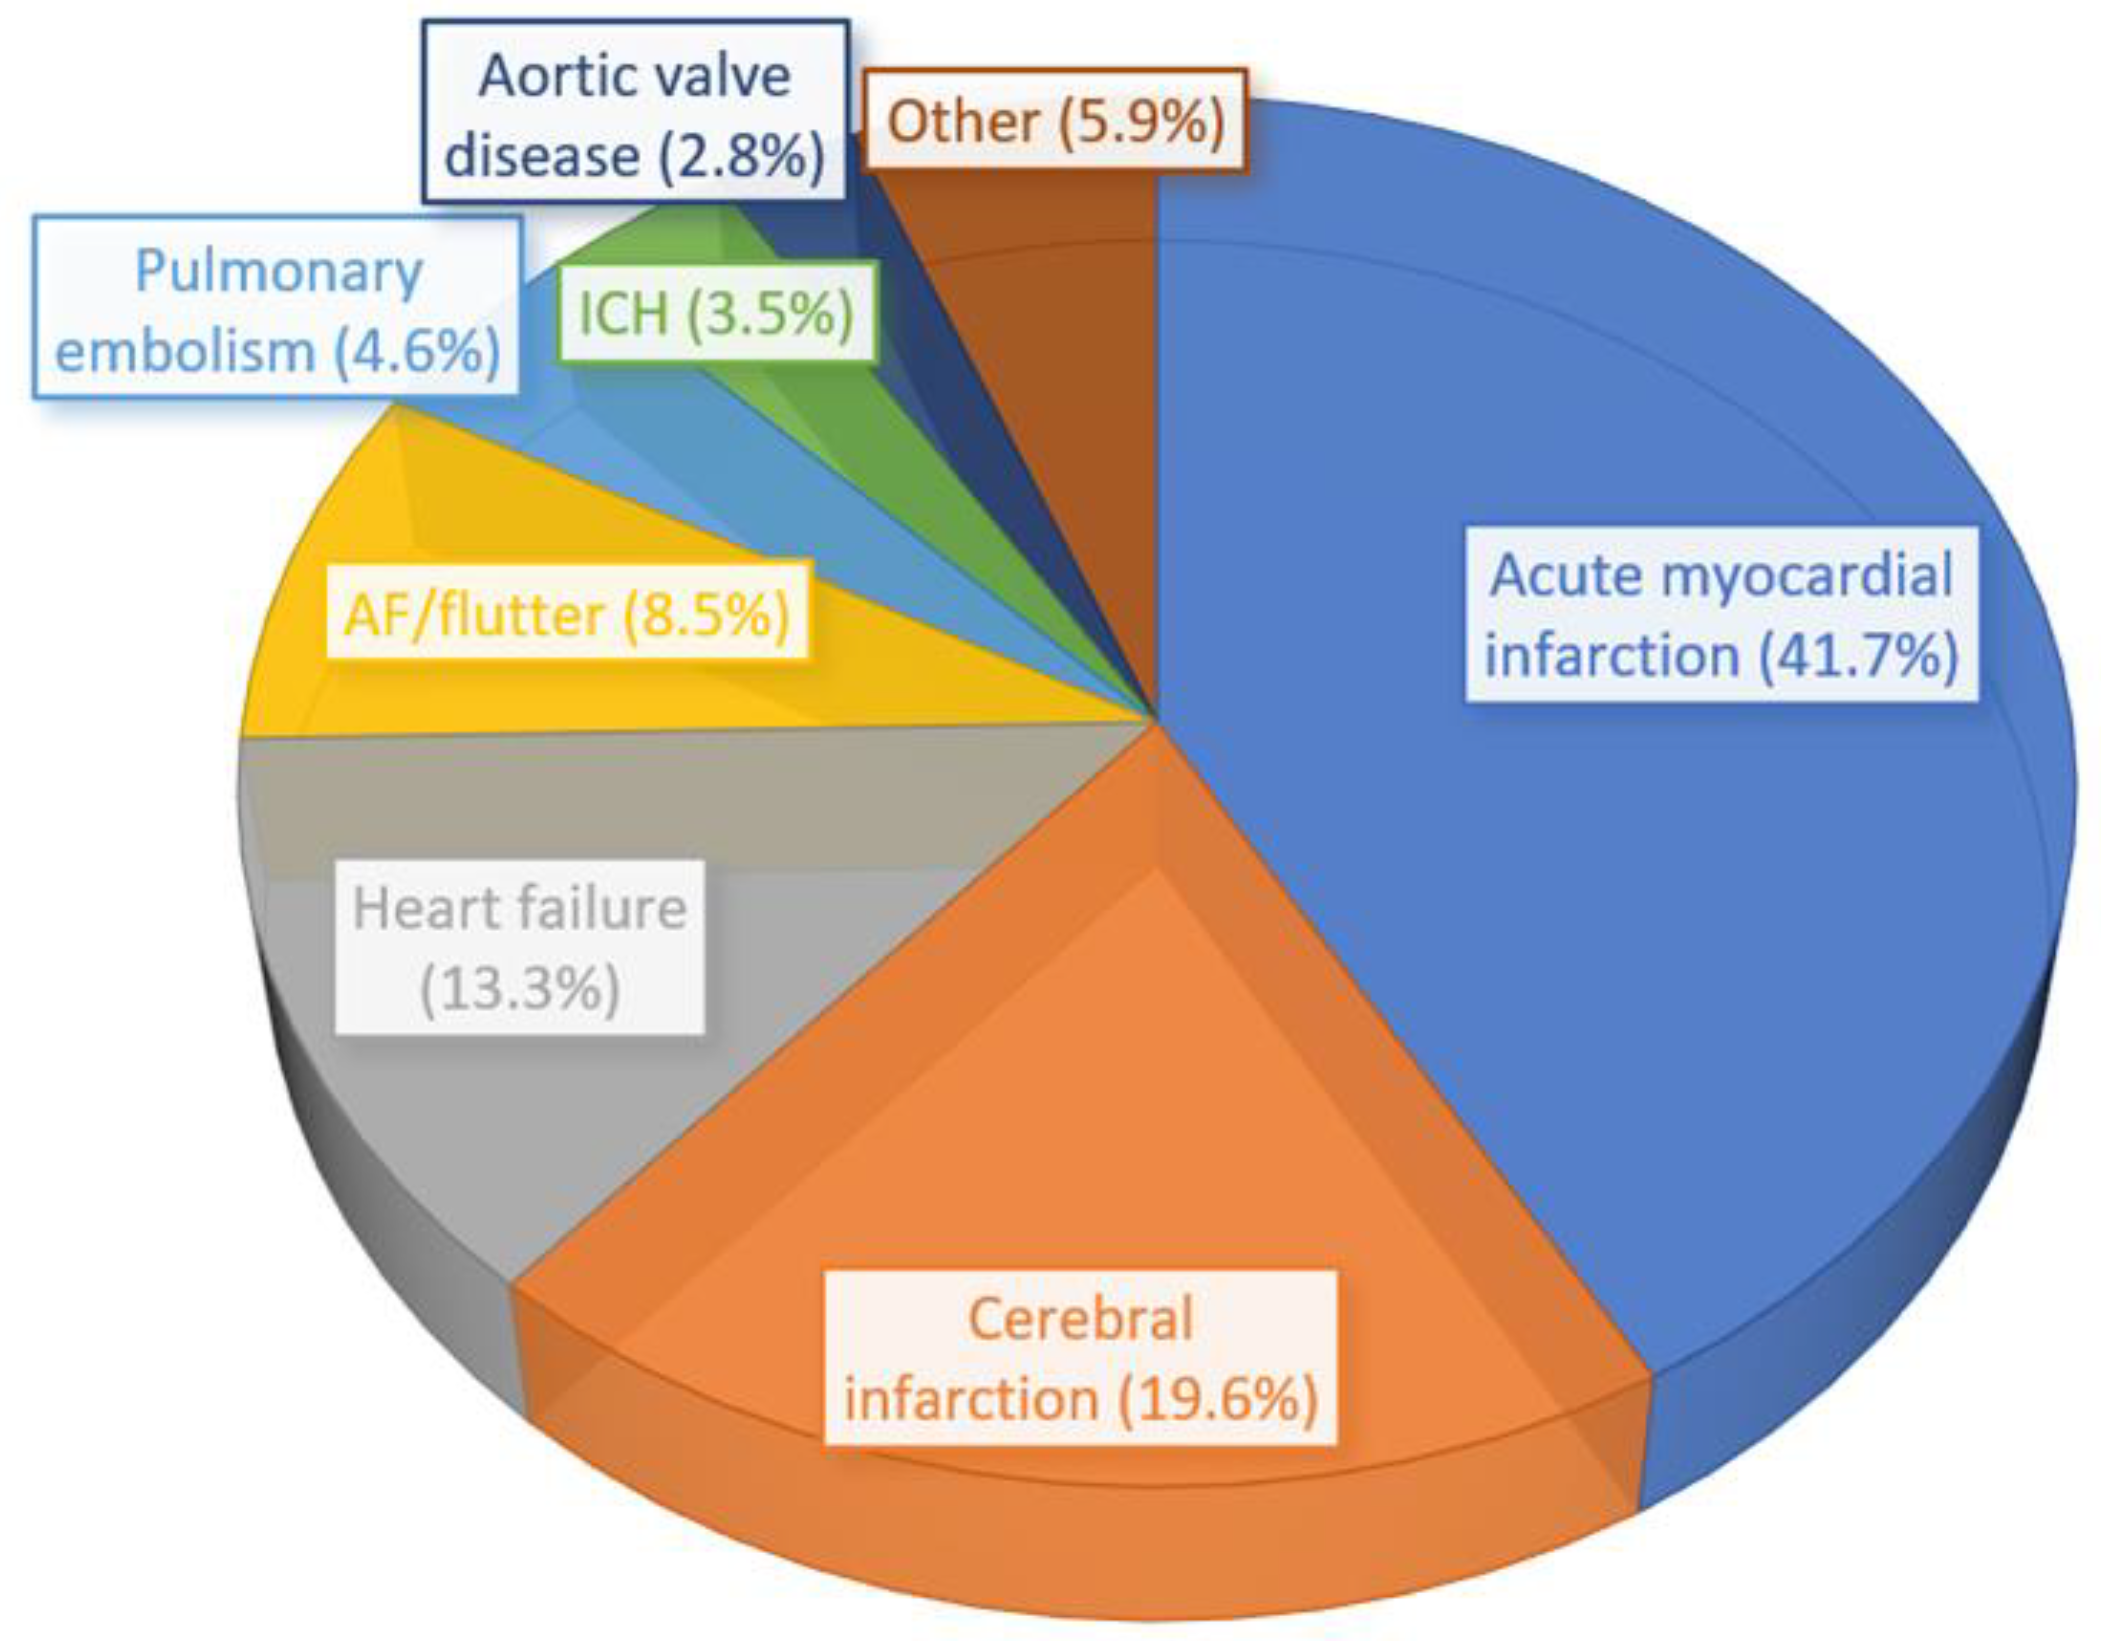
There were a total of 1,442,794 weighted hospital admissions with T1DM included in the analysis (Figure A1, Appendix A). A total of 59,860 patients had a primary diagnosis of CCD and 1,382,934 did not have a primary diagnosis of CCD. The proportion of the different cardiovascular diagnoses that make up the CCD is shown in Figure 1. Acute myocardial infarction represented 41.7% of CCD followed by cerebral infarction (19.6%), heart failure (13.3%), and atrial fibrillation/atrial flutter (8.5%).
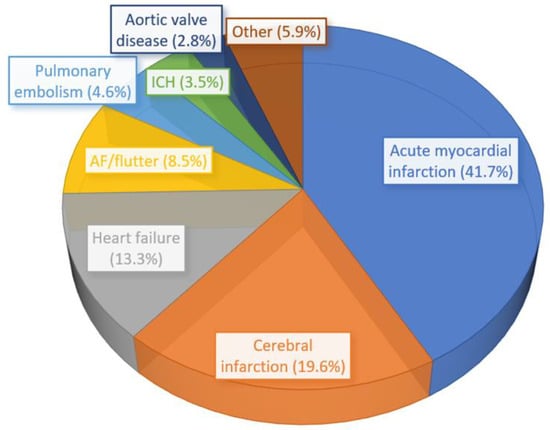
Figure 1.
The distribution of the most common cardiovascular and cerebrovascular diseases in the cohort of 59,860 patients with T1DM.
The demographics and comorbidities of included patients according to the presence or absence of a primary diagnosis of cardiovascular disease are shown in Table 1. The median age of patients with CCD was older compared to those without CCD (median of 60 vs. 39 years, p < 0.001). There were more female patients in the group without CCD compared to those with CCD (52.4% vs. 47.5%, p < 0.001). In terms of race, patients who were white had a greater proportion of patients with CCD compared to those without CCD (74.9% vs. 64.9%). The proportion of patients receiving Medicare was greater among patients who had CCD (55.4% vs. 32.7%) and the proportion of patients self-paying was greater for those without CCD (7.2% vs. 2.7%). The proportions of patients with obesity (18.2% vs. 10.1%, p < 0.001), hypertension (83.3% vs. 54.3%, p < 0.001), hyperlipidemia (64.5% vs. 31.7%, p < 0.001), previous myocardial infarction (16.4% vs. 5.8%, p < 0.001), previous stroke (16.2% vs. 6.7%, p < 0.001), previous heart failure (28.6% vs. 7.8%), and chronic lung disease (19.1% vs. 14.7%, p < 0001) were greater in the group of patients with T1DM and primary CCD compared to the group without CCD.

Table 1.
Demographics of patients with T1DM who were admitted to hospital stratified according to the primary diagnosis of cardiac and cerebrovascular disease (CCD).
The mean and median length of hospital stay were significantly longer for patients with CCD (5.7 and 4 days vs. 4.6 and 3 days, respectively) compared to no CCD and the healthcare costs were significantly higher (mean of USD 21,802 and median of USD 13,762 vs. mean of USD 11,924 and median of USD 7113, respectively).
The in-hospital mortality rate was 4.1% for T1DM patients with CCD vs. 1.1% for T1DM patients without CCD (p < 0.001).
The length of hospital stay and cost of admissions for different primary diagnoses of CCD in patients with T1DM are shown in Table 2.
Table 2.
Length of hospital stay and cost according to primary diagnosis of cardiac and cerebrovascular disease in patients with T1DM.
The median length of stay was longest for patients with right-sided heart valve disease, endocarditis, subarachnoid hemorrhage, mitral valve disease, and intracranial hemorrhage. The median cost was greatest for patients with right-sided heart valve disease followed by patients with mitral valve disease and those with aortic valve disease and subarachnoid hemorrhage. The estimated cost of hospitalizations for all admissions with a primary diagnosis of CCD was approximately USD 326 million each year with the admissions for acute myocardial infarction costing USD 163 million per year.
The rates of in-hospital mortality according to the different primary diagnoses of CCD are depicted in Figure 2. The mortality rate was greatest for patients admitted with intracranial hemorrhage (22.8%), subarachnoid hemorrhage (13.7%), cardiomyopathy (7.3%), endocarditis (5.2%), and pulmonary embolism (4.9%).
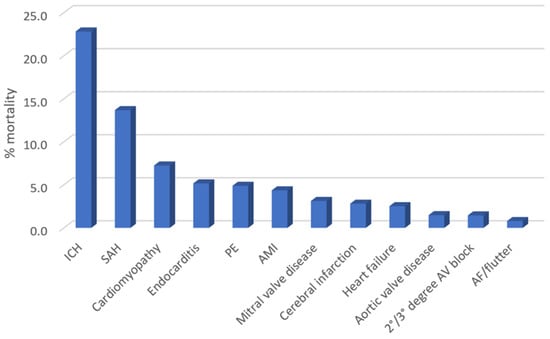
Figure 2.
The in-hospital mortality of patients with T1DM stratified according to different primary and specific diagnoses of cardiovascular and cerebrovascular disease.
After adjustments for demographics and comorbidities, the multivariable-adjusted odds of in-hospital mortality compared to patients with non-CCD admission were greatest for intracranial hemorrhage (OR 17.37, 95%CI 12.68–23.79, p < 0.001), pulmonary embolism (OR 4.39, 95%CI 2.70–7.13, p < 0.001), endocarditis (OR 3.46, 95%CI 1.22–9.84, p = 0.020), acute myocardial infarction (OR 2.31, 95%CI 1.92–2.77, p < 0.001), and cerebral infarction (OR 1.47, 95%CI 1.04–2.09, p = 0.030) (Table 3). Finally, most common single primary diagnostic codes for patients that died were sepsis, T1DM with ketoacidosis without coma, non-ST elevation myocardial infarction, acute respiratory failure with hypoxia, and cardiac arrest with unspecified cause.
Table 3.
Multivariable-adjusted odds of in-hospital mortality among patients with T1DM and primary CCD diagnosis compared in relation to patients with T1DM and no CCD diagnosis (used as a reference group).
Finally, we provide an ancillary analysis of the impact of various common comorbidities on outcomes among patients that were hospitalized with T1DM. Table A2 (Appendix A) shows the impact of comorbidities (obesity, hypertension, hyperlipidemia, history of MI, stroke, HF, CKD, chronic lung disease, cancer, and dementia) on mortality, mean length of stay, and mean cost. The most common primary diagnoses for patients with T1DM admitted to a hospital due to non-CCD diagnoses were diabetic ketoacidosis without coma, sepsis, diabetic autonomic neuropathy, hyperglycemia, acute kidney injury, and hypoglycemia (Table A3, Appendix A).
4. Discussion
T1DM influences morbidity, length of stay, and mortality in patients with CCD. In a large, nationwide analysis of US data, we show that the CCD-related hospitalizations among patients with T1DM impose a great burden for hospital systems.
It has been well established that cardiovascular disease is the leading cause of death in patients with T1DM and while advancements have been made in management of microvascular complications, similar progress in reducing macrovascular complications remains a challenge [18]. In a study of 239 patients with T1DM who developed cardiovascular disease, microvascular disease including diabetic retinopathy, kidney disease, and cardiovascular autonomic neuropathy was associated with subsequent risk of major adverse cardiovascular events after adjusting for age and HbA1c [19]. Previously, the DCCT study showed that good glycemic control can reduce microvascular complications, but the effect on macrovascular complications is not clear [20]. Furthermore, data from the same study showed that variability in HbA1c is predictive of the development and progression of retinopathy and nephropathy in T1DM [21]. The microvascular complications of diabetes appear to cluster as one study of electronic medical records from a hospital in Denmark suggests that neuropathy and diabetic kidney disease often coexist as does retinopathy with both kidney disease and neuropathy [22]. Nevertheless, better management of cardiovascular risk factors and comorbidities in patients with T1DM, which includes adequate blood pressure control, lipid management, and lifestyle interventions, has reduced the burden of cardiovascular disease, but it is not clear what happens to patients with T1DM and underlying CCD when they are admitted to the hospital and what their outcomes are.
In our study, we analyzed the effect of CCD in patients with T1DM admitted to a nationwide array of US hospitals, along with analyzing individual CCD conditions that drive morbidity and mortality.
Many studies consider cardiovascular disease as an outcome, which refers primarily to ischemic heart disease and stroke with or without peripheral vascular disease. However, the vascular nature of the term cardiovascular disease precludes important cardiological conditions such as heart valve disease, arrhythmias, infective endocarditis, and inflammatory conditions of the heart muscle or pericardium and our study tried to account for these deficiencies in the literature.
There is strong evidence that T1DM will increase atherosclerotic risk factors, which can then independently increase cardiovascular risk, but whether either the diabetes itself or the associated risk factors change the risk for CCD is not known [23]. This is important as patients may develop a CCD condition because of the diabetes and risk factors or they may develop the condition independently, but their outcomes are affected by either the diabetes or risk factors. As Verges previously stated—cardiovascular risk remains high among well-controlled T1DM patients without traditional cardiovascular risk factors, thus suggesting other potential factors that drive poor outcomes [7]. Therefore, in the present analysis, it was important to perform multivariable adjustment for comorbid conditions and other factors, which may impact outcomes in a population of patients with T1DM.
The frequency of comorbid conditions and absolute mortality burden of CCD in type 1 diabetes should be considered. We show that mortality rates in patients with intracranial hemorrhage, subarachnoid hemorrhage, cardiomyopathy, and infective endocarditis are high. Several studies have evaluated these conditions in patients with T1DM. A case–control study of 120 patients with intracranial hemorrhage and 135 control patients with low back pain found that diabetes mellitus was more prevalent in the group with intracranial hemorrhage (33.1% vs. 22.2%), but it was not clear if there were any patients with T1DM [24]. A prospective cohort study of 4,083 patients with T1DM reported that during a median follow-up of 9.4 years, 15 patients developed subarachnoid hemorrhage and 4 had died [25]. For cardiomyopathy, a Swedish cohort study of 20,985 patients with T1DM found that there was a 4-fold increase in risk of development of heart failure for patients with HbA1c ≥10.5% compared to patients with HbA1c <6.5% [26]. Furthermore, a recent meta-analysis showed that patients with T1DM had 3-fold greater risk of developing heart failure, compared to controls without T1DM, and this was even more pronounced among women (had nearly 5-fold risk in that study) [27]. Regarding infective endocarditis, in a study of 559 patients with definite infective endocarditis, 13% of patients had T1DM and insulin-dependent diabetes was associated with a 4.7-fold increase in odds of in-hospital mortality [28].
According to results that we report, these conditions were not frequent population-wide and the estimated population deaths over the study years were 485 for intracranial hemorrhage and fewer than 100 deaths for the other three conditions. These low event rates even on a population level reflect the importance of national evaluations and a large nationwide analysis that can capture these nuances. While the mortality rate is lower, the estimated absolute number of deaths is greater for acute myocardial infarction (n = 1090). Overall, there were 17,420 deaths in the cohort and 14.1% (n = 2460) were due to CCD. The major non-CCD causes of mortality were sepsis, which caused over 4000 deaths, and ketoacidosis without coma, acute respiratory failure with hypoxia, and cardiac arrest, which were more than 500 deaths for each condition.
In our study, we show that patients with T1DM and CCD are different in terms of age and comorbidities compared to their counterparts without CCD. The comorbidities may be relevant because they may require management, which contributes to prolonged hospital stay and cost. In addition, an important consideration is whether these factors impact clinical decision making as the elderly and presences of coexisting illness can affect risk of undertaking procedures. The broad nature of the conditions captured in CCD is important; there may be interventional and surgical options for management in some of the conditions such as infective endocarditis, valvular heart disease, and coronary artery disease. While attempts were made with adjustments in our analysis, the likely reality is that we are not able to account for the entire effect of these factors.
Finally, all patients should also be under the care of a diabetes specialist team and there should be locally established care pathways with shared care where appropriate. These pathways may help reduce any missed opportunities to prevent the progression of diabetes and complications and enable addressing early detection problems when they develop.
Limitations
This analysis has several limitations. First, we used the primary ICD-10 codes as the method of determining the primary reason for admission. It is possible that there may be more than one key condition that resulted in the condition. Second, the NIS does not contain patient-level identifiers so patients who survive admission may be readmitted and considered within a given year and across different years. Third, we do not have information about the management of patients, which influences mortality, length of stay, and cost.
5. Conclusions
Approximately 4% of admissions for patients with a primary diagnosis of T1DM are for CCD. These admissions to a hospital are important because they are associated with a four-fold increase in mortality, longer mean length of stay, and double the mean cost of admission compared to admissions without a primary diagnosis of CCD. In particular, the cost of admissions with heart valve disease is high, which is greater than USD 40,000. The mortality rate is more than 5% for patients admitted with intracranial hemorrhage, subarachnoid hemorrhage, and cardiomyopathy. These findings suggest that the CCD in patients with T1DM is associated with mortality and is a burden to hospital services so measures should be taken to manage cardiovascular risk factors to prevent onset of CCD in patients with T1DM.
Author Contributions
Conceptualization, C.S.K. and G.Y.H.L.; Data curation, A.I.Q.; Formal analysis, C.S.K., A.I.Q., A.P., G.Y.H.L., W.H. and J.A.B.; Funding acquisition, J.A.B.; Investigation, C.S.K., A.I.Q., A.P., G.Y.H.L., W.H. and J.A.B.; Methodology, C.S.K. and A.P.; Project administration, J.A.B.; Resources, J.A.B.; Supervision, J.A.B.; Validation, W.H.; Writing—original draft, C.S.K.; Writing—review and editing, C.S.K., A.I.Q., A.P., G.Y.H.L., W.H. and J.A.B. All authors have read and agreed to the published version of the manuscript.
Funding
This research received no external funding.
Institutional Review Board Statement
The National Inpatient Sample (NIS) is a dataset where use and publication for research purposes do not require an institutional review board approval or statement.
Informed Consent Statement
Not applicable.
Data Availability Statement
The data used in this analysis may be purchased from the Healthcare Cost and Utilization Project (HCUP) website. The authors do not have permission to share the data used for the analysis.
Conflicts of Interest
The authors declare no conflicts of interest.
Appendix A
Table A1.
ICD-10 codes for data analysis and their source.
Table A1.
ICD-10 codes for data analysis and their source.
| Variable | Source | ICD-10 Code |
|---|---|---|
| Type 1 diabetes | I10_DX1/40 | E10* |
| Angina pectoris | I10_DX1 | I20* |
| Acute myocardial infarction | I10_DX1 | I21* |
| Pulmonary embolism | I10_DX1 | I26* |
| Acute pericarditis | I10_DX1 | I30* |
| Aortic valve disorder | I10_DX1 | I35* |
| Mitral valve disorder | I10_DX1 | I34* |
| Right-sided heart valve disorder | I10_DX1 | I36*, I37* |
| Endocarditis | I10_DX1 | I33*, I38*, I39* |
| Myocarditis | I10_DX1 | I40*, I41* |
| Cardiomyopathy | I10_DX1 | I42*, I43* |
| Heart failure | I10_DX1 | I50* |
| Atrial fibrillation/atrial flutter | I10_DX1 | I48* |
| 2°/3° AV block | I10_DX1 | I44.1, I44.2 |
| Intracranial hemorrhage | I10_DX1 | I61*, I62* |
| Subarachnoid hemorrhage | I10_DX1 | I60* |
| Cerebral infarction | I10_DX1 | I63* |
| Smoking (tobacco use) | I10_DX1/40 | Z72.0 |
| Alcohol misuse | I10_DX1/40 | F10.1 |
| Obesity | I10_DX1/40 | E66.0, E66.1, E66.2, E66.8, E66.9 |
| Hypertension | I10_DX1/40 | I10*, I11*, I12*, I13*, I15*, I16* |
| Hyperlipidemia | I10_DX1/40 | E78.0*, E78.1, E78.2, E78.3, E78.4*, E78.5 |
| Previous myocardial infarction | I10_DX1/40 | I25.2 |
| Previous stroke | I10_DX1/40 | Z86.73, I69* |
| Previous heart failure | I10_DX1/40 | I50.22, I50.23, I50.32, I50.33, I50.42, I50.43, I50.812, I50.813 |
| Chronic kidney disease | I10_DX1/40 | N18* |
| Chronic lung disease | I10_DX1/40 | J40*–J47* |
| Any cancer | I10_DX1/40 | C00*–C96* |
| Dementia | I10_DX1/40 | F01*, F02*, F03* |
| Age | NIS Core | - |
| Sex | NIS Core | - |
| Month of admission | NIS Core | - |
| Weekend admission | NIS Core | - |
| Discharge weight | NIS Core | - |
| Discharge disposition | NIS Core | - |
| Elective admission | NIS Core | - |
| Length of stay | NIS Core | - |
| Primary expected payer | NIS Core | - |
| Race | NIS Core | - |
| Year | NIS Core | - |
| ZIP income quartile | NIS Core | - |
| Death | NIS Core | - |
| Total charge | NIS Core | - |
| Hospital bed size | NIS Hospital | - |
* denotes all the sub-codes from the root code.
Table A2.
Impact of comorbidities on outcomes in patients hospitalized with T1DM.
Table A2.
Impact of comorbidities on outcomes in patients hospitalized with T1DM.
| Comorbidity | Mortality with Comorbidity vs. without | p-Value | Mean Length of Stay with Comorbidity vs. without (days) | p-Value | Mean Cost with Comorbidity vs. without (USD) | p-Value |
|---|---|---|---|---|---|---|
| Obesity | 1.2% vs. 1.2% | 1.00 | 5.4 ± 6.6 vs. 4.6 ± 6.3 | <0.001 | 14,970 ± 30,017 vs. 12,024 ± 19,076 | <0.001 |
| Hypertension | 1.6% vs. 0.7% | <0.001 | 5.3 ± 6.7 vs. 3.9 ± 5.7 | <0.001 | 14,435 ± 20,165 vs. 9712 ± 17,355 | <0.001 |
| Hyperlipidemia | 1.4% vs. 1.1% | <0.001 | 5.1 ± 6.0 vs. 4.5 ± 6.5 | <0.001 | 14,308 ± 19,205 vs. 11,358 ± 18,988 | <0.001 |
| History of myocardial infarction | 2.0% vs. 1.2% | <0.001 | 5.2 ± 5.6 vs. 4.6 ± 6.4 | <0.001 | 14,814 ± 17,841 vs. 12,169 ± 19,180 | <0.001 |
| History of stroke | 2.0% vs. 1.2% | <0.001 | 5.7 ± 7.1 vs. 4.6 ± 6.3 | <0.001 | 14,377 ± 17,330 vs. 12,176 ± 19,232 | <0.001 |
| History of heart failure | 3.4% vs. 1.0% | <0.001 | 6.8 ± 7.9 vs. 4.5 ± 6.1 | <0.001 | 18,773 ± 25,933 vs. 11,726 ± 18,221 | <0.001 |
| Chronic kidney disease | 2.2% vs. 0.8% | <0.001 | 6.0 ± 7.5 vs. 4.1 ± 5.8 | <0.001 | 16,539 ± 23,959 vs. 10,621 ± 16,436 | <0.001 |
| Chronic lung disease | 1.5% vs. 1.2% | <0.001 | 5.1 ± 6.5 vs. 4.6 ± 6.3 | <0.001 | 13,329 ± 18,195 vs. 12,159 ± 19,621 | <0.001 |
| Cancer | 4.4% vs. 1.1% | <0.001 | 6.9 ± 8.5 vs. 4.6 ± 6.3 | <0.001 | 20,823 ± 29,978 vs. 12,051 ± 18,575 | <0.001 |
| Dementia | 3.6% vs. 1.2% | <0.001 | 6.9 ± 10.4 vs. 4.6 ± 6.2 | <0.001 | 14,709 ± 20,252 vs. 12,274 ± 19,078 | <0.001 |
Table A3.
The most common primary diagnosis among patients with T1DM and non-CCD-related hospital admissions.
Table A3.
The most common primary diagnosis among patients with T1DM and non-CCD-related hospital admissions.
| Primary Diagnosis Code for Non-CCD Admission | Number of Admissions |
|---|---|
| Diabetic ketoacidosis without coma | 453,550 |
| Sepsis | 78,135 |
| Diabetic autonomic polyneuropathy | 43,080 |
| Hyperglycemia | 39,435 |
| Acute kidney injury | 25,620 |
| Hypoglycemia | 22,930 |
| Other complication of type 1 diabetes | 16,200 |
| Foot ulcer | 13,190 |
| Pre-existing type 1 diabetes in childbirth | 12,225 |
| Pneumonia | 12,170 |
| Diabetic peripheral angiopathy and gangrene | 8380 |
| Urinary tract infection | 7615 |
| Acute pancreatitis without necrosis or infection | 6975 |
| Mechanical complication of insulin pump | 6880 |
| Hyperkalemia | 6310 |
| Diabetic ketoacidosis with coma | 6245 |
| Diabetic chronic kidney disease | 5970 |
| Sepsis due to E. coli | 5845 |
| Major depressive disorder, recurrent severe without psychotic features | 5790 |
| Acute respiratory failure with hypoxia | 5720 |
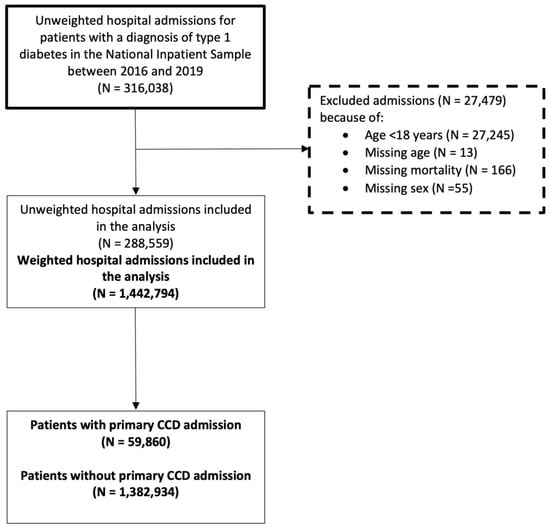
Figure A1.
Patient inclusion flowchart.
Figure A1.
Patient inclusion flowchart.
References
- Atkinson, M.A.; Eisenbarth, G.S.; Michels, A.W. Type 1 diabetes. Lancet 2014, 383, 69–82. [Google Scholar] [CrossRef] [PubMed]
- Rawshani, A.; Rawshani, A.; Franzén, S.; Eliasson, B.; Svensson, A.M.; Miftaraj, M.; McGuire, D.K.; Sattar, N.; Rosengren, A.; Gudbjörnsdottir, S. Mortality and Cardiovascular Disease in Type 1 and Type 2 Diabetes. N. Engl. J. Med. 2017, 376, 1407–1418. [Google Scholar] [CrossRef] [PubMed]
- Hallström, S.; Wijkman, M.O.; Ludvigsson, J.; Ekman, P.; Pfeffer, M.A.; Wedel, H.; Rosengren, A.; Lind, M. Risk factors, mortality trends and cardiovascular diseases in people with Type 1 diabetes and controls: A Swedish observational cohort study. Lancet Reg. Health Eur. 2022, 21, 100469. [Google Scholar] [CrossRef] [PubMed]
- Nielsen, H.B.; Ovesen, L.L.; Mortensen, L.H.; Lau, C.J.; Joensen, L.E. Type 1 diabetes, quality of life, occupational status and education level—A comparative population-based study. Diabetes Res. Clin. Pract. 2016, 121, 62–68. [Google Scholar] [CrossRef] [PubMed]
- Daneman, D. Type 1 diabetes. Lancet 2006, 367, 847–858. [Google Scholar] [CrossRef] [PubMed]
- Chalakova, T.; Yotov, Y.; Tzotchev, K.; Galcheva, S.; Balev, B.; Bocheva, Y.; Usheva, N.; Iotova, V. Type 1 Diabetes Mellitus—Risk Factor for Cardiovascular Disease Morbidity and Mortality. Curr. Diabetes Rev. 2021, 17, 37–54. [Google Scholar] [CrossRef] [PubMed]
- Vergès, B. Cardiovascular disease in type 1 diabetes, an underestimated danger: Epidemiological and pathophysiological data. Atherosclerosis 2024, 394, 117158. [Google Scholar] [CrossRef] [PubMed]
- Ye, J.; Li, L.; Wang, M.; Ma, Q.; Tian, Y.; Zhang, Q.; Liu, J.; Li, B.; Zhang, B.; Liu, H.; et al. Diabetes Mellitus Promotes the Development of Atherosclerosis: The Role of NLRP3. Front. Immunol. 2022, 13, 900254. [Google Scholar] [CrossRef]
- Poznyak, A.; Grechko, A.V.; Poggio, P.; Myasoedova, V.A.; Alfieri, V.; Orekhov, A.N. The Diabetes Mellitus-Atherosclerosis Connection: The Role of Lipid and Glucose Metabolism and Chronic Inflammation. Int. J. Mol. Sci. 2020, 21, 1835. [Google Scholar] [CrossRef]
- Gómez-Perez, A.M.; Damas-Fuentes, M.; Cornejo-Pareja, I.; Tinahones, F.J. Heart Failure in Type 1 Diabetes: A Complication of Concern? A Narrative Review. J. Clin. Med. 2021, 210, 4497. [Google Scholar] [CrossRef]
- Huo, J.L.; Feng, Q.; Pan, S.; Fu, W.J.; Liu, Z.; Liu, Z. Diabetic cardiomyopathy: Early diagnostic biomarkers, pathogenetic mechanisms, and therapeutic interventions. Cell Death Discov. 2023, 9, 256. [Google Scholar] [CrossRef]
- Cai, X.; Li, J.; Cai, W.; Chen, C.; Ma, J.; Xie, Z.; Dong, Y.; Liu, C.; Xue, R.; Zhao, J. Meta-analysis of type 1 diabetes mellitus and risk of cardiovascular disease. J. Diabetes Complicat. 2021, 35, 107833. [Google Scholar] [CrossRef]
- Hägg, S.; Thorn, L.M.; Forsblom, C.M.; Gordin, D.; Saraheimo, M.; Tolonen, N.; Wadén, J.; Liebkind, R.; Putaala, J.; Tatlisumak, T.; et al. Different risk factor profiles for ischemic and hemorrhagic stroke in type 1 diabetes mellitus. Stroke 2014, 45, 2558–2562. [Google Scholar] [CrossRef] [PubMed]
- Janghorbani, M.; Hu, F.B.; Willett, W.C.; Li, T.Y.; Manson, J.E.; Logroscino, G.; Rexrode, K.M. Prospective study of type 1 and type 2 diabetes and risk of stroke subtypes: The Nurses’ Health Study. Diabetes Care 2007, 30, 1730–1735. [Google Scholar] [CrossRef] [PubMed]
- Livingstone, S.J.; Levin, D.; Looker, H.C.; Lindsay, R.S.; Wild, S.H.; Joss, N.; Leese, G.; Leslie, P.; McCrimmon, R.J.; Metcalfe, W.; et al. Estimated life expectancy in a Scottish cohort with type 1 diabetes, 2008–2010. J. Am. Med. Assoc. 2015, 313, 37–44. [Google Scholar] [CrossRef]
- von Elm, E.; Altman, D.G.; Egger, M.; Pocock, S.J.; Gøtzsche, P.C.; Vandenbroucke, J.P.; STROBE Initiative. Strengthening the Reporting of Observational Studies in Epidemiology (STROBE) statement: Guidelines for reporting observational studies. Br. Med. J. 2007, 335, 806–808. [Google Scholar] [CrossRef]
- Healthcare Cost & Utilization Project. Overview of the National (Nationwide) Inpatient Sample (NIS). Available online: https://www.hcup-us.ahrq.gov/nisoverview.jsp (accessed on 2 July 2022).
- Bjornstad, P.; Donaghue, K.C.; Maahs, D.M. Macrovascular disease and risk factors in youth with type 1 diabetes: Time to be more attentive to treatment? Lancet Diabetes Endocrinol. 2018, 6, 809–820. [Google Scholar] [CrossRef]
- Gubitosi-Klug, R.; Gao, X.; Pop-Busui, R.; de Boer, I.H.; White, N.; Aiello, L.P.; Miller, R.; Palmer, J.; Tamborlane, W.; Wallia, A.; et al. Associations of Microvascular Complications With the Risk of Cardiovascular Disease in Type 1 Diabetes. Diabetes Care 2021, 44, 1499–1505. [Google Scholar] [CrossRef]
- Nathan, D.M. The diabetes control and complication trial/epidemiology of diabetes interventions and complication study at 30 years: Overview. Diabetes Care 2014, 37, 9–16. [Google Scholar] [CrossRef]
- Kilpatrick, E.S.; Rigby, A.S.; Atkin, S.L. A1C variability and the risk of microvascular complications in type 1 diabetes: Data from the Diabetes Control and Complications Trial. Diabetes Care 2008, 31, 2198–2202. [Google Scholar] [CrossRef] [PubMed]
- Bjerg, L.; Hulman, A.; Charles, M.; Jørgensen, M.E.; Witte, D.R. Clustering of microvascular complications in Type 1 diabetes mellitus. J. Diabetes Complicat. 2018, 32, 393–399. [Google Scholar] [CrossRef] [PubMed]
- Colom, C.; Rull, A.; Sanchez-Quesada, J.L.; Pérez, A. Cardiovascular Disease in Type 1 Diabetes Mellitus: Epidemiology and Management of Cardiovascular Risk. J. Clin. Med. 2021, 10, 1798. [Google Scholar] [CrossRef] [PubMed]
- Hesemi, O.; Kasmaei, H.D.; Matani, F.; Assarzadegan, F.; Mansouri, B.; Jabbehdari, S. Relationship between intracerebral hemorrhage and diabetes mellitus: A case-control study. J. Clin. Diagn. Res. 2015, 9, 8–10. [Google Scholar] [CrossRef]
- Korja, M.; Thorn, L.M.; Hägg, S.; Putaala, J.; Liebkind, R.; Harjutsalo, V.; Forsblom, C.M.; Gordin, D.; Tatlisumak, T.; Groop, P.H. Subarachnoid hemorrhage in type 1 diabetes. Diabetes Care 2013, 36, 3754–3758. [Google Scholar] [CrossRef] [PubMed]
- Lind, M.; Bounias, I.; Olsson, M.; Gudbjörnsdottir, S.; Svensson, A.M.; Rosengren, A. Glycaemic control and incidence of heart failure in 20,985 patients with type 1 diabetes: An observational study. Lancet 2011, 378, 140–146. [Google Scholar] [CrossRef]
- Haji, M.; Erqou, S.; Fonarow, G.C.; Echouffo-Tcheugui, J.B. Type 1 diabetes and risk of heart failure: A systematic review and meta-analysis. Diabetes Res. Clin. Pract. 2023, 202, 110805. [Google Scholar] [CrossRef]
- Duval, X.; Alla, F.; Doco-Lecompte, T.; Le Moing, V.; Delahaye, F.; Mainardi, J.L.; Plesiat, P.; Celard, M.; Hoen, B.; Leport, C. Diabetes mellitus and infective endocarditis: The insulin factor in patient morbidity and mortality. Eur. Heart J. 2007, 28, 59–64. [Google Scholar] [CrossRef]

Disclaimer/Publisher’s Note: The statements, opinions and data contained in all publications are solely those of the individual author(s) and contributor(s) and not of MDPI and/or the editor(s). MDPI and/or the editor(s) disclaim responsibility for any injury to people or property resulting from any ideas, methods, instructions or products referred to in the content. |
© 2024 by the authors. Licensee MDPI, Basel, Switzerland. This article is an open access article distributed under the terms and conditions of the Creative Commons Attribution (CC BY) license (https://creativecommons.org/licenses/by/4.0/).