Abstract
Background: Objective quantitative texture characteristics may be helpful in salivary glandular tumor differential diagnosis. This study uses machine learning (ML) to explore and validate the performance of ultrasound (US) texture features in diagnosing salivary glandular tumors. Material and methods: 122 patients with salivary glandular tumors, including 71 benign and 51 malignant tumors, are enrolled. Representative brightness mode US pictures are selected for further Gray Level Co-occurrence Matrix (GLCM) texture analysis. We use a t-test to test the significance and use the receiver operating characteristic curve method to find the optimal cut-point for these significant features. After splitting 80% of the data into a training set and 20% data into a testing set, we use five machine learning models, k-nearest Neighbors (kNN), Naïve Bayes, Logistic regression, Artificial Neural Networks (ANNs) and supportive vector machine (SVM), to explore and validate the performance of US GLCM texture features in diagnosing salivary glandular tumors. Results: This study includes 49 female and 73 male patients, with a mean age of 53 years old, ranging from 21 to 93. We find that six GLCM texture features (contrast, inverse difference movement, entropy, dissimilarity, inverse difference and difference entropy) are significantly different between benign and malignant tumors (p < 0.05). In ML, the overall accuracy rates are 74.3% (95%CI: 59.8–88.8%), 94.3% (86.6–100%), 72% (54–89%), 84% (69.5–97.3%) and 73.5% (58.7–88.4%) for kNN, Naïve Bayes, Logistic regression, a one-node ANN and SVM, respectively. Conclusions: US texture analysis with ML has potential as an objective and valuable tool to make a differential diagnosis between benign and malignant salivary gland tumors.
1. Introduction
For salivary gland tumors, it is difficult to have a definite diagnosis before surgical intervention [1]. Computer tomography, Magnetic Resonance Imaging and ultrasound (US) are commonly used to detect salivary gland tumors. Due to its lack of radiation exposure, point-of-care use and real-time feature, US could be used as the first-line tool to check salivary gland tumors [2,3,4]. In addition, US can be used for real-time guiding fine needle biopsy, although the diagnostic rate is reported at only around sixty percent [5]. Even with US guiding, core needle biopsy still has false negative and false positive diagnosis [6]. Therefore, the definite diagnosis is usually still dependent on surgical pathology.
High-resolution US is widely used in the preoperative evaluation for salivary tumors [7]. Previous studies have reported several subjective US features that are related to malignancy, such as calcification, loss of posterior enhancement, poor defined margin and accompanied cervical lymphadenopathy [8]. However, evaluation with US is still limited as a subjective and operator-dependent diagnostic technique.
Quantitative texture analysis of US pictures provides a more subjective assessment and is hopeful in reducing operator variations [9]. US texture analysis has been extensively applied for differentiating preterm from term fetal lungs [10], thyroid nodules [11] and chronic radiation-induced sialoadenitis [12].
Machine learning (ML) is an application of artificial intelligence, which can learn from data and may improve predictive outcomes by using data [13]. Image classification is an important application for ML, including for US pictures.
Objective quantitative texture characteristics may be helpful in salivary glandular tumor differential diagnosis. A previous study reported that texture features, including entropy and contrast, were able to differentiate benign from malignant salivary tumors [14]. However, no previous study has used ML to assess the diagnostic performance of US texture features in diagnosing salivary glandular tumors. Thus, this study aims to use ML to explore and validate the feasibility of US texture features in diagnosing salivary glandular tumors.
2. Materials and Methods
The inclusion criteria included patients more than 20 years old who had head and neck ultrasound examination due to salivary glandular tumors in Far Eastern Memorial Hospital. The sonograms were performed with one high-resolution 7 to 18 MHz real-time linear array transducer (Aplio MX, Toshiba, Tokyo, Japan). We recruited patients who had undergone surgery and had clear pathology. Patients without sonograms or clear pathological diagnosis were excluded. A general overview for this study is illustrated in Figure 1.
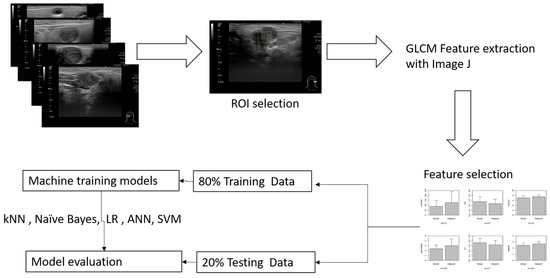
Figure 1.
Overview of the workflow for this study, a maximal rectangle area within the salivary glandular tumor is delineated for the ROI (region of interest).
Representative brightness mode US pictures are selected for each patient (Figure 2). A total of 122 pictures are obtained for further analysis. Maximal rectangle areas within the salivary glandular tumor are delineated for Gray Level Co-occurrence Matrix (GLCM) texture analysis. We calculated eighteen texture features including angular second moment (asm), contrast, correlation, inverse difference moment (IDM), entropy, dissimilarity, inverse difference (INV), variance, cluster shade (CS), cluster prominence (CP), maximal prominence (maxpro), sum average (sumavg), sum entropy (sumenth), sum variance (sumvar), difference variance (diffvar) and difference entropy (Diffenth) and sum the average for 0, 45, 90 and 135 degrees for further comparisons [9,11,12]. We use a t-test to check the significance among different texture features, and select the significant predictors for further diagnostic performance assessment with ML models. After splitting 80% of the data into a training set and 20% into a testing set with the R sample function [15], we use five machine learning models, k-nearest Neighbors (kNN), Naïve Bayes, Logistic regression, Artificial Neural Networks (ANNs) and supportive vector machine (SVM), to explore and validate the performance of US GLCM texture features in diagnosing salivary glandular tumors [16]. In kNN and Naïve Bayes models, the values are normalized by subtracting the minimum value and dividing by the range. In logistic regression, we further use the ROC method to find the optimal cut-point for these significant features and split the data into categories with the cut-points. In ANN and SVM, the raw data are used in the modeling.
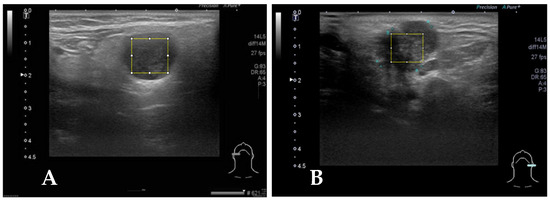
Figure 2.
(A) Case 2, the square block is sampled from a right parotid tumor for GLCM texture analysis by Image J. The pathologic report reveals pleomorphic adenoma. (B) The square block is sampled for GLCM texture analysis from another left parotid tumor, and the pathologic report reveals mucoepidermoid carcinoma.
The GLCM texture analysis is performed using Image J (https://imagej.net/ij/index.html) [17]. All statistical analyses and ML modeling are performed by using STATA 12.0 (Stata Corp, College Station, TX 77845, USA) and R version 4.1.0 [15]. p values less than 0.05 were regarded as significantly different.
3. Results
A total of 122 patients with salivary glandular tumors, including 71 benign and 51 malignant tumors, are enrolled. There are 49 female and 73 male patients, with a mean age of 53 years old, ranging from 21 to 93. The general characteristics of the recruited patients are summarized in Table 1. There are six features that differentiate benignity from malignancy including contrast (90.2 ± 58.0 versus 129.2 ± 115.4, p-value = 0.03), IDM (0.28 ± 0.10 versus 0.23 ± 0.09, p-value = 0.02), entropy (7.01 ± 0.87 versus 7.39 ± 0.86, p-value = 0.04), dissimilarity (4.70 ± 1.53 versus 6.08 ± 2.72, p-value = 0.002), INV (0.36 ± 0.09 versus 0.32 ± 0.09, p-value = 0.01), and Diffenth (2.47 ± 0.31 versus 2.7 ± 0.41, p-value = 0.0006).

Table 1.
Demographic and texture analysis results of recruited patients.
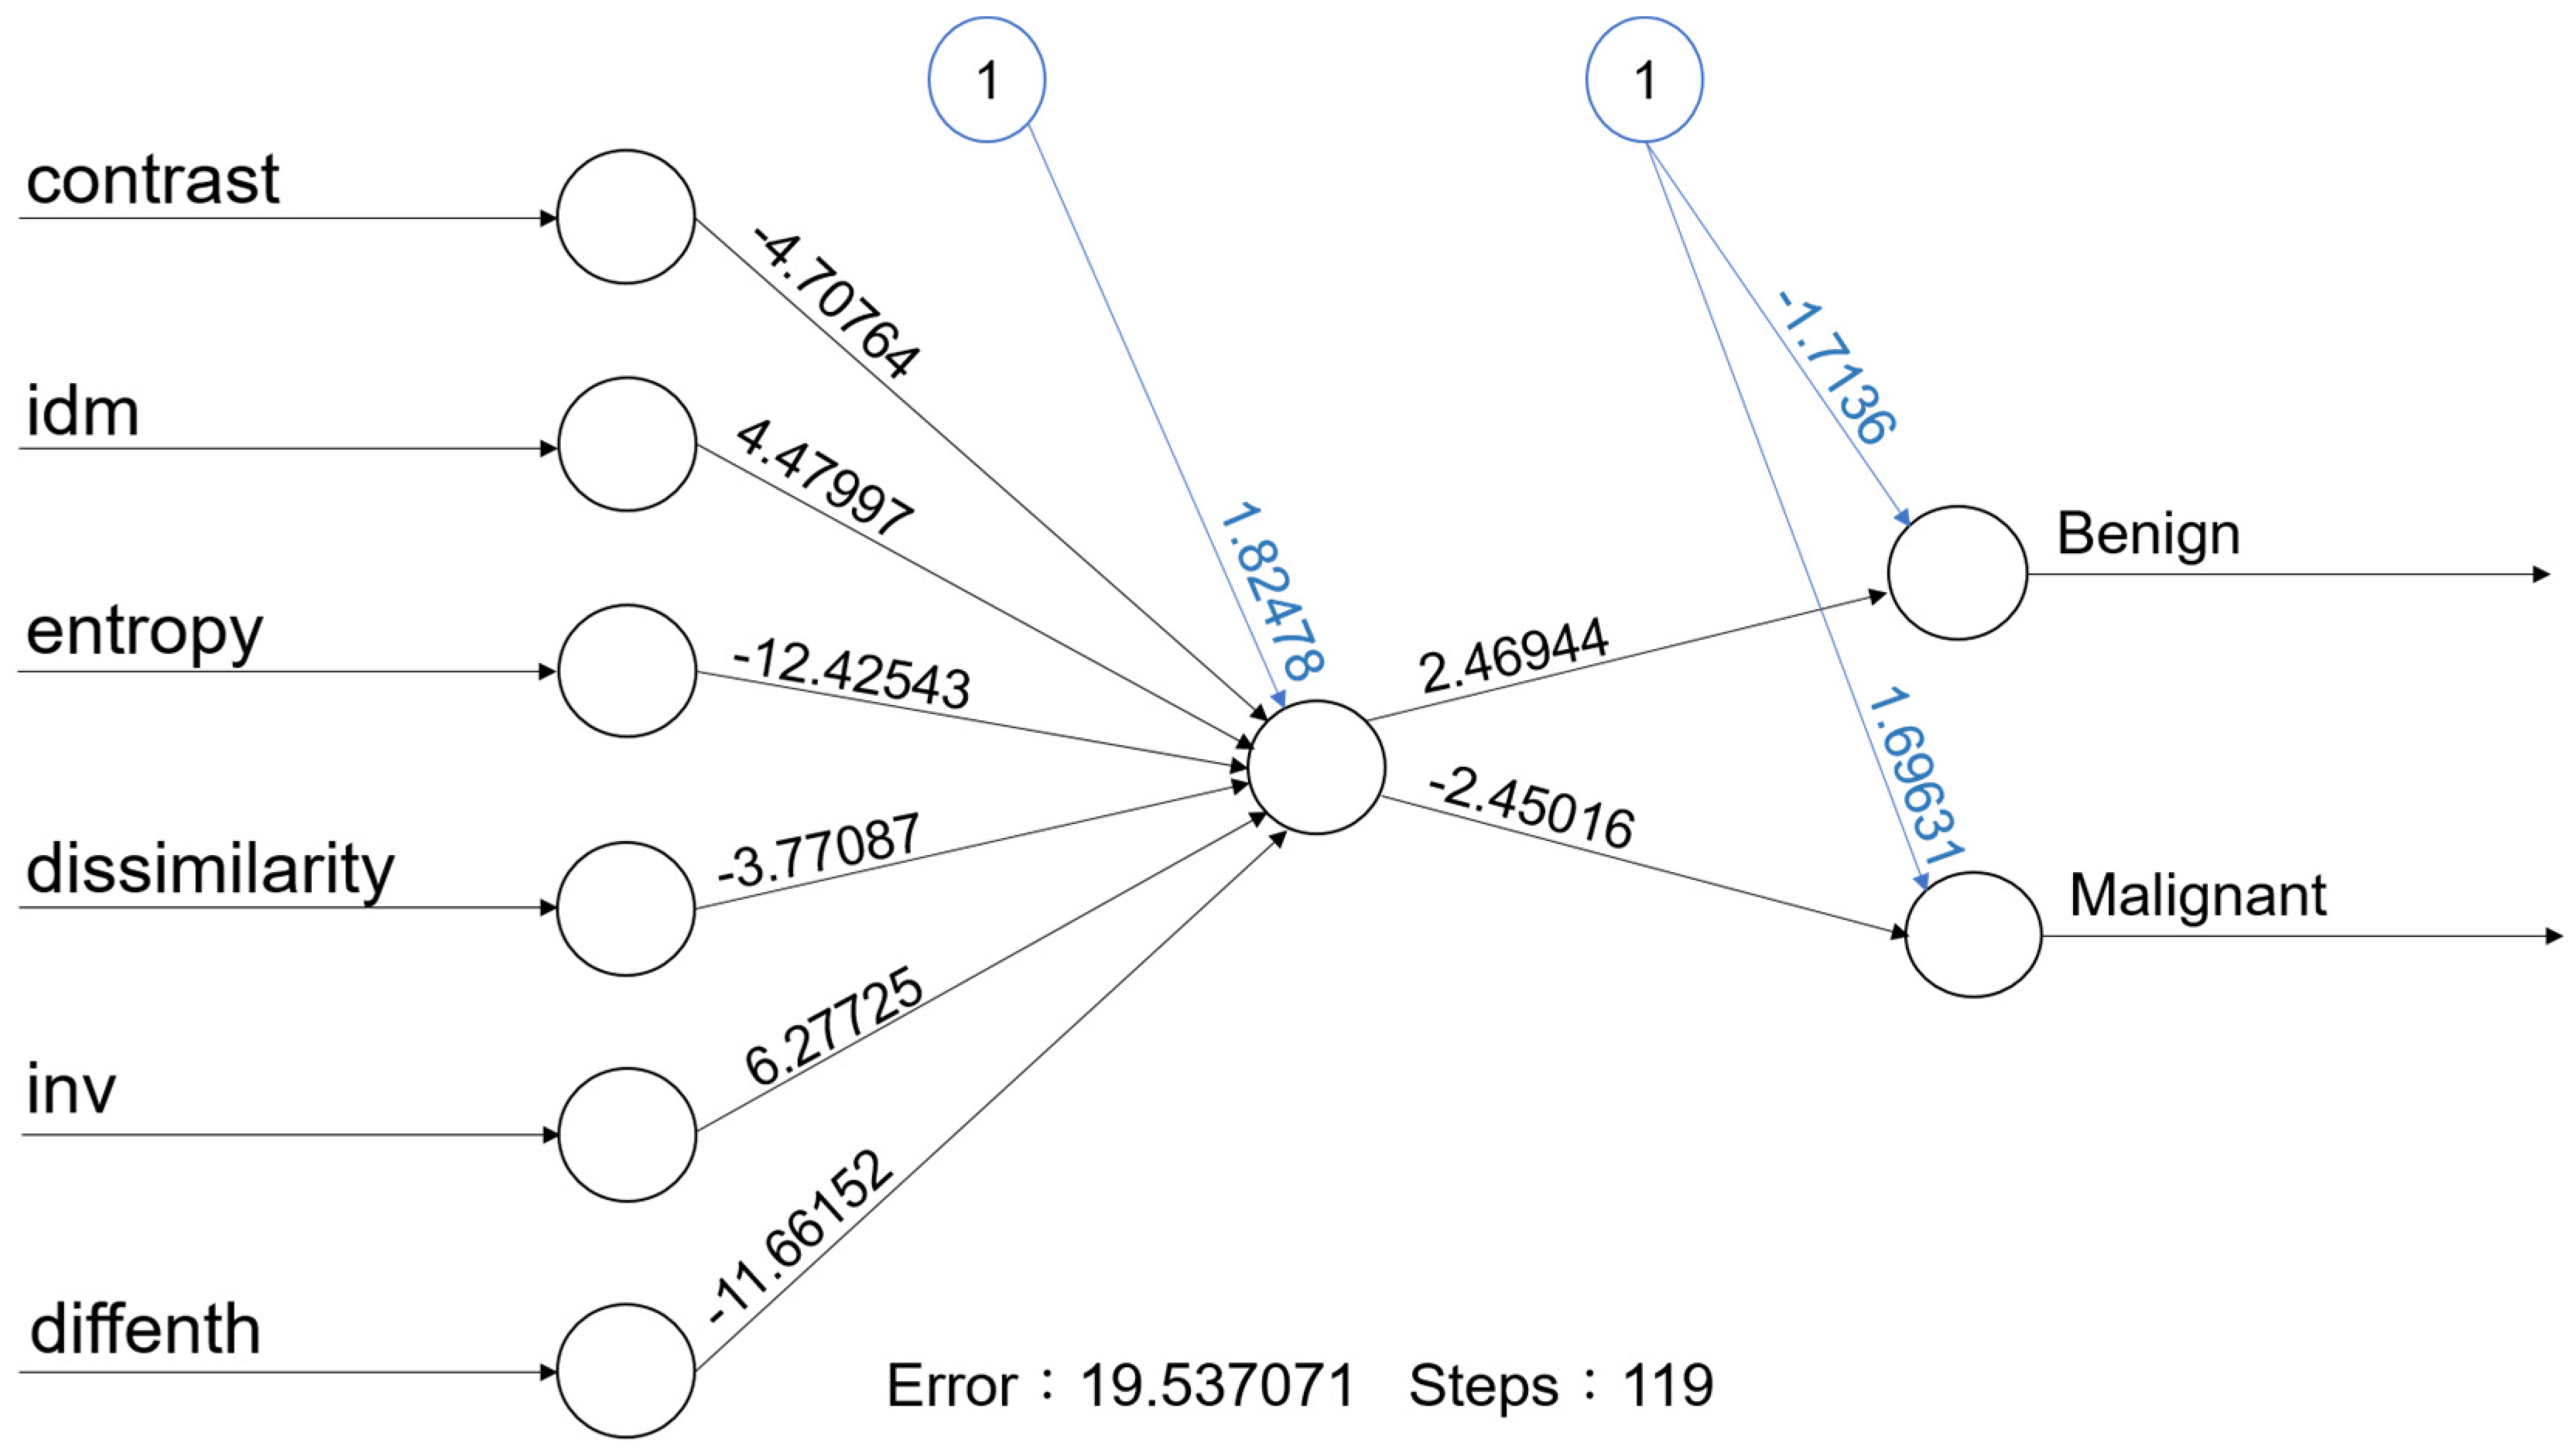
For machine learning, the overall accuracy rates are 74.3% (95%CI: 59.8–88.8%), 94.3% (86.6–100%), 72% (54–89%), 84% (69.5–97.3%) and 73.5% (58.7–88.4%) for kNN, Naïve Bayes, Logistic regression, a one-node ANN (Figure 3) and SVM, respectively. Details of diagnostic performances including sensitivity and specificity are summarized in Table 2.
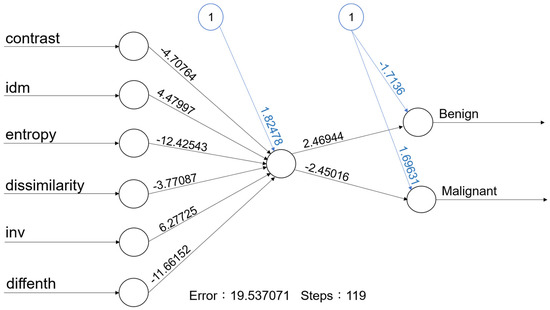
Figure 3.
With one hidden node with 6 predictors, the accuracy rate of this ANN model is 84.0% (95% CI: 69.5–97.3%).
Table 2.
Summary of performance of five machine learning models with six selected texture features.
4. Discussion
This is the first study to use ML to model the texture features for salivary glandular tumors. Our result reveals US texture analysis with ML has potential as an objective and valuable tool for the assessment of salivary gland tumors.
Dissimilarity, entropy and contrast are related to the heterogeneous content of the tumors. A previous study reported that texture features, including entropy and contrast, were able to differentiate benign from malignant salivary tumors [14]. In our study, we also find that entropy and contrast are able to differentiate benign from malignant tumors. Entropy is a quantitative measure of signal uncertainty and has been widely applied to ultrasound tissue characterization. These results mean that the malignant tumors are more heterogeneous and diverse than benign tumors.
We also include four other texture features, including the inverse difference moment, dissimilarity, inverse difference and difference entropy for ML. The inverse difference moment (IDM) is usually called homogeneity, and measures the local homogeneity of an image. The IDM feature obtains the measures of the closeness of the distribution of the GLCM elements to the GLCM diagonal. In our study, the IDM is higher for benign than malignancy (0.28 ± 0.10 versus 0.23 ± 0.09, p-value = 0.02).
After combining these six texture features, the diagnostic performance is 74.3% (95%CI: 59.8–88.8%), 94.3% (86.6–100%), 72% (54–89%), 84% (69.5–97.3%) and 73.5% (58.7–88.4%) for kNN, Naïve Bayes, Logistic regression, a one-node ANN (Figure 3) and SVM, respectively (Table 2). Although the performance is not perfect. Our results still support that the use of texture analysis may provide objective and quantitative information about the image pattern. Adaptation of more objective features may further increase the diagnostic performance. A computer-aided diagnostic (CAD) system for thyroid nodule sonographic evaluation has been successfully developed to assess the thyroid nodules [18,19]; in our opinion, objective US CAD for salivary gland tumors is very promising to established with ML in the future.
Artificial intelligence involves attempting to get a computer system to imitate human behavior. ML is a subset of AI techniques that attempts to apply statistical models and learning from data. ML is a field within computer science, and it differs from traditional computational approaches. In traditional computing, algorithms are sets of explicitly programmed instructions used by computers to calculate or problem solve. ML algorithms instead allow for computers to train on data inputs and use statistical analysis in order to output values that fall within a specific range. Because of this, ML facilitates computers in building models from sample data in order to automate decision-making processes based on data inputs [20].
Two of the most widely adopted ML methods are supervised learning, which trains algorithms based on data that is labeled by humans, and unsupervised learning, which provides the algorithm with no labeled data in order to allow it to find structure within its input data. This study adapts supervised learning including kNN, Naïve Bayes, Logistic regression, ANNs and SVM.
An ANN is used to develop ML systems that are based on a biological model of the brain, specifically the bioelectrical activity of the neurons in the brain. Neural networks are also called as deep learning. An ANN architecture for supervised learning could include a layer of multiple input elements, one or more hidden processing layers, and weighted connections between nodes in adjacent layers [20]. The evaluation of an ANN model (Figure 3) in our study shows that the one-node ANN model is able to correctly classify the tumor with an 84.0% accuracy rate. Due to limited data, we adapted a simple one-node ANN model; more data with multiple nodes and layers may further improve the accuracy rate.
There are some limitations in this study: First, the case number is still limited. Because this is the preliminary feasibility study, more data are needed to consolidate our findings. Second, other texture analysis methods, such as local binary pattern and multiscale features [21,22], could be used to increase the amount of data. Third, there are other forms of US pictures, such as Doppler and elastography models, that could also be adapted in future studies. Fourth, there are more ML algorithms that could be used [23].
5. Conclusions
US texture analysis with machine learning has potential as an objective and valuable tool to make a differential diagnosis between benign and malignant salivary gland tumors. Among the five machine learning models in our study, Naïve Bayes achieved the highest diagnostic accuracy (94.3%) using six GLCM texture features (contrast, inverse difference movement, entropy, dissimilarity, inverse difference and difference entropy).
Author Contributions
Conceptualization, L.-J.L. and F.-T.C.; methodology, L.-J.L.; software, L.-J.L. and P.-C.C.; validation, L.-J.L. and F.-T.C.; formal analysis, L.-J.L. and P.-C.C.; investigation, L.-J.L. and P.-C.C.; resources, L.-J.L. and P.-C.C.; data curation, L.-J.L. and P.-C.C.; writing—original draft preparation, L.-J.L.; writing—review and editing, P.-C.C.; visualization, L.-J.L.; supervision, F.-T.C.; project administration, L.-J.L.; funding acquisition, L.-J.L. All authors have read and agreed to the published version of the manuscript.
Funding
This work was supported by grants from the Far Eastern Memorial Hospital (FEMH-2024-C-023 & FEMH-2024-C-025).
Institutional Review Board Statement
The study was conducted in accordance with the Declaration of Helsinki, and approved by the Institutional Ethics review board of the Far Eastern Memorial Hospital (IRB:112136-E, 22 August 2023).
Informed Consent Statement
Not applicable. Formal informed consent was waived due to the retrospective study design.
Data Availability Statement
Not available due to privacy and ethical reasons.
Conflicts of Interest
The authors declare that no conflicts of interest exist.
References
- Kuan, E.C.; Clair, J.M.S.; John, M.A.S. Evaluation of Parotid Lesions. Otolaryngol. Clin. N. Am. 2016, 49, 313–325. [Google Scholar] [CrossRef] [PubMed]
- Bozzato, A.; Zenk, J.; Greess, H.; Hornung, J.; Gottwald, F.; Rabe, C.; Iro, H. Potential of ultrasound diagnosis for parotid tumors: Analysis of qualitative and quantitative parameters. Otolaryngol. Head Neck Surg. 2007, 137, 642–646. [Google Scholar] [CrossRef] [PubMed]
- Haidar, Y.M.; Moshtaghi, O.; Mahmoodi, A.; Helmy, M.; Goddard, J.A.; Armstrong, W.B. The Utility of In-Office Ultrasound in the Diagnosis of Parotid Lesions. Otolaryngol. Head Neck Surg. 2017, 156, 511–517. [Google Scholar] [CrossRef]
- Liao, L.J.; Wen, M.H.; Yang, T.L. Point-of-care ultrasound in otolaryngology and head and neck surgery: A prospective survey study. J. Formos. Med. Assoc. 2021, 120, 1547–1553. [Google Scholar] [CrossRef]
- Kovacević, D.O.; Fabijanić, I. Sonographic diagnosis of parotid gland lesions: Correlation with the results of sonographically guided fine-needle aspiration biopsy. J. Clin. Ultrasound 2010, 38, 294–298. [Google Scholar] [CrossRef] [PubMed]
- Song, I.H.; Song, J.S.; Sung, C.O.; Roh, J.L.; Choi, S.H.; Nam, S.Y.; Kim, S.Y.; Lee, J.H.; Baek, J.H.; Cho, K.J. Accuracy of Core Needle Biopsy Versus Fine Needle Aspiration Cytology for Diagnosing Salivary Gland Tumors. J. Pathol. Transl. Med. 2015, 49, 136–143. [Google Scholar] [CrossRef] [PubMed]
- Cheng, P.C.; Chang, C.M.; Huang, C.C.; Lo, W.C.; Huang, T.W.; Cheng, P.W.; Liao, L.J. The diagnostic performance of ultrasonography and computerized tomography in differentiating superficial from deep lobe parotid tumours. Clin. Otolaryngol. 2019, 44, 286–292. [Google Scholar] [CrossRef]
- Lo, W.A.-O.; Chang, C.M.; Wang, C.T.; Cheng, P.W.; Liao, L.A.-O. A Novel Sonographic Scoring Model in the Prediction of Major Salivary Gland Tumors. Laryngoscope 2021, 131, E157–E162. [Google Scholar] [CrossRef] [PubMed]
- Haralick, R.M.; Shanmugam, K.; Dinstein, I.H. Textural features for image classification. IEEE Trans. Syst. Man Cybern. 1973, 6, 610–621. [Google Scholar] [CrossRef]
- Ghorayeb, S.R.; Bracero, L.A.; Blitz, M.J.; Rahman, Z.; Lesser, M.L. Quantitative Ultrasound Texture Analysis for Differentiating Preterm From Term Fetal Lungs. J. Ultrasound Med. 2017, 36, 1437–1443. [Google Scholar] [CrossRef] [PubMed]
- Bhatia, K.S.; Lam, A.C.; Pang, S.W.; Wang, D.; Ahuja, A.T. Feasibility Study of Texture Analysis Using Ultrasound Shear Wave Elastography to Predict Malignancy in Thyroid Nodules. Ultrasound Med. Biol. 2016, 42, 1671–1680. [Google Scholar] [CrossRef] [PubMed]
- Yang, X.; Tridandapani, S.; Beitler, J.J.; Yu, D.S.; Yoshida, E.J.; Curran, W.J.; Liu, T. Ultrasound GLCM texture analysis of radiation-induced parotid-gland injury in head-and-neck cancer radiotherapy: An in vivo study of late toxicity. Med. Phys. 2012, 39, 5732–5739. [Google Scholar] [CrossRef] [PubMed]
- Brattain, L.J.; Telfer, B.A.; Dhyani, M.; Grajo, J.R.; Samir, A.E. Machine learning for medical ultrasound: Status, methods, and future opportunities. Abdom. Radiol. 2018, 43, 786–799. [Google Scholar] [CrossRef] [PubMed]
- Yonetsu, K.; Ohki, M.; Fau-Kumazawa, S.; Kumazawa, S.; Fau-Eida, S.; Eida, S.; Fau-Sumi, M.; Sumi, M.; Fau-Nakamura, T.; Nakamura, T. Parotid tumors: Differentiation of benign and malignant tumors with quantitative sonographic analyses. Ultrasound Med. Biol. 2004, 30, 567–574. [Google Scholar] [CrossRef]
- R Core Team. R: A Language and Environment for Statistical Computing; R Foundation for Statistical Computing: Vienna, Austria, 2013. [Google Scholar]
- Lantz, B. Machine Learning with R: Expert Techniques for Predictive Modeling; Packt Publishing Ltd.: Birmingham, UK, 2019. [Google Scholar]
- Schneider, C.A.; Rasband Ws Fau-Eliceiri, K.W.; Eliceiri, K.W. NIH Image to ImageJ: 25 years of image analysis. Nat. Methods 2012, 9, 671–675. [Google Scholar] [CrossRef] [PubMed]
- Chi, J.; Walia, E.; Babyn, P.; Wang, J.; Groot, G.; Eramian, M. Thyroid Nodule Classification in Ultrasound Images by Fine-Tuning Deep Convolutional Neural Network. J. Digit. Imaging 2017, 30, 477–486. [Google Scholar] [CrossRef] [PubMed]
- Chai, Y.J.; Song, J.; Shaear, M.; Yi, K.H. Artificial intelligence for thyroid nodule ultrasound image analysis. Ann. Thyroid 2020, 5, 8. [Google Scholar] [CrossRef]
- Nwanganga, F.; Chapple, M. Practical Machine Learning in R; John Wiley & Sons: Hoboken, NJ, USA, 2020. [Google Scholar]
- Nanni, L.; Lumini, A.; Fau-Brahnam, S.; Brahnam, S. Local binary patterns variants as texture descriptors for medical image analysis. Artif. Intell. Med. 2010, 49, 117–125. [Google Scholar] [CrossRef] [PubMed]
- Materka, A.; Strzelecki, M. Texture Analysis Methods—A Review; COST B11 Report; Technical University of Lodz: Lodz, Poland; Institute of Electronics: Brussels, Belgium, 1998; Volume 10, p. 4968. [Google Scholar]
- Uddin, S.A.-O.; Khan, A.; Hossain, M.E.; Moni, M.A. Comparing different supervised machine learning algorithms for disease prediction. BMC Med. Inform. Decis. Mak. 2019, 19, 281. [Google Scholar] [CrossRef] [PubMed]


Disclaimer/Publisher’s Note: The statements, opinions and data contained in all publications are solely those of the individual author(s) and contributor(s) and not of MDPI and/or the editor(s). MDPI and/or the editor(s) disclaim responsibility for any injury to people or property resulting from any ideas, methods, instructions or products referred to in the content. |
© 2024 by the authors. Licensee MDPI, Basel, Switzerland. This article is an open access article distributed under the terms and conditions of the Creative Commons Attribution (CC BY) license (https://creativecommons.org/licenses/by/4.0/).