
Hypopituitarism, Diabetes Insipidus, and Syndrome of Inappropriate Antidiuretic Hormone Secretion after Pituitary Macroadenoma Surgery with Indocyanine Green Dye


Abstract
1. Introduction
2. Materials and Methods
- Patients
- Indocyanine green material
- Optics
- Hormonal testing
- Radiologic evaluation
- Statistical analysis of the data
3. Results
4. Discussion
5. Conclusions
Author Contributions
Funding
Institutional Review Board Statement
Informed Consent Statement
Data Availability Statement
Acknowledgments
Conflicts of Interest
References
- Miller, K.D.; Ostrom, Q.T.; Kruchko, C.; Patil, N.; Tihan, T.; Cioffi, G.; Fuchs, H.E.; Waite, K.A.; Jemal, A.; Siegel, R.L.; et al. Brain and other central nervous system tumor statistics. CA Cancer J. Clin. 2021, 71, 381–406. [Google Scholar] [CrossRef] [PubMed]
- Ezzat, S.; Asa, S.L.; Couldwell, W.T.; Barr, C.E.; Dodge, W.E.; Vance, M.L.; McCutcheon, I.E. The prevalence of pituitary adenomas: A systematic review. Cancer 2004, 101, 613–619. [Google Scholar] [CrossRef] [PubMed]
- Melmed, S. Pituitary-Tumor Endocrinopathies. N. Engl. J. Med. 2020, 382, 937–950. [Google Scholar] [CrossRef] [PubMed]
- Vandeva, S.; Vasilev, V.; Vroonen, L.; Naves, L.; Jaffrain-Rea, M.L.; Daly, A.F.; Zacharieva, S.; Beckers, A. Familial pituitary adenomas. Ann. Endocrinol. 2010, 71, 479–485. [Google Scholar] [CrossRef]
- Tritos, N.A.; Miller, K.K. Diagnosis and Management of Pituitary Adenomas: A Review. JAMA 2023, 329, 1386–1398. [Google Scholar] [CrossRef]
- Molitch, M.E. Diagnosis and Treatment of Pituitary Adenomas: A Review. JAMA 2017, 317, 516–524. [Google Scholar] [CrossRef]
- Hardy, J. Transsphenoidal Neurosurgery of Intracranial Neoplasm—PubMed 1976. Available online: https://pubmed.ncbi.nlm.nih.gov/945663/ (accessed on 10 November 2023).
- Araujo-Castro, M.; Acitores Cancela, A.; Vior, C.; Pascual-Corrales, E.; Rodríguez Berrocal, V. Radiological Knosp, Revised-Knosp, and Hardy–Wilson Classifications for the Prediction of Surgical Outcomes in the Endoscopic Endonasal Surgery of Pituitary Adenomas: Study of 228 Cases. Front. Oncol. 2021, 11, 807040. [Google Scholar] [CrossRef]
- Knosp, E.; Steiner, E.; Kitz, K.; Matula, C. Pituitary adenomas with invasion of the cavernous sinus space: A magnetic resonance imaging classification compared with surgical findings. Neurosurgery 1993, 33, 610–618. [Google Scholar] [CrossRef] [PubMed]
- Russ, S.; Anastasopoulou, C.; Shafiq, I. Pituitary Adenoma. Preoperative Assessment: A Case-Based Approach; Springer Nature: Berlin/Heidelberg, Germany, 2023; pp. 127–131. [Google Scholar]
- Fukuhara, N.; Nishiyama, M.; Iwasaki, Y. Update in Pathogenesis, Diagnosis, and Therapy of Prolactinoma. Cancers 2022, 14, 3604. [Google Scholar] [CrossRef]
- Messerer, M.; Cossu, G.; George, M.; Daniel, R.T. Endoscopic Endonasal Trans-sphenoidal Approach: Minimally Invasive Surgery for Pituitary Adenomas. J. Vis. Exp. 2018, 2018, 55896. [Google Scholar]
- Jugenburg, M.; Kovacs, K.; Stefaneanu, L.; Scheithauer, B.W. Vasculature in Nontumorous Hypophyses, Pituitary Adenomas, and Carcinomas: A Quantitative Morphologic Study. Endocr. Pathol. 1995, 6, 115–124. [Google Scholar] [CrossRef] [PubMed]
- Inoue, A.; Kohno, S.; Ohnishi, T.; Nishida, N.; Suehiro, S.; Nakamura, Y.; Matsumoto, S.; Nishikawa, M.; Ozaki, S.; Shigekawa, S.; et al. Tricks and traps of ICG endoscopy for effectively applying endoscopic transsphenoidal surgery to pituitary adenoma. Neurosurg. Rev. 2021, 44, 2133–2143. [Google Scholar] [CrossRef]
- Reinhart, M.B.; Huntington, C.R.; Blair, L.J.; Heniford, B.T.; Augenstein, V.A. Indocyanine Green: Historical Context, Current Applications, and Future Considerations. Surg. Innov. 2016, 23, 166–175. [Google Scholar] [CrossRef] [PubMed]
- Litvack, Z.N.; Zada, G.; Laws, E.R. Indocyanine green fluorescence endoscopy for visual differentiation of pituitary tumor from surrounding structures: Clinical article. J. Neurosurg. 2012, 116, 935–941. [Google Scholar] [CrossRef]
- Amano, K.; Aihara, Y.; Tsuzuki, S.; Okada, Y.; Kawamata, T. Application of indocyanine green fluorescence endoscopic system in transsphenoidal surgery for pituitary tumors. Acta Neurochir. 2019, 161, 695–706. [Google Scholar] [CrossRef]
- Vergeer, R.A.; Theunissen, R.E.; van Elk, T.; Schmidt, I.; Postma, M.R.; Tamasi, K.; van Dijk, J.M.C.; Kuijlen, J.M. Fluorescence-guided detection of pituitary neuroendocrine tumor (PitNET) tissue during endoscopic transsphenoidal surgery available agents, their potential, and technical aspects. Rev. Endocr. Metab. Disord. 2022, 23, 647–657. [Google Scholar] [CrossRef] [PubMed]
- Catapano, G.; Sgulò, F.; Laleva, L.; Columbano, L.; Dallan, I.; de Notaris, M. Multimodal use of indocyanine green endoscopy in neurosurgery: A single-center experience and review of the literature. Neurosurg. Rev. 2018, 41, 985–998. [Google Scholar] [CrossRef]
- Hide, T.; Yano, S.; Shinojima, N.; Kuratsu, J.I. Usefulness of the indocyanine green fluorescence endoscope in endonasal transsphenoidal surgery. J. Neurosurg. 2015, 122, 1185–1192. [Google Scholar] [CrossRef]
- Lee, J.Y.; Cho, S.S.; Zeh, R.; Pierce, J.T.; Martinez-Lage, M.; Adappa, N.D.; Palmer, J.N.; Newman, J.G.; Learned, K.O. Folate receptor overexpression can be visualized in real time during pituitary adenoma endoscopic transsphenoidal surgery with near-infrared imaging. J. Neurosurg. 2018, 129, 390–403. [Google Scholar] [CrossRef]
- Jeon, J.W.; Cho, S.S.; Nag, S.; Buch, L.; Pierce, J.; Su, Y.S.; Adappa, N.D.; Palmer, J.N.; Newman, J.G.; Singhal, S.; et al. Near-Infrared Optical Contrast of Skull Base Tumors During Endoscopic Endonasal Surgery. Oper. Neurosurg. 2019, 17, 32–42. [Google Scholar] [CrossRef]
- Kamimura, K.; Nakajo, M.; Bohara, M.; Nagano, D.; Fukukura, Y.; Fujio, S.; Takajo, T.; Tabata, K.; Iwanaga, T.; Imai, H.; et al. Consistency of Pituitary Adenoma: Prediction by Pharmacokinetic Dynamic Contrast-Enhanced MRI and Comparison with Histologic Collagen Content. Cancers 2021, 13, 3914. [Google Scholar] [CrossRef]
- Romano, A.; Coppola, V.; Lombardi, M.; Lavorato, L.; Di Stefano, D.; Caroli, E.; Rossi Espagnet, M.C.; Tavanti, F.; Minniti, G.; Trillò, G.; et al. Predictive role of dynamic contrast enhanced T1-weighted MR sequences in pre-surgical evaluation of macroadenomas consistency. Pituitary 2017, 20, 201–209. [Google Scholar] [CrossRef]
- Zhan, R.; Ma, Z.; Wang, D.; Li, X. Pure Endoscopic Endonasal Transsphenoidal Approach for Nonfunctioning Pituitary Adenomas in the Elderly: Surgical Outcomes and Complications in 158 Patients. World Neurosurg. 2015, 84, 1572–1578. [Google Scholar] [CrossRef] [PubMed]
- Incidence of Diabetes Insipidus in Postoperative Period among the Patients Undergoing Pituitary Tumour Surgery—PubMed. Available online: https://pubmed.ncbi.nlm.nih.gov/28919622/ (accessed on 13 May 2023).
- Nayak, P.; Montaser, A.S.; Hu, J.; Prevedello, D.M.; Kirschner, L.S.; Ghalib, L. Predictors of Postoperative Diabetes Insipidus Following Endoscopic Resection of Pituitary Adenomas. J. Endocr. Soc. 2018, 2, 1010. [Google Scholar] [CrossRef] [PubMed]
- Zoli, M.; Mazzatenta, D.; Faustini-Fustini, M. Transient Delayed Hyponatremia after Transsphenoidal Surgery: Attempting to Enlighten the Epidemiology and Management of a Still-Obscure Complication. World Neurosurg. 2016, 90, 654–656. [Google Scholar] [CrossRef]
- Patel, K.S.; Chen, J.S.; Yuan, F.; Attiah, M.; Wilson, B.; Wang, M.B.; Bergsneider, M.; Kim, W. Prediction of post-operative delayed hyponatremia after endoscopic transsphenoidal surgery. Clin. Neurol. Neurosurg. 2019, 182, 87–91. [Google Scholar] [CrossRef] [PubMed]
- Sorba, E.L.; Staartjes, V.E.; Voglis, S.; Tosic, L.; Brandi, G.; Tschopp, O.; Serra, C.; Regli, L. Diabetes insipidus and syndrome of inappropriate antidiuresis (SIADH) after pituitary surgery: Incidence and risk factors. Neurosurg. Rev. 2021, 44, 1503–1511. [Google Scholar] [CrossRef]
- Mavromati, M.; Mavrakanas, T.; Jornayvaz, F.R.; Schaller, K.; Fitsiori, A.; Vargas, M.I.; Lobrinus, J.A.; Merkler, D.; Egervari, K.; Philippe, J.; et al. The impact of transsphenoidal surgery on pituitary function in patients with non-functioning macroadenomas. Endocrine 2023, 81, 340–348. [Google Scholar] [CrossRef]
- Munda, M.; Velnar, T.; Bosnjak, R.; Zele, T.; Gradisnik, L.; Spazzapan, P.; Kos, N.; Kocivnik, N.; Benedicic, M.; Prestor, B. COVID-19 and Surgical Practice in Slovenia: Managing the Crisis in Neurosurgery during the COVID-19 Pandemic. Life 2023, 13, 2095. [Google Scholar] [CrossRef]
- Lundin, P.; Pedersen, F. Volume of pituitary macroadenomas: Assessment by MRI. J. Comput. Assist. Tomogr. 1992, 16, 519–528. [Google Scholar] [CrossRef]

| All n = 34 | ICG n = 17 | No ICG n = 17 | p-Value 1 | |
|---|---|---|---|---|
| Age, years | 60.9 ± 11.2 | 62.7 ± 9.9 | 59.1 ± 12.4 | 0.360 |
| Gender, n (%) | 0.714 | |||
| Male | 23 (67.7) | 11 (64.7) | 12 (70.6) | |
| Female | 11 (32.4) | 6 (35.3) | 5 (29.4) | |
| Tumor size, mm3 | 7802 (2577–11,261) | 5130 (2344–6026) | 10,473 (3753–16,273) | 0.041 |
| Knosp classification, n (%) | 0.764 | |||
| 0 | 3 (8.8) | 2 (11.8) | 1 (5.9) | |
| 1 | 18 (52.9) | 8 (47.1) | 10 (58.8) | |
| 2 | 8 (23.5) | 5 (29.4) | 3 (17.6) | |
| 3 | 5 (14.7) | 2 (11.8) | 3 (17.6) | |
| Hardy classification, n (%) | 0.817 | |||
| 1 | 5 (14.7) | 3 (17.6) | 2 (11.8) | |
| 2 | 9 (26.5) | 4 (23.5) | 5 (29.4) | |
| 3 | 10 (29.4) | 6 (35.3) | 4 (23.5) | |
| 4 | 10 (29.4) | 4 (23.5) | 6 (35.3) |
| ICG Group | No ICG Group | p1 | p2 | p3 | |||||
|---|---|---|---|---|---|---|---|---|---|
| Pre-OP | Post-OP | 3–6 Months Post-OP | Pre-OP | Post-OP | 3–6 Months Post-OP | ICG vs. No ICG | Control Measurement | Interaction | |
| Fluid balance, n (%) | 0.210 | 0.116 | 0.258 | ||||||
| No complication | 17/17 (100) | 12/17 (70.6) | 16/17 (94.1) | 17/17 (100) | 12/17 (70.6) | 13/17 (76.5) | |||
| Complication | 0/17 (0) | 5/17 (29.4) | 1/17 (5.9) | 0/17 (0) | 5/17 (29.4) | 4/17 (23.5) | |||
| Fluid balance complication, n (%) | - | - | |||||||
| Diabetes insipidus | - | 3/5 | 1/1 | - | 4/5 | 4/4 | 0.148 | 0.399 | 0.399 |
| SIADH | - | 2/5 | 0/1 | - | 1/5 | 0/4 | - | - | |
| ICG n = 17 | No ICG n = 17 | p-Value 1 | |
|---|---|---|---|
| HP before OP, n (%) | 0.3 | ||
| No | 8 (47.1) | 6 (35.3) | |
| Yes | 9 (52.9) | 11 (64.7) | |
| HP after OP, n (%) | - | ||
| No | 0 (0) | 0 (0) | |
| Yes | 17 (100) | 17 (100) | |
| HP 3–6 months after OP 2, n (%) | 0.822 | ||
| Not detectable | 5/17 (33.3) | 3/17 (18.8) | |
| Improvement | 2/17 (13.3) | 2/17 (12.5) | |
| As after OP (HP already before OP) | 1/17(6.7) | 3/17 (12.5) | |
| After OP (HP occurs after OP) | 1/17 (6.7) | 3/17 (18.8) | |
| Deterioration | 8/17 (40.0) | 6/17 (37.5) | |
| HP 3–6 months after OP 3, n (%) | 1 | ||
| Improvement | 1/17 (5.9) | 1/17 (5.9) | |
| Steady state | 6/17 (35.3) | 6/17 (35.3) | |
| Deterioration | 10/17 (58.8) | 10/17 (58.8) |
| Number of Axes Affected | Before OP | 3–6 Months after OP | ||||
|---|---|---|---|---|---|---|
| Total | ICG | No ICG | Total | ICG | No ICG | |
| 0 | 14 (41.2) | 8 (47.1) | 6 (35.3) | 8 (23.5) | 5 (29.4) | 3 (17.6) |
| 1 | 5 (14.7) | 2 (11.8) | 3 (17.6) | 6 (17.6) | 3 (17.6) | 3 (17.6) |
| 2 | 10 (29.4) | 3 (17.6) | 7 (41.2) | 7 (20.6) | 0 (0) | 7 (41.2) |
| 3 | 3 (8.8) | 3 (17.6) | 0 (0) | 10 (29.4) | 8 (47.1) | 2 (11.8) |
| 4 | 2 (5.9) | 1 (5.9) | 1 (5.9) | 3 (8.8) | 1 (5.9) | 2 (11.8) |
| p-value | 0.3 | 0.013 | ||||
| Number of Axes Affected | Before OP | 3–6 Months after OP | p2 | ||||||
|---|---|---|---|---|---|---|---|---|---|
| Total | ICG | No ICG | p1 | Total | ICG | No ICG | p1 | ||
| Average ± SE | 1.24 ± 0.22 | 1.24 ± 0.34 | 1.24 ± 0.28 | 1 | 1.82 ± 0.23 | 1.82 ± 0.36 | 1.82 ± 0.30 | 1 | 0.003 |
| Median (first, third quartile) | 1 (0, 2) | 1 (0, 2.5) | 1 (0, 2) | 0.919 | 2 (0.75, 3) | 3 (0, 3) | 2 (1, 2.5) | 0.892 | 0.003 |
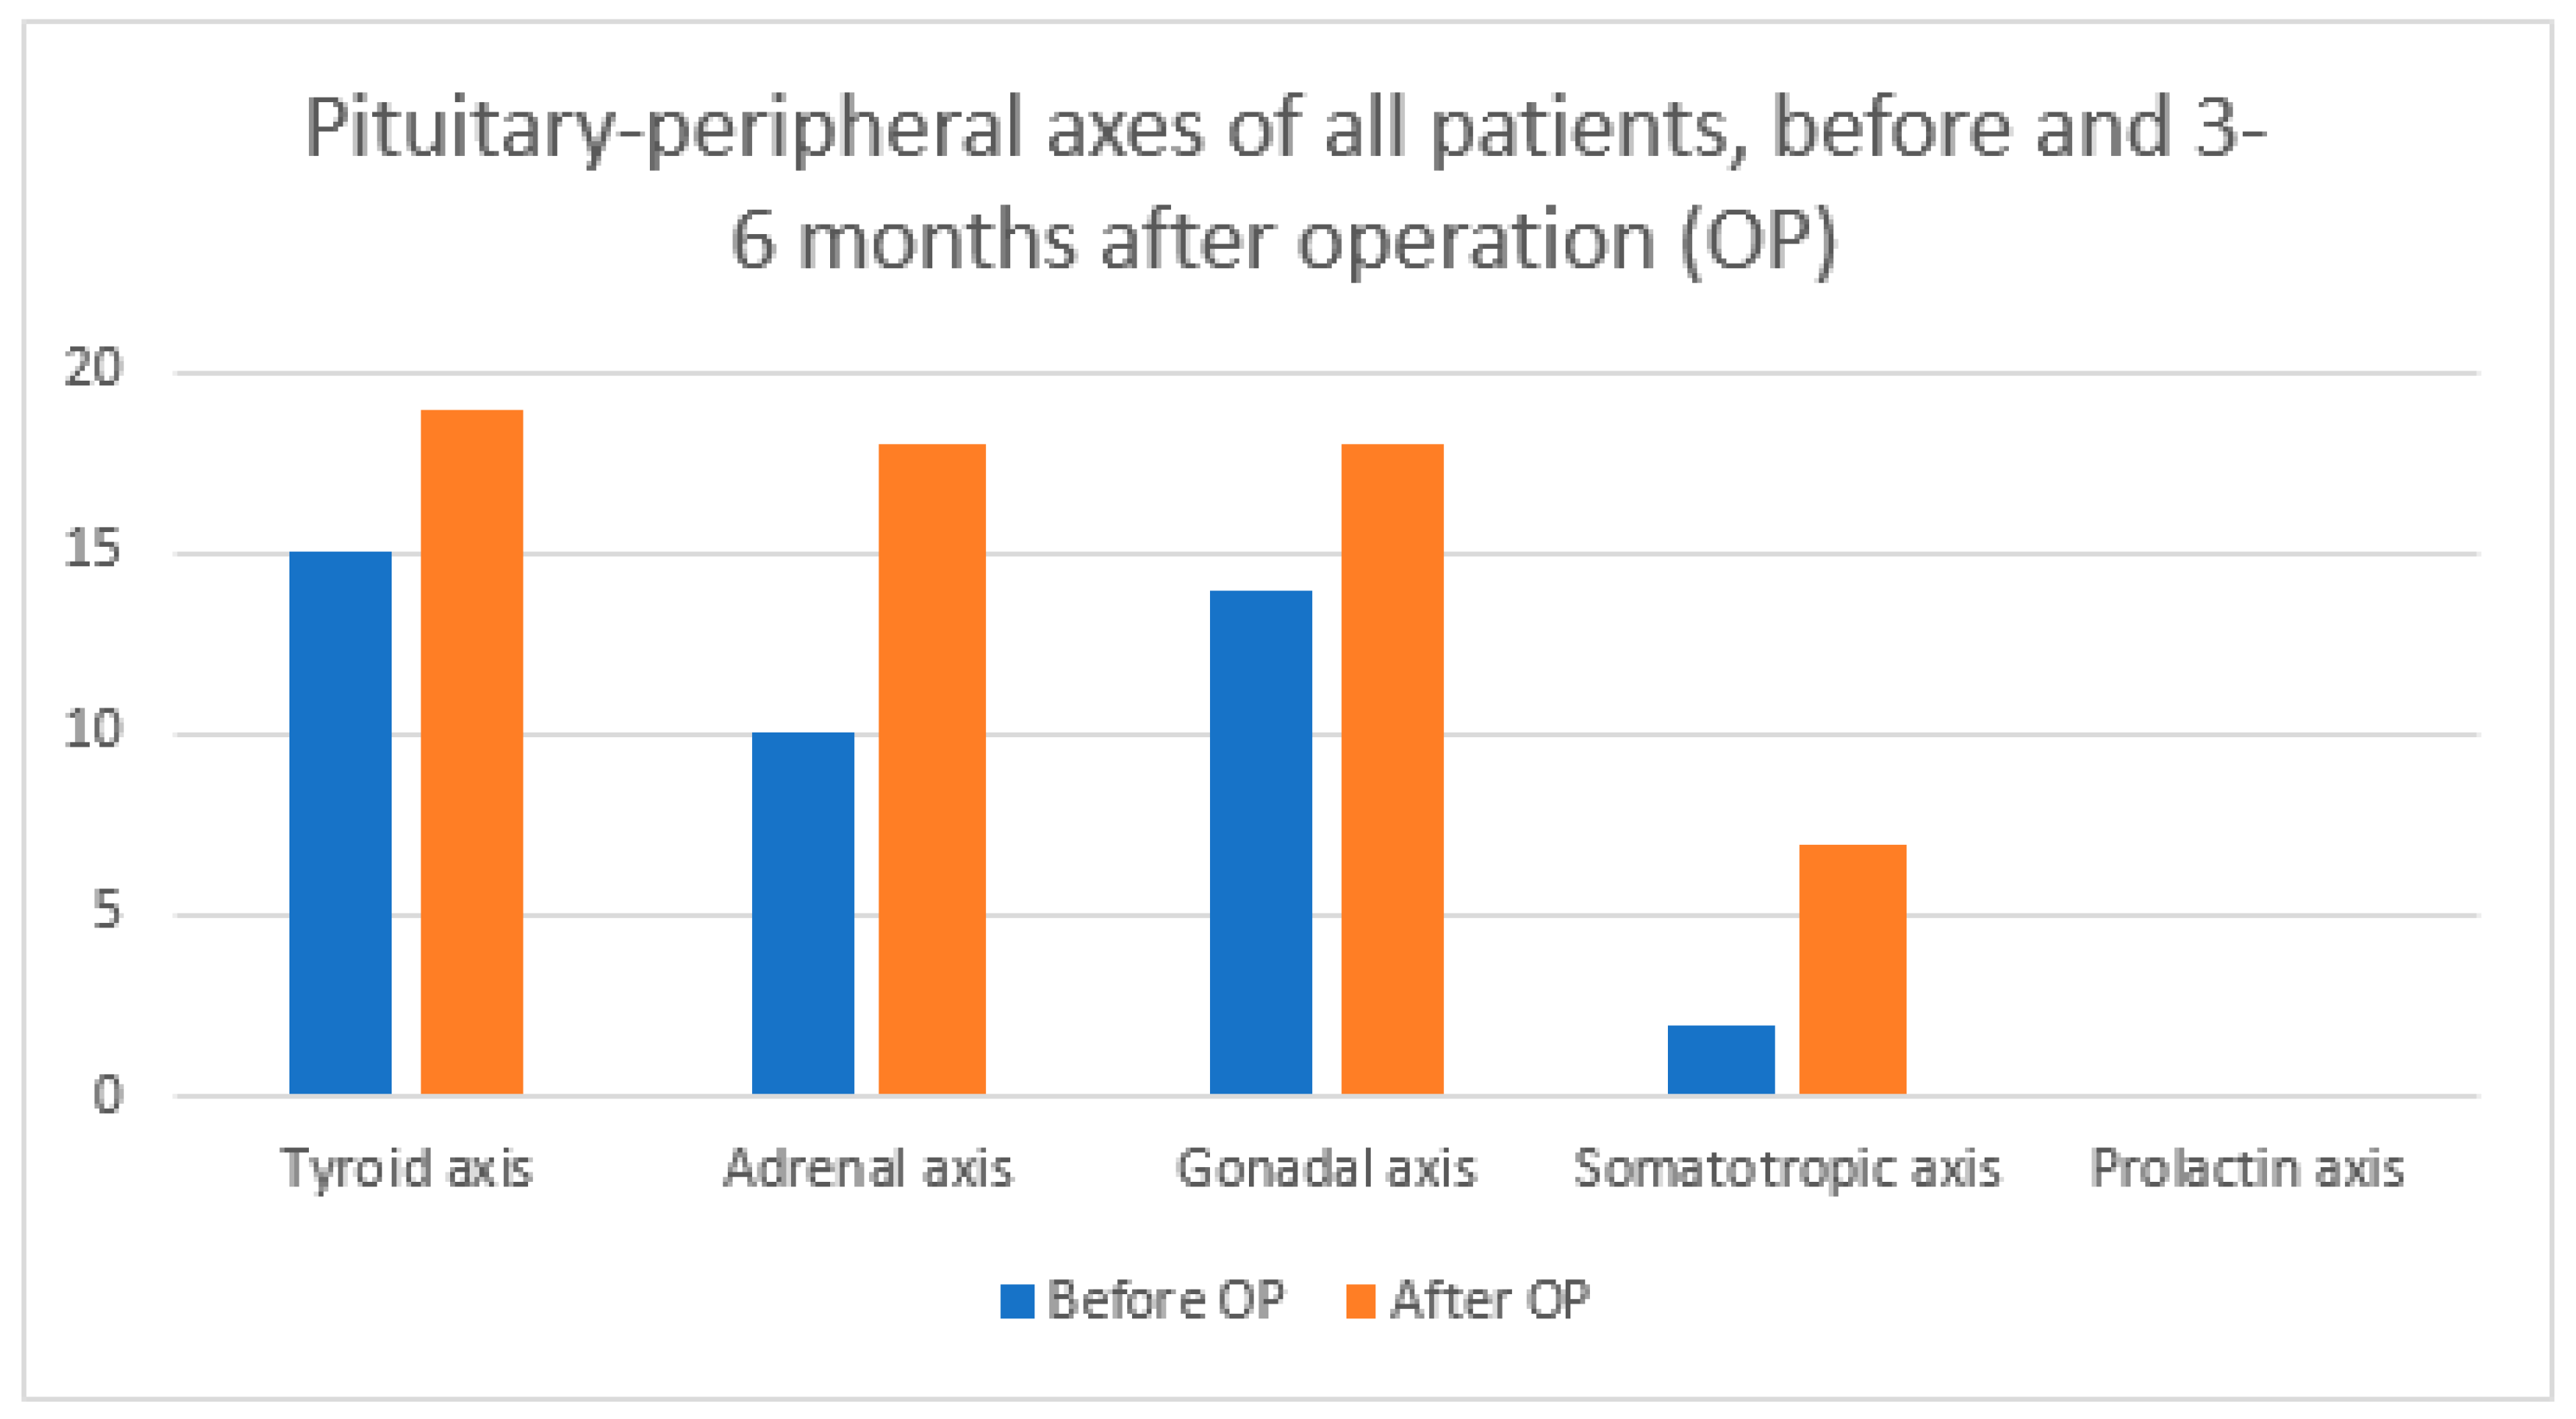
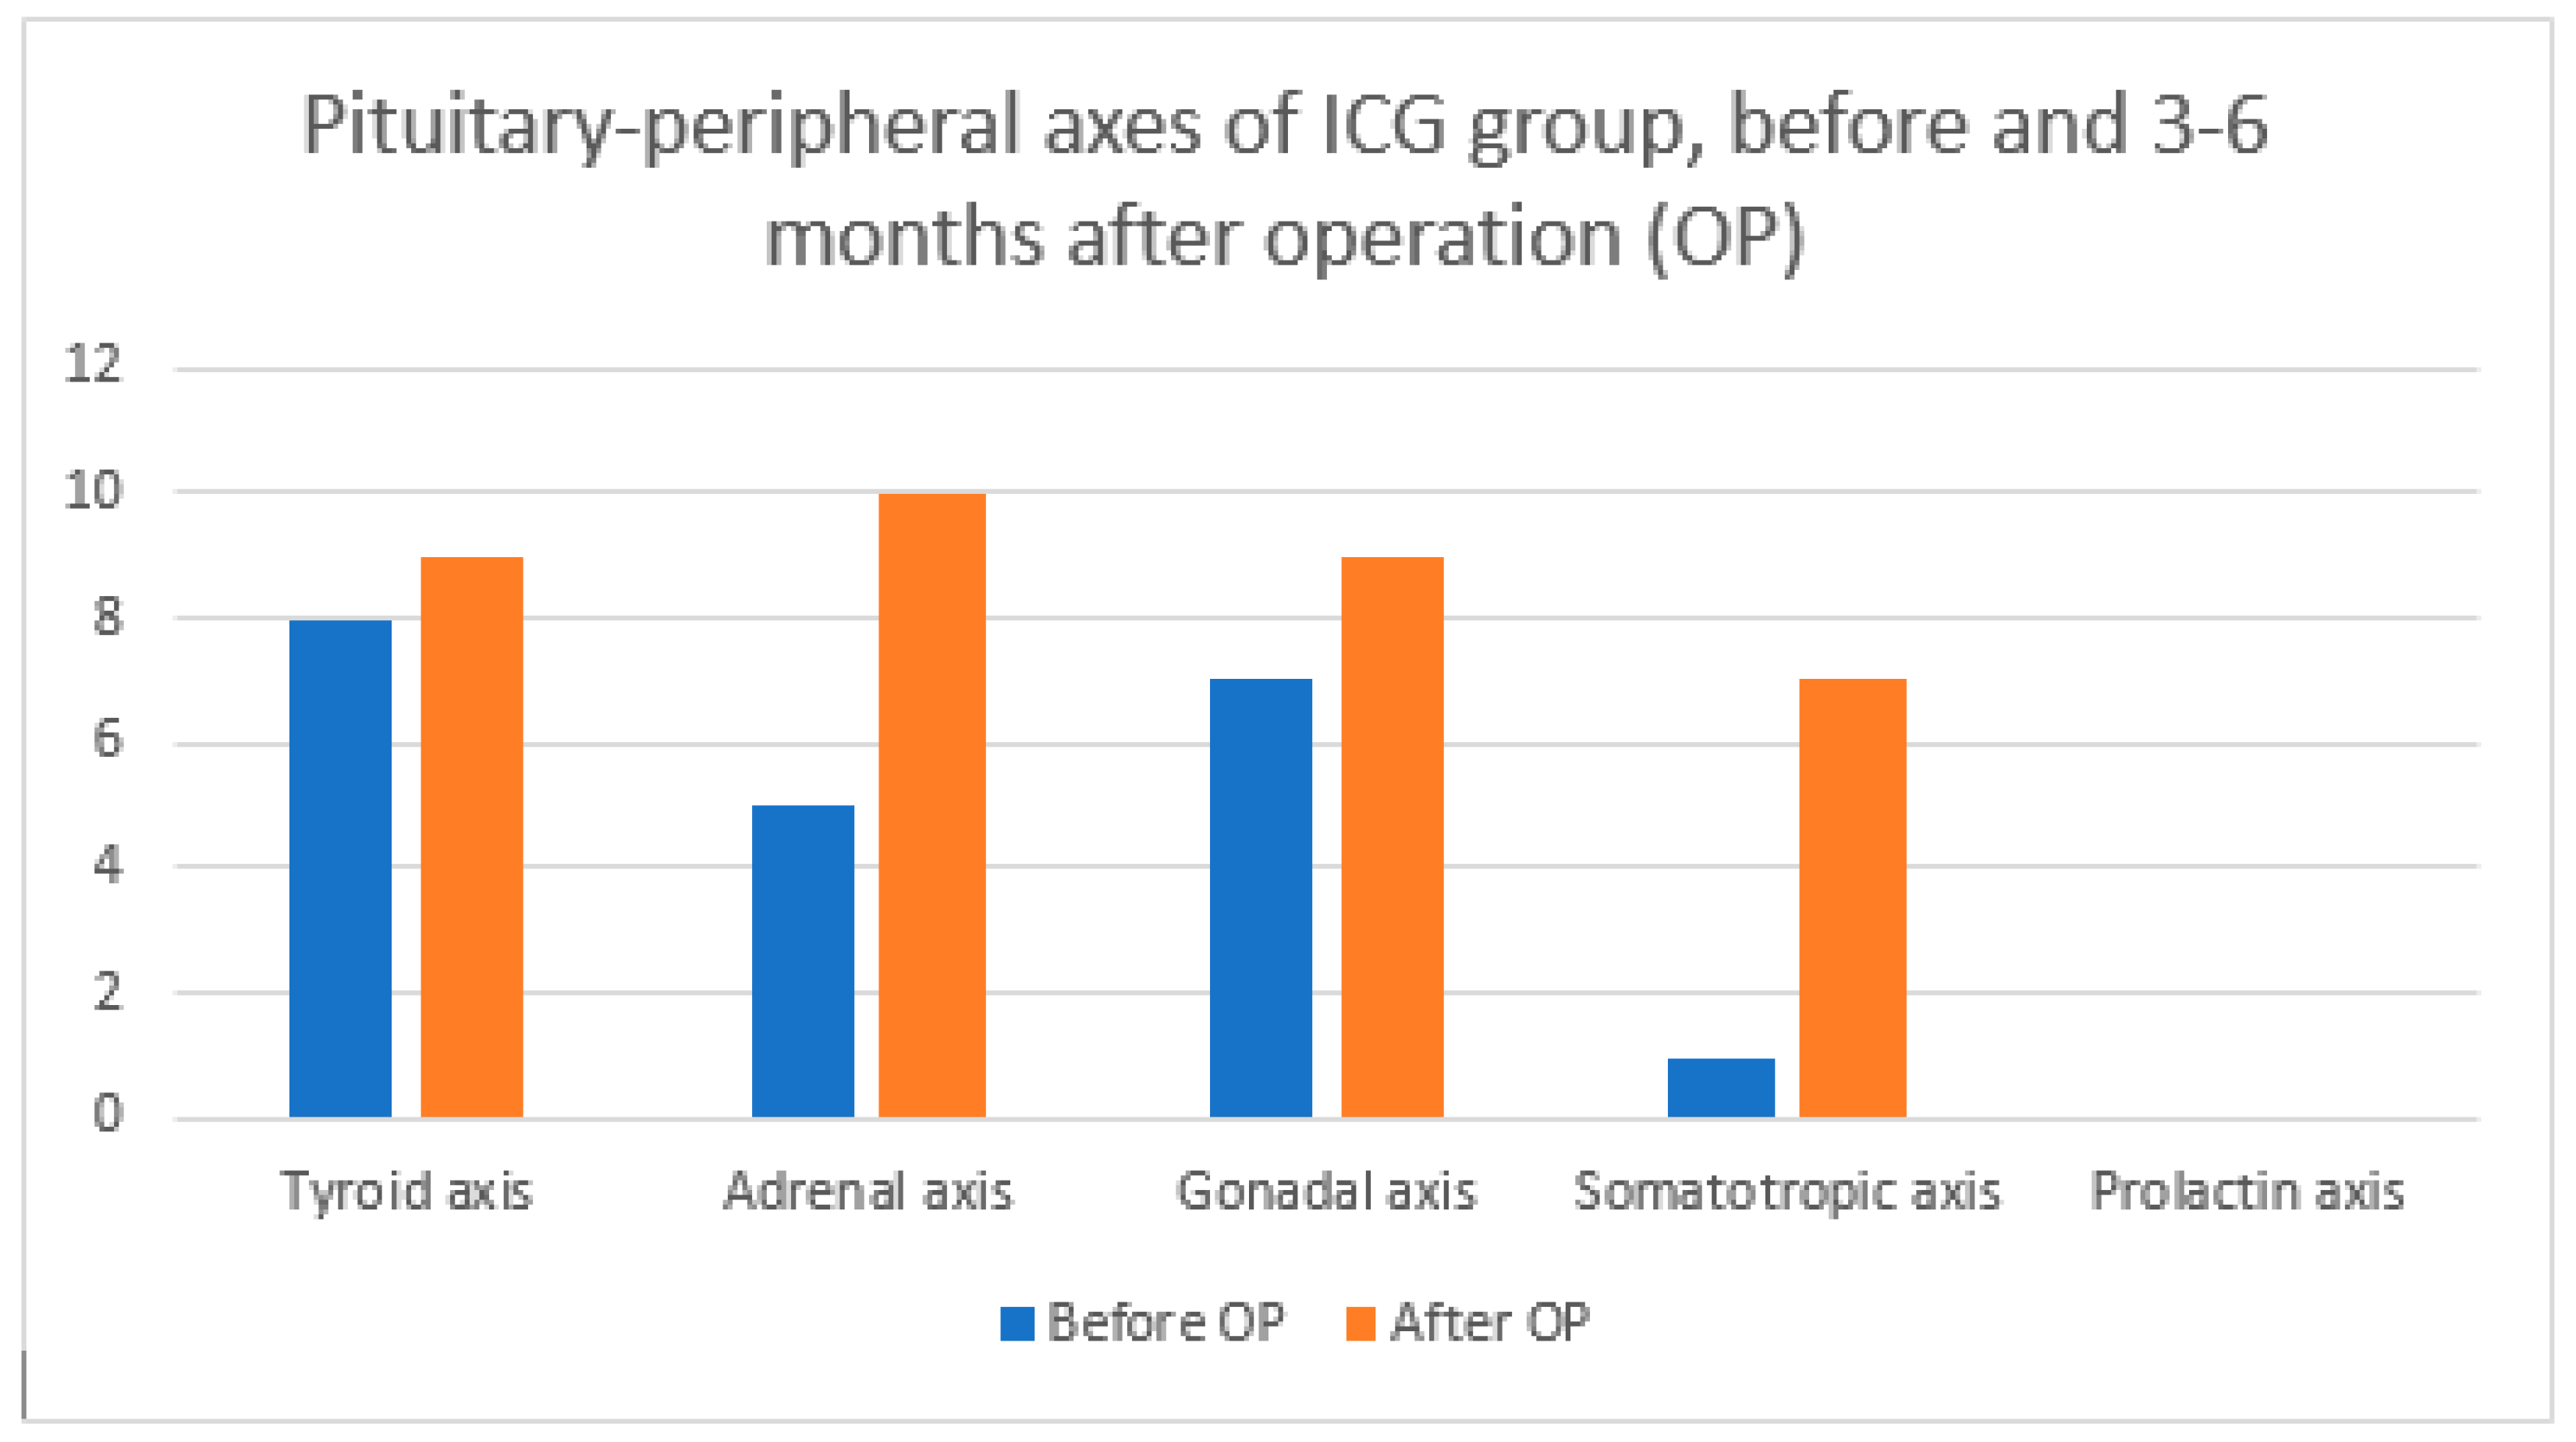
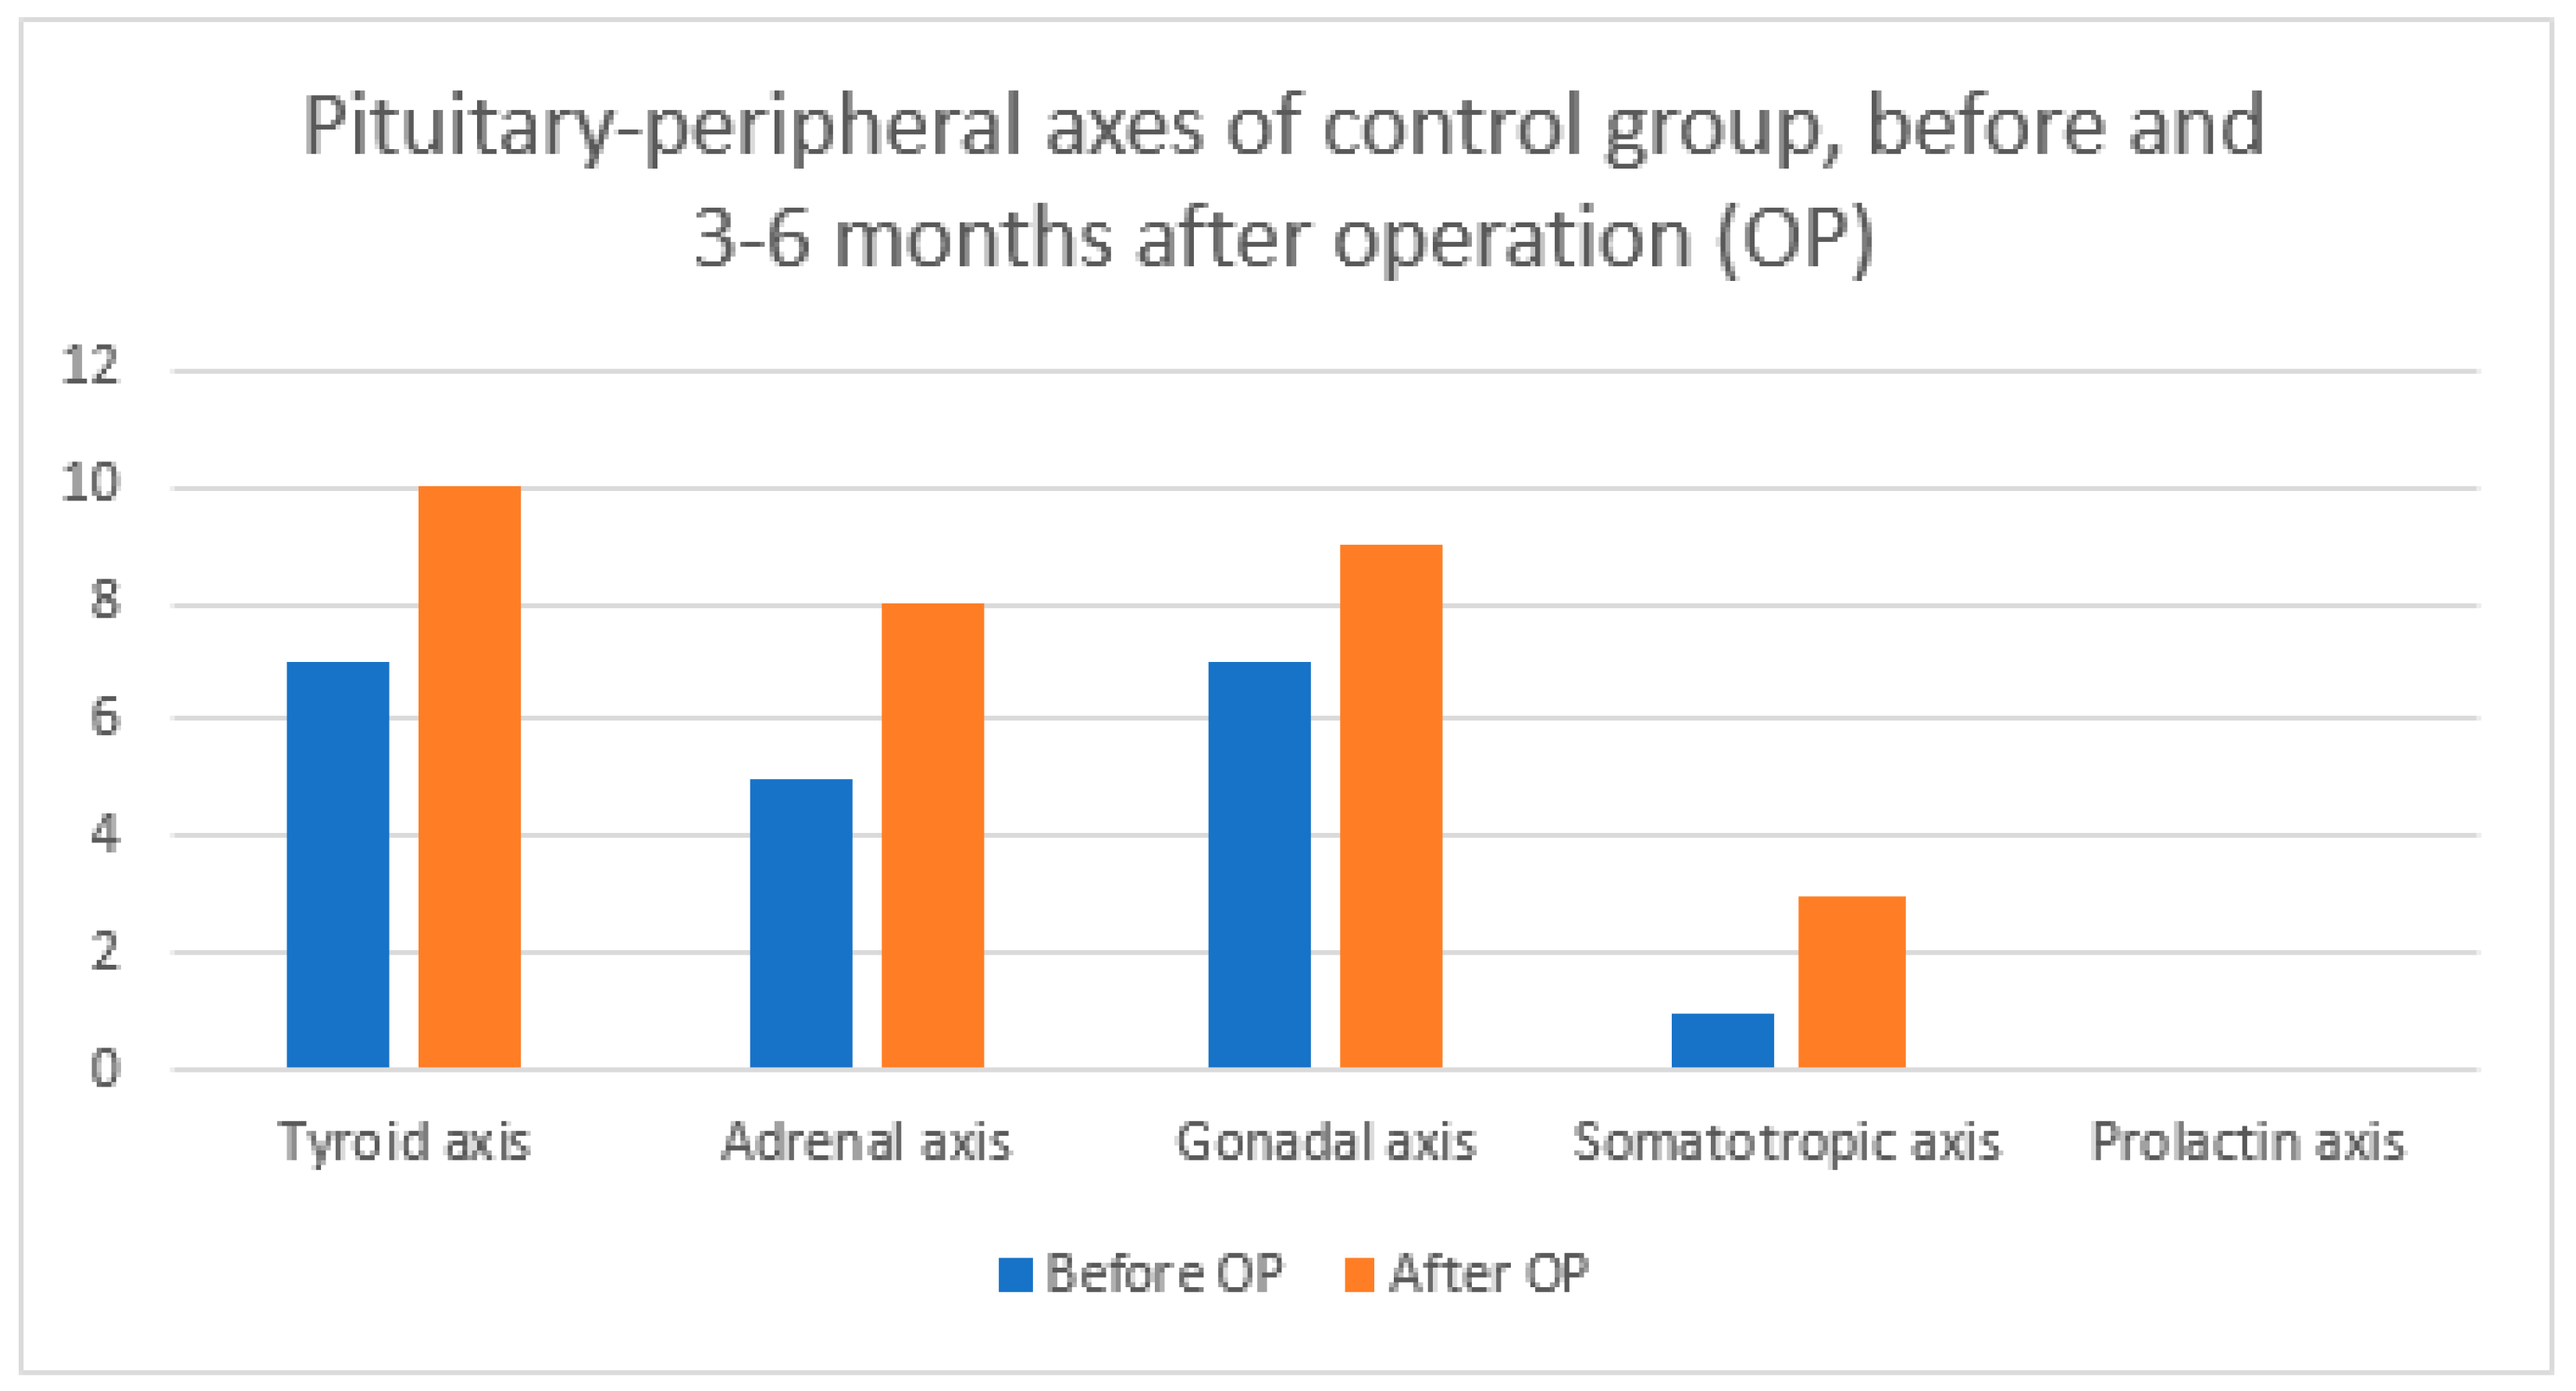
| Axis Type | Before OP | 3–6 Months after OP | ||||
|---|---|---|---|---|---|---|
| Total | ICG | No ICG | Total | ICG | No ICG | |
| Tyroid axis | 15 | 8 | 7 | 19 | 9 | 10 |
| Adrenal axis | 10 | 5 | 5 | 18 | 10 | 8 |
| Gonadal axis | 14 | 7 | 7 | 18 | 9 | 9 |
| Somatotropic axis | 2 | 1 | 1 | 7 | 3 | 4 |
| Prolactin axis | 0 | 0 | 0 | 0 | 0 | 0 |
| Factor | Hypopituitarism | Diabetes Insipidus | ||
|---|---|---|---|---|
| OR (95 % CI) | p | OR (95 % CI) | p | |
| Age | 1.04 (0.96–1.12) | 0.337 | 1.03 (0.94–1.13) | 0.518 |
| Gender | 2.86 (0.53–16.67) | 0.223 | 2.18 (0.20–23.79) | 0.522 |
| Tumor size | 1.00 (0.99–1.00) | 0.101 | 1.00 (1.00–1.00) | 0.169 |
| Knosp | 4.15 (0.96–17.86) | 0.056 | 0.59 (0.16–2.13) | 0.418 |
| Hardy | 2.48 (0.90–6.76) | 0.078 | 0.53 (0.18–1.52) | 0.235 |
Disclaimer/Publisher’s Note: The statements, opinions and data contained in all publications are solely those of the individual author(s) and contributor(s) and not of MDPI and/or the editor(s). MDPI and/or the editor(s) disclaim responsibility for any injury to people or property resulting from any ideas, methods, instructions or products referred to in the content. |
© 2024 by the authors. Licensee MDPI, Basel, Switzerland. This article is an open access article distributed under the terms and conditions of the Creative Commons Attribution (CC BY) license (https://creativecommons.org/licenses/by/4.0/).
Share and Cite
Felbabić, T.; Velnar, T.; Kocjan, T. Hypopituitarism, Diabetes Insipidus, and Syndrome of Inappropriate Antidiuretic Hormone Secretion after Pituitary Macroadenoma Surgery with Indocyanine Green Dye. Diagnostics 2024, 14, 1863. https://doi.org/10.3390/diagnostics14171863
Felbabić T, Velnar T, Kocjan T. Hypopituitarism, Diabetes Insipidus, and Syndrome of Inappropriate Antidiuretic Hormone Secretion after Pituitary Macroadenoma Surgery with Indocyanine Green Dye. Diagnostics. 2024; 14(17):1863. https://doi.org/10.3390/diagnostics14171863
Chicago/Turabian StyleFelbabić, Tomislav, Tomaž Velnar, and Tomaž Kocjan. 2024. "Hypopituitarism, Diabetes Insipidus, and Syndrome of Inappropriate Antidiuretic Hormone Secretion after Pituitary Macroadenoma Surgery with Indocyanine Green Dye" Diagnostics 14, no. 17: 1863. https://doi.org/10.3390/diagnostics14171863
APA StyleFelbabić, T., Velnar, T., & Kocjan, T. (2024). Hypopituitarism, Diabetes Insipidus, and Syndrome of Inappropriate Antidiuretic Hormone Secretion after Pituitary Macroadenoma Surgery with Indocyanine Green Dye. Diagnostics, 14(17), 1863. https://doi.org/10.3390/diagnostics14171863