


Accuracy of Gingival Crevicular Fluid Biomarkers of MMP8, TIMP1, RANK, RANKL, and OPG in Differentiating Symptomatic and Asymptomatic Apical Periodontitis


Abstract
:1. Introduction
2. Materials and Methods
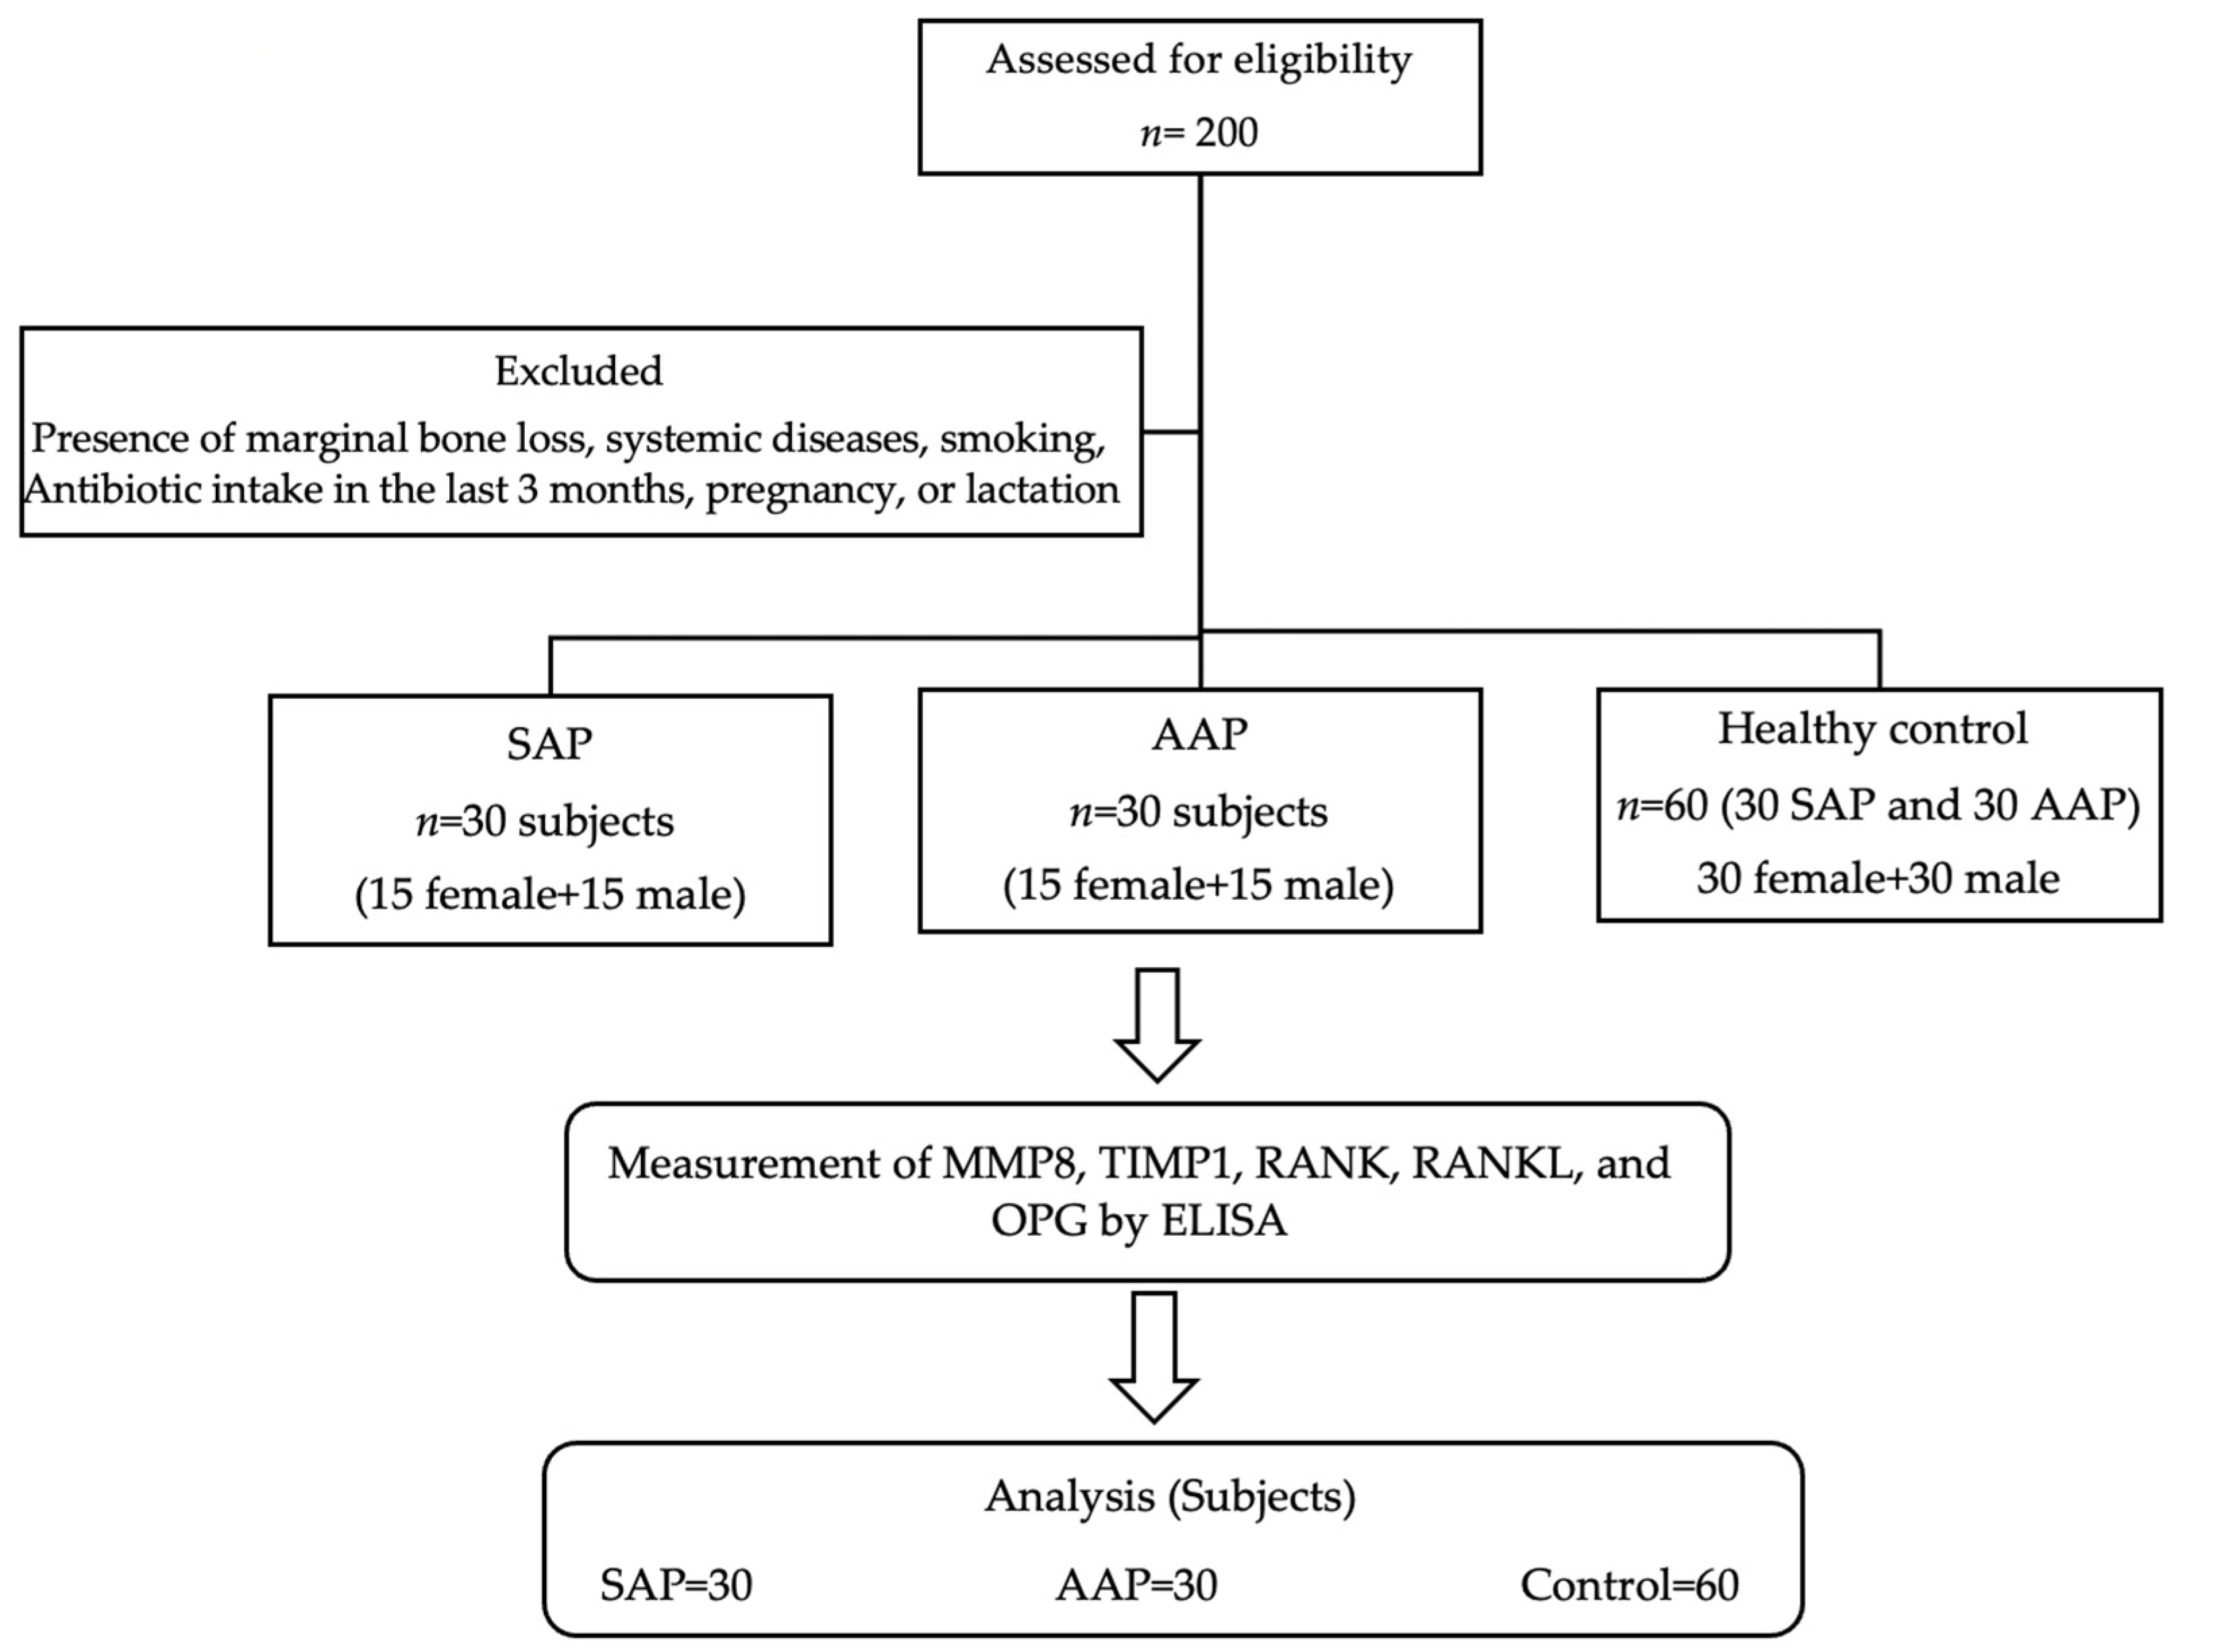
2.1. Study Design
2.2. Study Participants
2.3. Study Criteria
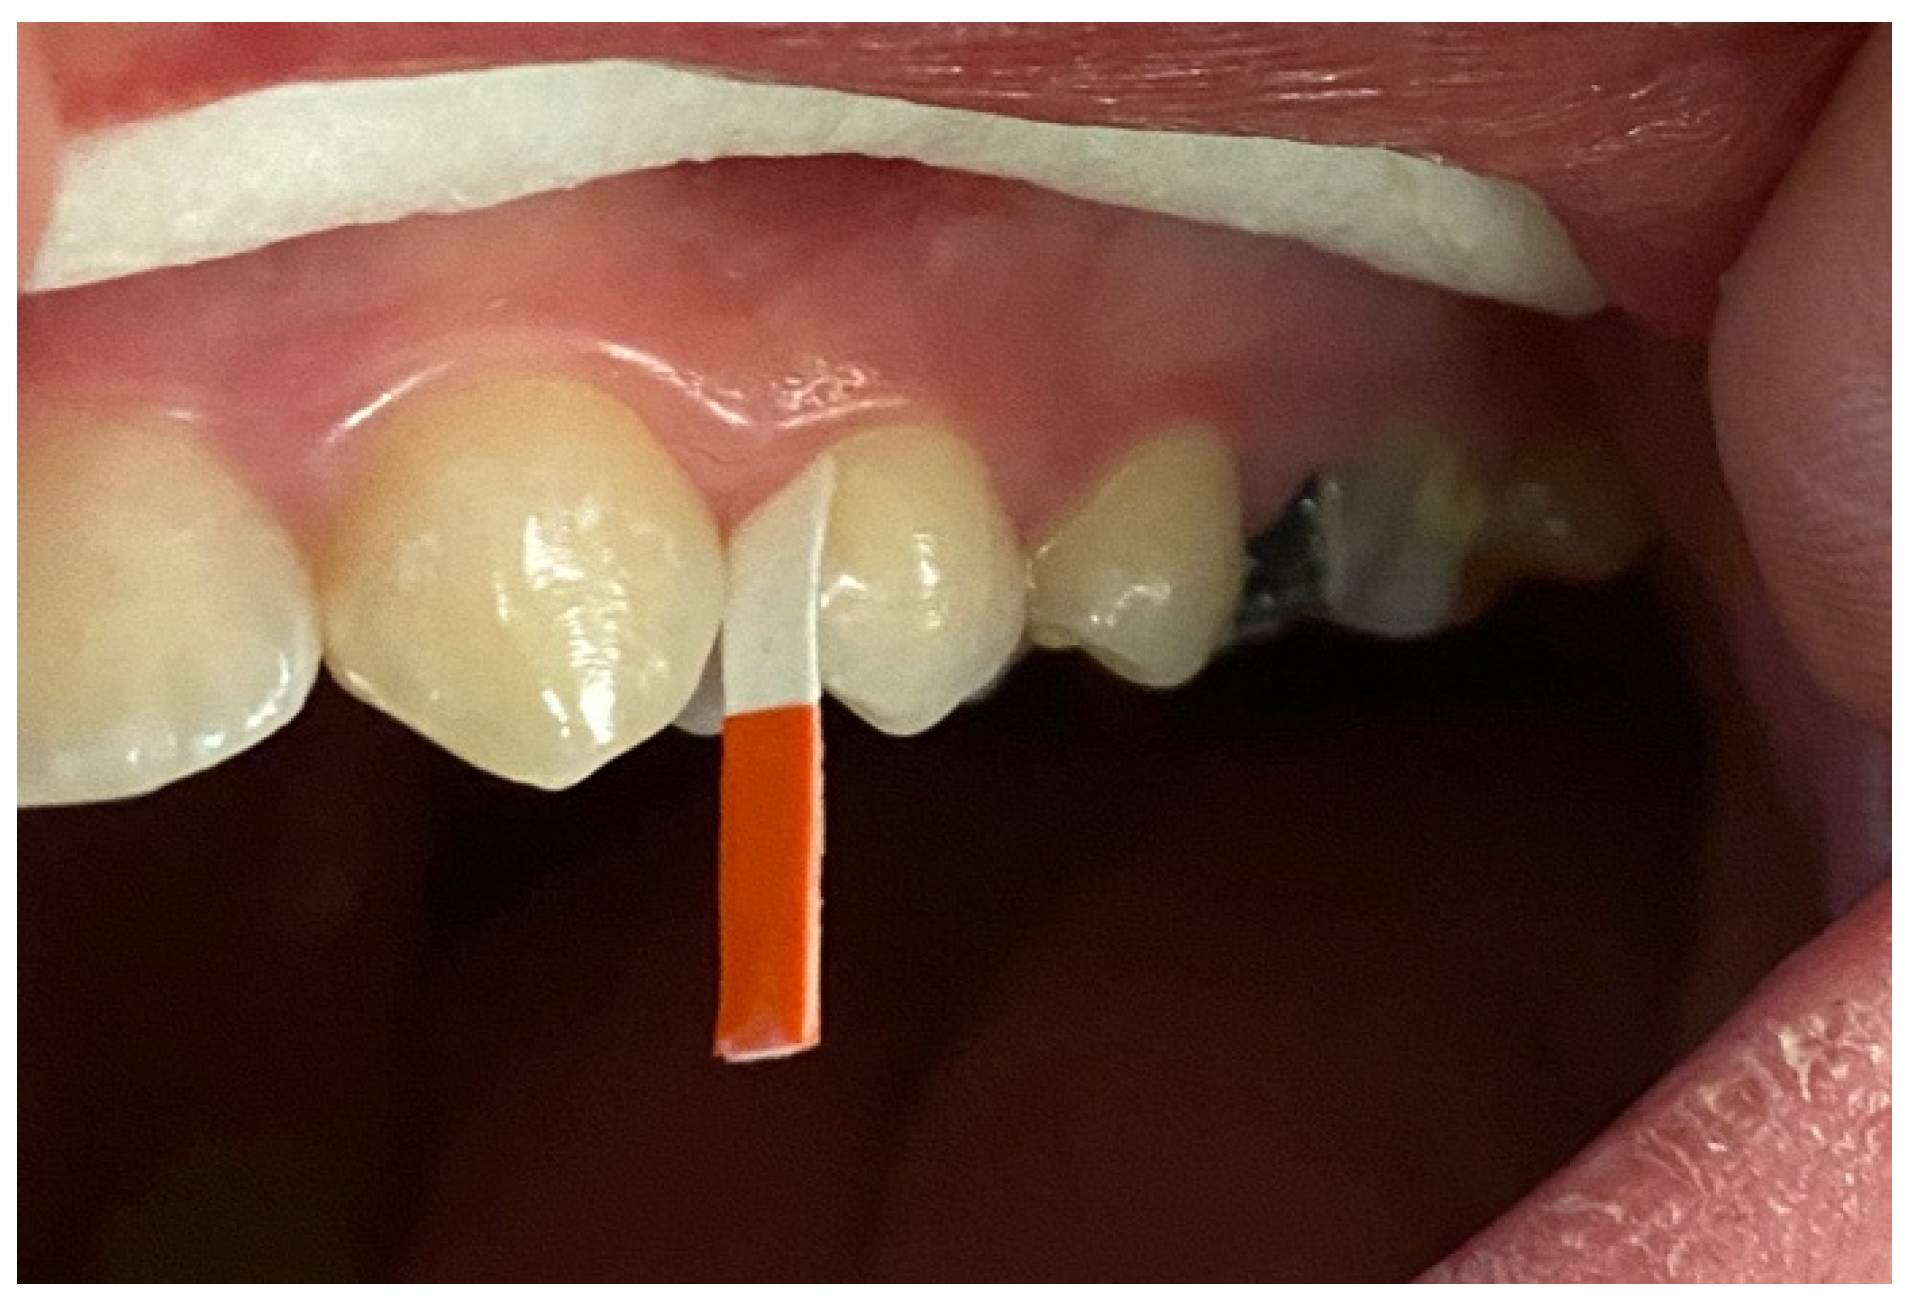
2.4. GCF Samples Collection and Analysis
2.5. Pilot Study and Sample Size Calculation
2.6. Statistical Analysis
3. Results
4. Discussion
5. Conclusions
Author Contributions
Funding
Institutional Review Board Statement
Informed Consent Statement
Data Availability Statement
Acknowledgments
Conflicts of Interest
References
- Prso, I.B.; Kocjan, W.; Simić, H.; Brumini, G.; Pezelj-Ribarić, S.; Borcić, J.; Ferreri, S.; Karlović, I.M. Tumor necrosis factor-alpha and interleukin 6 in human periapical lesions. Mediat. Inflamm. 2007, 2007, 38210. [Google Scholar] [CrossRef]
- Patel, S.; Brown, J.; Semper, M.; Abella, F.; Mannocci, F. European Society of Endodontology position statement: Use of cone beam computed tomography in Endodontics: European Society of Endodontology (ESE) developed by. Int. Endod. J. 2019, 52, 1675–1678. [Google Scholar] [CrossRef]
- Azuma, M.M.; Samuel, R.O.; Gomes-Filho, J.E.; Dezan-Junior, E.; Cintra, L.T. The role of IL-6 on apical periodontitis: A systematic review. Int. Endod. J. 2014, 47, 615–621. [Google Scholar] [CrossRef]
- Hargreaves, K.M.; Goodis, H.E.; Tay, F.R. Seltzer and Bender’s Dental Pulp; Quintessence Pub.: Batavia, IL, USA, 2012. [Google Scholar]
- Saliem, S.S.; Bede, S.Y.; Cooper, P.R.; Abdulkareem, A.A.; Milward, M.R.; Abdullah, B.H. Pathogenesis of periodontitis—A potential role for epithelial-mesenchymal transition. Jpn. Dent. Sci. Rev. 2022, 58, 268–278. [Google Scholar] [CrossRef]
- Glickman, G.N. AAE Consensus Conference on Diagnostic Terminology: Background and perspectives. J. Endod. 2009, 35, 1619–1620. [Google Scholar] [CrossRef]
- Gutmann, J.L.; Baumgartner, J.C.; Gluskin, A.H.; Hartwell, G.R.; Walton, R.E. Identify and define all diagnostic terms for periapical/periradicular health and disease states. J. Endod. 2009, 35, 1658–1674. [Google Scholar] [CrossRef]
- Buonavoglia, A.; Latronico, F.; Pirani, C.; Greco, M.F.; Corrente, M.; Prati, C. Symptomatic and asymptomatic apical periodontitis associated with red complex bacteria: Clinical and microbiological evaluation. Odontology 2013, 101, 84–88. [Google Scholar] [CrossRef]
- Harvanová, G.; Duranková, S.; Bernasovská, J. The role of cytokines and chemokines in the inflammatory response. Alergol. Pol.-Pol. J. Allergol. 2023, 10, 210–219. [Google Scholar] [CrossRef]
- Chwendicke, F.; Göstemeyer, G. Single-visit or multiple-visit root canal treatment: Systematic review, meta-analysis and trial sequential analysis. BMJ Open 2017, 7, e013115. [Google Scholar] [CrossRef]
- Mohammed-Salih, H.S.; Saloom, H.F. Collection, storage and protein extraction method of gingival crevicular fluid for proteomic analysis. Baghdad Sci. J. 2022, 19, 0368. [Google Scholar] [CrossRef]
- Mohammed-Salih, H.S.; Al-Lami, H.A.; Saloom, H.F.; Abdulkareem, A.A.; Al-Obaidi, J.R.; Razali, N. Detection of orthodontically induced inflammatory root resorption-associated biomarkers from the gingival crevicular fluid by proteomics analysis: A randomized-controlled clinical trial. 3 Biotech 2023, 13, 157. [Google Scholar] [CrossRef]
- Verstappen, J.; Von Den Hoff, J.W. Tissue inhibitors of metalloproteinases (TIMPs): Their biological functions and involvement in oral disease. J. Dent. Res. 2006, 85, 1074–1084. [Google Scholar] [CrossRef]
- Salazar, M.G.; Jehmlich, N.; Murr, A.; Dhople, V.M.; Holtfreter, B.; Hammer, E.; Völker, U.; Kocher, T. Identification of periodontitis associated changes in the proteome of whole human saliva by mass spectrometric analysis. J. Clin. Periodontol. 2013, 40, 825–832. [Google Scholar] [CrossRef]
- AlMudaris, I.Z.; AlRawi, N.A. Salivary Matrix Metalloproteinase-8 (MMP-8) in Relation to Periodontal Health Status among a Group of Hypertensive Patients. J. Baghdad Coll. Dent. 2018, 30, 48–53. [Google Scholar] [CrossRef]
- Sorsa, T.; Mäntylä, P.; Tervahartiala, T.; Pussinen, P.J.; Gamonal, J.; Hernandez, M. MMP activation in diagnostics of periodontitis and systemic inflammation. J. Clin. Periodontol. 2011, 38, 817–819. [Google Scholar] [CrossRef]
- Gul, S.S.; Abdulkareem, A.A.; Sha, A.M.; Rawlinson, A. Diagnostic Accuracy of Oral Fluids Biomarker Profile to Determine the Current and Future Status of Periodontal and Peri-Implant Diseases. Diagnostics 2020, 10, 838. [Google Scholar] [CrossRef]
- Kinane, D.F.; Stathopoulou, P.G.; Papapanou, P.N. Periodontal diseases. Nat. Rev. Dis. Primers 2017, 3, 17038. [Google Scholar] [CrossRef]
- Vernal, R.; Dezerega, A.; Dutzan, N.; Chaparro, A.; León, R.; Chandía, S.; Silva, A.; Gamonal, J. RANKL in human periapical granuloma: Possible involvement in periapical bone destruction. Oral Dis. 2006, 12, 283–289. [Google Scholar] [CrossRef]
- Araujo-Pires, A.C.; Francisconi, C.F.; Biguetti, C.C.; Cavalla, F.; Aranha, A.M.; Letra, A.; Trombone, A.P.; Faveri, M.; Silva, R.M.; Garlet, G.P. Simultaneous analysis of T helper subsets (Th1, Th2, Th9, Th17, Th22, Tfh, Tr1 and Tregs) markers expression in periapical lesions reveals multiple cytokine clusters accountable for lesions activity and inactivity status. J. Appl. Oral Sci. 2014, 22, 336–346. [Google Scholar] [CrossRef]
- Menezes, R.; Garlet, T.P.; Letra, A.; Bramante, C.M.; Campanelli, A.P.; de Cássia Figueira, R.; Sogayar, M.C.; Granjeiro, J.M.; Garlet, G.P. Differential patterns of receptor activator of nuclear factor kappa B ligand/osteoprotegerin expression in human periapical granulomas: Possible association with progressive or stable nature of the lesions. J. Endod. 2008, 34, 932–938. [Google Scholar] [CrossRef]
- Al-Ghurabi, B.H.; Mohssen, S.M. Salivary level of RANKL and OPG in chronic periodontitis. J. Baghdad Coll. Dent. 2015, 27, 189–194. Available online: https://jbcd.uobaghdad.edu.iq/index.php/jbcd/article/view/657 (accessed on 1 August 2024). [CrossRef]
- Lähteenmäki, H.; Pätilä, T.; Pärnänen, C.P.; Räisänen, I.; Tervahartiala, T.; Gupta, S.; Sorsa, T. aMMP-8 point-of-care—Diagnostic methods and treatment modalities in periodontitis and peri-implantitis. Expert Opin. Ther. Targets 2023, 27, 627–637. [Google Scholar] [CrossRef] [PubMed]
- Salinas-Muñoz, M.; Garrido-Flores, M.; Baeza, M.; Huamán-Chipana, P.; García-Sesnich, J.; Bologna, R.; Vernal, R.; Hernández, M. Bone resorptive activity in symptomatic and asymptomatic apical lesions of endodontic origin. Clin. Oral Investig. 2017, 21, 2613–2618. [Google Scholar] [CrossRef]
- Fan, F.; Shi, P.; Liu, M.; Chen, H.; Tu, M.; Lu, W.; Du, M. Lactoferrin preserves bone homeostasis by regulating the RANKL/RANK/OPG pathway of osteoimmunology. Food Funct. 2018, 9, 2653–2660. [Google Scholar] [CrossRef] [PubMed]
- Popat, R.P.; Bhavsar, N.V.; Popat, P.R. Gingival crevicular fluid levels of Matrix Metalloproteinase-1 (MMP-1) and Tissue Inhibitor of Metalloproteinase-1 (TIMP-1) in periodontal health and disease. Singap. Dent. J. 2014, 35, 59–64. [Google Scholar] [CrossRef]
- Sojod, B.; Chateau, D.; Mueller, C.G.; Babajko, S.; Berdal, A.; Lézot, F.; Castaneda, B. RANK/RANKL/OPG Signalization Implication in Periodontitis: New Evidence from a RANK Transgenic Mouse Model. Front. Physiol. 2017, 8, 338. [Google Scholar] [CrossRef]
- Baeza, M.; Garrido, M.; Hernández-Ríos, P.; Dezerega, A.; García-Sesnich, J.; Strauss, F.; Aitken, J.P.; Lesaffre, E.; Vanbelle, S.; Gamonal, J.; et al. Diagnostic accuracy for apical and chronic periodontitis biomarkers in gingival crevicular fluid: An exploratory study. J. Clin. Periodontol. 2016, 43, 34–45. [Google Scholar] [CrossRef] [PubMed]
- Fayad, M.; Nair, M.; Levin, M.; Benavides, E.; Rubinstein, R.; Barghan, S. Special Committee to Revise the Joint AAE/AAOMR Position Statement on use of CBCT in Endodontics. AAE and AAOMR Joint Position Statement: Use of Cone Beam Computed Tomography in Endodontics 2015 Update. Oral Surg. Oral Med. Oral Pathol. Oral Radiol. 2015, 120, 508–512. [Google Scholar] [CrossRef]
- Giannopoulou, C.; Cappuyns, I.; Cancela, J.; Cionca, N.; Mombelli, A. Effect of photodynamic therapy, diode laser, and deep scaling on cytokine and acute-phase protein levels in gingival crevicular fluid of residual periodontal pockets. J. Periodontol. 2012, 83, 1018–1027. [Google Scholar] [CrossRef]
- Preianò, M.; Falcone, D.; Maggisano, G.; Montalcini, T.; Navarra, M.; Paduano, S.; Savino, R.; Terracciano, R. Assessment of pre-analytical and analytical variables affecting peptidome profiling of gingival crevicular fluid by MALDI-TOF mass spectrometry. Clin. Chim. Acta Int. J. Clin. Chem. 2014, 437, 120–128. [Google Scholar] [CrossRef]
- Bogdanovska, L.; Popovska, M.; Dimitrovska, A.; Petkovska, R. Development and validation of RP HPLC method for determination of betamethasone dipropionate in gingival crevicular fluid. Acta Pharm. 2013, 63, 419–426. [Google Scholar] [CrossRef] [PubMed]
- Ali, A.; Saliem, S.; Abdulkareem, A.; Radhi, H.; Gul, S. Evaluation of the efficacy of lycopene gel compared with minocycline hydrochloride microspheres as an adjunct to nonsurgical periodontal treatment: A randomized clinical trial. J. Dent. Sci. 2021, 16, 691–699. [Google Scholar] [CrossRef]
- Wassall, R.R.; Preshaw, P.M. Clinical and technical considerations in the analysis of gingival crevicular fluid. Periodontology 2000 2016, 70, 65–79. [Google Scholar] [CrossRef] [PubMed]
- Sharma, S.K.; Mudgal, S.K.; Thakur, K.; Gaur, R. How to calculate sample size for observational and experimental nursing research studies? Natl. J. Physiol. Pharm. Pharmacol. 2020, 10, 1–8. [Google Scholar] [CrossRef]
- Griffiths, G.S. Formation, collection and significance of gingival crevice fluid. Periodontology 2000, 31, 32–42. [Google Scholar] [CrossRef]
- Khuda, F.; Anuar, N.N.M.; Baharin, B.; Nasruddin, N.S. A mini review on the associations of matrix metalloproteinases (MMPs) -1, -8, -13 with periodontal disease. AIMS Mol. Sci. 2021, 8, 13–31. [Google Scholar] [CrossRef]
- Laronha, H.; Caldeira, J. Structure and Function of Human Matrix Metalloproteinases. Cells 2020, 9, 1076. [Google Scholar] [CrossRef]
- Reddy, N.R.; Deepa, A.; Madhu Babu, D.S.; Chandra, N.S.; Subba Reddy, C.V.; Kumar, A.K. Estimation of tissue inhibitor of matrix metalloproteinase-1 levels in gingival crevicular fluid in periodontal health, disease and after treatment. J. Indian Soc. Periodontol. 2014, 18, 301–305. [Google Scholar] [CrossRef] [PubMed]
- Hernández, M.; Martínez, B.; Tejerina, J.M.; Valenzuela, M.A.; Gamonal, J. MMP-13 and TIMP-1 determinations in progressive chronic periodontitis. J. Clin. Periodontol. 2007, 34, 729–735. [Google Scholar] [CrossRef]
- Tüter, G.; Kurtiş, B.; Serdar, M.; Yücel, A.; Ayhan, E.; Karaduman, B.; Ozcan, G. Effects of phase I periodontal treatment on gingival crevicular fluid levels of matrix metalloproteinase-3 and tissue inhibitor of metalloproteinase-1. J. Clin. Periodontol. 2005, 32, 1011–1015. [Google Scholar] [CrossRef]
- Georgiou, A.C.; Crielaard, W.; Armenis, I.; de Vries, R.; van der Waal, S.V. Apical Periodontitis Is Associated with Elevated Concentrations of Inflammatory Mediators in Peripheral Blood: A Systematic Review and Meta-analysis. J. Endod. 2019, 45, 1279–1295.e3. [Google Scholar] [CrossRef] [PubMed]


| Variable | Mean ± SD | Number (n) | Percent (%) | |
|---|---|---|---|---|
| Sex | Male | 30 | 50 | |
| Female | 30 | 50 | ||
| Age Groups (year) | 20–29 | 26.47 ± 2.096 | 15 | 25 |
| 30–39 | 35.28 ± 2.598 | 23 | 38 | |
| 40–49 | 43.27 ± 3.006 | 22 | 37 |
| SAP | AAP | ||||||||||
|---|---|---|---|---|---|---|---|---|---|---|---|
| MMP8 | TEMP1 | RANK | RANKL | OPG | MMP8 | TEMP1 | RANK | RANKL | OPG | ||
| MMP8 | R | 0.48 ** | 0.79 ** | 0.82 ** | 0.45 ** | 0.22 * | 0.74 ** | 0.79 ** | 0.28 ** | ||
| p value | 0.0001 | 0.0001 | 0.0001 | 0.0001 | 0.037 | 0.0001 | 0.0001 | 0.007 | |||
| TEMP1 | R | 0.38 ** | 0.48 ** | 0.83 ** | 0.202 | 0.26 * | 0.84 ** | ||||
| p value | 0.0001 | 0.0001 | 0.0001 | 0.58 | 0.013 | 0.0001 | |||||
| RANK | R | 0.82 ** | 0.46 ** | 0.81 ** | 0.3 ** | ||||||
| p value | 0.0001 | 0.0001 | 0.0001 | 0.005 | |||||||
| RANKL | R | 0.49 ** | 0.33 ** | ||||||||
| p value | 0.0001 | 0.002 | |||||||||
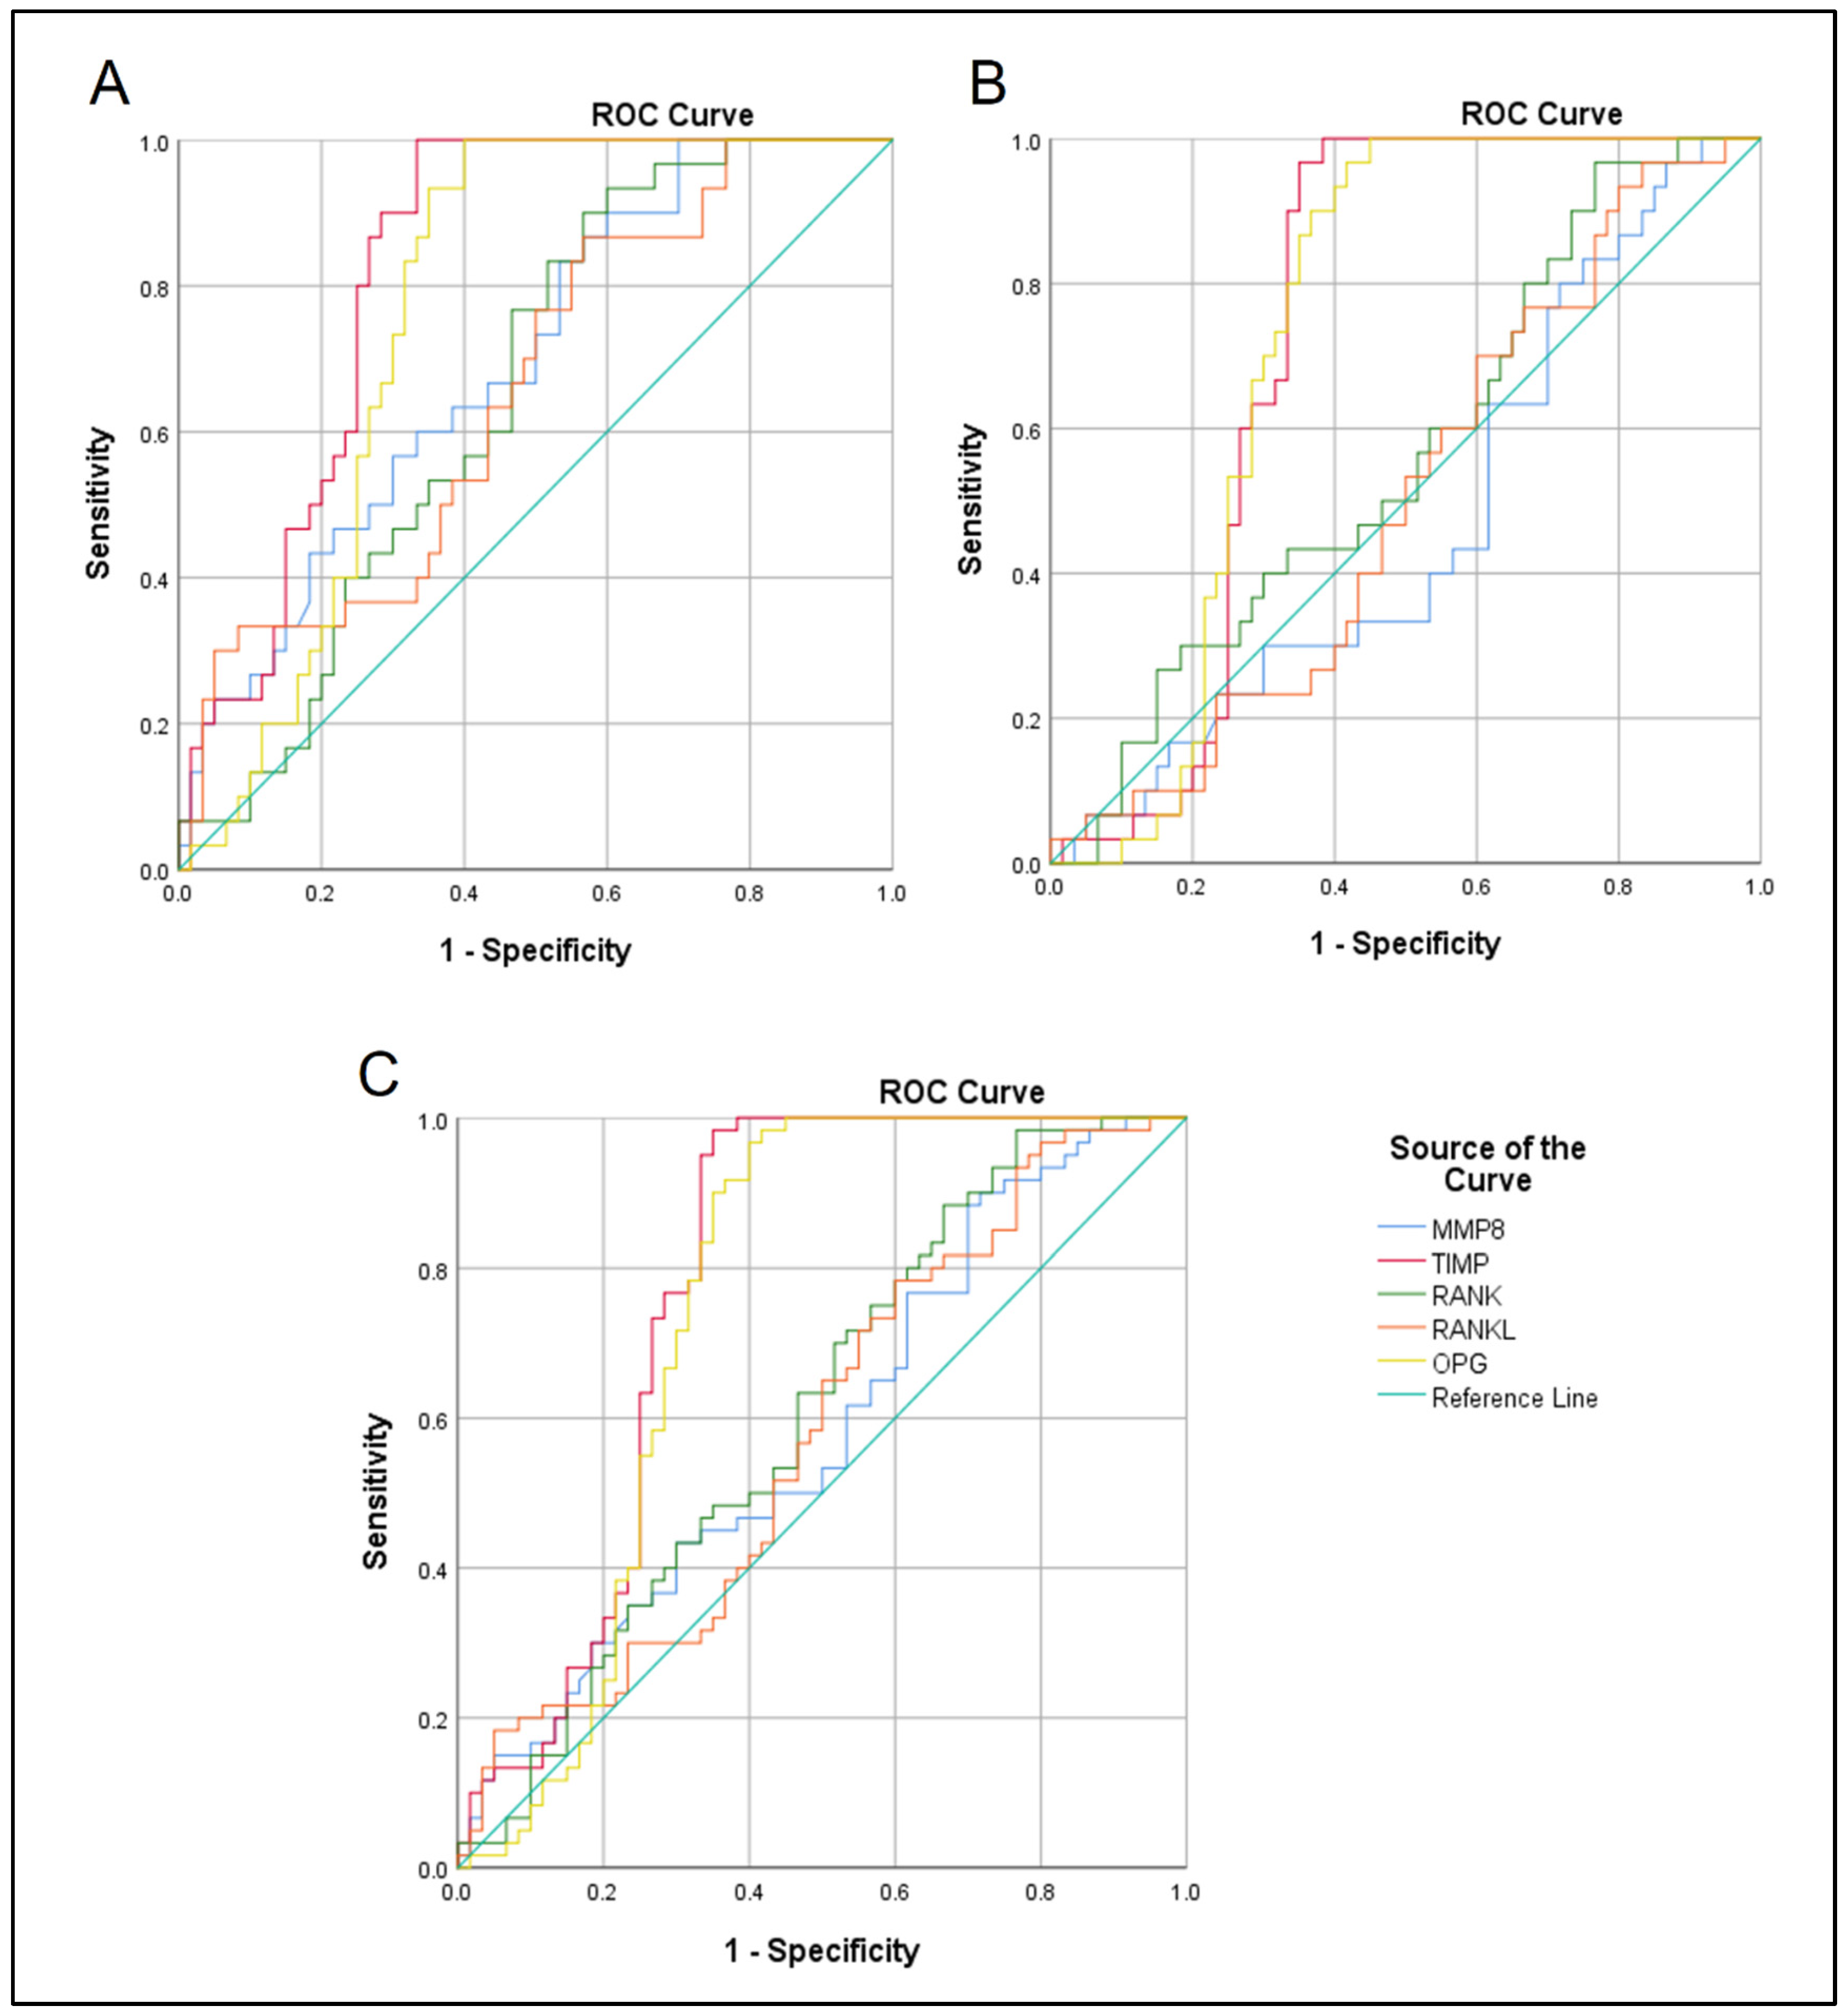
| Groups Comparison | Variables | Threshold µg/mL | Sensitivity%/Specificity% | AUC | 95% CI | p Value |
|---|---|---|---|---|---|---|
| SAP vs. control | MMP8 | 0.053 | 60/67 | 0.694 | 0.58–0.8 | 0.003 |
| TIMP1 | 8.64 | 80/75 | 0.824 | 0.74–0.9 | 0.0001 | |
| RANK | 0.31 | 60/57 | 0.652 | 0.54–0.76 | 0.019 | |
| RANKL | 1.27 | 57/57 | 0.656 | 0.53–0.77 | 0.017 | |
| OPG | 0.066 | 73/70 | 0.763 | 0.66–0.86 | 0.0001 | |
| AAP vs. control | MMP8 | 0.046 | 43/44 | 0.47 | 0.34–0.59 | 0.647 |
| TIMP1 | 7.46 | 66/67 | 0.732 | 0.62–0.83 | 0.0001 | |
| RANK | 0.26 | 56/50 | 0.562 | 0.44–0.68 | 0.338 | |
| RANKL | 1.16 | 53/49 | 0.502 | 0.38–0.62 | 0.973 | |
| OPG | 0.067 | 70/70 | 0.73 | 0.62–0.83 | 0.0001 | |
| SAP vs. AAP | MMP8 | 0.049 | 53/50 | 0.582 | 0.48–0.68 | 0.122 |
| TIMP1 | 7.78 | 75/72 | 0.778 | 0.68–0.86 | 0.0001 | |
| RANK | 0.29 | 53/54 | 0.607 | 0.51–0.71 | 0.043 | |
| RANKL | 1.21 | 56/54 | 0.579 | 0.47–0.68 | 0.136 | |
| OPG | 0.067 | 70/70 | 0.747 | 0.64–0.84 | 0.0001 |
Disclaimer/Publisher’s Note: The statements, opinions and data contained in all publications are solely those of the individual author(s) and contributor(s) and not of MDPI and/or the editor(s). MDPI and/or the editor(s) disclaim responsibility for any injury to people or property resulting from any ideas, methods, instructions or products referred to in the content. |
© 2024 by the authors. Licensee MDPI, Basel, Switzerland. This article is an open access article distributed under the terms and conditions of the Creative Commons Attribution (CC BY) license (https://creativecommons.org/licenses/by/4.0/).
Share and Cite
Abdulhadi, Z.T.; Mahdee, A.F.; Gul, S.S. Accuracy of Gingival Crevicular Fluid Biomarkers of MMP8, TIMP1, RANK, RANKL, and OPG in Differentiating Symptomatic and Asymptomatic Apical Periodontitis. Diagnostics 2024, 14, 1872. https://doi.org/10.3390/diagnostics14171872
Abdulhadi ZT, Mahdee AF, Gul SS. Accuracy of Gingival Crevicular Fluid Biomarkers of MMP8, TIMP1, RANK, RANKL, and OPG in Differentiating Symptomatic and Asymptomatic Apical Periodontitis. Diagnostics. 2024; 14(17):1872. https://doi.org/10.3390/diagnostics14171872
Chicago/Turabian StyleAbdulhadi, Zeena Tariq, Anas Falah Mahdee, and Sarhang Sarwat Gul. 2024. "Accuracy of Gingival Crevicular Fluid Biomarkers of MMP8, TIMP1, RANK, RANKL, and OPG in Differentiating Symptomatic and Asymptomatic Apical Periodontitis" Diagnostics 14, no. 17: 1872. https://doi.org/10.3390/diagnostics14171872