Abstract
Since the beginning of the COVID-19 pandemic, scientists have struggled significantly to understand the complexity of COVID-19 pathophysiology. COVID-19 has demonstrated a notoriously unpredictable clinical course. This unpredictability constituted a significant obstacle to clinicians in predicting the disease course among COVID-19 patients, more specifically, in predicting who would develop severe cases and possibly die from the infection. This brief report aims to assess the diagnostic value of using a complete blood count (CBC) and applying high-dimensional analysis, i.e., principal component analysis (PCA), on it to differentiate between patients with mild and severe COVID-19 infection. The data of 855 patients were retrieved from multiple centres in Saudi Arabia. Descriptive statistics, such as counts, percentages, and medians (interquartile ranges) were used to describe patients’ characteristics and CBC parameters. Analytical statistics, such as the Mann–Whitney U test, were used to compare between survivors and non-survivors. PCA was applied using the CBC parameters, and the results were compared between survivors and non-survivors. Patients in this study had a median age of 41, with an almost equal ratio of men to women. Most participants were Saudis, and non-survivors were 13.22% of the total cohort. The median values of all CBC indices were within reference ranges; however, some statistically significant differences were observed between survivors and non-survivors. Non-survivors had lower hemoglobin levels and lower hematocrit, lymphocyte, and eosinophil counts but higher WBC and neutrophil counts compared to survivors. PCA on the CBC results of survivors yielded a significantly different profile than non-survivors, indicating the possibility of its use in the context of COVID-19. The diagnostic value of CBC in the clinical management of COVID-19 should be utilized in clinical guidelines for managing COVID-19 cases.
Keywords:
CBC; COVID-19; diagnostics; mortality; pathophysiology; principal component analysis; Saudi Arabia 1. Introduction
The recent novel coronavirus disease 2019 (COVID-19) pandemic has hit the world by storm [1]. Given its morbidity and mortality, the pandemic prompted countries to take progressive public measures, which seemed to limit its impact on these societies [2,3,4,5,6,7,8].
The pathogenesis of COVID-19 was initially thought to be respiratory [9]. However, more emerging evidence describes its extrapulmonary course, including immunological and hematological abnormalities [10,11]. The more scientists uncover aspects of COVID-19 pathophysiology, the more we can determine factors contributing to and possibly predicting COVID-19 severity and subsequent mortality.
High-dimensional analysis, e.g., principal component analysis (PCA), is an analytical tool used to visualize large datasets and flatten them to demonstrate the linkage between the different variables [12,13]. In biological sciences, it could be used on large-scale genome-wide data [14], which allowed for its use in the context of COVID-19 on genomic sequence studies [15], as well as for immunological single-cell profiling and analysis [16,17].
In this study, the value of PCA is assessed in differentiating the pathophysiology of COVID-19 patients, specifically, between survivors and non-survivors.
2. Materials and Methods
2.1. Study Design and Setting
This is a retrospective study of patients with COVID-19 across three hospitals in Saudi Arabia. We included in the study 855 patients whose hospital admission was based on a suspicion of COVID-19. A nasopharyngeal swab was tested using quantitative polymerase chain reaction (qPCR) to confirm the diagnosis of COVID-19. Individuals partaking in this research were hospitalized from June 2020 to December 2021 according to the Saudi Ministry of Health guidelines for admitting COVID-19 cases [18]. Briefly, these hospitalized individuals had one of the following signs: clinically proven pneumonia, age over 65, low oxygen saturation below 94% on a pulse oximeter while not using supplemental oxygen, acute respiratory distress syndrome, chronic lung or renal disease, history of other health conditions, or severe obesity with a BMI of 40 or higher. This study included patients who were admitted and diagnosed with positive/confirmed COVID-19. Patients with negative COVID-19 PCR tests or unconfirmed/missing information were excluded from this study.
The treatment of these hospitalized patients was uniform across all three hospitals, adhering to the national COVID-19 management protocol set by the Saudi MoH for Patients Suspected of/Confirmed with COVID-19 [18]. Intensive care unit (ICU) admission was reserved for those patients with suspicion of/confirmed severe COVID-19, based on the Saudi MoH Protocol for Patients Suspected of/Confirmed with Severe COVID-19 [18]. Clinically, those patients with severe COVID-19 showed signs of pneumonia, e.g., fever, cough, shortness of breath, in addition to one of the following conditions: breathing rate exceeding 30 breaths per minute, oxygen saturation below 93% on a pulse oximeter while breathing regular air, or experiencing severe respiratory distress. Patients were divided into two categories based on the outcome of their admission: either survivors, defined as those who recovered from COVID-19 infections and were eventually discharged from the hospital, and non-survivors, i.e., those who died due to COVID-19 infection.
Each patient underwent a range of lab tests, with some being repeated during their time in the hospital. For this study, only the initial readings from their investigations were included to maintain consistency in the parameters being compared, which were measured upon admission. Patients’ venous blood samples were gathered for analysis as a component of their hospital care. Venous blood samples underwent complete blood count testing with the Mindray BC-3200 Auto Hematology Analyzer manufactured by Shenzhen Mindray Bio-Medical Electronics Co. in Shenzhen, China. The gathered data were derived from a CBC test, which covers RBC count, hemoglobin level, MCV, MCH, platelet count, WBC count, neutrophil count, lymphocyte count, monocyte count, and eosinophil count.
2.2. Statistical Analysis
Gender and nationality were depicted using absolute values and percentages for categorical data representation. Descriptive statistics were utilized to represent numerical data, like red cell blood count and platelet count, based on their distribution, as determined by the Shapiro–Wilk test. Parametric data were described using means and standard deviations, whereas nonparametric data were described using medians and interquartile ranges. Comparison between two parametric and nonparametric groups were compared using either Student’s t-tests or Mann–Whitney U tests, respectively. Statistical significance was denoted at a p value of less than 0.05. Exploratory principal component analysis (PCA) was performed using all the parameters generated from a standard CBC test, namely: RBC count, MCV, MCH, platelet count, WBC count, neutrophil count, lymphocyte count, monocyte count, and eosinophil count. PCA was performed separately on parameters from survivors and non-survivors [15,19]. The two principal components (PCs) with the highest percentages of variance (of 60% variance) are reported and described in the results section. Patients with more than 10% missing data were excluded from the analysis [14]. Data analysis and figure generation were carried out using GraphPad Prism Version 10.2.2 for Windows.
2.3. Ethical Considerations
This study’s collected data did not include personal or sensitive patient information. Measures were taken to preserve and safeguard the collected information via storage on a password-protected drive backed up on a password-protected server. This study was conducted following the declaration of Helsinki and ethically approved by the Taibah University College of Medicine Research Ethics Committee no. TU-21-010. Given the retrospective nature of this study, patients’ consent was waived by the approving IRB ethics committee.
3. Results
A total of 855 patients were included in this study. Their median age was 41, with a calculated interquartile range between 27 and 57 years old. In other words, most of the study participants are adults who are not elderly.
The study participants had an almost equal gender distribution, with 426 males and 429 females. Almost 65% of the study participants were Saudis (n = 550), whereas the remainder were non-Saudis (n = 305). Of the study participants, over 13% of the participants died due to COVID-19 (n = 113), whereas the remaining study participants survived the infection (n = 742).
The participants’ hematological parameters were investigated using a CBC, and their blood profiles were demonstrated. The median value of the participants’ red blood cell (RBC) count was 4.74 (4.35–5.13) × 106/mL, falling within normal ranges for males and females. Similar to the RBC count, the median hemoglobin value was 13.40 (11.99–14.60) g/dL, falling within the normal range for males and females. Other parameters, such as MCV, MCH, platelet count, WBC count, and differential leukocyte count, were also evaluated. Interestingly, they were all within the reference range for the entire cohort. The differences in the CBC parameters between survivors and non-survivors are summarized in Table 1.

Table 1.
Comparison of patients’ lab investigations between survivors and non-survivors.
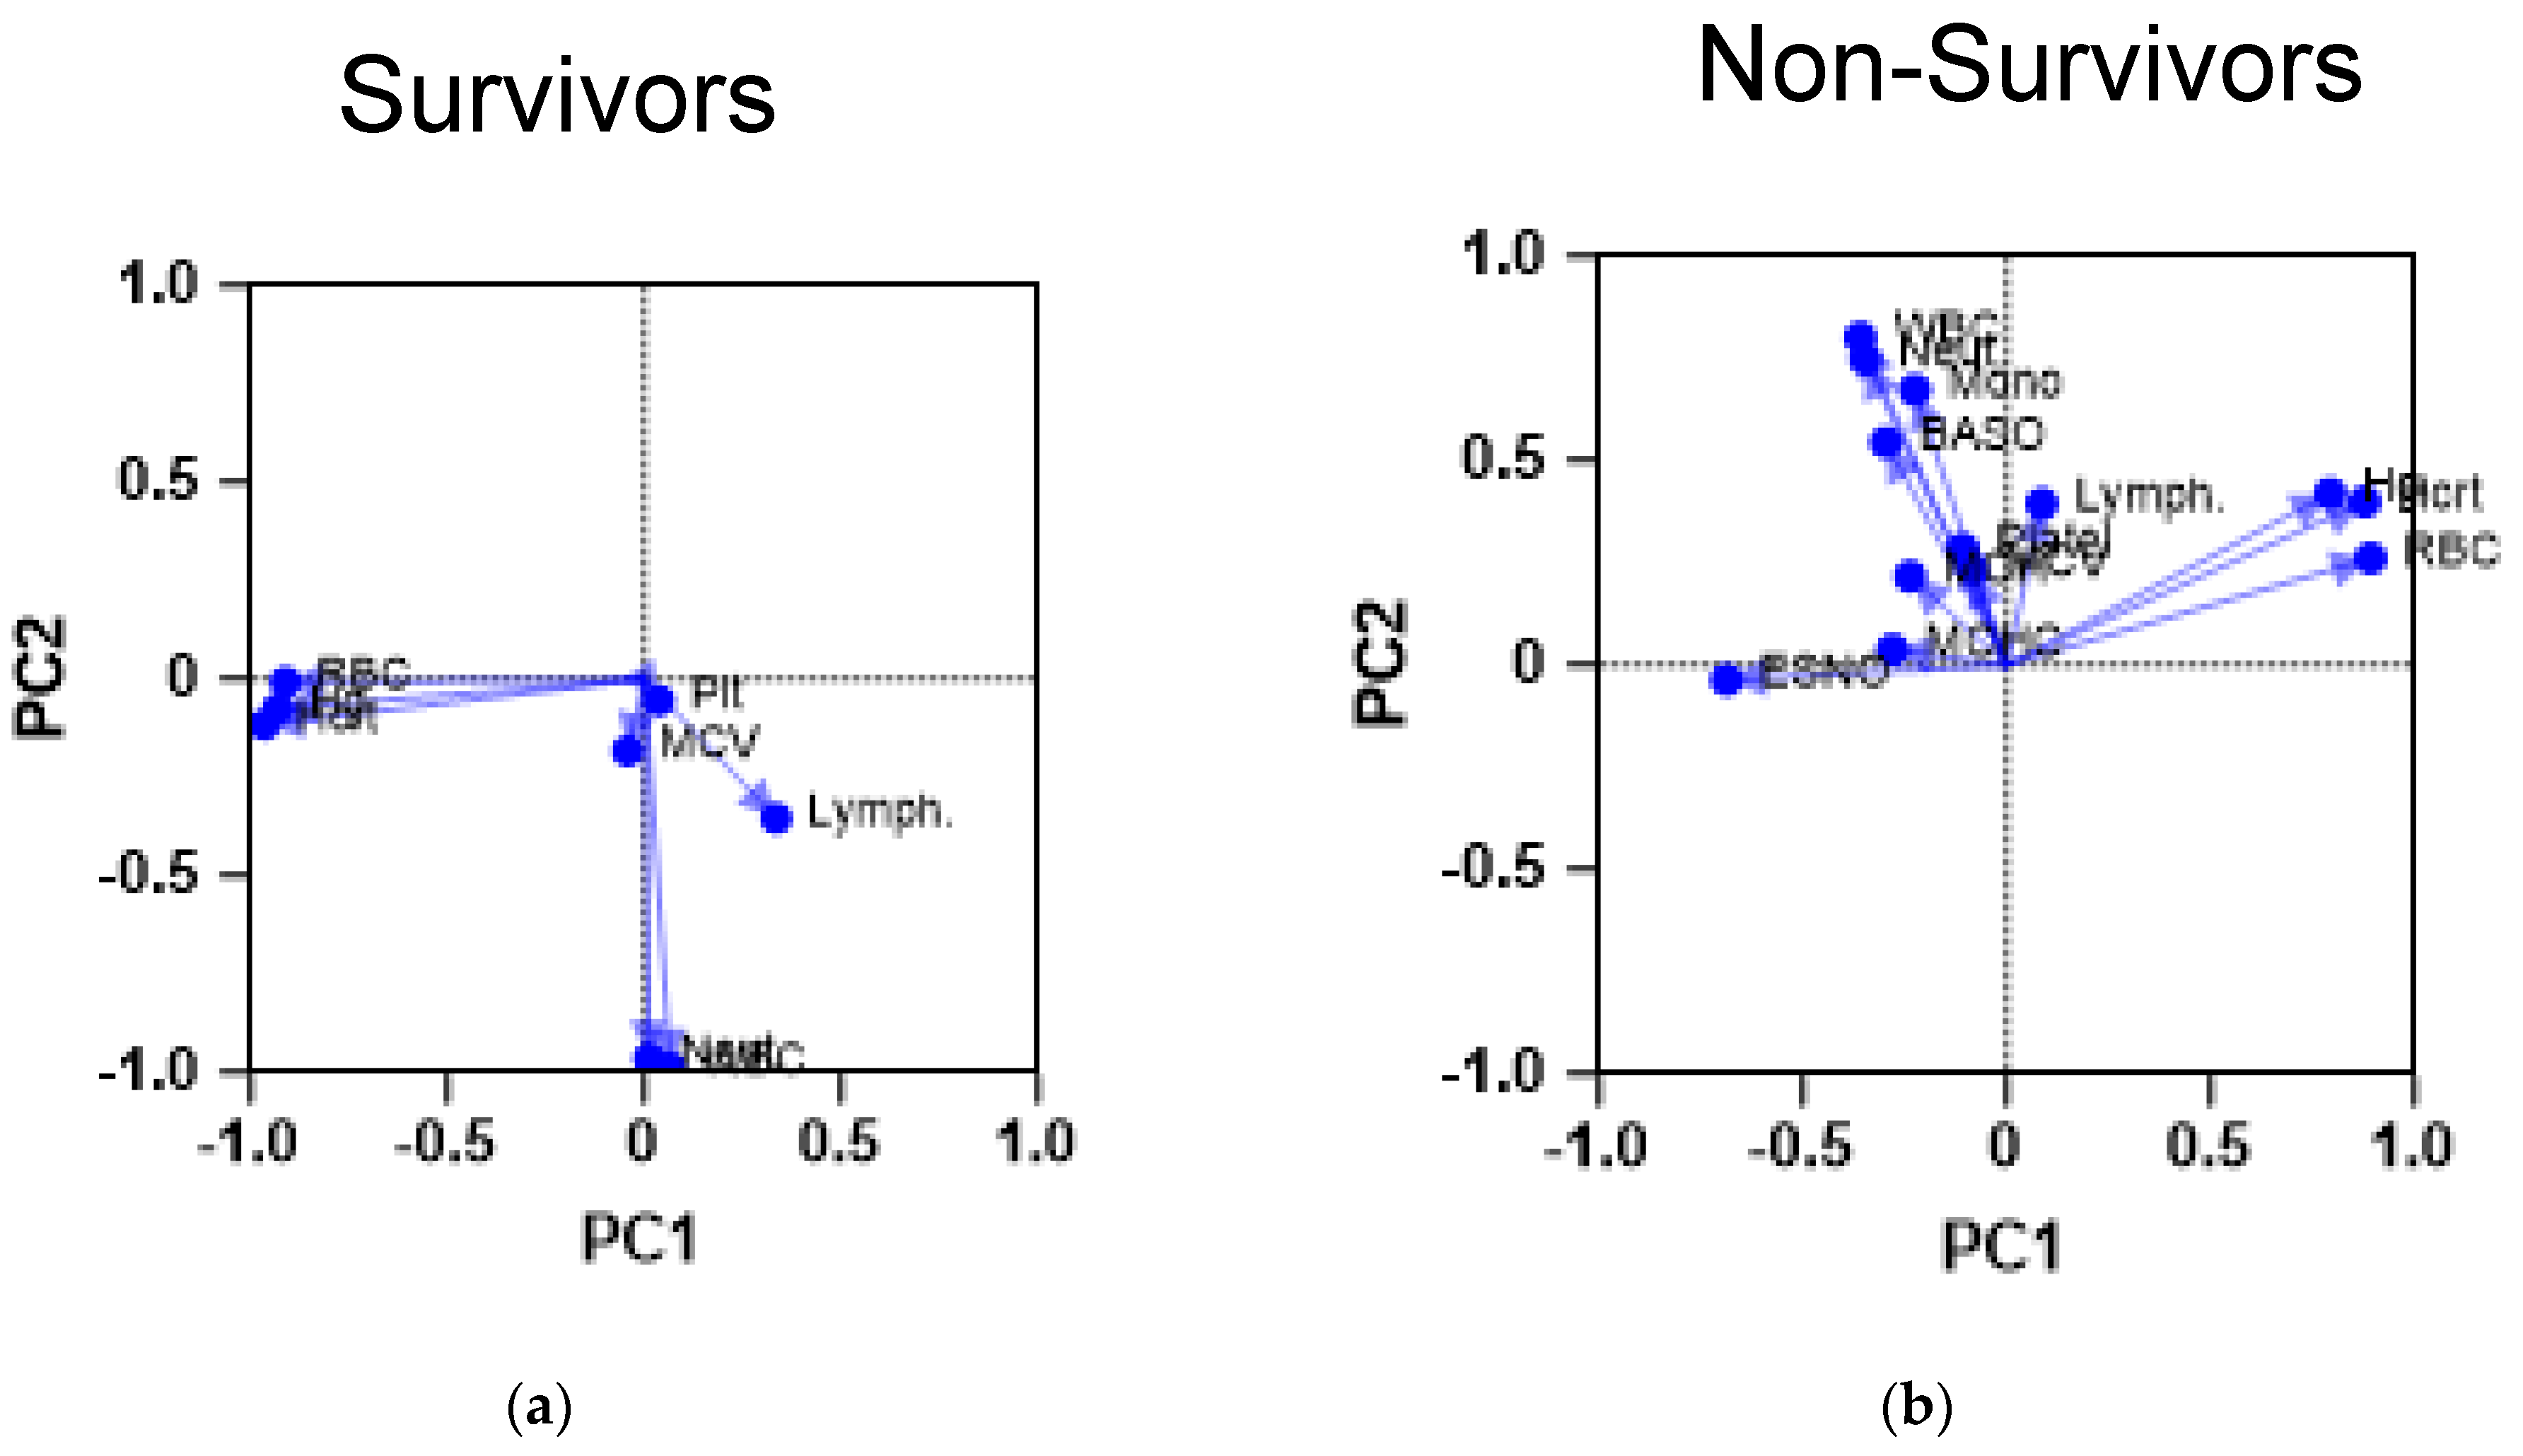
The next step was to examine the CBC results of survivors and non-survivors using PCA to assess whether they would yield similar results. Expectedly, the PCA analysis of both cohorts yielded different CBC profiles, as shown in Figure 1.
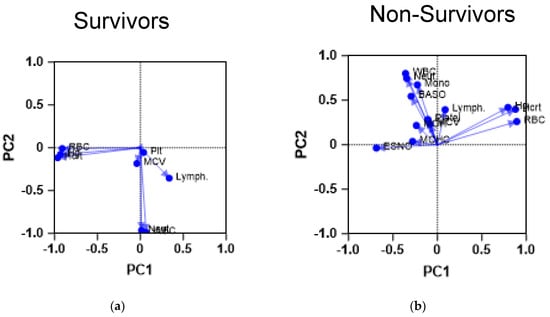
Figure 1.
Principal component analysis of CBC parameters of the study cohorts. The figures demonstrate the results of a PCA performed on the CBC parameters of the patients. The scatter plots demonstrate the PCA profile of both (a) survivors (n = 742) and (b) non-survivors (n = 113). The first principal component (PC1) is plotted on the x-axis and accounts for 35% of the total variance, while the second principal component (PC2) is plotted on the y-axis, explaining 25% of the variance. Baso: basophil count; ESNO: eosinophil count; Hcrt: hemotocrit level; Hg: hemoglobin level; Lymph: lymphocyte count; MCV: mean corpuscular volume; Mono: monocyte count; Neut: neutrophil count; Plt: platelet count; RBC: red blood cell count; WBC: white blood cell count.
Survivors demonstrate a CBC profile, which shows most of the RBC parameters compiled together, whereas platelet count and lymphocyte count seem to be compiled close to each other. Such proximity may indicate the importance of the previously described indicator, the systematic immunoinflammatory index. On the other hand, patients with severe COVID-19 demonstrated a different profile in which white blood cell parameters were separate from the red blood cell indices, except for lymphocyte counts, which were closer to platelet counts. This PCA finding could point to a link between these parameters in the context of COVID-19.
4. Discussion
COVID-19 infection and, in particular, its pathophysiology, has posed a dilemma to the scientific community. However, the sheer number of studies on this subject, using a wide range of assessment tools, from clinical observations to very sophisticated diagnostic techniques, has started to untangle its elements.
Early reports described SARS-CoV-2 as a respiratory virus affecting the lung alveoli and gaining entry into them through its spike protein [21,22]. Subsequently, this infection, due to its novel nature and the lack of previous exposure to vaccination, will cause severe acute respiratory distress syndrome, primarily due to diffuse alveolar damage leading to severe deterioration in respiratory function [23,24]. Nevertheless, COVID-19 infections seemed to extend beyond the lungs and carry extrapulmonary features, which have been described and used clinically.
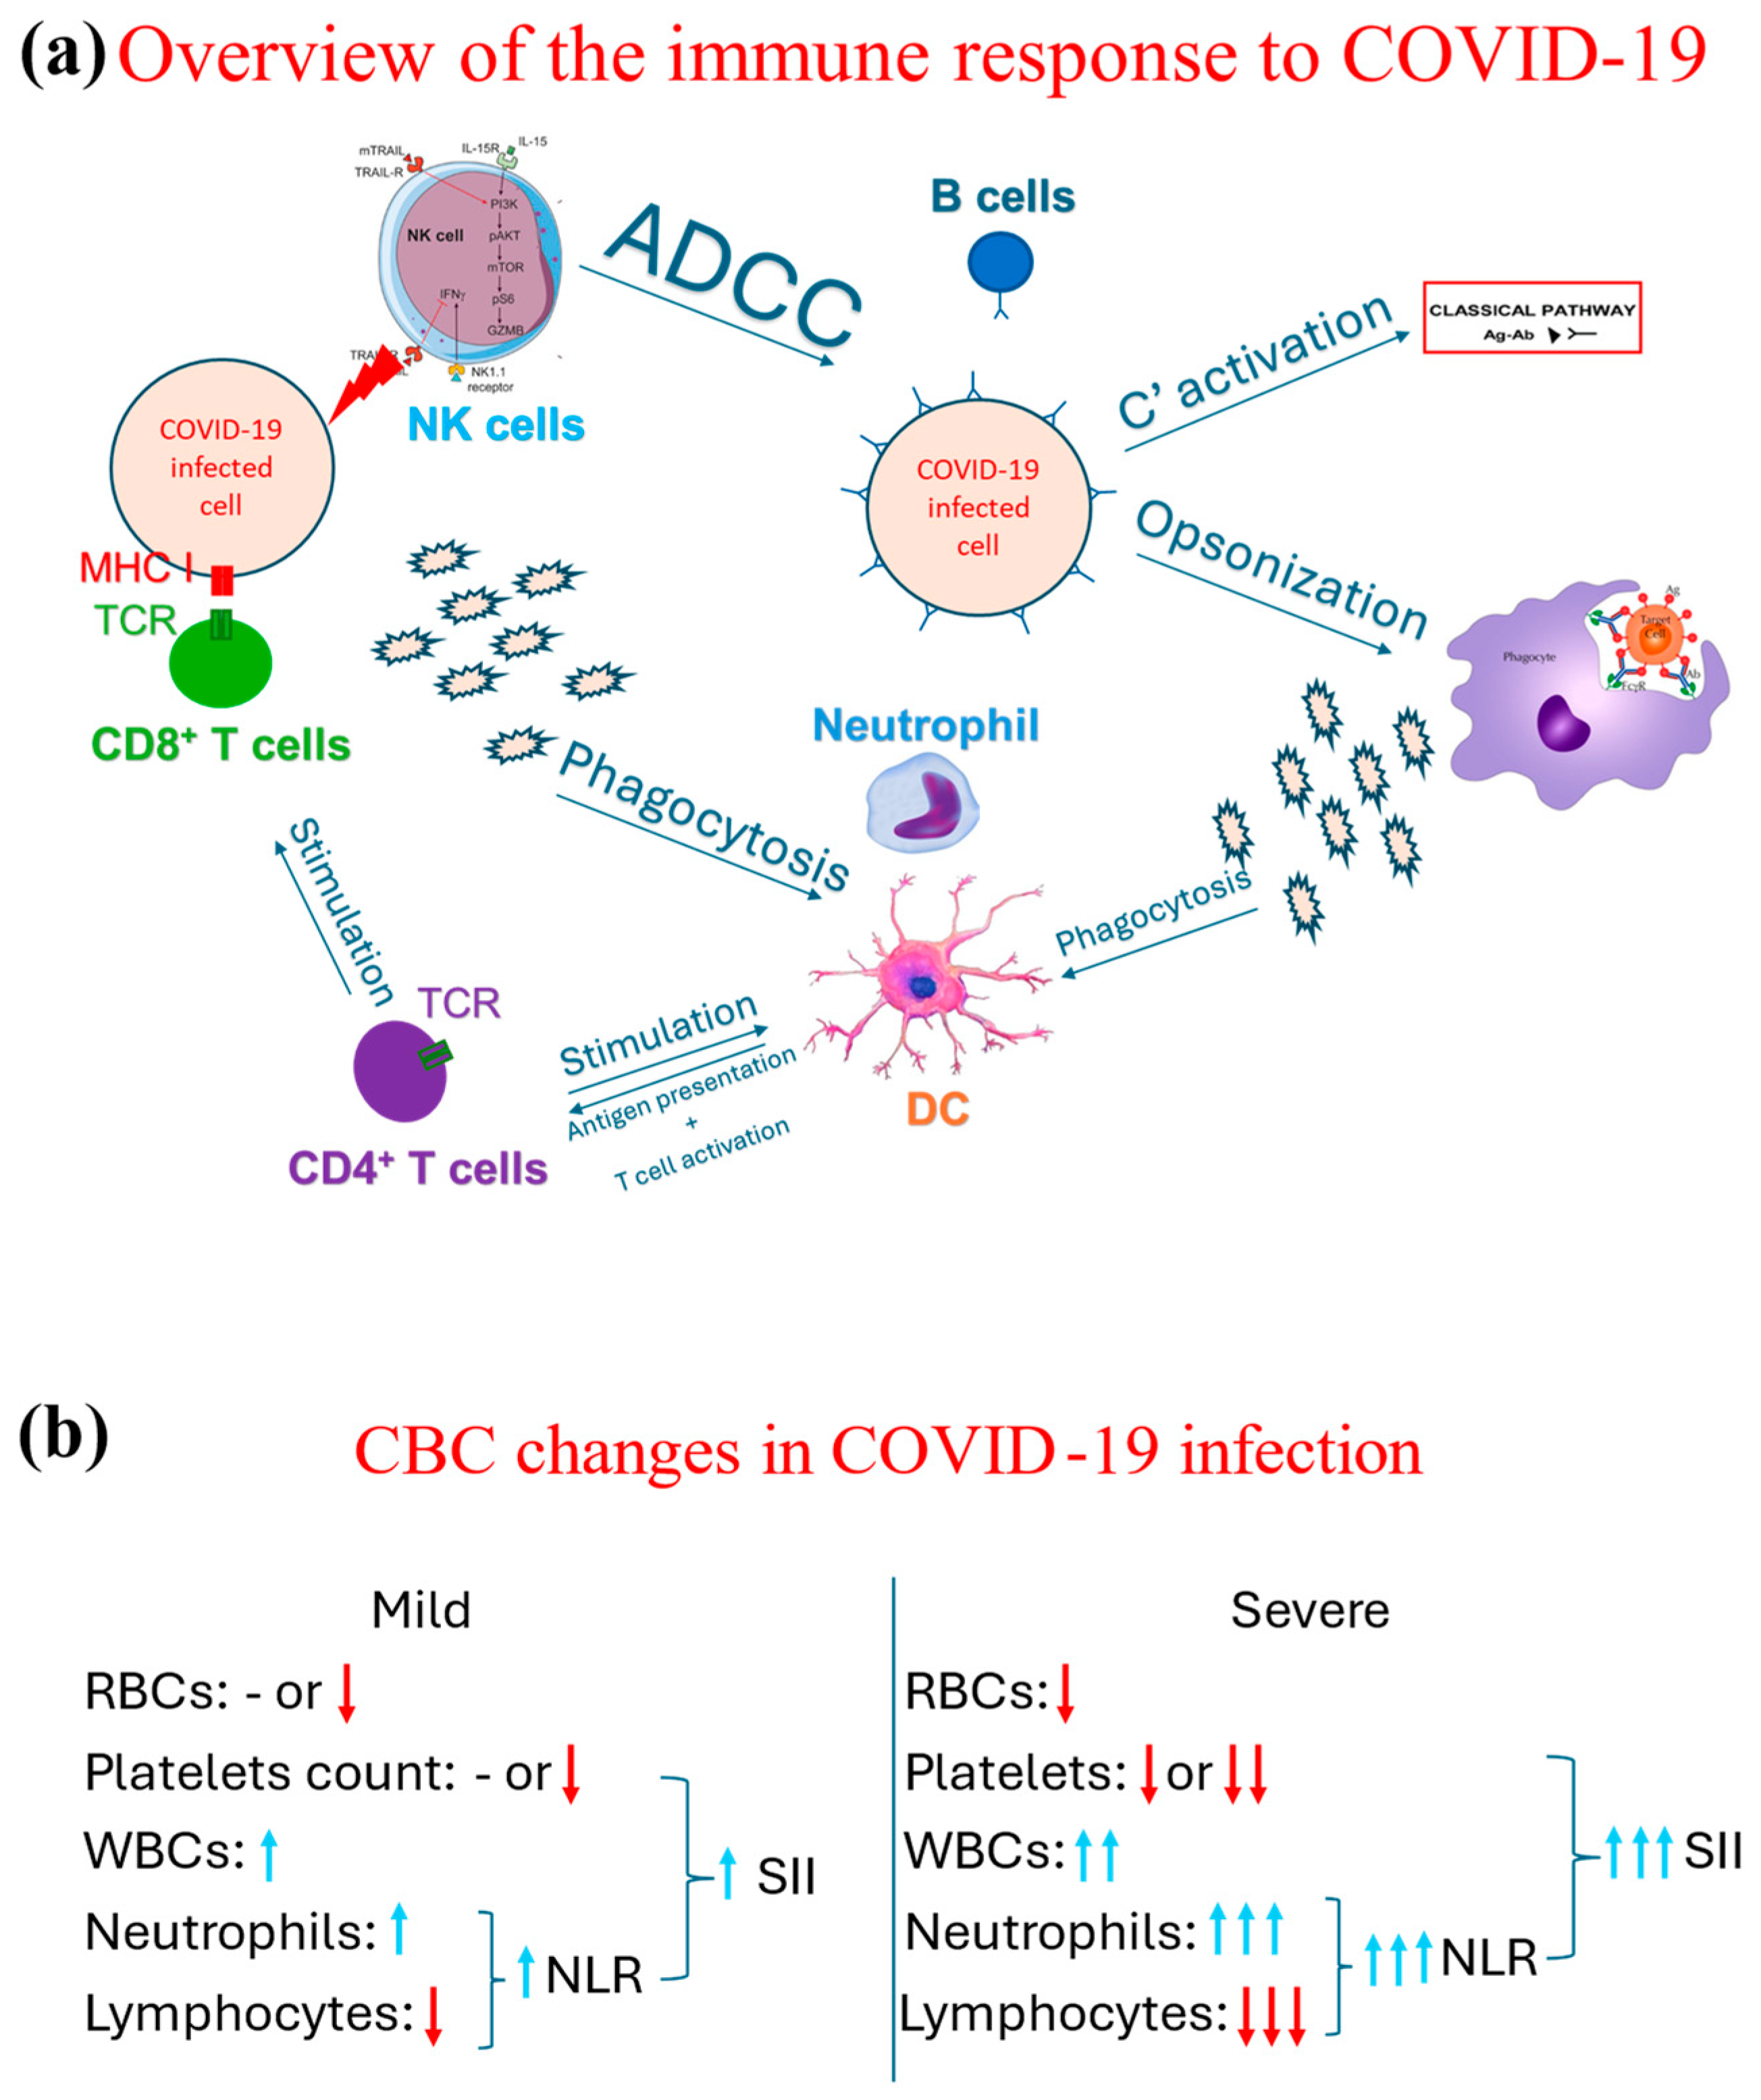
Several hematological changes have been described as a part of the COVID-19 pathophysiology. The COVID-19 infection drives a proinflammatory response in which both arms of the immune system, innate and adaptive, are involved, as demonstrated in Figure 2a. As part of the initial, i.e., innate, immune response, neutrophils are one of the earliest cells to respond [25], increasing their count. Such an increase directly correlates with the case severity; i.e., the more severe the case is, the more that the neutrophil count increases [26,27]. Neutrophils and other phagocytes phagocytose the virus, breaking it into smaller antigens. These smaller antigens are then released into the circulation and taken up by dendritic cells to present them to helper CD4 T cells. The complement system is also involved in the immune response to COVID-19 [28,29], even though it is suggested that the complement system may lead to hypercoagulability and collateral damage to other non-respiratory organs [30].
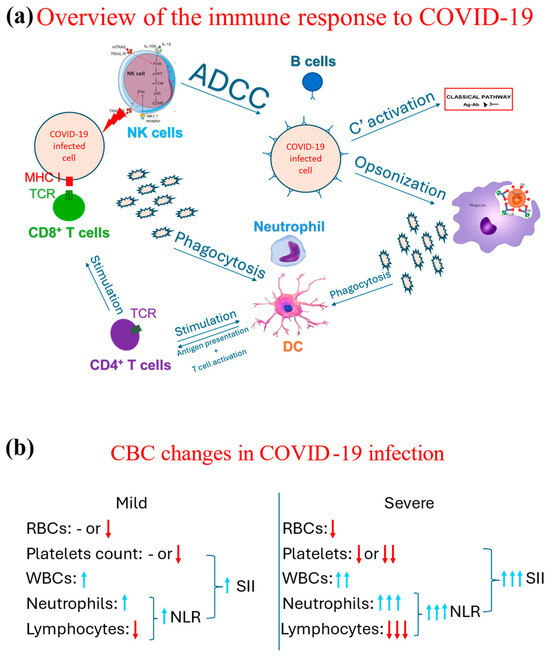
Figure 2.
Schematic representation of overview of the immunological response to COVID-19 and the associated changes observed in a CBC in cases of COVID-19. (a) Demonstrates an overview of the immune response, both the innate (through phagocytes, NK cells, and complement system through its classical pathway triggered by the antigen-antibody complext) and adaptive immune response (T and B cells). (b) Contrasts the changes associated with the CBC indices between mild and severe COVID-19 cases, in which blue arrows mean increase and red arrow refer to a decrease, while the number of arrows highlight the degree of such an increase or decrease. Ab: Antibody, ADCC: antibody-dependent cytotoxicity, Ag: Antigen, C’: complement, DC: dendritic cells, MHC: major histocompatibility complex receptor, NK: natural killer, NLR: neutrophil-to-lymphocyte ratio; RBC: red blood cell; SII: systemic immunoinflammatory index; TCR: T cell receptor, WBC: white blood cell.
Both humoral (antibody-mediated) and cellular (T cell-mediated) responses are involved in tackling COVID-19 infection [31,32,33]. However, it was noted that overall lymphocytic count seemed to decrease along with the severe cases; i.e., the more severe the case, the lower the lymphocytic count is [34,35]. This reduction is part of an immunological exhaustion observed in the context of COVID-19 [36,37].
The continuous effort of researchers and the replicability of these findings across populations has prompted clinicians and scientists to propose neutrophil-to-lymphocyte ratio (NLR) as a predictor of COVID-19 severity. NLR is calculated by dividing the absolute counts of neutrophils by the absolute count of lymphocytes. Hence, the higher the NLR is (by the increase in neutrophil count and further reduction of lymphocyte count), the more likely it is that the patient is suffering from severe COVID-19 [27]. NLR was subsequently considered as an indirect mortality predictor [38,39,40].
Many proinflammatory cytokines are released as part of the immunological response against COVID-19, creating a toxic milieu for other hematological cells [41,42]. For example, the proinflammatory environment could lead to an autoreactive hemolytic response targeting red blood cells, subsequently causing anemia [43,44]. Furthermore, platelets are also involved in the pathogenesis of COVID-19. Their involvement was proposed to be an activation leading to thrombosis and coagulation abnormalities [45] or being destroyed by autoantibodies secondary to SARS-CoV-2 infection [46]. Based on the multicellular involvement in the pathophysiology of COVID-19, it was no surprise that more indicators were developed, such as the systematic immunoinflammatory index (SII) [47,48]. This indicator is calculated based on the NLR and platelet count and is used to predict COVID-19 severity and mortality [20,49,50]. These changes are summarized in Figure 2b.
The use of PCA in the context of COVID-19 has been previously described, mainly in the context of genomic studies [15]. Subsequently, it has been used to cluster COVID-19 patients into categories based on multiple variables, including age, hematological indices, and other biological markers [51]. However, these previously reported usages of PCA shed light on its value in the context of large datasets generated from investigations that may not be widely available. This brief report is the first to report the use of PCA on parameters generated from a CBC test, a tool that is rapid, inexpensive, and widely available [52]. The use of PCA could demonstrate separate profiles for survivors and non-survivors, in line with previous studies [51,53]. In fact, the PCA has the capability to dissect the complexity of COVID-19 pathophysiology, demonstrated in Figure 2, and, rather, shows the interacting elements (cells) on an individualized level. Such an approach could further strengthen the role of advanced machine learning techniques in medicine [54], which is a landmark of this era. This brief report adds to the existing literature the suggestion that modern approaches, i.e., PCA, could indeed be incorporated into daily medical practice and be applied to other novel emerging conditions such as human monkeypox.
While this brief report offers valuable new perspectives to the existing scientific literature, it does have some limitations. Firstly, due to the retrospective cross-sectional nature of this study, it is susceptible to sampling bias [55]. Also, other factors, which are usually found and observed upon clinical examination in the PCA, were not taken into account. These include vital signs (temperature, blood pressure, and oxygen saturation) or symptoms (cough and shortness of breath); these factors may be significant indicators of COVID-19 severity and of subsequently mortality. Finally, this research solely concentrated on values collected and derived from a standard CBC. Nonetheless, the significance of other blood markers, like C-reactive protein (CRP) and interleukin (IL)-6, in forecasting COVID-19 severity and related mortality remains essential [56,57].
5. Conclusions
The pathophysiology of COVID-19 presented a challenge to many worldwide in its interpretation and use in clinical practice. Nevertheless, studies have demonstrated the invaluable importance of indicators such as NLR and SII, derived from a CBC, as practical tools for predicting COVID-19 severity and mortality. The present study further sheds light on the importance of applying PCA on CBC results. This importance is demonstrated in the differential profiles for those who may experience severe COVID-19 compared to milder cases, which is of great clinical significance and could direct the treatment course. Such a finding may be helpful in clinical practice, mainly if automatically generated with each CBC report. It also paves the way for future use in emerging conditions, e.g., in human monkeypox.
Funding
This research received no external funding.
Institutional Review Board Statement
The study was conducted in accordance with the Declaration of Helsinki and approved by the Taibah University College of Medicine Ethics Committee (protocol code TU-21-010).
Informed Consent Statement
Patient consent was waived due to the retrospective nature of the study and because the patients’ anonymity was maintained throughout the duration of the study.
Data Availability Statement
The data presented in this study are available on reasonable request from the corresponding author.
Acknowledgments
The author wishes to express his gratitude to Barah T. Daghistani for her generous assistance and efforts in the data collection.
Conflicts of Interest
The author declares no conflicts of interest.
References
- Guan, W.; Ni, Z.; Hu, Y.; Liang, W.; Ou, C.; He, J.; Liu, L.; Shan, H.; Lei, C.; Hui, D.S.C.; et al. Clinical Characteristics of Coronavirus Disease 2019 in China. N. Engl. J. Med. 2020, 382, 1708–1720. [Google Scholar] [CrossRef] [PubMed]
- Sayed, A.A. The Progressive Public Measures of Saudi Arabia to Tackle COVID-19 and Limit Its Spread. Int. J. Environ. Res. Public Health 2021, 18, 783. [Google Scholar] [CrossRef] [PubMed]
- Sayed, A.A.; Allam, A.A.; Alruwaili, A.K.; Alraey, M.A.; Elsayed, E.M.; Aloraini, G.S. The Use of COVID-19 Surveillance Measures in Detecting Cases of Tuberculosis (TB). Hygiene 2023, 3, 1–11. [Google Scholar] [CrossRef]
- Khatrawi, E.M.; Sayed, A.A. Assessing the Dynamics of COVID-19 Morbidity and Mortality in Response to Mass Vaccination: A Comparative Study Between Saudi Arabia and the United Kingdom. Cureus 2022, 14, e33042. [Google Scholar] [CrossRef] [PubMed]
- Kamerlin, S.C.L.; Kasson, P.M. Managing COVID-19 spread with voluntary public-health measures: Sweden as a case study for pandemic control. Clin. Infect. Dis. 2020, 71, 3174–3181. [Google Scholar] [CrossRef]
- Nussbaumer-Streit, B.; Mayr, V.; Dobrescu, A.I.; Chapman, A.; Persad, E.; Klerings, I.; Wagner, G.; Siebert, U.; Ledinger, D.; Zachariah, C.; et al. Quarantine alone or in combination with other public health measures to control COVID-19: A rapid review. Cochrane Database Syst. Rev. 2020, CD013574. [Google Scholar] [CrossRef]
- Office, C. Face Coverings: When to Wear One and How to Make Your Own. Available online: https://www.gov.uk/government/publications/face-coverings-when-to-wear-one-and-how-to-make-your-own/face-coverings-when-to-wear-one-and-how-to-make-your-own#face-coverings-at-work (accessed on 15 May 2024).
- Cheng, Y.; Ma, N.; Witt, C.; Rapp, S.; Wild, P.S.; Andreae, M.O.; Pöschl, U.; Su, H. Face masks effectively limit the probability of SARS-CoV-2 transmission. Science 2021, 372, eabg6296. [Google Scholar] [CrossRef]
- Wiersinga, W.J.; Rhodes, A.; Cheng, A.C.; Peacock, S.J.; Prescott, H.C. Pathophysiology, Transmission, Diagnosis, and Treatment of Coronavirus Disease 2019 (COVID-19). JAMA 2020, 324, 782. [Google Scholar] [CrossRef]
- Jain, S.; Meena, R.; Kumar, V.; Kaur, R.; Tiwari, U. Comparison of hematologic abnormalities between hospitalized coronavirus disease 2019 positive and negative patients with correlation to disease severity and outcome. J. Med. Virol. 2022, 94, 3757–3767. [Google Scholar] [CrossRef]
- Yuan, X.; Huang, W.; Ye, B.; Chen, C.; Huang, R.; Wu, F.; Wei, Q.; Zhang, W.; Hu, J. Changes of hematological and immunological parameters in COVID-19 patients. Int. J. Hematol. 2020, 112, 553–559. [Google Scholar] [CrossRef]
- Wold, S.; Esbensen, K.; Geladi, P. Principal component analysis. Chemom. Intell. Lab. Syst. 1987, 2, 37–52. [Google Scholar] [CrossRef]
- Abdi, H.; Williams, L.J. Principal component analysis. WIREs Comput. Stat. 2010, 2, 433–459. [Google Scholar] [CrossRef]
- Abraham, G.; Inouye, M. Fast Principal Component Analysis of Large-Scale Genome-Wide Data. PLoS ONE 2014, 9, e93766. [Google Scholar] [CrossRef] [PubMed]
- Wang, B.; Jiang, L. Principal Component Analysis Applications in COVID-19 Genome Sequence Studies. Cognit. Comput. 2021, 16, 1637–1648. [Google Scholar] [CrossRef] [PubMed]
- Shi, W.; Liu, X.; Cao, Q.; Ma, P.; Le, W.; Xie, L.; Ye, J.; Wen, W.; Tang, H.; Su, W.; et al. High-dimensional single-cell analysis reveals the immune characteristics of COVID-19. Am. J. Physiol. Cell. Mol. Physiol. 2021, 320, L84–L98. [Google Scholar] [CrossRef]
- Sciacchitano, S.; De Vitis, C.; D’Ascanio, M.; Giovagnoli, S.; De Dominicis, C.; Laghi, A.; Anibaldi, P.; Petrucca, A.; Salerno, G.; Santino, I.; et al. Gene signature and immune cell profiling by high-dimensional, single-cell analysis in COVID-19 patients, presenting Low T3 syndrome and coexistent hematological malignancies. J. Transl. Med. 2021, 19, 139. [Google Scholar] [CrossRef]
- Health, M. of Saudi MoH Protocol for Patients Suspected of/Confirmed with COVID-19. Available online: https://www.moh.gov.sa/Ministry/MediaCenter/Publications/Documents/MOH-therapeutic-protocol-for-COVID-19.pdf (accessed on 5 August 2022).
- GraphPad Overview of Principal Component Analysis. Available online: https://www.graphpad.com/guides/prism/latest/statistics/stat_pca_overview.htm (accessed on 15 May 2024).
- Sayed, A.A. Assessing the Diagnostic Values of the Neutrophil-to-Lymphocyte Ratio (NLR) and Systematic Immunoinflammatory Index (SII) as Biomarkers in Predicting COVID-19 Severity: A Multicentre Comparative Study. Medicina 2024, 60, 602. [Google Scholar] [CrossRef]
- Umakanthan, S.; Sahu, P.; Ranade, A.V.; Bukelo, M.M.; Rao, J.S.; Abrahao-Machado, L.F.; Dahal, S.; Kumar, H.; Kv, D. Origin, transmission, diagnosis and management of coronavirus disease 2019 (COVID-19). Postgrad. Med. J. 2020, 96, 753–758. [Google Scholar] [CrossRef]
- Mohamadian, M.; Chiti, H.; Shoghli, A.; Biglari, S.; Parsamanesh, N.; Esmaeilzadeh, A. COVID-19: Virology, biology and novel laboratory diagnosis. J. Gene Med. 2021, 23, e3303. [Google Scholar] [CrossRef]
- Berlin, D.A.; Gulick, R.M.; Martinez, F.J. Severe COVID-19. N. Engl. J. Med. 2020, 383, 2451–2460. [Google Scholar] [CrossRef]
- Middleton, E.A.; Zimmerman, G.A. COVID-19–Associated Acute Respiratory Distress Syndrome. Crit. Care Clin. 2021, 37, 777–793. [Google Scholar] [CrossRef] [PubMed]
- Wang, Z.; Xu, X. scRNA-seq Profiling of Human Testes Reveals the Presence of the ACE2 Receptor, A Target for SARS-CoV-2 Infection in Spermatogonia, Leydig and Sertoli Cells. Cells 2020, 9, 920. [Google Scholar] [CrossRef]
- Liu, Y.; Du, X.; Chen, J.; Jin, Y.; Peng, L.; Wang, H.H.X.; Luo, M.; Chen, L.; Zhao, Y. Neutrophil-to-lymphocyte ratio as an independent risk factor for mortality in hospitalized patients with COVID-19. J. Infect. 2020, 81, e6–e12. [Google Scholar] [CrossRef] [PubMed]
- Sun, S.; Cai, X.; Wang, H.; He, G.; Lin, Y.; Lu, B.; Chen, C.; Pan, Y.; Hu, X. Abnormalities of peripheral blood system in patients with COVID-19 in Wenzhou, China. Clin. Chim. Acta 2020, 507, 174–180. [Google Scholar] [CrossRef] [PubMed]
- Java, A.; Apicelli, A.J.; Liszewski, M.K.; Coler-Reilly, A.; Atkinson, J.P.; Kim, A.H.J.; Kulkarni, H.S. The complement system in COVID-19: Friend and foe? JCI Insight 2020, 5, e140711. [Google Scholar] [CrossRef]
- Afzali, B.; Noris, M.; Lambrecht, B.N.; Kemper, C. The state of complement in COVID-19. Nat. Rev. Immunol. 2022, 22, 77–84. [Google Scholar] [CrossRef]
- Lo, M.W.; Kemper, C.; Woodruff, T.M. COVID-19: Complement, Coagulation, and Collateral Damage. J. Immunol. 2020, 205, 1488–1495. [Google Scholar] [CrossRef]
- Jung, M.K.; Shin, E.-C. Phenotypes and Functions of SARS-CoV-2-Reactive T Cells. Mol. Cells 2021, 44, 401–407. [Google Scholar] [CrossRef]
- Dan, J.M.; Mateus, J.; Kato, Y.; Hastie, K.M.; Yu, E.D.; Faliti, C.E.; Grifoni, A.; Ramirez, S.I.; Haupt, S.; Frazier, A.; et al. Immunological memory to SARS-CoV-2 assessed for up to 8 months after infection. Science 2021, 371, eabf4063. [Google Scholar] [CrossRef]
- Jarjour, N.N.; Masopust, D.; Jameson, S.C. T Cell Memory: Understanding COVID-19. Immunity 2021, 54, 14–18. [Google Scholar] [CrossRef]
- Sayed, A.A.; Allam, A.A.; Sayed, A.I.; Alraey, M.A.; Joseph, M.V. The use of neutrophil-to-lymphocyte ratio (NLR) as a marker for COVID-19 infection in Saudi Arabia. Saudi Med. J. 2021, 42, 370–376. [Google Scholar] [CrossRef] [PubMed]
- Parthasarathi, A.; Padukudru, S.; Arunachal, S.; Basavaraj, C.K.; Krishna, M.T.; Ganguly, K.; Upadhyay, S.; Anand, M.P. The Role of Neutrophil-to-Lymphocyte Ratio in Risk Stratification and Prognostication of COVID-19: A Systematic Review and Meta-Analysis. Vaccines 2022, 10, 1233. [Google Scholar] [CrossRef] [PubMed]
- Diao, B.; Wang, C.; Tan, Y.; Chen, X.; Liu, Y.; Ning, L.; Chen, L.; Li, M.; Liu, Y.; Wang, G.; et al. Reduction and Functional Exhaustion of T Cells in Patients with Coronavirus Disease 2019 (COVID-19). Front. Immunol. 2020, 11, 827. [Google Scholar] [CrossRef] [PubMed]
- Mohammed, R.N.; Tamjidifar, R.; Rahman, H.S.; Adili, A.; Ghoreishizadeh, S.; Saeedi, H.; Thangavelu, L.; Shomali, N.; Aslaminabad, R.; Marofi, F.; et al. A comprehensive review about immune responses and exhaustion during coronavirus disease (COVID-19). Cell Commun. Signal. 2022, 20, 79. [Google Scholar] [CrossRef]
- Buonacera, A.; Stancanelli, B.; Colaci, M.; Malatino, L. Neutrophil to Lymphocyte Ratio: An Emerging Marker of the Relationships between the Immune System and Diseases. Int. J. Mol. Sci. 2022, 23, 3636. [Google Scholar] [CrossRef]
- Chen, Y.; Klein, S.L.; Garibaldi, B.T.; Li, H.; Wu, C.; Osevala, N.M.; Li, T.; Margolick, J.B.; Pawelec, G.; Leng, S.X. Aging in COVID-19: Vulnerability, immunity and intervention. Ageing Res. Rev. 2021, 65, 101205. [Google Scholar] [CrossRef]
- Regolo, M.; Vaccaro, M.; Sorce, A.; Stancanelli, B.; Colaci, M.; Natoli, G.; Russo, M.; Alessandria, I.; Motta, M.; Santangelo, N.; et al. Neutrophil-to-Lymphocyte Ratio (NLR) Is a Promising Predictor of Mortality and Admission to Intensive Care Unit of COVID-19 Patients. J. Clin. Med. 2022, 11, 2235. [Google Scholar] [CrossRef]
- Zeng, F.; Huang, Y.; Guo, Y.; Yin, M.; Chen, X.; Xiao, L.; Deng, G. Association of inflammatory markers with the severity of COVID-19: A meta-analysis. Int. J. Infect. Dis. 2020, 96, 467–474. [Google Scholar] [CrossRef]
- Abo-Haded, H.M.; Alshengeti, A.M.; Alawfi, A.D.; Khoshhal, S.Q.; Al-Harbi, K.M.; Allugmani, M.D.; El-Agamy, D.S. Cytokine Profiling among Children with Multisystem Inflammatory Syndrome versus Simple COVID-19 Infection: A Study from Northwest Saudi Arabia. Biology 2022, 11, 946. [Google Scholar] [CrossRef]
- Al-kuraishy, H.M.; Al-Gareeb, A.I.; Kaushik, A.; Kujawska, M.; Batiha, G.E.-S. Hemolytic anemia in COVID-19. Ann. Hematol. 2022, 101, 1887–1895. [Google Scholar] [CrossRef]
- Abu-Ismail, L.; Taha, M.J.J.; Abuawwad, M.T.; Al-Bustanji, Y.; Al-Shami, K.; Nashwan, A.; Yassin, M. COVID-19 and Anemia: What Do We Know So Far? Hemoglobin 2023, 47, 122–129. [Google Scholar] [CrossRef] [PubMed]
- Al-Samkari, H.; Karp Leaf, R.S.; Dzik, W.H.; Carlson, J.C.T.; Fogerty, A.E.; Waheed, A.; Goodarzi, K.; Bendapudi, P.K.; Bornikova, L.; Gupta, S.; et al. COVID-19 and coagulation: Bleeding and thrombotic manifestations of SARS-CoV-2 infection. Blood 2020, 136, 489–500. [Google Scholar] [CrossRef]
- Xu, P.; Zhou, Q.; Xu, J. Mechanism of thrombocytopenia in COVID-19 patients. Ann. Hematol. 2020, 99, 1205–1208. [Google Scholar] [CrossRef] [PubMed]
- Citu, C.; Gorun, F.; Motoc, A.; Sas, I.; Gorun, O.M.; Burlea, B.; Tuta-Sas, I.; Tomescu, L.; Neamtu, R.; Malita, D.; et al. The Predictive Role of NLR, d-NLR, MLR, and SIRI in COVID-19 Mortality. Diagnostics 2022, 12, 122. [Google Scholar] [CrossRef] [PubMed]
- Fois, A.G.; Paliogiannis, P.; Scano, V.; Cau, S.; Babudieri, S.; Perra, R.; Ruzzittu, G.; Zinellu, E.; Pirina, P.; Carru, C.; et al. The Systemic Inflammation Index on Admission Predicts In-Hospital Mortality in COVID-19 Patients. Molecules 2020, 25, 5725. [Google Scholar] [CrossRef]
- Ghobadi, H.; Mohammadshahi, J.; Javaheri, N.; Fouladi, N.; Mirzazadeh, Y.; Aslani, M.R. Role of leukocytes and systemic inflammation indexes (NLR, PLR, MLP, dNLR, NLPR, AISI, SIR-I, and SII) on admission predicts in-hospital mortality in non-elderly and elderly COVID-19 patients. Front. Med. 2022, 9, 916453. [Google Scholar] [CrossRef]
- Cakirca, G.; Cakirca, T.D.; Bindal, A.; Olcen, M. Inflammation-based Indices Predicting Mortality in COVID-19. J. Coll. Physicians Surg. Pak. 2023, 33, 112–114. [Google Scholar] [CrossRef]
- Ye, W.; Lu, W.; Tang, Y.; Chen, G.; Li, X.; Ji, C.; Hou, M.; Zeng, G.; Lan, X.; Wang, Y.; et al. Identification of COVID-19 Clinical Phenotypes by Principal Component Analysis-Based Cluster Analysis. Front. Med. 2020, 7, 570614. [Google Scholar] [CrossRef]
- Sayed, A.A. The Cost-Effectiveness of Requesting a Complete Blood Count (CBC) in the Management of COVID-19 in Saudi Arabia. Healthcare 2022, 10, 1780. [Google Scholar] [CrossRef]
- Bergantini, L.; D’Alessandro, M.; Cameli, P.; Cavallaro, D.; Gangi, S.; Cekorja, B.; Sestini, P.; Bargagli, E. NK and T Cell Immunological Signatures in Hospitalized Patients with COVID-19. Cells 2021, 10, 3182. [Google Scholar] [CrossRef]
- de Fátima Cobre, A.; Stremel, D.P.; Noleto, G.R.; Fachi, M.M.; Surek, M.; Wiens, A.; Tonin, F.S.; Pontarolo, R. Diagnosis and prediction of COVID-19 severity: Can biochemical tests and machine learning be used as prognostic indicators? Comput. Biol. Med. 2021, 134, 104531. [Google Scholar] [CrossRef]
- Setia, M. Methodology series module 3: Cross-sectional studies. Indian J. Dermatol. 2016, 61, 261. [Google Scholar] [CrossRef] [PubMed]
- Wolszczak-Biedrzycka, B.; Dorf, J.; Wojewódzka-Żelezniakowicz, M.; Żendzian-Piotrowska, M.; Dymicka-Piekarska, V.; Matowicka-Karna, J.; Maciejczyk, M. Unveiling COVID-19 Secrets: Harnessing Cytokines as Powerful Biomarkers for Diagnosis and Predicting Severity. J. Inflamm. Res. 2023, 16, 6055–6070. [Google Scholar] [CrossRef] [PubMed]
- Wolszczak-Biedrzycka, B.; Dorf, J.; Milewska, A.; Łukaszyk, M.; Naumnik, W.; Kosidło, J.W.; Dymicka-Piekarska, V. The Diagnostic Value of Inflammatory Markers (CRP, IL6, CRP/IL6, CRP/L, LCR) for Assessing the Severity of COVID-19 Symptoms Based on the MEWS and Predicting the Risk of Mortality. J. Inflamm. Res. 2023, 16, 2173–2188. [Google Scholar] [CrossRef] [PubMed]
Disclaimer/Publisher’s Note: The statements, opinions and data contained in all publications are solely those of the individual author(s) and contributor(s) and not of MDPI and/or the editor(s). MDPI and/or the editor(s) disclaim responsibility for any injury to people or property resulting from any ideas, methods, instructions or products referred to in the content. |
© 2024 by the author. Licensee MDPI, Basel, Switzerland. This article is an open access article distributed under the terms and conditions of the Creative Commons Attribution (CC BY) license (https://creativecommons.org/licenses/by/4.0/).