Article

Enhancing Cone-Beam CT Image Quality in TIPSS Procedures Using AI Denoising

Department of Diagnostic and Interventional Radiology, University Hospital Tübingen, D-72076 Tuebingen, Germany
*
Author to whom correspondence should be addressed.
Diagnostics 2024, 14(17), 1989; https://doi.org/10.3390/diagnostics14171989
Submission received: 14 August 2024 / Revised: 30 August 2024 / Accepted: 2 September 2024 / Published: 9 September 2024
(This article belongs to the Section Machine Learning and Artificial Intelligence in Diagnostics)

Abstract

:
Purpose: This study evaluates a deep learning-based denoising algorithm to improve the trade-off between radiation dose, image noise, and motion artifacts in TIPSS procedures, aiming for shorter acquisition times and reduced radiation with maintained diagnostic quality. Methods: In this retrospective study, TIPSS patients were divided based on CBCT acquisition times of 6 s and 3 s. Traditional weighted filtered back projection (Original) and an AI denoising algorithm (AID) were used for image reconstructions. Objective assessments of image quality included contrast, noise levels, and contrast-to-noise ratios (CNRs) through place-consistent region-of-interest (ROI) measurements across various critical areas pertinent to the TIPSS procedure. Subjective assessments were conducted by two blinded radiologists who evaluated the overall image quality, sharpness, contrast, and motion artifacts for each dataset combination. Statistical significance was determined using a mixed-effects model (p ≤ 0.05). Results: From an initial cohort of 60 TIPSS patients, 44 were selected and paired. The mean dose-area product (DAP) for the 6 s acquisitions was 5138.50 ± 1325.57 µGy·m2, significantly higher than the 2514.06 ± 691.59 µGym2 obtained for the 3 s series. CNR was highest in the 6 s-AID series (p < 0.05). Both denoised and original series showed consistent contrast for 6 s and 3 s acquisitions, with no significant noise differences between the 6 s Original and 3 s AID images (p > 0.9). Subjective assessments indicated superior quality in 6 s-AID images, with no significant overall quality difference between the 6 s-Original and 3 s-AID series (p > 0.9). Conclusions: The AI denoising algorithm enhances CBCT image quality in TIPSS procedures, allowing for shorter scans that reduce radiation exposure and minimize motion artifacts.

1. Introduction

Portal hypertension (PH) is defined by an elevation in pressure within the portal venous system, mainly due to the consequences of chronic liver disease (CLD). Cirrhosis stands out as the principal cause of PH, leading to a variety of subsequent complications [1].
The implementation of the TIPSS has emerged as a fundamental approach to managing PH-related complications [2,3,4,5].
In recent years, CBCT has been identified as an innovative technique in guiding the TIPSS procedure, enabling cross-sectional imaging via a c-arm equipped with a flat-panel detector [6].
A notable limitation impeding the extensive adoption of CBCT is the significant radiation exposure it involves [7,8]. Various protocols for image acquisition exist within CBCT applications. The primary distinctions among these protocols pertain to the radiation dose and acquisition duration. However, nuances also exist regarding the positioning of the C-arm, the frame rate per rotation, and the field of view (FOV) [9]. Shortening acquisition times to reduce radiation doses can potentially result in fewer respiratory motion artifacts. While this aspect may improve certain image characteristics, the concurrent reduction in radiation dose might lower the contrast-to-noise ratio (CNR), posing a risk of generating non-diagnostic images. On the other hand, longer acquisition times may increase the likelihood of motion artifacts and are associated with a certain increase in radiation exposure. Recent advances in artificial intelligence (AI) have introduced post-processing techniques capable of augmenting image quality in radiological interventions, including scenarios affected by high body mass index (BMI) [10]. Its implementation is expected to facilitate diagnostic scans with shortened acquisition times and decreased radiation exposure, concurrently decreasing motion artifact incidence and enhancing image quality. However, the potential effects of applying deep learning to enhance cone-beam CT images during TIPSS procedures have not been thoroughly investigated. We hypothesized that the algorithm could optimize the balance between radiation dose, acquisition time, motion artifact, and image quality. This study aims to investigate the impact of a novel AI-based denoising algorithm on CBCT imaging in the context of TIPSS.

2. Methods

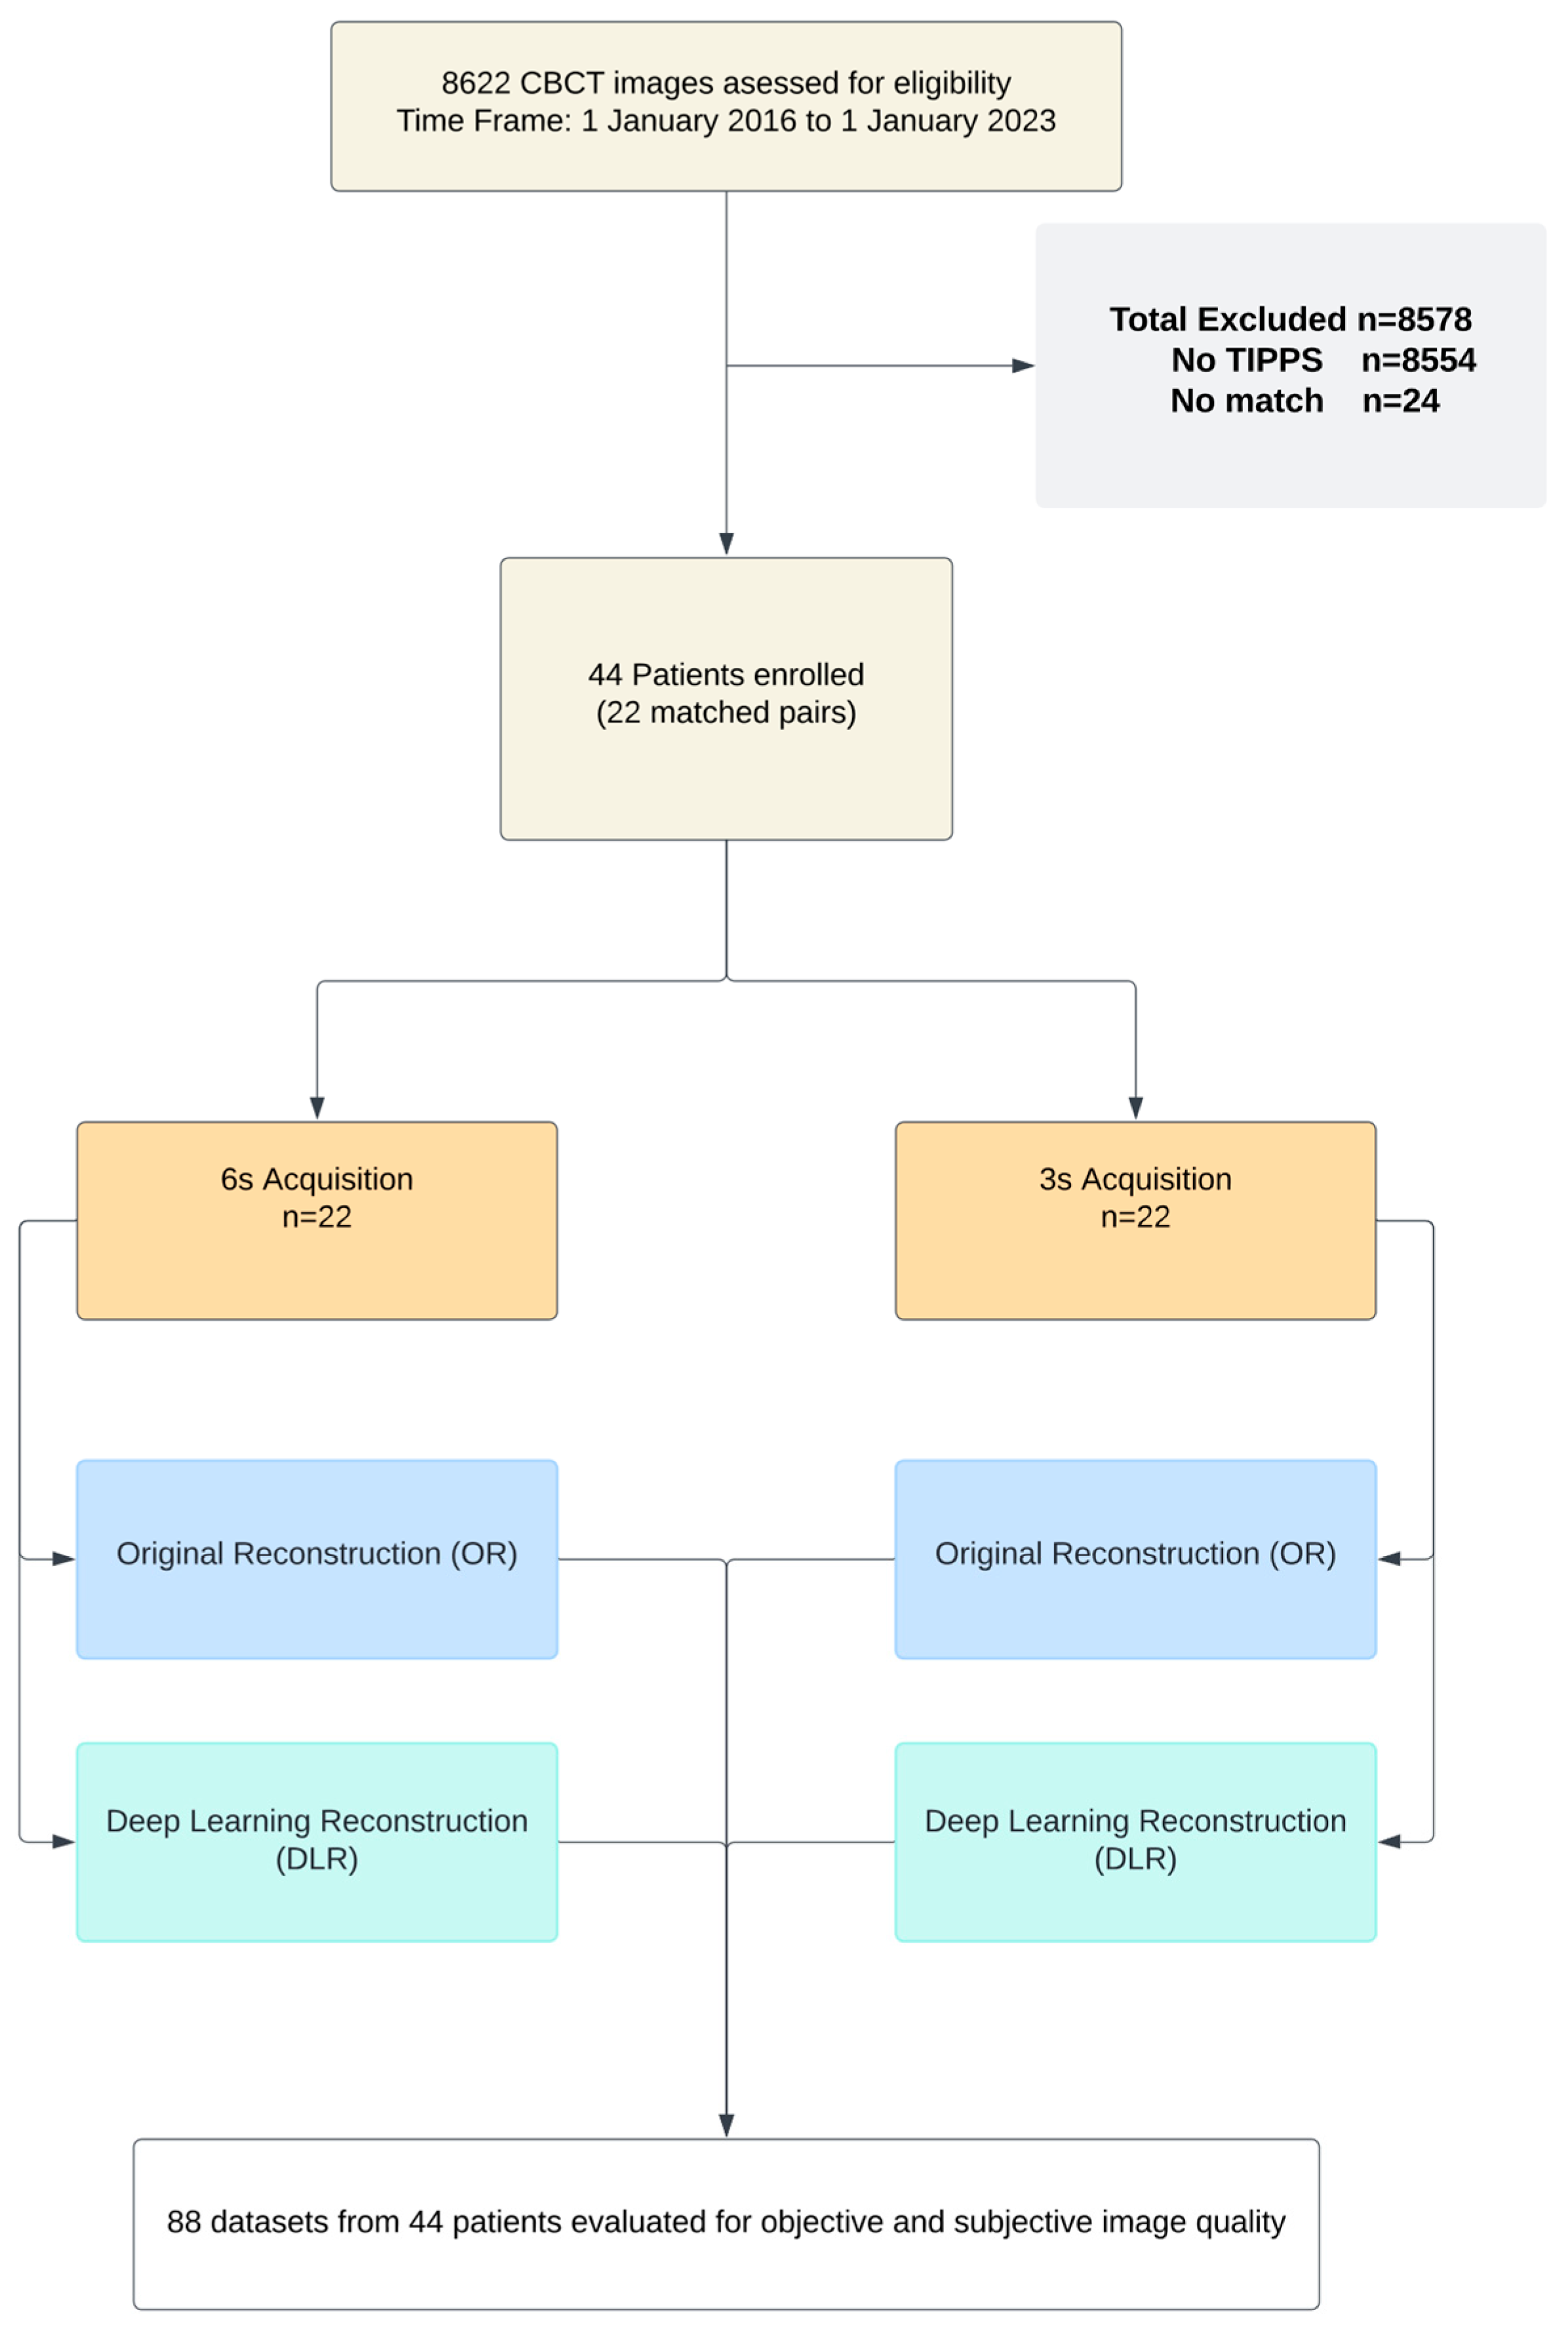
2.1. Study Population and Patient Characteristics

The institutional review board approved our single center’s retrospective eligibility analysis and data collection for patients undergoing interventional radiology procedures with CBCT from 1 January 2018 to 1 January 2022, including a waiver for the need for informed consent. Patients were categorized based on the image acquisition duration following a review of 8622 CBCT examinations, from which 8554 examinations unrelated to TIPSS were excluded. This resulted in 22 patients undergoing a 3 s acquisition time. Initially, 48 patients had 6 s acquisition. To ensure a matched comparison based on BMI, 24 of these with no matches were excluded, resulting in a final group of 22 patients with 6 s acquisition.
For each patient, clinical indications for TIPSS, demographics, and BMI (in kg/m2) were documented. Based on their BMI, patients were paired, and each pair was comparatively evaluated for both subjective and objective image qualities.

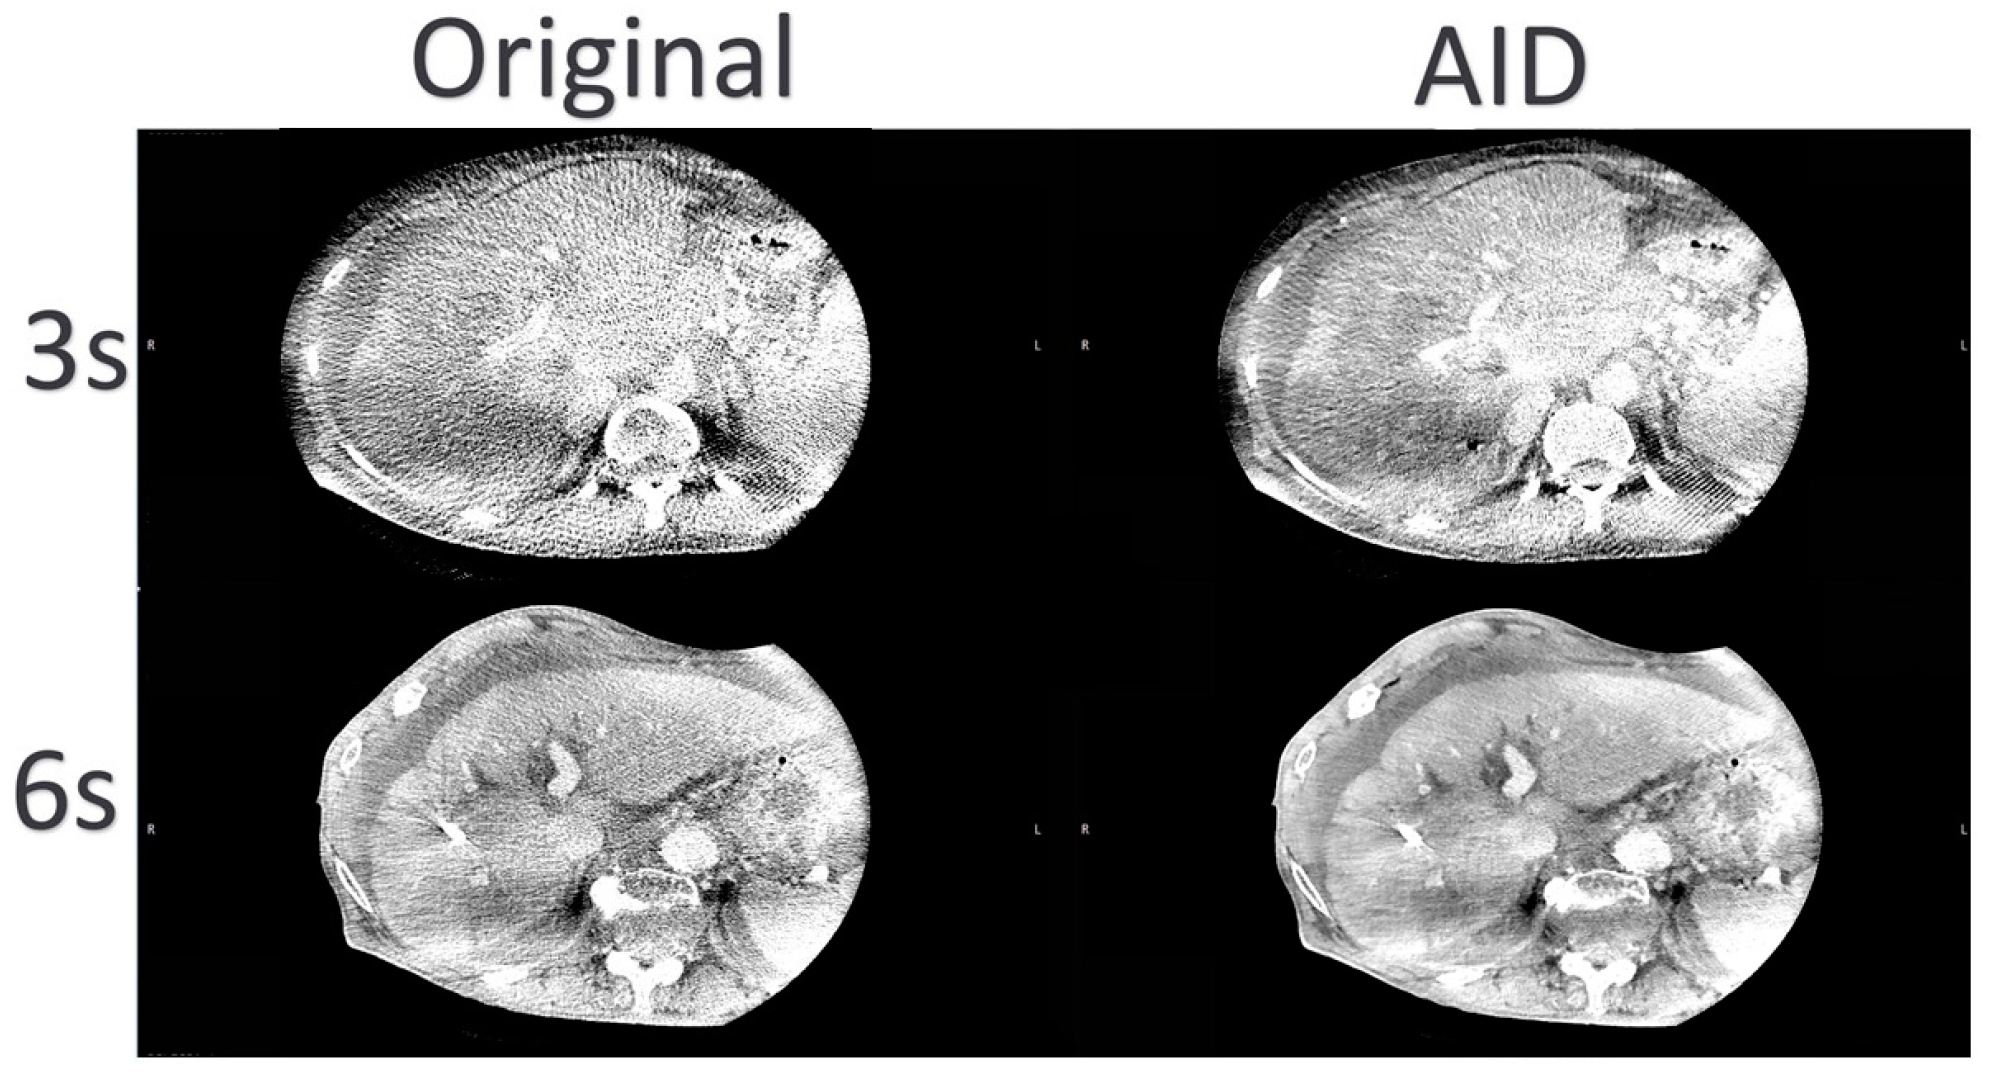
2.2. Image Acquisition, Reconstruction, and Postprocessing

All TIPSS procedures were executed by a senior interventional radiologist with extensive experience exceeding six years in the domain of interventional radiology. Each procedure was conducted under general anesthesia following a preliminary paracentesis. Utilizing a 10 French sheath, access to the right hepatic vein was established via the right jugular vein. Subsequent to this, the mapping of portal vein branches was facilitated through CBCT in an arms-down position. The portal vein puncture was executed under 3D guidance and successful penetration was confirmed by aspirating blood through the TIPSS needle, followed by the administration of contrast media. A standard TIPSS stent graft (Viatorr, W.L. Gore, Flagstaff, AZ, USA) was employed to secure the TIPSS tract, with the criterion for technical success being the successful delivery of contrast into the portal vein via a 4F diagnostic catheter, aiming to reduce the portosystemic gradient to 10 mmHg or below.
The images were acquired with a multiaxis robotic angiographic C-arm suite (Artis Zeego Q, VE40 A, Siemens Healthineers, Forchheim, Germany). Adherence to a standardized contrast injection protocol was maintained across all procedures, facilitated through peripheral vein access utilizing an 18G needle. The injection protocol comprised the venous administration of a diluted contrast medium (75 mL of Ultravist at 370 mg/mL; Bayer Vital GmbH, Berlin, Germany), succeeded by a saline flush delivered at a flow rate of 4.5 mL/second by an automated power injector. Initiation of the C-arm CT system was automated and triggered 60 s post-injection.
The decision between utilizing a rotation time of either three seconds or six seconds for the CBCT system was determined by the operating radiologist’s aim to precisely target the portal vein. This approach allowed for the acquisition of either 397 projection images over six seconds or 167 projection images in three seconds, adhering to a detector entrance dose of 0.36 µGy/frame and capturing images at 60 frames per second. Image acquisition was completed over a 200° circular trajectory, with the CBCT images being processed using the breath-holding technique to ensure image stability and clarity. Image data were then transmitted to an offline workstation (syngo XWP, Siemens Healthcare, Singapore). CT-like axial images with a 1 mm slice thickness and interval were reconstructed using a weighted filtered back-projection technique supplemented with a median filter. Post-processing was carried out using the AID algorithm, which is based on a modified U-net-type convolutional neural network model (CNN) (ClariCT.AI ver 1.2.1, ClariPi Inc., Seoul, Republic of Korea) [11].

2.3. Objective Image Quality

The images were analyzed using FIJI (ver. 1.53k, Wayne Rasband, National Institutes of Health-NIH, Bethesda, MD, USA) [12]. ROIs (Regions of interest) were drawn in key regions for the TIPSS procedure, targeting the right hepatic vein and the portal vein, as well as in intraperitoneal fat to measure the differential of CT numbers in Hounsfield Units (HU), indicative of contrast. Analysis was expanded to the AID series, with consistent placement for measuring mean CT numbers in HU and their standard deviation (SD), with SD representing image noise. Additionally, the Contrast-to-Noise Ratio for each ROI was calculated to quantitatively assess objective image quality.

2.4. Subjective Image Quality

For the subjective image quality evaluation, two radiologists, both with five years of experience in interventional radiology and cone-beam CT, independently reviewed all combinations of the datasets. Each pair consisted of four image reconstructions (two from 3 s acquisitions and two from 6 s acquisitions), each processed with both Original and AID methods. Utilizing ViewDex (ver. 3.0), a software engineered for blinded and randomized evaluations, the radiologists conducted their assessments across four subjective criteria: overall subjective image quality, sharpness, motion artifact burden, and contrast. Each image was rated against its pair as being of superior (+1), equivalent (0), or inferior (−1) quality. This evaluative framework, emphasizing overall subjective quality, motion artifact burden, sharpness, and contrast, was strategically chosen for its relevance in affecting the identification of the portal vein during the TIPSS procedure.

2.5. Statistical Analysis

Statistical evaluations and visual presentations were conducted using GraphPad Prism version 9.3.1 for the Windows platform (GraphPad Software, based in San Diego, CA, USA). The Shapiro–Wilk test was applied to assess the normality of data distribution. Means ± standard deviations represented normally distributed variables, while medians and interquartile ranges described those that were not normally distributed. The Wilcoxon signed-rank test was utilized to evaluate differences in radiation doses across different acquisition times. Additionally, Spearman’s rank correlation coefficient was calculated to assess the relationship between radiation dose and acquisition time. The significance of the interactions was determined using a one-tailed test, with p-values less than 0.05 considered statistically significant. Mixed-effects models, with adjustments for sphericity violations using the Greenhouse–Geisser correction, were utilized for subjective and objective image quality analysis. For objective image quality assessments, variables such as contrast, standard deviation, and CNR across different acquisition times (6 s and 3 s) and reconstruction modes (Original and AID) were analyzed as repeated measures. Subjective evaluations, including quality, motion artifact burden, sharpness, and contrast, followed a similar analysis framework. To mitigate the risk of increased type 1 errors in post hoc comparisons, a two-stage step-up method of correction by Benjamini, Krieger, and Yekutieli was applied. A p-value adjusted to ≤0.05 was considered statistically significant. Spearman’s Rho was calculated to ascertain inter-rater agreement on subjective image quality, with r-values categorized as follows: 0–0.20 indicating negligible agreement, 0.21–0.40 weak, 0.41–0.60 moderate, 0.61–0.80 strong, and 0.81–1.00 very strong agreement.

3. Results

3.1. Study Population

Our experiment included 44 CBCT series from 22 matched patients who had undergone TIPSS at our institution. Overall, the patients had a mean height of 166.59 ± 16.16, a mean weight of 67.20 ± 17.92 kg, and a mean BMI of 23.80 ± 4.91 kg/m2. The mean overall DAP (Dose area product) of the 6 s series was 5138.50 ± 1325.57 µGy·m2, and the mean DAP of the 3 s series was 2514.06 ± 691.59 µGy·m2. For a graphical overview of the study’s workflow, see Figure 1, and for additional data on image acquisition and the study population’s metrics, refer to Table 1.

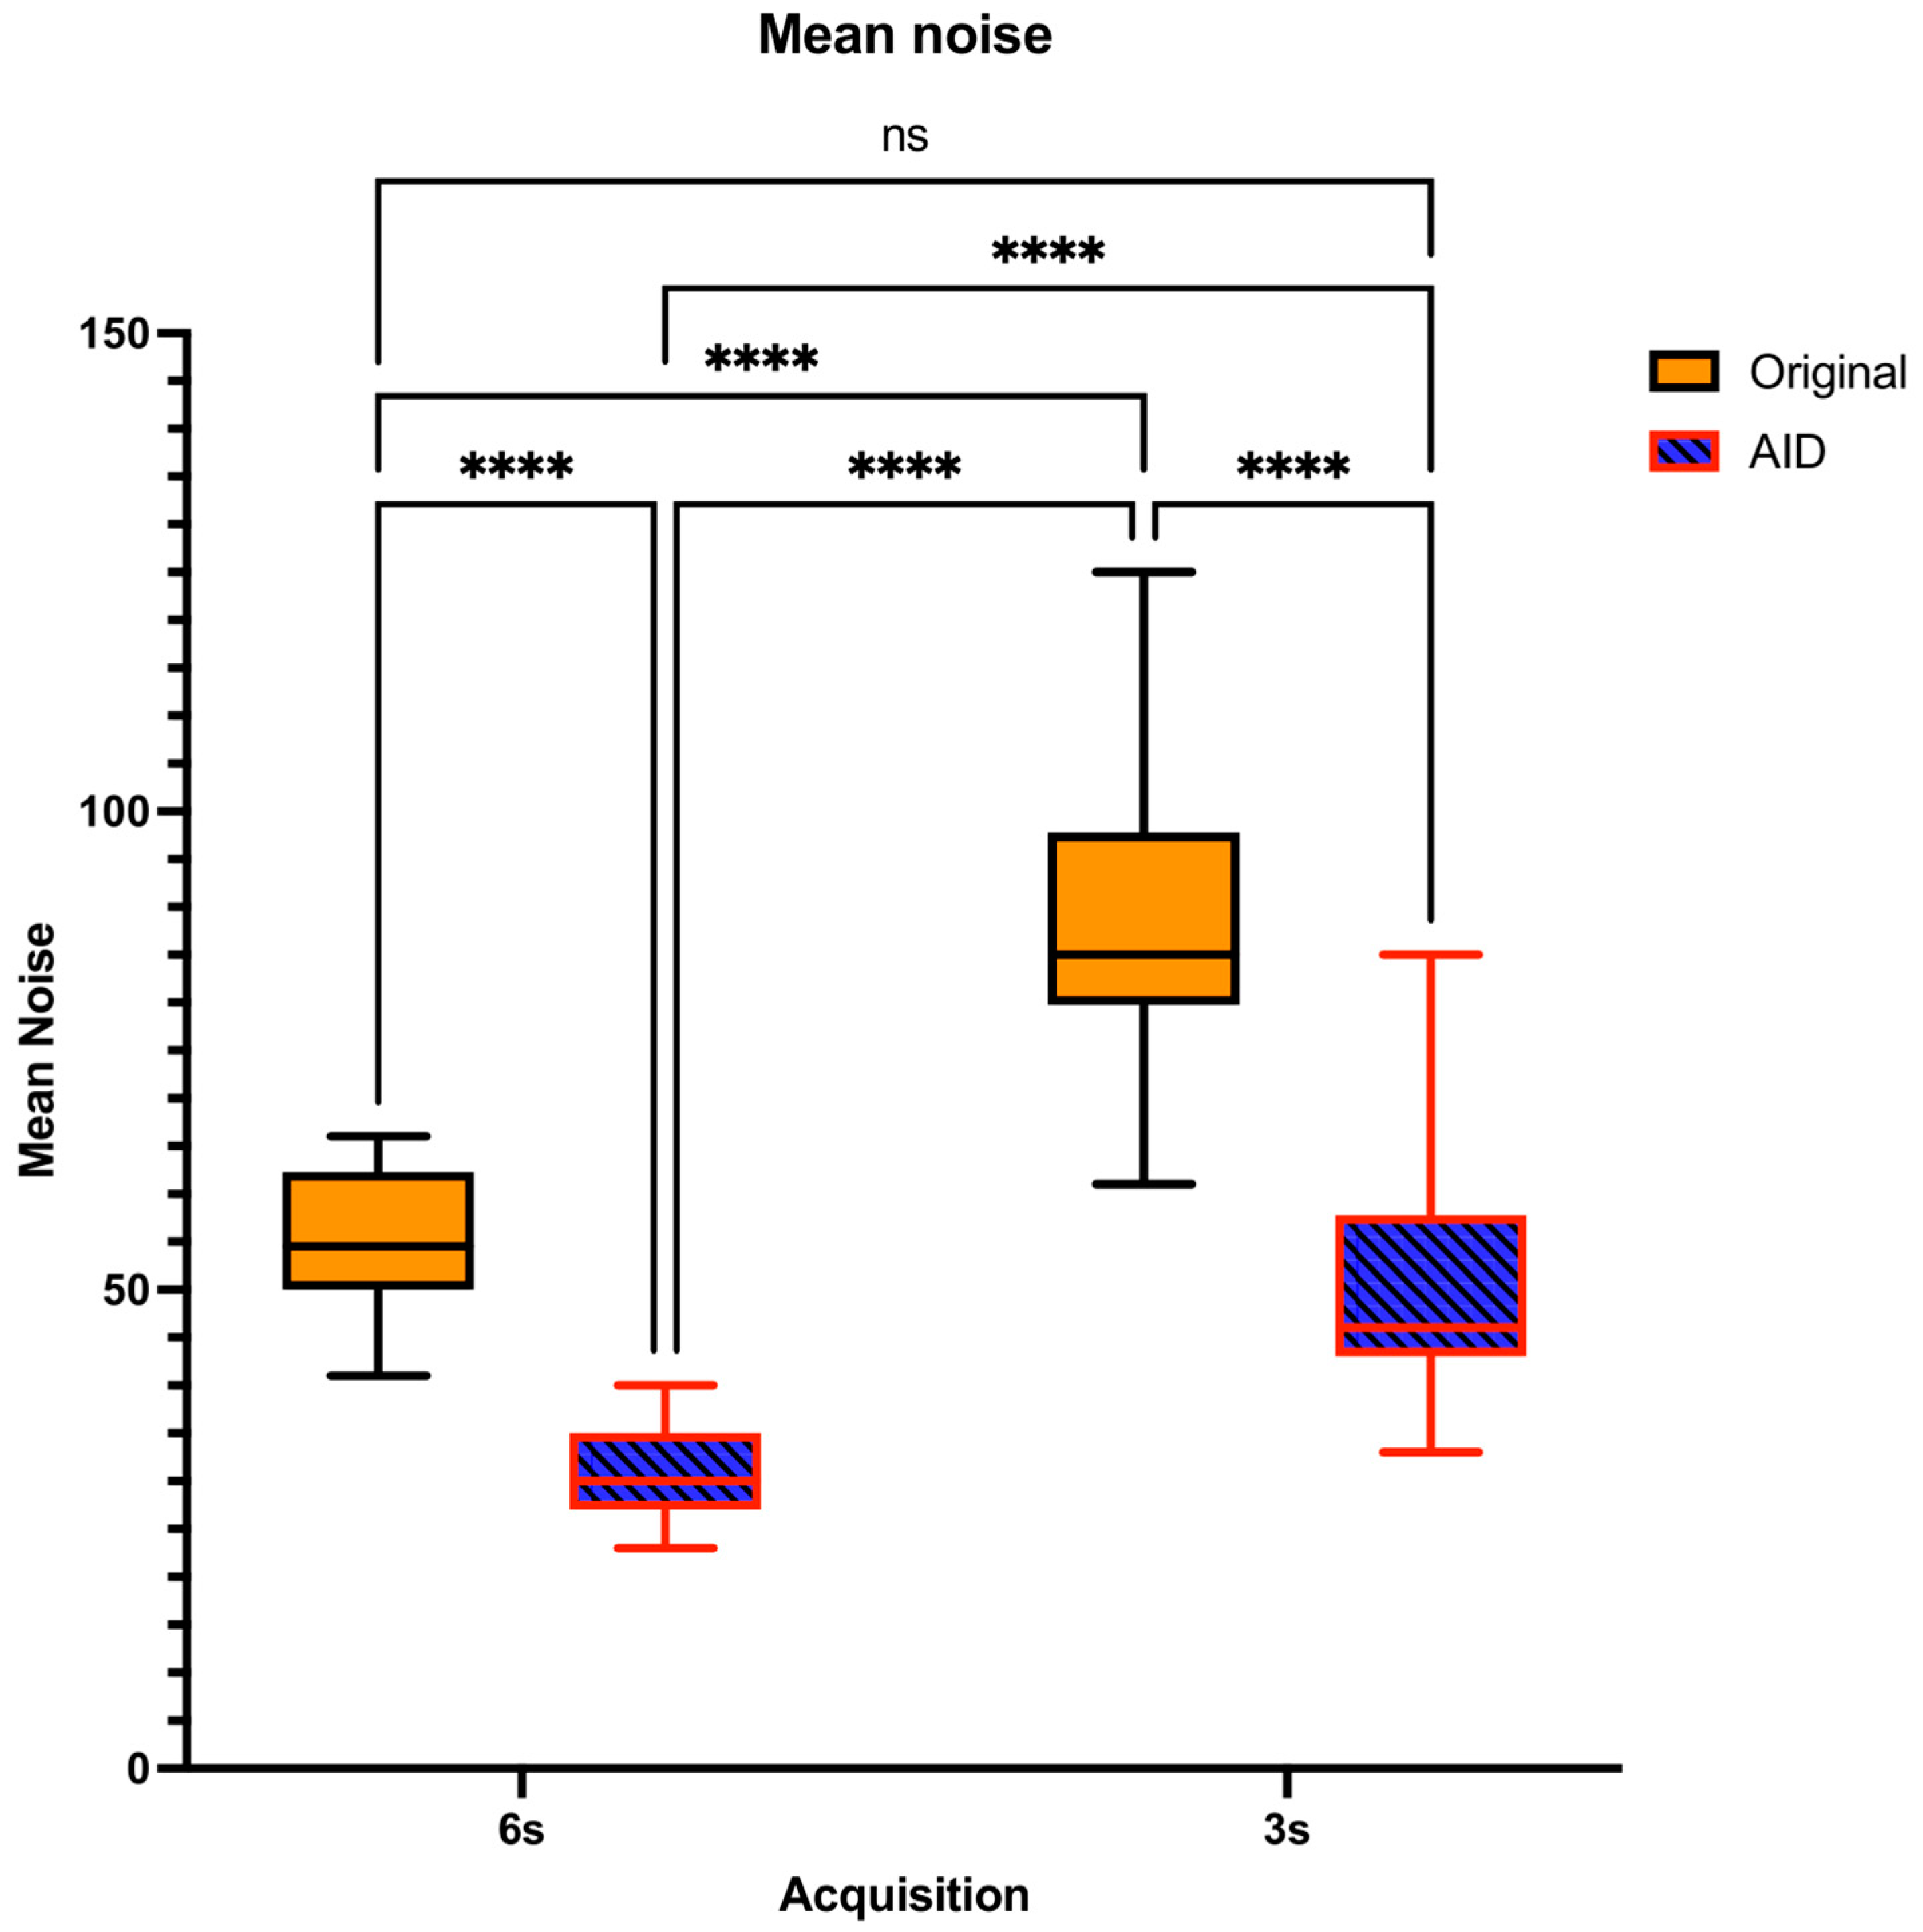
3.2. Objective Image Quality Assessment

In the objective image quality analysis, there were significant interactions between radiation dose and acquisition time (W = −253; p < 0.0001; Median difference = −38,073 µGy·m2; rs = 0.5562; p (one-tailed) = 0.0036; Figure 2).
In our study’s objective image quality assessment, mixed-effects models showed significant interactions. The corrected post hoc comparisons of the Contrast showed no significant differences for the original and the denoised series for both the 6 s (p = 0.9554) and 3 s (p = 0.9998) acquisitions (Figure 3).
The lowest noise levels were observed in the 6 s-AID series, succeeded sequentially by the 3 s-AID, 6 s-Original, and 3 s-Original series, with each transition demonstrating significant variations (p < 0.0001), except between the 6 s-Original and 3 s-AID series, where no significant difference was identified (p = 0.9423; Figure 4).
The highest CNR values were identified in the 6 s-AID series, followed in order by the 3 s-AID, 6 s-Original, and 3 s-Original series, all showing significant differences; however, there was no significant difference between the 6 s-Original and 3 s-AID series (p = 0.9968; Figure 5). Table 2 shows the mean scores ± standard deviation for the objective image analysis, along with the significance levels of the adjusted post hoc comparisons.

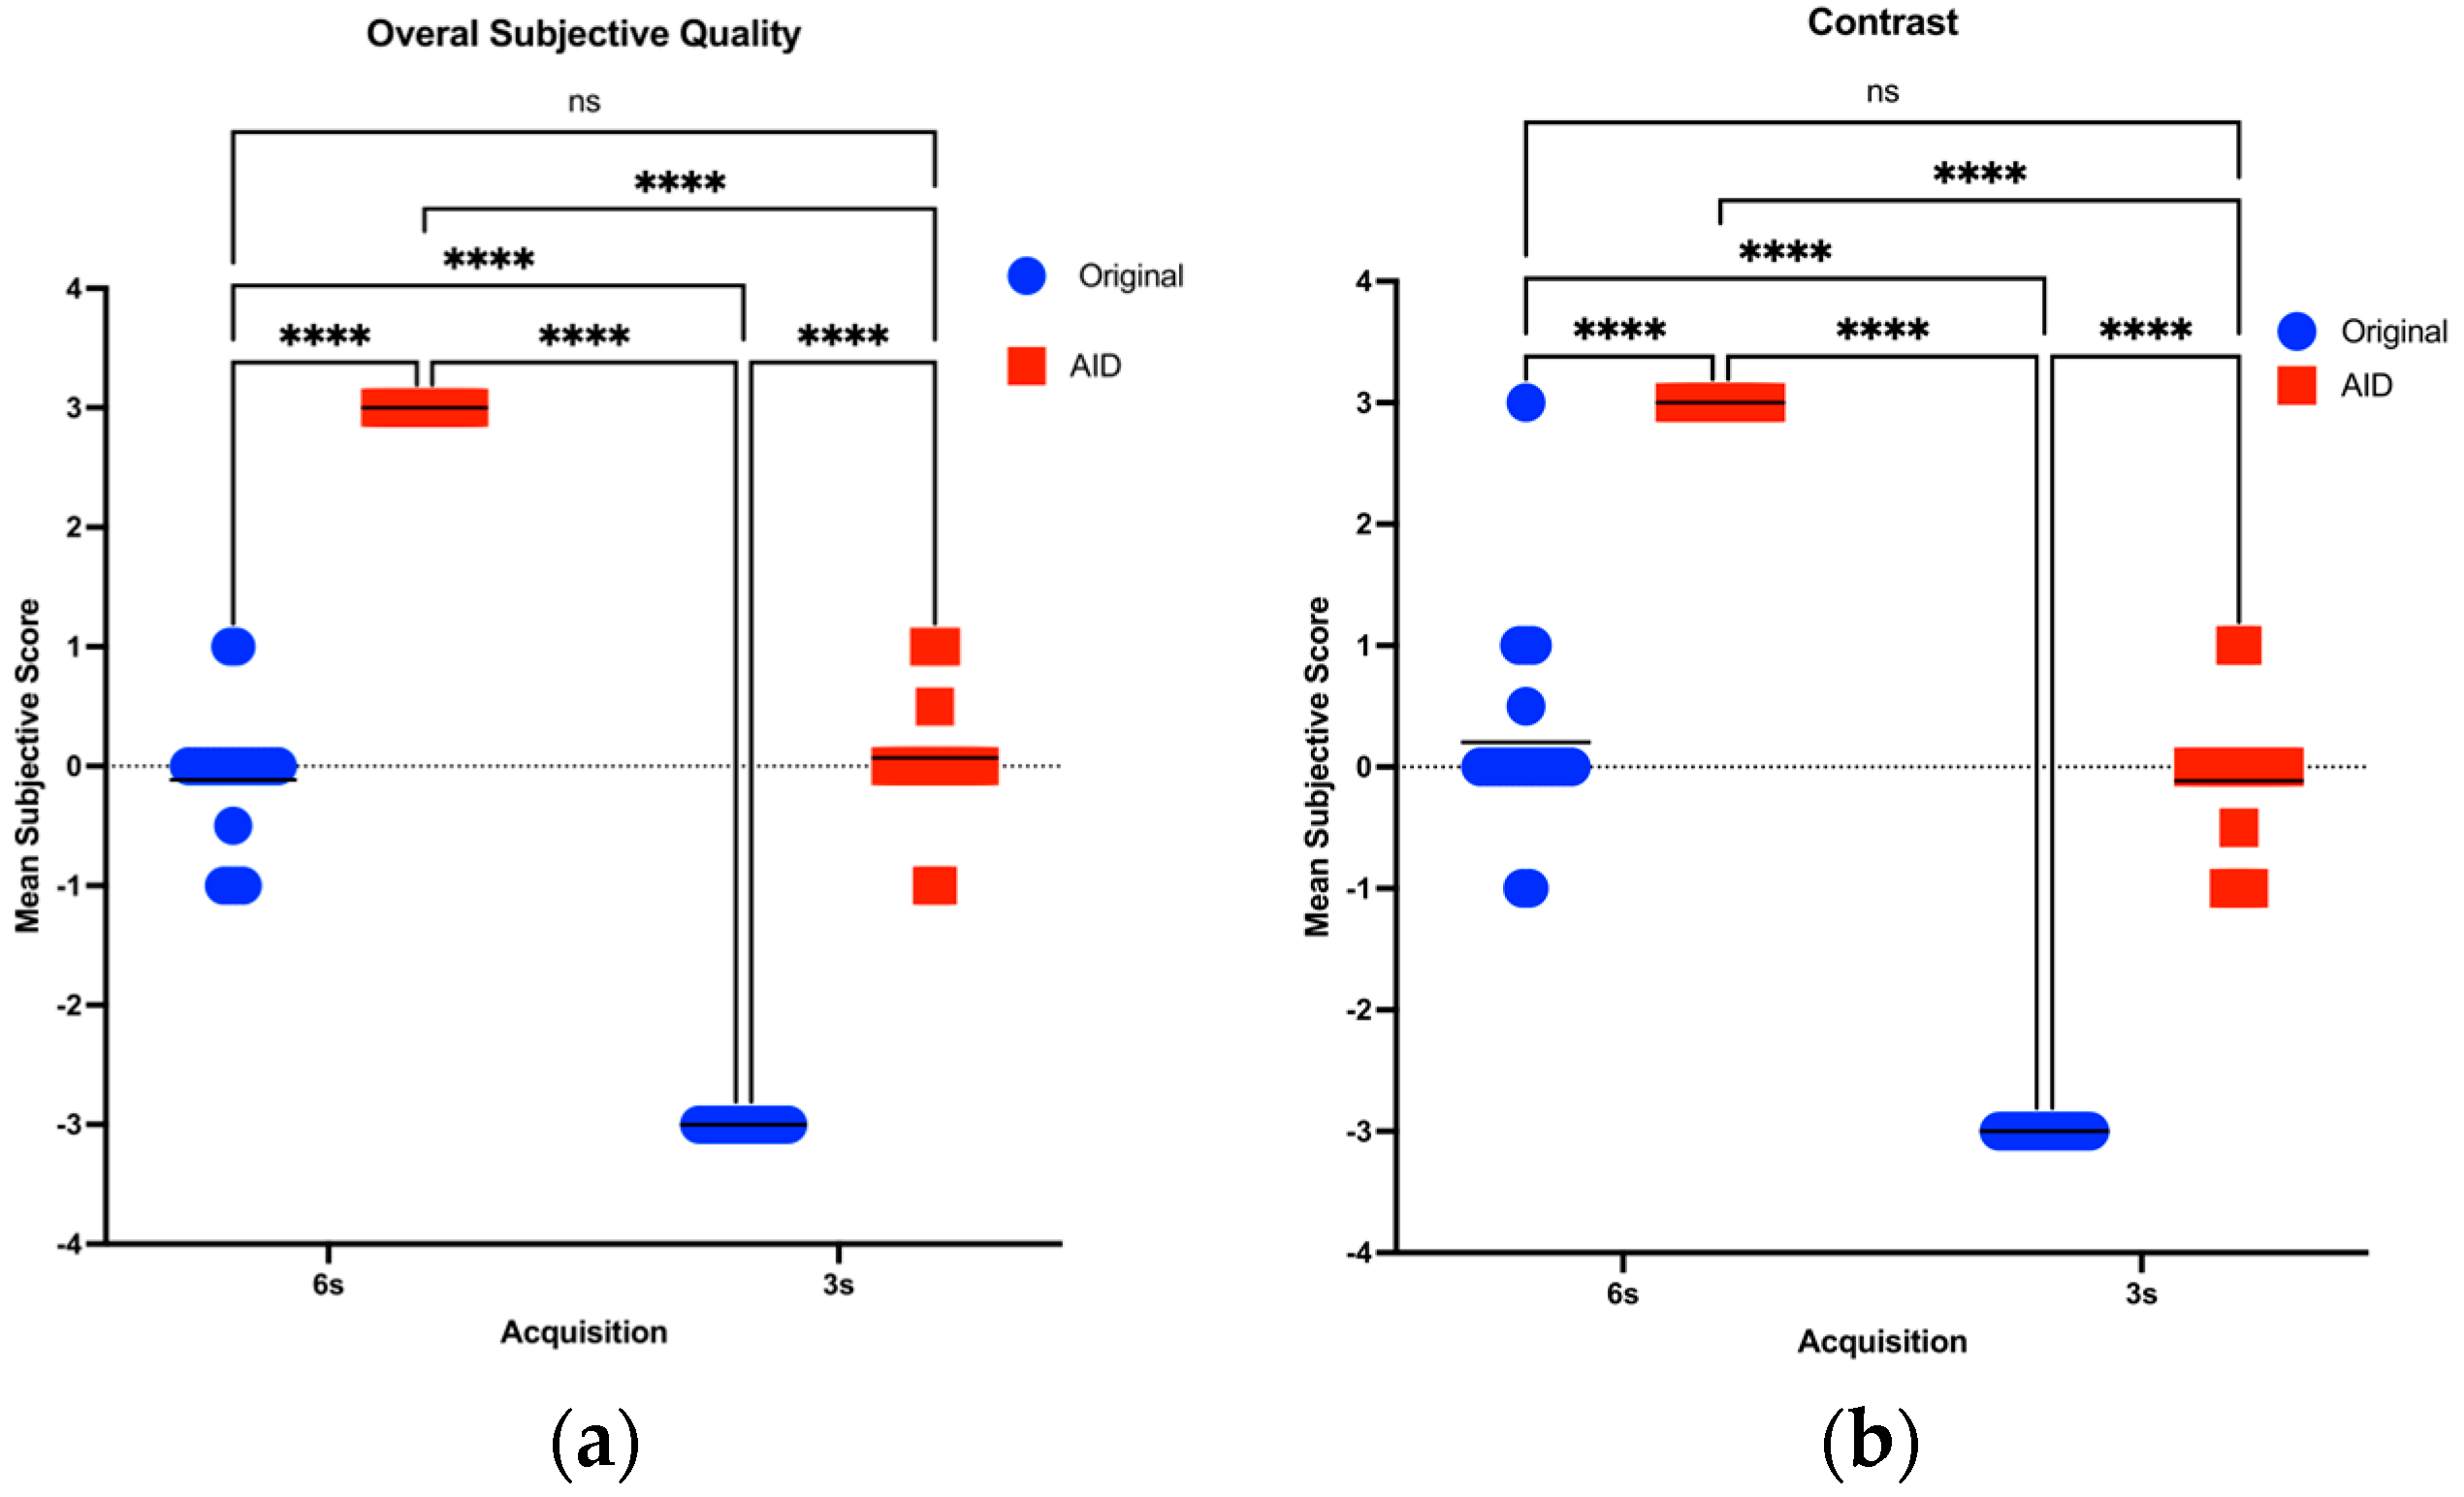
3.3. Subjective Image Quality Assessment

In the subjective analysis, there was a very strong agreement between raters, indicated by a Spearman’s Rho of 0.977 (each p < 0.001). Refer to Table 3 for the mean subjective scores ± standard deviation specific to each rater.
In the pooled comparisons for subjective image quality, Mixed Effects showed significant interactions. The 6 s AID series demonstrated the highest overall subjective image quality. No significant differences were observed between the 3 s AID and the 6 s Original series in terms of their overall subjective quality (p > 0.9999), both of which were superior to the 3 s Original dataset. The 3 s OR series was significantly rated as the lowest in overall subjective quality (p < 0.0001).
Consistent with the overall subjective image quality findings, the 6 s AID dataset achieved the highest ratings in contrast and sharpness (p < 0.0001). There was no significant difference between the 6 s Original and 3 s AID datasets in terms of contrast and sharpness (p > 0.9999). The 3 s Original dataset was rated significantly lower than all other groups for both contrast and sharpness (p < 0.0001).
In evaluating motion artifacts, both 3 s datasets were rated significantly higher, indicating fewer motion artifacts (p < 0.0001). No significant differences were observed between the Original and AID datasets at both 6 and 3 s (p = 0.981, p = 0.883).
Figure 6 illustrates the data distribution and the ensuing post hoc comparative analyses and Table 4 presents the aggregated mean scores ± standard deviation for the subjective analyses, alongside the adjusted post hoc pairwise comparisons.
Figure 7 displays comparative images illustrating enhanced delineation of the portal vein and liver contours, achieved through the reduction of noise and motion artifacts in the 3 s AID dataset in comparison to other datasets.

4. Discussion

The TIPSS procedure is emerging as a key intervention in the management of portal hypertension, a serious complication of CLD. However, accurate targeting of the portal vein during TIPSS can be challenging, compounded by the limitations of current imaging modalities. While cone-beam computed tomography (CBCT) provides the detailed cross-sectional images required for such procedures, it is hampered by a significant trade-off. Shorter acquisition times, while reducing patient exposure to radiation and minimizing respiratory motion artifacts, tend to increase image noise, potentially leading to non-diagnostic images. Conversely, longer acquisition times may improve image clarity but are prone to increased motion artifacts due to patient movement, potentially complicating the procedure.
The recent literature indicates that deep learning algorithms have the potential to improve CBCT image quality, enhancing diagnostic confidence by reducing noise and improving the contrast-to-noise ratio without the need for increased radiation doses or extended acquisition times [10,13,14]. Given these advancements, we hypothesized that an AI denoising algorithm could effectively optimize the trade-off between acquisition time and image quality in CBCT imaging for TIPSS.
In our objective image quality analysis, AID did not distort contrast across different acquisition times. Maintaining sufficient contrast is essential for precise and reliable diagnosis in CT imaging applications [15]. Furthermore, within the original reconstruction series, our study observed that shorter acquisition times correlated with diminished image quality, notably in the aspects of noise and the contrast-to-noise ratio. This observation is consistent with findings from a recent study on four-dimensional cone-beam computed tomography for image-guided lung cancer radiotherapy, which highlighted the adverse effects of very fast gantry rotations on image quality, particularly through increased streaking artifacts and reduced consistency in image metrics such as CNR and SNR when not employing motion-compensated reconstruction methods [16]. The AID series demonstrated superior objective image quality compared to the Original dataset across both acquisition times in our study. This superiority of AID in enhancing image quality, as evidenced by improved noise reduction and increased CNR, is in line with findings from recent studies. Choi et al. demonstrated that CNNs using self-supervised learning can enhance CBCT image quality by effectively denoising images without high-quality references, highlighting deep learning’s ability to improve noise reduction and CNR [14]. Additionally, a study by Yang et al. presented a transformer-based deep learning framework that effectively reduces the mean absolute error in CBCT images, highlighting its capability in precise CT number correction and noise/artifact reduction [17].
In accordance with the existing literature, our analysis noted a reduction in subjective image quality, including aspects of sharpness and contrast, associated with shorter acquisition times in the Original datasets [16,17,18]. Further comparison between the Original and AID datasets revealed a marked improvement in AID across these subjective quality indicators. These results align with a study by Zhao et al., which introduced a projection synthesis convolutional neural network to improve sparse-view CBCT images in image-guided radiotherapy, demonstrating significant quality improvements with lower imaging doses [19].
In the subjective motion artifact burden analysis, the data showed that the 3 s acquisition datasets, regardless of whether they were processed with Original or AID methods, exhibited fewer motion artifacts than the 6 s sets. This observation is corroborated by prior research, emphasizing the effectiveness of shorter acquisition times in diminishing motion artifacts [16,17].
Despite the development of deep learning techniques targeting motion artifacts in 4D CBCT—such as CNNs for missing projection prediction [20], residual U-shaped encoder-decoder network architecture for streak artifact reduction [21], and dual-encoder CNNs for improved edge sharpness [22]—our study employs a different AI-based CBCT reconstruction strategy. Our approach, focusing on shorter acquisition times, not only diminishes the presence of motion artifacts but also lowers patient radiation exposure. This strategy further decreases the risk associated with radiation while enhancing the overall quality of the imaging. Our study examined the impact of AI-denoising on CBCT images in TIPSS procedures, focusing on critical regions such as the right hepatic vein and the portal vein. However, since the radiologists evaluated these images without a ground truth reference, there is a risk that the AI-denoised images, despite appearing visually enhanced, might lack essential diagnostic details. The non-linear nature of AI-based denoising algorithms can introduce challenges in maintaining diagnostic accuracy, as these algorithms may inadvertently modify or obscure important features [23]. Cautious interpretation and further validation against ground truth are essential to ensure that these enhancements truly translate into improved outcomes for patients.
This study has limitations. First, as a single-center study, the results may have limited generalizability due to our institution’s specific patient demographics, treatment protocols, and technological resources. Second, the retrospective design of this study may have introduced biases in selection, data completeness, and classification, potentially affecting the robustness of our findings. Furthermore, due to the retrospective nature of this study, the AI-enhanced CBCT images were not utilized within the actual TIPSS procedure workflow. Although the AI denoising technique yielded significant improvements in image clarity, contrast, and noise reduction, these enhancements were not evaluated in a real-time clinical setting. Future research is needed to investigate the practical integration of AI-denoised CBCT images into the TIPSS procedure, assessing their impact on procedural efficiency, diagnostic accuracy, and patient outcomes. Third, the processing time for the AI denoising algorithm was not measured in this study. However, based on the U-net architecture employed, the processing time is likely minimal and would not interfere with clinical workflows. Nonetheless, future studies should consider measuring the processing time to confirm its negligible impact on the TIPSS procedure. Fourth, the lack of longitudinal data limits our ability to assess long-term outcomes or the effects of radiation exposure from the imaging techniques evaluated. In addition, the biometric matching of patients for comparison may not fully represent the diverse patient population. Subjective image quality assessments may introduce variability in interpretation. This study’s reliance on a specific deep learning-based reconstruction algorithm suggests that future technological developments could alter these findings. In addition, the use of proprietary software and hardware may limit the reproducibility of our results in different clinical settings.
In conclusion, AID significantly improved both objective and subjective CBCT image quality across varying acquisition times. By leveraging shorter acquisition times, our AI-based approach effectively reduced motion artifacts and minimized patient radiation exposure, underscoring its potential to enhance diagnostic precision and patient safety in clinical settings.

Author Contributions

Conceptualization: R.D., S.A. and A.S.B. Methodology: A.S.B. Resources: G.G. and S.A. Data Curation: R.D., S.G., S.W., P.G. and J.M.B. Formal Analysis: R.D. Investigation: R.D. Validation: H.A. and P.G. Visualization: R.D. Project Administration: R.D. and S.A. Supervision: S.A., Konstantin Nikolaou. Writing—Original Draft Preparation: R.D. Writing—Review and Editing: R.D., A.S.B., G.G., H.A., J.M.B., S.G., P.G., S.W., K.N. and S.A. All authors have read and agreed to the published version of the manuscript.

Funding

This research received no external funding.

Institutional Review Board Statement

The study was conducted according to the guidelines of the Declaration of Helsinki and approved by the Institutional Review Board of the university hospital of Tuebingen (#167/2020BO2).

Informed Consent Statement

Patient consent was waived due to retrospective data acquisition.

Data Availability Statement

The data that support the findings of this study are available from University Hospital Tuebingen, but restrictions apply to the availability of these data, which were used under license for the current study and are not publicly available. However, the data can be made available from the authors upon reasonable request and with the permission of University Hospital Tuebingen and the approval of the Ethics Commission.

Acknowledgments

We acknowledge support by the Open Access Publishing Fund of the University of Tübingen.

Conflicts of Interest

The authors declare that they have no conflicts of interest.

Abbreviations

PHPortal hypertension
CLDChronic liver disease
TIPSSTransjugular intrahepatic portosystemic shunt
CBCTCone-beam CT
FOVField of view
CNRContrast-to-Noise Ratio
AIArtificial Intelligence
BMIBody mass index
AIDAI denoising
ROIRegions of interest
HUHounsfield Units
SDStandard Deviation
OriginalOriginal reconstruction
DAPDose area product
CNNConvolutional neural network

References

  1. Mauro, E.; Gadano, A. What’s new in portal hypertension? Liver Int. Off. J. Int. Assoc. Study Liver 2020, 40 (Suppl. 1), 122–127. [Google Scholar] [CrossRef] [PubMed]
  2. Ketelsen, D.; Groezinger, G.; Maurer, M.; Lauer, U.M.; Grosse, U.; Horger, M.; Nikolaou, K.; Syha, R. Three-dimensional C-arm CT-guided transjugular intrahepatic portosystemic shunt placement: Feasibility, technical success and procedural time. Eur. Radiol. 2016, 26, 4277–4283. [Google Scholar] [CrossRef] [PubMed]
  3. Vizzutti, F.; Schepis, F.; Arena, U.; Fanelli, F.; Gitto, S.; Aspite, S.; Turco, L.; Dragoni, G.; Laffi, G.; Marra, F. Transjugular intrahepatic portosystemic shunt (TIPS): Current indications and strategies to improve the outcomes. Intern. Emerg. Med. 2020, 15, 37–48. [Google Scholar] [CrossRef] [PubMed]
  4. Fidelman, N.; Kwan, S.W.; LaBerge, J.M.; Gordon, R.L.; Ring, E.J.; Kerlan, R.K. The transjugular intrahepatic portosystemic shunt: An update. Am. J. Roentgenol. 2012, 199, 746–755. [Google Scholar] [CrossRef]
  5. Rossle, M.; Haag, K.; Ochs, A.; Sellinger, M.; Noldge, G.; Perarnau, J.-M.; Berger, E.; Blum, U.; Gabelmann, A.; Hauenstein, K.; et al. The transjugular intrahepatic portosystemic stent-shunt procedure for variceal bleeding. N. Engl. J. Med. 1994, 330, 165–171. [Google Scholar] [CrossRef]
  6. Floridi, C.; Radaelli, A.; Abi-Jaoudeh, N.; Grass, M.; De Lin, M.; Chiaradia, M.; Geschwind, J.F.; Kobeiter, H.; Squillaci, E.; Maleux, G.; et al. C-arm cone-beam computed tomography in interventional oncology: Technical aspects and clinical applications. La Radiol. Medica 2014, 119, 521–532. [Google Scholar] [CrossRef] [PubMed]
  7. Böning, G.; Lüdemann, W.M.; Chapiro, J.; Jonczyk, M.; Hamm, B.; Günther, R.W.; Gebauer, B.; Streitparth, F. Clinical Experience with Real-Time 3-D Guidance Based on C-Arm-Acquired Cone-Beam CT (CBCT) in Transjugular Intrahepatic Portosystemic Stent Shunt (TIPSS) Placement. Cardiovasc. Interv. Radiol. 2018, 41, 1035–1042. [Google Scholar] [CrossRef]
  8. Braak, S.; Meijer, E.; Mali, W. Operator Radiation Exposure in Cone-Beam Computed Tomography Guidance. J. Belg. Soc. Radiol. 2016, 100, 140. [Google Scholar]
  9. Estler, A.; Herrmann, J.; Artzner, C.; Hoffmann, R.; Nikolaou, K.; Hepp, T.; Grosse, U.; Schempf, U.; Seith, F.; Groezinger, G. Use of Cone-Beam Computed Tomography (CBCT) for Targeting the Portal Vein in Transjugular Intrahepatic Portosystemic Shunt (TIPS) Procedures: Comparison of Low-Dose with Standard-Dose CBCT. Iran. J. Radiol. 2021, 18, 111704. [Google Scholar] [CrossRef]
  10. Brendlin, A.S.; Estler, A.; Plajer, D.; Lutz, A.; Grözinger, G.; Bongers, M.N.; Tsiflikas, I.; Afat, S.; Artzner, C.P. AI Denoising Significantly Enhances Image Quality and Diagnostic Confidence in Interventional Cone-Beam Computed Tomography. Tomography 2022, 8, 933–947. [Google Scholar] [CrossRef]
  11. Hong, J.H.; Park, E.-A.; Lee, W.; Ahn, C.; Kim, J.-H. Incremental Image Noise Reduction in Coronary CT Angiography Using a Deep Learning-Based Technique with Iterative Reconstruction. Korean J. Radiol. 2020, 21, 1165–1177. [Google Scholar] [CrossRef] [PubMed]
  12. Schindelin, J.; Arganda-Carreras, I.; Frise, E.; Kaynig, V.; Longair, M.; Pietzsch, T.; Preibisch, S.; Rueden, C.; Saalfeld, S.; Schmid, B.; et al. Fiji: An open-source platform for biological-image analysis. Nat. Methods 2012, 9, 676–682. [Google Scholar] [CrossRef]
  13. Brendlin, A.S.; Dehdab, R.; Stenzl, B.; Mueck, J.; Ghibes, P.; Groezinger, G.; Kim, J.; Afat, S.; Artzner, C. Novel Deep Learning Denoising Enhances Image Quality and Lowers Radiation Exposure in Interventional Bronchial Artery Embolization Cone Beam CT. Acad. Radiol. 2023, 30, 2144–2155. [Google Scholar] [CrossRef] [PubMed]
  14. Choi, K.; Kim, S.H.; Kim, S. Self-supervised denoising of projection data for low-dose cone-beam CT. Med. Phys. 2023, 50, 6319–6333. [Google Scholar] [CrossRef] [PubMed]
  15. Mahmoudi, S.; Lange, M.; Lenga, L.; Yel, I.; Koch, V.; Booz, C.; Martin, S.; Bernatz, S.; Vogl, T.; Albrecht, M.; et al. Salvaging low contrast abdominal CT studies using noise-optimised virtual monoenergetic image reconstruction. BJR Open 2022, 4, 20220006. [Google Scholar] [CrossRef]
  16. Lau, B.K.F.; Dillon, O.; Vinod, S.K.; O’Brien, R.T.; Reynolds, T. Faster and lower dose imaging: Evaluating adaptive, constant gantry velocity and angular separation in fast low-dose 4D cone beam CT imaging. Med. Phys. 2024, 51, 1364–1382. [Google Scholar] [CrossRef]
  17. Yuasa, Y.; Shiinoki, T.; Fujimoto, K.; Hanazawa, H.; Uehara, T.; Koike, M.; Shibuya, K. Effect of gantry speed on accuracy of extracted target motion trajectories and image quality in 4D-CBCT: Phantom study. Biomed. Phys. Eng. Express 2017, 3, 067001. [Google Scholar] [CrossRef]
  18. Kember, S.A.; Hansen, V.N.; Fast, M.F.; Nill, S.; McDonald, F.; Ahmed, M.; Thomas, K.; McNair, H.A. Evaluation of three presets for four-dimensional cone beam CT in lung radiotherapy verification by visual grading analysis. Br. J. Radiol. 2016, 89, 20150933. [Google Scholar] [CrossRef]
  19. Zhao, X.; Du, Y.; Yue, H.; Wang, R.; Zhou, S.; Wu, H.; Wang, W.; Peng, Y. Deep learning-based projection synthesis for low-dose conebeam computed tomography imaging in image-guided radiotherapy. Quant. Imaging Med. Surg. 2024, 14, 231–250. [Google Scholar] [CrossRef]
  20. Beaudry, J.; Esquinas, P.L.; Shieh, C.-C. Learning from our neighbours: A novel approach on sinogram completion using bin-sharing and deep learning to reconstruct high quality 4DCBCT. In Proceedings of the Medical Imaging 2019: Physics of Medical Imaging, San Diego, CA, USA, 17–20 February 2019; Volume 10948, pp. 1025–1035. [Google Scholar] [CrossRef]
  21. Lee, D.; Kim, K.; Kim, W.; Kang, S.; Park, C.; Cho, H.; Lim, Y.; Kim, G.; Park, S.; Lim, H.; et al. Four-Dimensional CBCT Reconstruction Based on a Residual Convolutional Neural Network for Improving Image Quality. J. Korean Phys. Soc. 2019, 75, 73–79. [Google Scholar] [CrossRef]
  22. Jiang, Z.; Zhang, Z.; Chang, Y.; Ge, Y.; Yin, F.-F.; Ren, L. Enhancement of 4-D Cone-Beam Computed Tomography (4D-CBCT) Using a Dual-Encoder Convolutional Neural Network (DeCNN). IEEE Trans. Radiat. Plasma Med. Sci. 2022, 6, 222–230. [Google Scholar] [CrossRef] [PubMed]
  23. Qu, H.; Liu, K.; Zhang, L. Research on improved black widow algorithm for medical image denoising. Sci. Rep. 2024, 14, 2514. [Google Scholar] [CrossRef] [PubMed]
Figure 1. Study workflow.
Diagnostics 14 01989 g001
Figure 2. Correlation of CBCT Acquisition Duration with DAP.
Diagnostics 14 01989 g002
Figure 3. Distribution of Contrast Levels and Pairwise Comparisons Across Acquisition Times. ns = no statistically significant difference.
Diagnostics 14 01989 g003
Figure 4. Distribution of Mean Noise Levels and Pairwise Comparisons Across Acquisition Times. ns = no statistically significant difference. **** = statistically significant difference.
Diagnostics 14 01989 g004
Figure 5. Distribution of CNR Levels and Pairwise Comparisons Across Acquisition Times. ns = no statistically significant difference. **** = statistically significant difference.
Diagnostics 14 01989 g005
Figure 6. (ad): Scatter dot plot of Mean Subjective Quality Scores Across 6 s and 3 s Acquisitions, assessing overall quality (a), contrast (b), sharpness (c), and motion artifacts (d). ns = no statistically significant difference. **** = statistically significant difference.
Diagnostics 14 01989 g006aDiagnostics 14 01989 g006b
Figure 7. Representative TIPSS-CBCT Images: Noticeable Image Quality Enhancement with Minimized Noise and Motion Artifacts in the AID Series, Resulting in Superior Definition of the Portal vein.
Diagnostics 14 01989 g007
Table 1. Image acquisition and the study population’s metrics.
SexDatasetnAgeHeightWeightDAPBMI
Female3 s940.89 ± 19.93160.44 ± 8.1362.44 ± 12.102368.11 ± 501.4124.23 ± 3.88
6 s1153.91 ± 16.78165.82 ± 4.5659.55 ± 7.614678.56 ± 644.7421.67 ± 2.86
Overall2048.05 ± 18.97163.40 ± 6.8060.85 ± 9.713638.86 ± 1309.7322.82 ± 3.51
Male3 s1354.23 ± 22.97172.39 ± 18.7270.80 ± 19.972615.11 ± 801.4823.09 ± 4.36
6 s1151.27 ± 20.45165.55 ± 23.4274.51 ± 23.815598.44 ± 1675.9926.42 ± 6.87
Overall2452.88 ± 21.43169.25 ± 20.8272.50 ± 21.413982.47 ± 1965.2224.62 ± 5.77
Overall3 s2248.77 ± 22.32167.50 ± 16.1767.38 ± 17.362514.06 ± 691.5923.56 ± 4.12
6 s2252.59 ± 18.31165.68 ± 16.4767.03 ± 18.875138.50 ± 1325.5724.05 ± 5.68
Overall4450.68 ± 20.26166.59 ± 16.1667.20 ± 17.923826.28 ± 1689.2923.80 ± 4.91
DAP: Dose area product.
Table 2. Objective Metrics for Image Quality Assessment and Adjusted Two-Tailed Pairwise Comparisons.
ParameterDatasetReconstructionMean ± SDAdjusted Two-Tailed Pairwise Comparisons (p)
3 s-AID3 s-Original6 s-AID6 s-Original
CNR3 sAID3.81 ± 0.86n/a<0.0001<0.00010.9968
Original2.15 ± 0.40<0.0001n/a<0.0001<0.0001
6 sAID6.45 ± 1.23<0.0001<0.0001n/a<0.0001
Original3.65 ± 0.670.9968<0.0001<0.0001n/a
Contrast3 sAID190.99 ± 44.69n/a>0.9999>0.99990.9998
Original191.91 ± 42.94>0.9999n/a>0.9999>0.9999
6 sAID195.16 ± 35.88>0.9999>0.9999n/a0.9554
Original200.34 ± 38.670.9998>0.99990.9554n/a
Mean Noise3 sAID51.23 ± 12.11n/a<0.0001<0.00010.9423
Original89.64 ± 14.44<0.0001n/a<0.0001<0.0001
6 sAID30.59 ± 4.60<0.0001<0.0001n/a<0.0001
Original55.18 ± 7.060.9423<0.0001<0.0001n/a
Parameter: Contrast = Denoting the difference in Hounsfield Units (HU) between relevant areas; Mean noise = denoting mean noise; CNR = contrast-to-noise ratio; Datasets: 3 s = 3 seconds, 6 s = 6 seconds, AID = AI denoising; SD = standard deviation; p = denoting significance level. n/a = not applicable.
Table 3. Assessments Per Rater and Consistency Across Raters (Spearman’s Rho).
ParameterRunReconstructionRater 1
Mean ± SD
Rater 2
Mean ± SD
Spearman’s Rho
Overall Subjective image quality3 sAID0.011 ± 0.7500.023 ± 0.7580.990
Original−0.750 ± 0.435−0.750 ± 0.4351
6 sAID0.750 ± 0.4350.750 ± 0.4351
Original−0.023 ± 0.758−0.034 ± 0.7650.990
Contrast3 sAID−0.023 ± 0.758−0.034 ± 0.7650.990
Original−0.750 ± 0.435−0.750 ± 0.4351
6 sAID0.750 ± 0.4350.750 ± 0.4351
Original0.045 ± 0.7570.057 ± 0.7640.990
Motion Artifacts3 sAID0.557 ± 0.5220.580 ± 0.5190.954
Original0.330 ± 0.6560.330 ± 0.6900.888
6 sAID−0.352 ± 0.644−0.409 ± 0.6000.839
Original−0.580 ± 0.496−0.545 ± 0.5010.794
Sharpness3 sAID0.023 ± 0.7270.011 ± 0.7350.990
Original−0.750 ± 0.435−0.750 ± 0.4351
6 sAID0.750 ± 0.4350.750 ± 0.4351
Original−0.023 ± 0.727−0.011 ± 0.7350.990
AID = AI denoising; SD = standard deviation;
Table 4. Subjective image quality metrics and adjusted two-tailed pairwise comparisons.
ParameterDatasetReconMean ± SDAdjusted Two-Tailed Pairwise Comparisons (p)
3 s AID3 s Original6 s AID6 s Original
Overall Subjective image quality3 sAID0.017 ± 0.752n/a<0.0001<0.0001>0.9999
Original−0.750 ± 0.435<0.0001n/a<0.0001<0.0001
6 sAID0.750 ± 0.435<0.0001<0.0001n/a<0.0001
Original−0.028 ± 0.759>0.9999<0.0001<0.0001n/a
Contrast3 sAID−0.028 ± 0.759n/a<0.0001<0.00010.9971
Original−0.750 ± 0.435<0.0001n/a<0.0001<0.0001
6 sAID0.750 ± 0.435<0.0001<0.0001n/a<0.0001
Original0.051 ± 0.7580.9971<0.0001<0.0001n/a
Motion Artifacts3 sAID0.568 ± 0.515n/a0.0751<0.0001<0.0001
Original0.330 ± 0.6560.0751n/a<0.0001<0.0001
6 sAID−0.381 ± 0.587<0.0001<0.0001n/a0.1182
Original−0.562 ± 0.472<0.0001<0.00010.1182n/a
Sharpness3 sAID0.017 ± 0.729n/a<0.0001<0.00010.9994
Original−0.750 ± 0.435<0.0001n/a<0.0001<0.0001
6 sAID0.750 ± 0.435<0.0001<0.0001n/a<0.0001
Original−0.017 ± 0.7290.9994<0.0001<0.0001n/a
Datasets: 3 s = 3 s, 6 s = 6 seconds, AID = AI denoising; SD = standard deviation, n/a = not applicable; p = denoting significance level.
Disclaimer/Publisher’s Note: The statements, opinions and data contained in all publications are solely those of the individual author(s) and contributor(s) and not of MDPI and/or the editor(s). MDPI and/or the editor(s) disclaim responsibility for any injury to people or property resulting from any ideas, methods, instructions or products referred to in the content.

