
Evaluation of the Microscanner C3 for Automated Cell Counting in Cerebrospinal Fluid Analysis

 , ,
, ,  and
and
Abstract
1. Introduction
2. Materials and Methods
2.1. Sample Collection and Study Design
2.2. Manufacturing Quality Control Materials for CSF Cell Counting
2.3. CSF Cell Counting via Microscanner C3
2.4. CSF Cell Counting via Neubauer Chamber
2.5. CSF Cell Counting via Flow Cytometry
2.6. Performance Evaluation of Microscanner C3
2.7. Statistical Analysis
3. Results
3.1. Linearity
3.2. Limit of Blank and Limit of Detection
3.3. Precision
3.4. Clinical Sample Results
4. Discussion
5. Conclusions
Author Contributions
Funding
Institutional Review Board Statement
Informed Consent Statement
Data Availability Statement
Conflicts of Interest
References
- Shahan, B.; Choi, E.Y.; Nieves, G. Cerebrospinal Fluid Analysis. Am. Fam. Physician 2021, 103, 422–428. [Google Scholar] [PubMed]
- Fleming, C.; Russcher, H.; Lindemans, J.; Jonge, R. Clinical relevance and contemporary methods for counting blood cells in body fluids suspected of inflammatory disease. Clin. Chem. Lab. Med. 2015, 53, 1689–1706. [Google Scholar] [CrossRef]
- Otto, F.; Harrer, C.; Pilz, G.; Wipfler, P.; Harrer, A. Role and Relevance of Cerebrospinal Fluid Cells in Diagnostics and Research: State-of-the-Art and Underutilized Opportunities. Diagnostics 2021, 12, 79. [Google Scholar] [CrossRef] [PubMed]
- Lindner, A.; Berek, K.; Rass, V.; Pauli, F.D.; Kofler, M.; Zinganell, A.; Putnina, L.; Kindl, P.; Schiefecker, A.J.; Pfausler, B.; et al. Lower initial red blood cell count in cerebrospinal fluid predicts good functional outcome in patients with spontaneous subarachnoid haemorrhage. Eur. J. Neurol. 2023, 30, 2315–2323. [Google Scholar] [CrossRef] [PubMed]
- Sandhaus, L.M.; Ciarlini, P.; Kidric, D.; Dillman, C.; O’Riordan, M. Automated cerebrospinal fluid cell counts using the Sysmex XE-5000: Is it time for new reference ranges? Am. J. Clin. Pathol. 2010, 134, 734–738. [Google Scholar] [CrossRef]
- Barnes, P.W.; Eby, C.S.; Shimer, G. An evaluation of the utility of performing body fluid counts on the coulter LH 750. Lab. Hematol. 2004, 10, 127–131. [Google Scholar] [CrossRef]
- Zimmermann, M.; Ruprecht, K.; Kainzinger, F.; Heppner, F.L.; Weimann, A. Automated vs. manual cerebrospinal fluid cell counts: A work and cost analysis comparing the Sysmex XE-5000 and the Fuchs-Rosenthal manual counting chamber. Int. J. Lab. Hematol. 2011, 33, 629–637. [Google Scholar] [CrossRef]
- Bottini, P.V.; Pompeo, D.B.; Souza, M.I.; Garlipp, C.R. Comparison between automated and microscopic analysis in body fluids cytology. Int. J. Lab. Hematol. 2015, 37, e16–e18. [Google Scholar] [CrossRef]
- Sandhaus, L.M.; Dillman, C.A.; Hinkle, W.P.; MacKenzie, J.M.; Hong, G. A New Automated Technology for Cerebrospinal Fluid Cell Counts: Comparison of Accuracy and Clinical Impact of GloCyte, Sysmex XN, and Manual Methods. Am. J. Clin. Pathol. 2017, 147, 507–514. [Google Scholar] [CrossRef]
- Waldrop, G.E.; Cocuzzo, K.; Schneider, C.L.; Kim, C.Y.; Goetz, T.G.; Chomba, M.S.; Delaurentis, C.E.; Smithgall, M.C.; Francis, R.O.; Thakur, K.T. Accuracy of automated analyzers for the estimation of CSF cell counts: A systematic review and meta-analysis. Int. J. Lab. Hematol. 2024, 46, 234–242. [Google Scholar] [CrossRef]
- Wick, M.; Gross, C.; Tumani, H.; Wildemann, B.; Stangel, M.; On Behalf of the German Society of CSF Diagnostics and Clinical Neurochemistry Dgln E V. Automated Analysis of Cerebrospinal Fluid Cells Using Commercially Available Blood Cell Analysis Devices-A Critical Appraisal. Cells 2021, 10, 1232. [Google Scholar] [CrossRef]
- Fleming, C.; Russcher, H.; Brouwer, R.; Lindemans, J.; Jonge, R. Evaluation of Sysmex XN-1000 High-Sensitive Analysis (hsA) Research Mode for Counting and Differentiating Cells in Cerebrospinal Fluid. Am. J. Clin. Pathol. 2016, 145, 299–307. [Google Scholar] [CrossRef] [PubMed]
- Luo, J.; Chen, C.; Li, Q. White blood cell counting at point-of-care testing: A review. Electrophoresis 2020, 41, 1450–1468. [Google Scholar] [CrossRef] [PubMed]
- Mukherjee, M.; Kamarujjaman; Maitra, M. Application of Biomedical Image Processing in Blood Cell Counting Using Hough Transform. In Biometrics: Concepts, Methodologies, Tools, and Applications, 1st ed.; IGI Global: Hershey, PA, USA, 2017; pp. 1175–1194. [Google Scholar] [CrossRef]
- Stark, J.A. Adaptive Image Contrast Enhancement Using Generalizations of Histogram Equalization. IEEE Trans. Image Process. 2000, 9, 889–896. [Google Scholar] [CrossRef]
- Dhal, K.G.; Das, A.; Ray, S.; Gálvez, J.; Das, S. Histogram Equalization Variants as Optimization Problems: A Review. Arch. Computat. Methods Eng. 2021, 28, 1471–1496. [Google Scholar] [CrossRef]
- He, L.; Ren, X.; Gao, Q.; Zhao, X.; Yao, B.; Chao, Y. The Connected-Component Labeling Problem: A Review of State-of-the-Art Algorithms. Pattern Recognit. 2017, 70, 25–43. [Google Scholar] [CrossRef]
- Bourner, G.; Salle, B.D.; George, T.; Tabe, Y.; Baum, H.; Culp, N.; Keng, T.B.; International Committee for Standardization in Hematology (ICSH). ICSH guidelines for the verification and performance of automated cell counters for body fluids. Int. J. Lab. Hematol. 2014, 36, 598–612. [Google Scholar] [CrossRef]
- CLSI Document EP06-A; Evaluation of the Linearity of Quantitative Measurement Procedures: A Statistical Approach. Approved Guideline. Clinical and Laboratory Standards Institute: Wayne, PA, USA, 2003.
- CLSI Document EP17-A2; Evaluation of Detection Capability for Clinical Laboratory Measurement Procedures. Approved Guideline. 2nd ed. Clinical and Laboratory Standards Institute: Wayne, PA, USA, 2012.
- CLSI Document EP15-A2; User Verification of Performance for Precision and Trueness. Approved Guideline. 2nd ed. Clinical and Laboratory Standards Institute: Wayne, PA, USA, 2006.
- CLSI Document EP09-A3; Measurement Procedure Comparison and Bias Estimation Using Patient Samples. Approved Guideline. 2nd ed. Clinical and Laboratory Standards Institute: Wayne, PA, USA, 2013.
- Lee, Y.; Kim, B.; Choi, S. On-Chip Cell Staining and Counting Platform for the Rapid Detection of Blood Cells in Cerebrospinal Fluid. Sensors 2018, 18, 1124. [Google Scholar] [CrossRef]
- Lu, Q.; Chu, K.; Dou, H.; Smith, Z.J. A sample-preparation-free, automated, sample-to-answer system for cell counting in human body fluids. Anal. Bioanal. Chem. 2021, 413, 5025–5035. [Google Scholar] [CrossRef]
- Verbrugge, S.E.; Huisman, A. Verification and standardization of blood cell counters for routine clinical laboratory tests. Clin. Lab. Med. 2015, 35, 183–196. [Google Scholar] [CrossRef]
- Yoon, J.; Jang, W.S.; Nam, J.; Mihn, D.-C.; Lim, C.S. An Automated Microscopic Malaria Parasite Detection System Using Digital Image Analysis. Diagnostics 2021, 11, 527. [Google Scholar] [CrossRef] [PubMed]
- Park, I.; Jang, W.S.; Lim, C.S.; Kim, J. Evaluation of Pre-Transfusion Crossmatch Test Using Microscanner C3. Diagnostics 2024, 14, 1231. [Google Scholar] [CrossRef] [PubMed]
- Jang, W.S.; Lee, J.; Park, S.; Lim, C.S.; Kim, J. Performance Evaluation of Microscanner Plus, an Automated Image-Based Cell Counter, for Counting CD4+ T Lymphocytes in HIV Patients. Diagnostics 2023, 14, 73. [Google Scholar] [CrossRef] [PubMed]


| WBC (Cells × 106/L) | RBC (Cells × 106/L) | ||
|---|---|---|---|
| Expected Value | Analyzed Mean ± SD | Expected Value | Analyzed Mean ± SD |
| 0.00 | 0 ± 0.0 | 0.00 | 0. ± 0.0 |
| 3.33 | 4 ± 1.7 | 3.67 | 4 ± 1.7 |
| 9.67 | 8 ± 1.7 | 34.00 | 25.33 ± 4.0 |
| 31.33 | 29 ± 5.2 | 68.33 | 59.67 ± 22.7 |
| 130.33 | 136 ± 6.9 | 141.00 | 107.33 ± 12.6 |
| 229.33 | 238 ± 9.0 | 213.67 | 233.33 ± 22.9 |
| 500.67 | 449 ± 85.7 | 460.33 | 414.33 ± 24.0 |
| Neubauer Chamber | Microscanner C3 | ||||
|---|---|---|---|---|---|
| WBC (Cells × 106/L) | Mean ± SD | CV% | WBC (Cells × 106/L) | Mean ± SD | CV% |
| 7 | 7.0 ± 4.3 | 60.82 | 7 | 6.9 ± 2.1 | 30.40 |
| 5.33 | 4.9 ± 3.2 | 66.32 | 5.33 | 5.6 ± 1.9 | 34.19 |
| 4.33 | 4.5 ± 3.1 | 69.29 | 4.33 | 4.2 ± 1.5 | 34.50 |
| 3.33 | 1.5 ± 1.7 | 113.43 | 3.33 | 3.8 ± 1.3 | 35.54 |
| 2.67 | 1.1 ± 1.5 | 134.40 | 2.67 | 1.5 ± 1.8 | 121.40 |
| 1.67 | 0.6 ± 1.4 | 220.05 | 1.67 | 0.9 ± 1.7 | 190.41 |
| 1 | 0 ± 0 | - | 1 | 0 ± 0 | - |
| 0.66 | 0 ± 0 | - | 0.66 | 0 ± 0 | - |
| RBC (cells × 106/L) | Mean ± SD | CV% | RBC (cells × 106/L) | Mean ± SD | CV% |
| 7.33 | 6.6 ± 2.6 | 38.99 | 7.33 | 7.1 ± 2.1 | 31.40 |
| 6 | 5.5 ± 2.3 | 41.28 | 6 | 6.2 ± 2.0 | 32.92 |
| 5 | 4.5 ± 2.1 | 46.85 | 5 | 4.5 ± 1.5 | 34.43 |
| 4.33 | 3.9 ± 2.6 | 67.53 | 4.33 | 4.2 ± 1.5 | 35.90 |
| 3.67 | 2.6 ± 1.9 | 71.03 | 3.67 | 3.9 ± 1.4 | 36.17 |
| 2.33 | 0.3 ± 1.0 | 326.24 | 2.33 | 0.9 ± 1.4 | 156.72 |
| 1.33 | 0 ± 0 | - | 1.33 | 0 ± 0 | - |
| 0.66 | 0 ± 0 | - | 0.66 | 0 ± 0 | - |
| WBC (Cells × 106/L) | 4 | 8 | 20 | 100 | 500 | 2000 | |
|---|---|---|---|---|---|---|---|
| Neubauer chamber | Mean ± SD | 3.6 ± 2.6 | 7.5 ± 4.5 | 17.9 ± 10.1 | 83.3 ± 40.8 | 516 ± 171.75 | 1833.3 ± 752.8 |
| CV% | 69.92 | 59.63 | 56.1 | 48.99 | 33.28 | 41.06 | |
| Microscanner C3 | Mean ± SD | 4.0 ± 1.6 | 6.5 ± 2.3 | 16.0 ± 5.3 | 73.5 ± 15.5 | 421.2 ± 95 | 1800.0 ± 328.6 |
| CV% | 38.73 | 34.74 | 32.83 | 21.09 | 22.56 | 18.26 | |
| Flow cytometer | Mean ± SD | 4.2 ± 0.8 | 8.7 ± 0.8 | 17.2 ± 1.5 | 91.5 ± 6.4 | 502.4 ± 30.7 | 1951.8 ± 54.7 |
| CV% | 18.07 | 9.42 | 8.57 | 6.94 | 6.19 | 2.8 | |
| RBC (cells × 106/L) | 3.01 | 15.04 | 75.2 | 376 | 1880 | 9400 | |
| Neubauer chamber | Mean ± SD | 3.3 ± 2.1 | 12.7 ± 4.1 | 101.7 ± 29.9 | 468.3 ± 90.2 | 2500.0 ± 429.0 | 13,666.7 ± 2294.9 |
| CV% | 61.97 | 32.61 | 29.45 | 19.26 | 17.16 | 16.79 | |
| Microscanner C3 | Mean ± SD | 3.5 ± 1.2 | 17.5 ± 4.0 | 70.5 ± 9.6 | 371.3 ± 41.1 | 1958.3 ± 196.2 | 8520.0 ± 571.8 |
| CV% | 34.99 | 22.79 | 13.57 | 11.08 | 10.02 | 6.71 | |
| Flow cytometer | Mean ± SD | 3.0 ± 0.6 | 12.2 ± 1.5 | 64.2 ± 5.8 | 367.2 ± 25.4 | 1988.3 ± 128.7 | 9827.7 ± 315.2 |
| CV% | 21.08 | 12.1 | 9.02 | 6.91 | 6.47 | 3.21 |
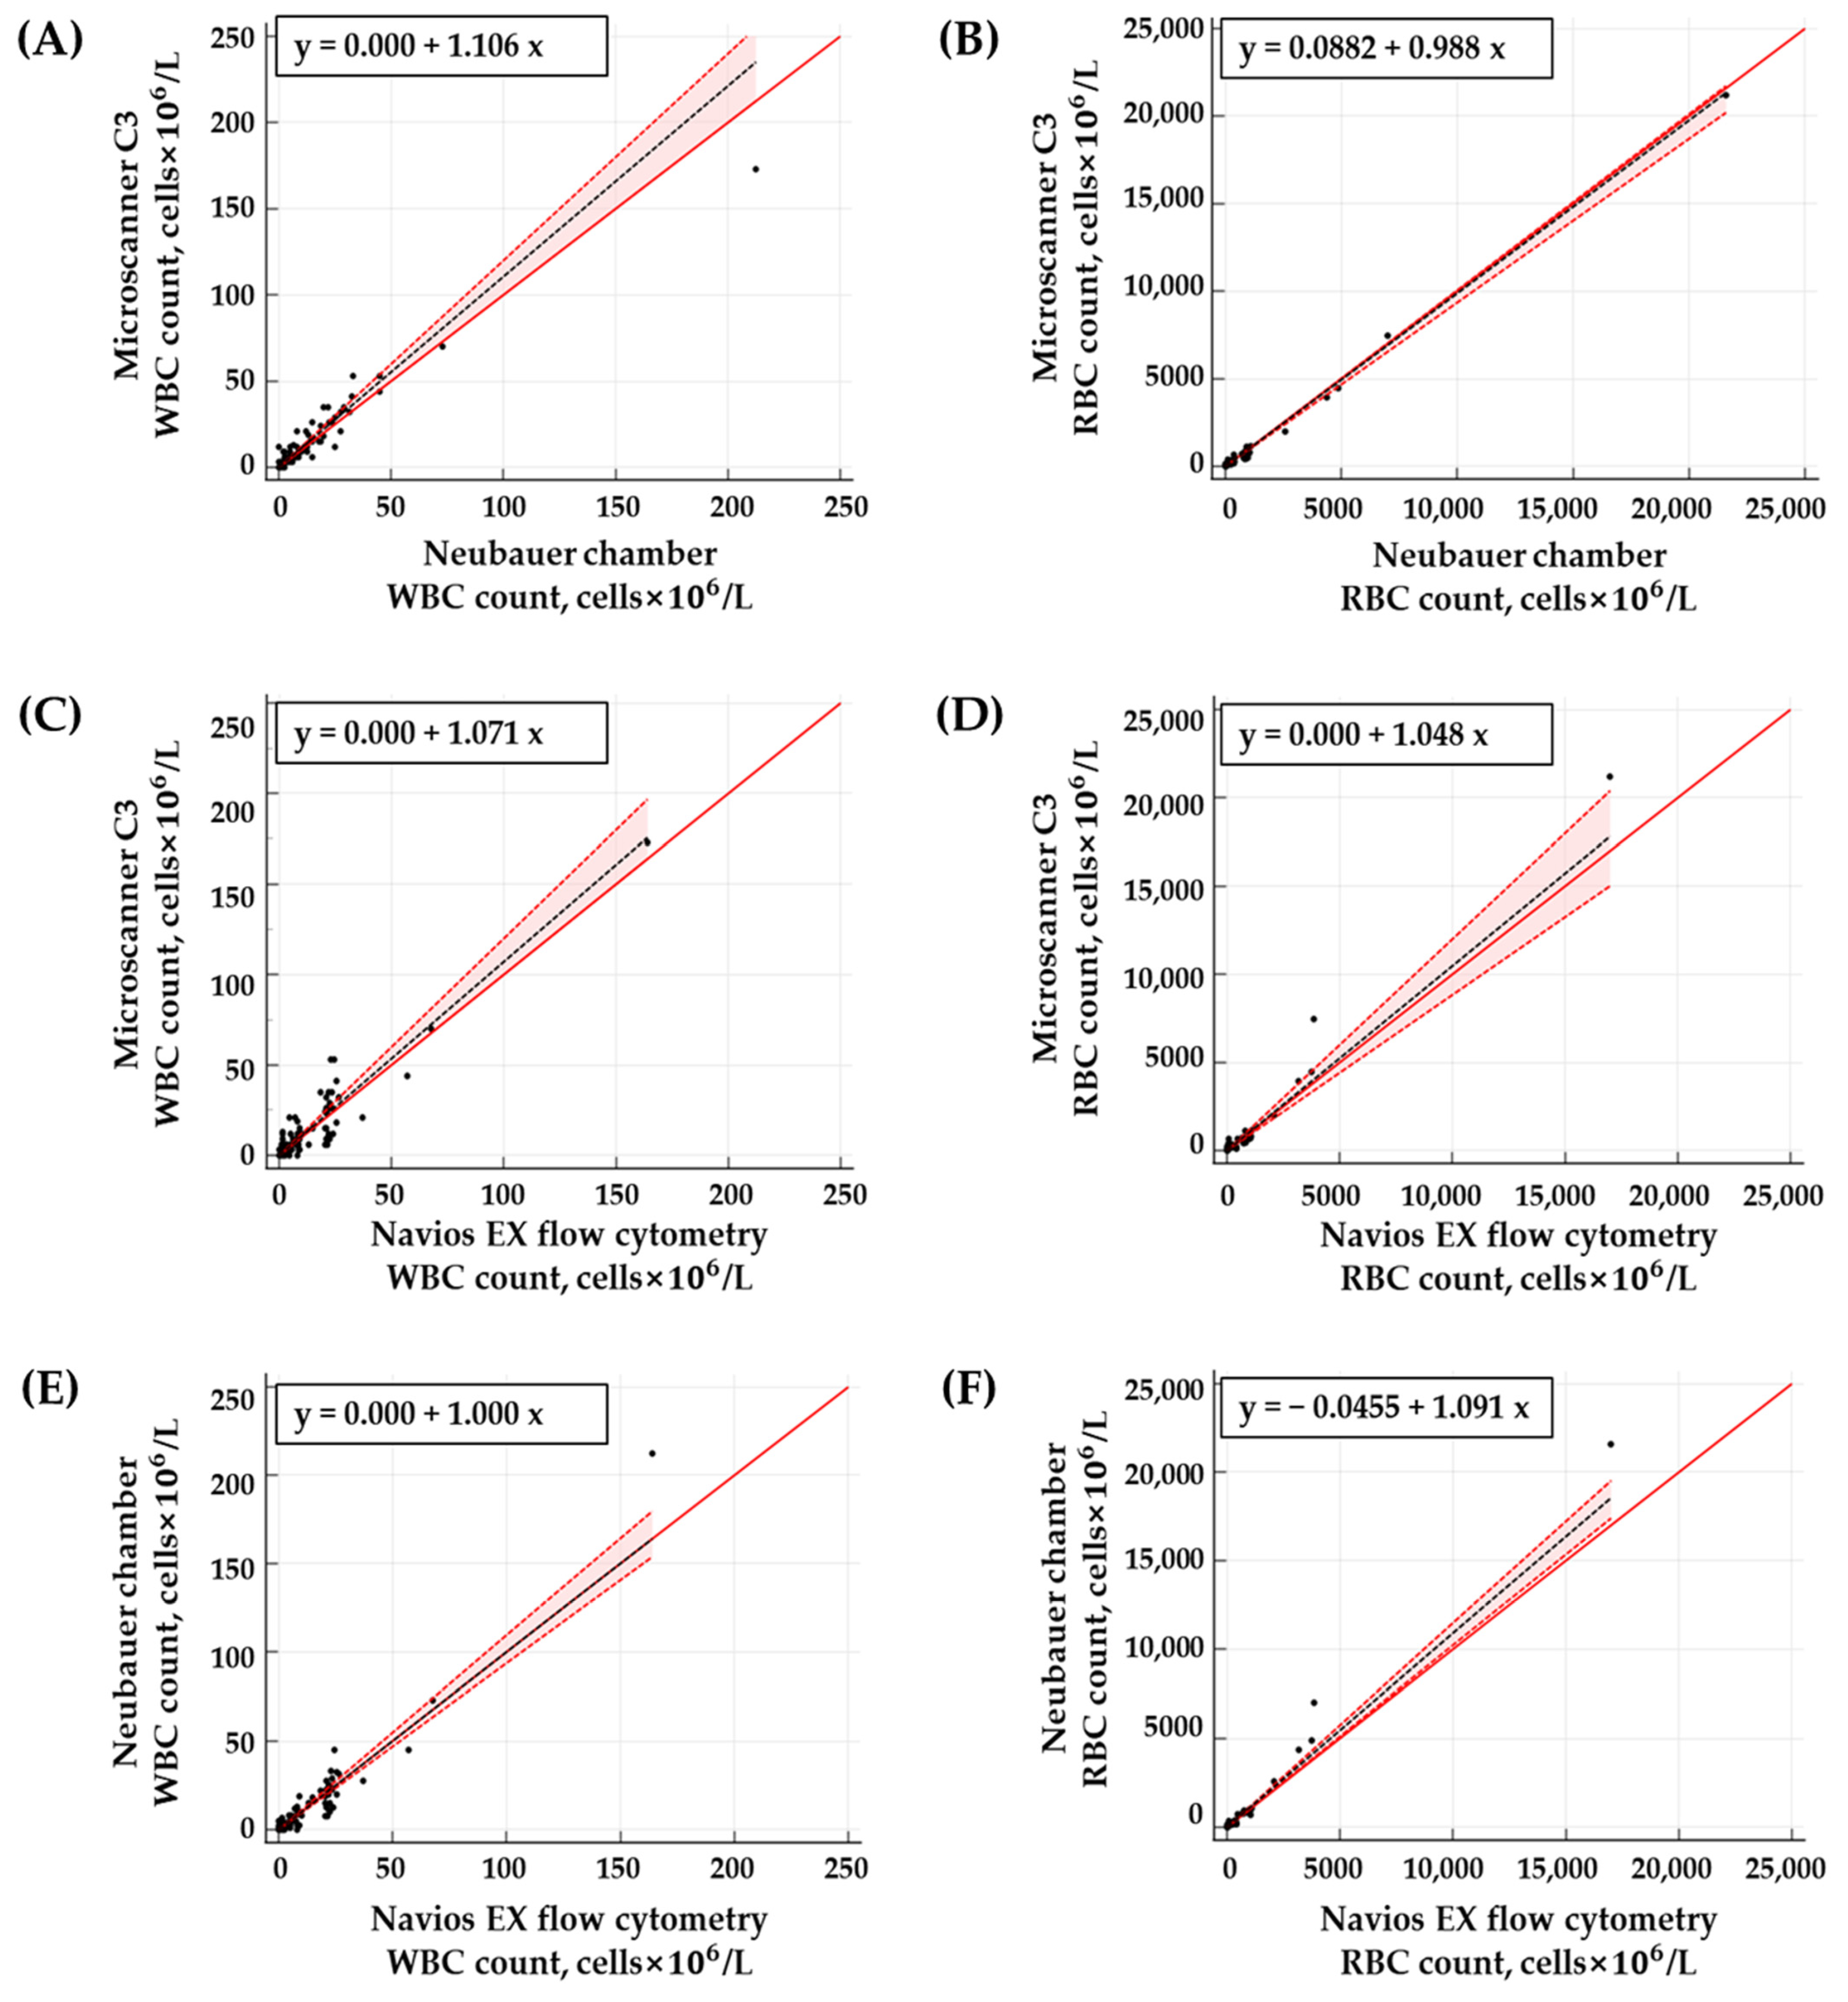
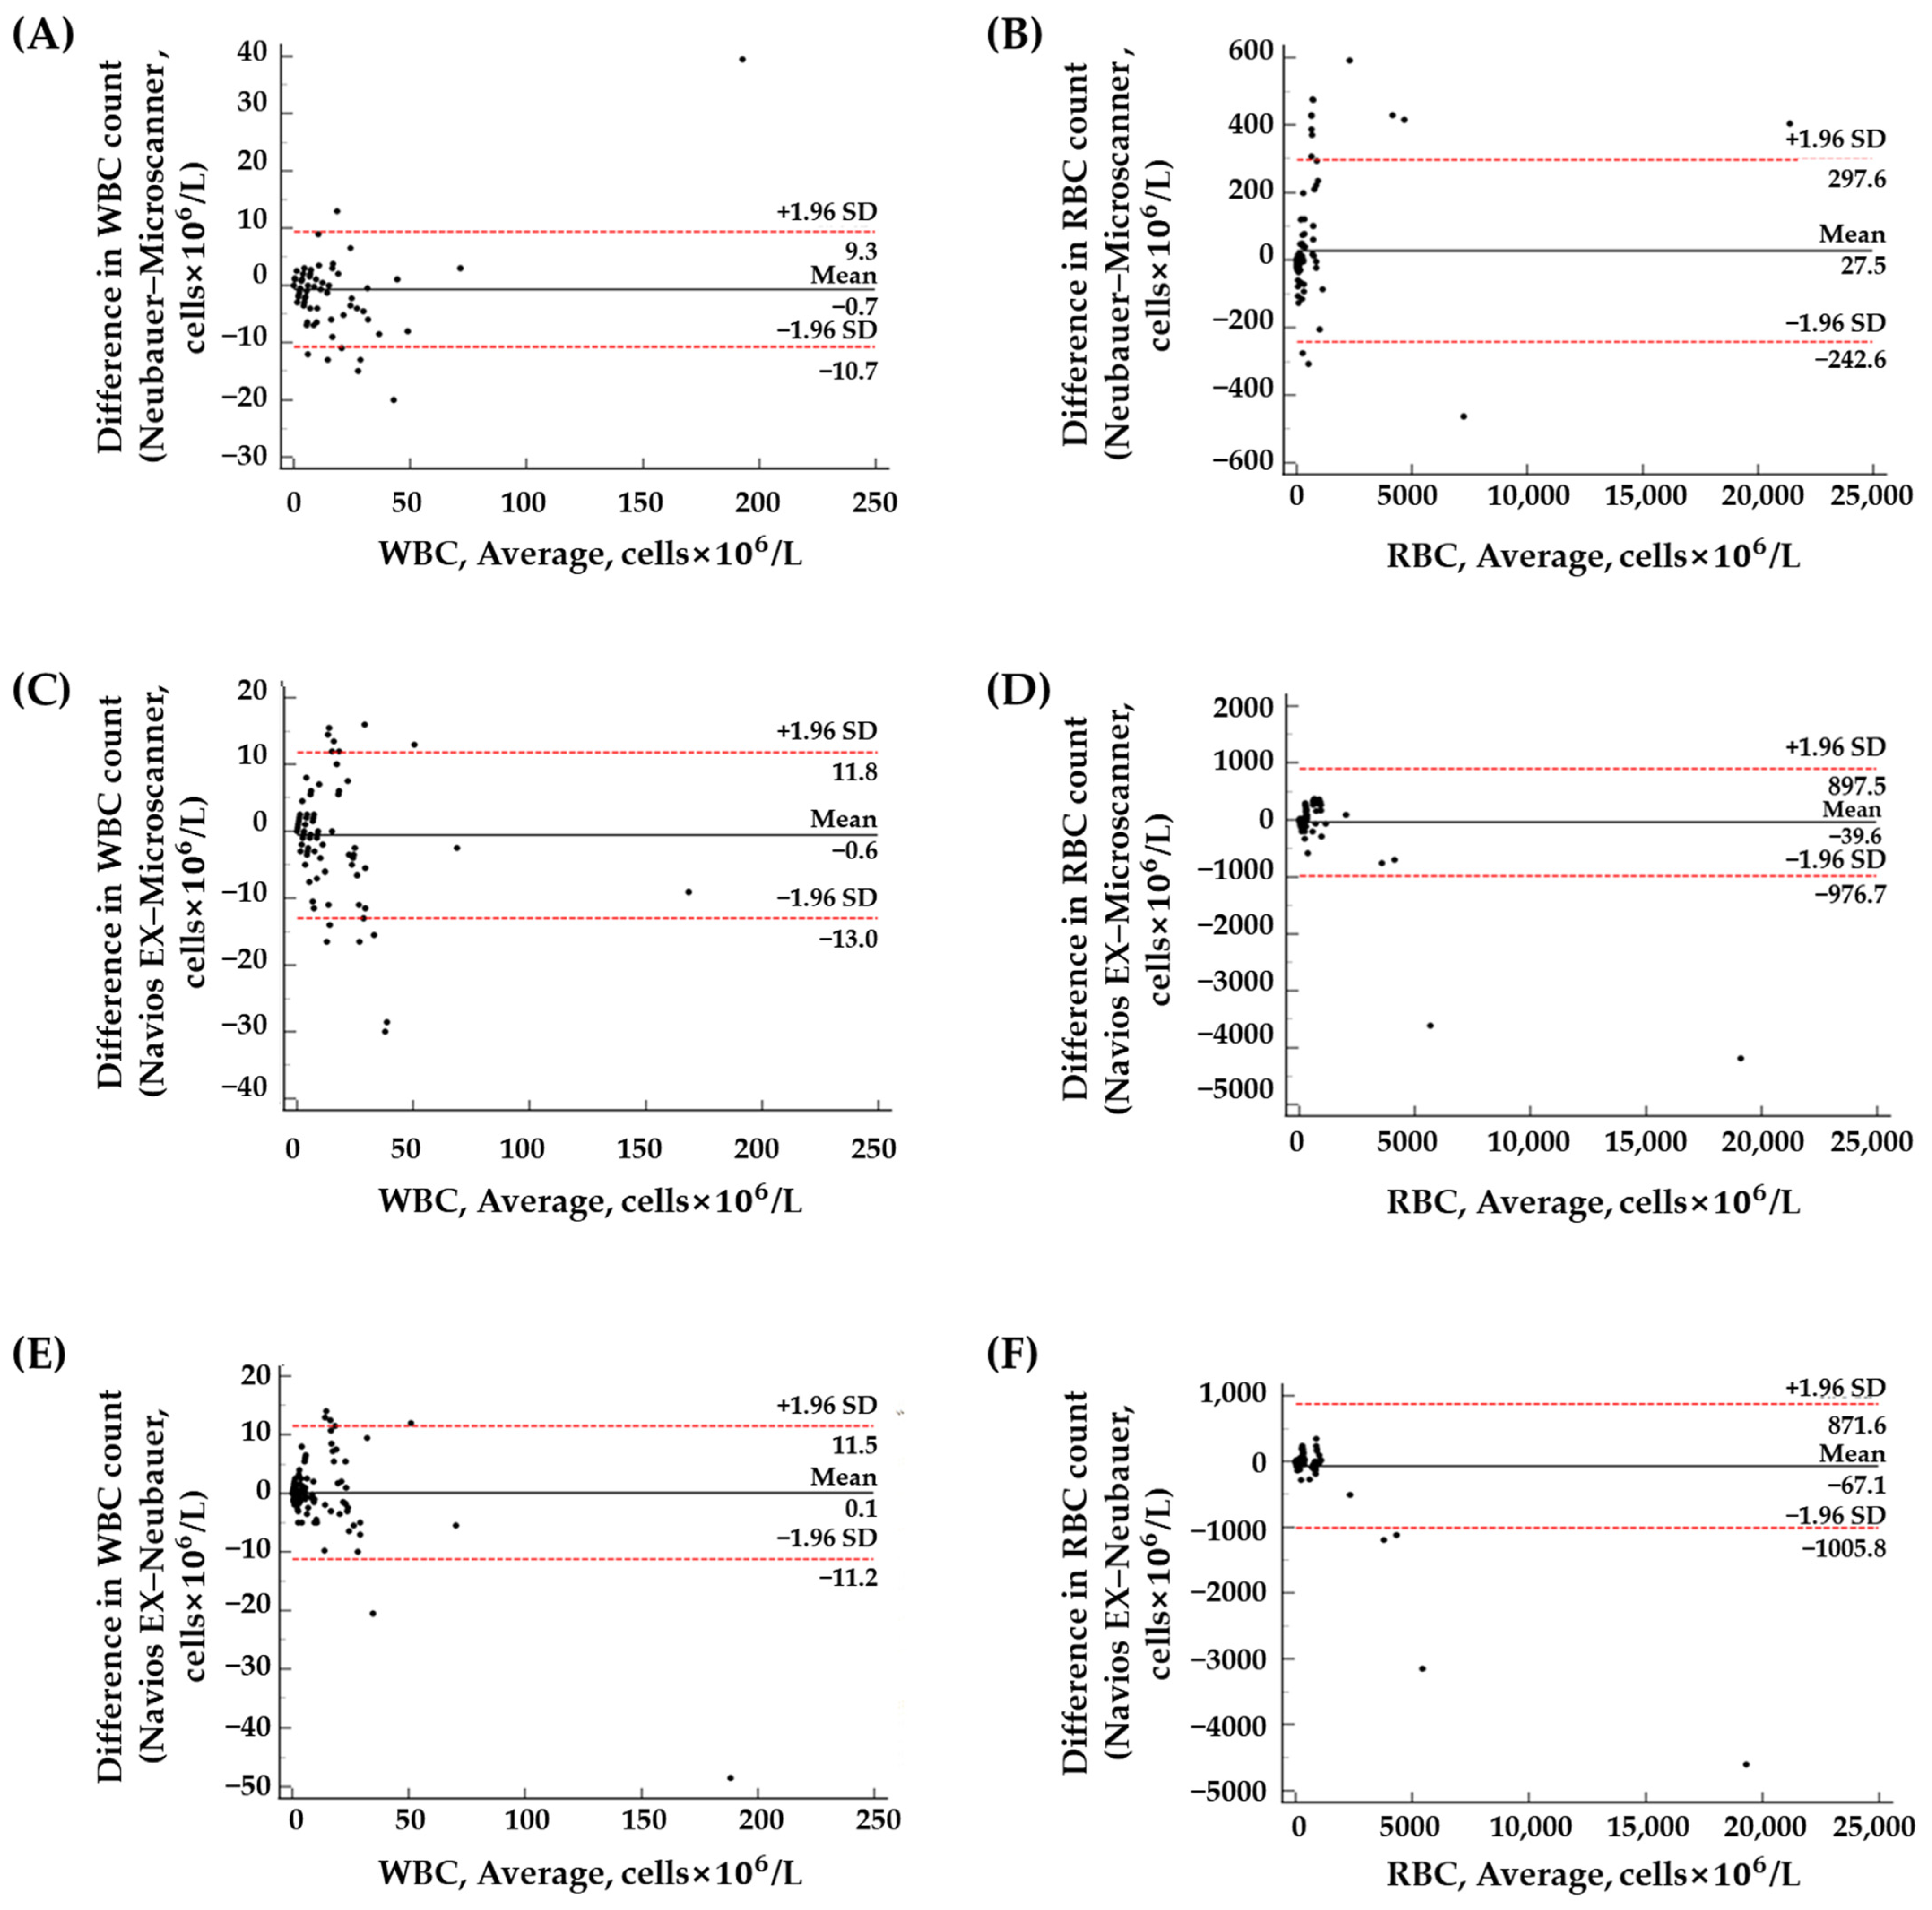
| Method | Cell | r2 Value | Passing–Bablok Regression | Bland–Altman Plot | ||
|---|---|---|---|---|---|---|
| Slope (95% CI) | Intercept (95% CI) | Mean Bias (95% CI) | Mean Bias ± 1.96 SD | |||
| NC vs. MS | WBC | 0.9377 | 1.11 (1.00~1.20) | 0.00 (0.00~0.00) | −0.71 (−1.53~0.12) | −10.73~9.32 |
| RBC | 0.9952 | 0.99 (0.94~1.01) | 0.09 (0.00~1.23) | 27.52 (5.29~49.75) | −242.56~297.59 | |
| FC vs. MS | WBC | 0.8782 | 1.07 (1.00~1.20) | 0.00 (0.00~0.00) | −0.59 (−1.61~0.43) | −12.95~11.77 |
| RBC | 0.9759 | 1.05 (0.88~1.20) | 0.00 (−0.30~1.01) | −39.61 (−116.74~37.53) | −976.70~897.48 | |
| NC vs. FC | WBC | 0.9333 | 1.00 (0.94~1.10) | 0.00 (0.00~0.00) | 0.12 (−0.8199~1.05) | −11.24~11.47 |
| RBC | 0.9874 | 1.09 (1.02~1.15) | −0.05 (−0.45~0.00) | −67.12 (−144.39~10.15) | −1005.81~871.57 | |
Disclaimer/Publisher’s Note: The statements, opinions and data contained in all publications are solely those of the individual author(s) and contributor(s) and not of MDPI and/or the editor(s). MDPI and/or the editor(s) disclaim responsibility for any injury to people or property resulting from any ideas, methods, instructions or products referred to in the content. |
© 2024 by the authors. Licensee MDPI, Basel, Switzerland. This article is an open access article distributed under the terms and conditions of the Creative Commons Attribution (CC BY) license (https://creativecommons.org/licenses/by/4.0/).
Share and Cite
Park, I.; Choi, M.; Lee, E.; Park, S.; Jang, W.S.; Lim, C.S.; Ko, S.-Y. Evaluation of the Microscanner C3 for Automated Cell Counting in Cerebrospinal Fluid Analysis. Diagnostics 2024, 14, 2224. https://doi.org/10.3390/diagnostics14192224
Park I, Choi M, Lee E, Park S, Jang WS, Lim CS, Ko S-Y. Evaluation of the Microscanner C3 for Automated Cell Counting in Cerebrospinal Fluid Analysis. Diagnostics. 2024; 14(19):2224. https://doi.org/10.3390/diagnostics14192224
Chicago/Turabian StylePark, Insu, Minkyeong Choi, Eunji Lee, Seoyeon Park, Woong Sik Jang, Chae Seung Lim, and Sun-Young Ko. 2024. "Evaluation of the Microscanner C3 for Automated Cell Counting in Cerebrospinal Fluid Analysis" Diagnostics 14, no. 19: 2224. https://doi.org/10.3390/diagnostics14192224
APA StylePark, I., Choi, M., Lee, E., Park, S., Jang, W. S., Lim, C. S., & Ko, S.-Y. (2024). Evaluation of the Microscanner C3 for Automated Cell Counting in Cerebrospinal Fluid Analysis. Diagnostics, 14(19), 2224. https://doi.org/10.3390/diagnostics14192224