Article

Impact of a New Preoperative Stratification Based on Cardiac Structural Compromise in Patients with Severe Aortic Stenosis Undergoing Valve Replacement Surgery †

by
Cristhian Espinoza Romero
1,*,
Vitor Emer Egypto Rosa
1,
Sérgio Octavio Kormann
1,
Bryan Nicolalde
2,
Antonio Sérgio de Santis Andrade Lopes
1,
Guilherme Sobreira Spina
1,
João Ricardo Cordeiro Fernandes
1,
Flavio Tarasoutchi
1 and
Roney Orismar Sampaio
1,*
1
Instituto do Coração (InCor), Hospital das Clínicas HCFMUSP, Faculdade de Medicina, Universidade de São Paulo, São Paulo 05403-904, Brazil
2
Norwalk Hospital-Yale University Program, Norwalk, CT 06856, USA
*
Authors to whom correspondence should be addressed.
This article is a revised and expanded version of a paper entitled [Comparative analysis of a novel preoperative stratification method versus traditional scores in patients with severe aortic stenosis undergoing aortic valve surgery], which was presented at [ESC congress in London on 2 September].
Diagnostics 2024, 14(19), 2250; https://doi.org/10.3390/diagnostics14192250
Submission received: 12 September 2024 / Revised: 2 October 2024 / Accepted: 3 October 2024 / Published: 9 October 2024
(This article belongs to the Special Issue Diagnosis and Management of Valvular Heart Disease)

Abstract

:
Introduction and objectives: Aortic valve replacement surgery (SAVR) remains a recommended indication, though its pre-surgical stratification is an ongoing challenge. Despite the widespread use of scores like the STS and EuroSCORE II, they have a number of limitations, while often neglecting structural parameters like left ventricular hypertrophy or left atrium volume. This study aimed to evaluate whether a new adaptation of the Généreux classification in the preoperative risk stratification of severe aortic stenosis (AS) is associated with the primary outcome, and to compare it with the original classification versus the traditional scores in short- and long-term follow-up. Methods: We conducted a retrospective, single-center study involving patients with confirmed severe AS who underwent SAVR. The new stratification categorized patients into three stages. Cox regression analyses were conducted to identify factors associated with mortality, with survival analysis performed using Kaplan–Meier curves. A p-value < 0.05 was considered statistically significant. Results: A total of 508 patients were included. Stage 3 patients had a lower median age (67 years). The median EuroSCORE II and STS scores were 2.75 and 2.62%, respectively (p ≤ 0.001). Over a median follow-up of 81 months, 56 deaths occurred (11%). Kaplan–Meier curve analysis revealed significant differences in all-cause mortality among the three groups (HR 4.073, log-rank p ≤ 0.001). Multivariable analysis identified the three preoperative stages (HR 3.22, [95% CI 1.44–7.20], p = 0.004) and mean transaortic gradient (HR 0.96, [95% CI 0.92–0.99], p = 0.021) as independent variables of mortality. The original Généreux scale AUC was higher (AUC: 0.760, 95% CI: 0.692–0.829) compared to the modified Généreux scale (AUC: 0.758, 95% CI: 0.687–0.829). However, no statistical differences were found between the different scales. Conclusions: Preoperative three-stage classification and low transaortic gradient are factors associated with increased all-cause mortality in patients undergoing SAVR. The proposed staging system performed better in the mortality analysis than EuroSCORE II and STS and was similar to the original classification.

1. Introduction

Aortic stenosis (AS) has become increasingly common, mainly due to the increase in life expectancy. In developed countries, the most common etiology of AS is degeneration, which mostly affects the elderly. However, in low- and middle-income countries, rheumatic heart disease remains a common cause of this condition [1,2,3]. Although Transcatheter Aortic Valve Replacement (TAVR) has shown similar or even better survival rates compared to Surgical Aortic Valve Replacement (SAVR), certain anatomical factors limit its use. Factors like a narrow valve annulus, extensive calcification, poor vascular access, or mismatched vascular diameters must be considered when deciding if TAVR is suitable [4]. Consequently, SAVR is often needed, presenting significant challenges in pre-surgical planning.
Risk assessment scores like the Society of Thoracic Surgeons (STS) score and the EuroSCORE II are widely used for cardiovascular surgeries. However, these scores have limitations for AS patients, as they often exclude structural factors like left ventricular (LV) hypertrophy, diastolic dysfunction (DD), left atrial (LA) volume, or secondary mitral or tricuspid regurgitation [5,6,7]. Another issue with existing scores (such as STS-PROM, EuroSCORE II, and TAVR-RS) is that they tend to overestimate mortality by 2–3 times in cases of minimally invasive SAVR [8]. Unlike AS, other valve disorders, like mitral regurgitation, commonly incorporate echocardiographic data in preoperative evaluations [1,2]. To address these gaps, Généreux et al. [9] proposed a classification system based on the degree of cardiac involvement, which was divided into five groups. However, the included patients had distinct epidemiological profiles, and the inclusion of both TAVR and SAVR procedures made the system less practical for clinical use. Despite its detailed anatomical stratification, we hypothesize that a simplified system could provide equally valuable information for predicting mortality outcomes. Additionally, most of the studies validating various risk scales have been conducted outside of Latin America.
This study aims to achieve three main objectives. The first is to evaluate and compare the performance of the STS, EuroSCORE II and Généreux scores, both original and modified, in the analysis of mortality in patients with SAVR. The second is to assess the epidemiology and outcomes of SAVR at one of Latin America’s largest centers, located in Brazil. The final objective is to propose a simplified version of the Généreux scale and compare its analysis of short- and long-term mortality with that of other scoring systems.

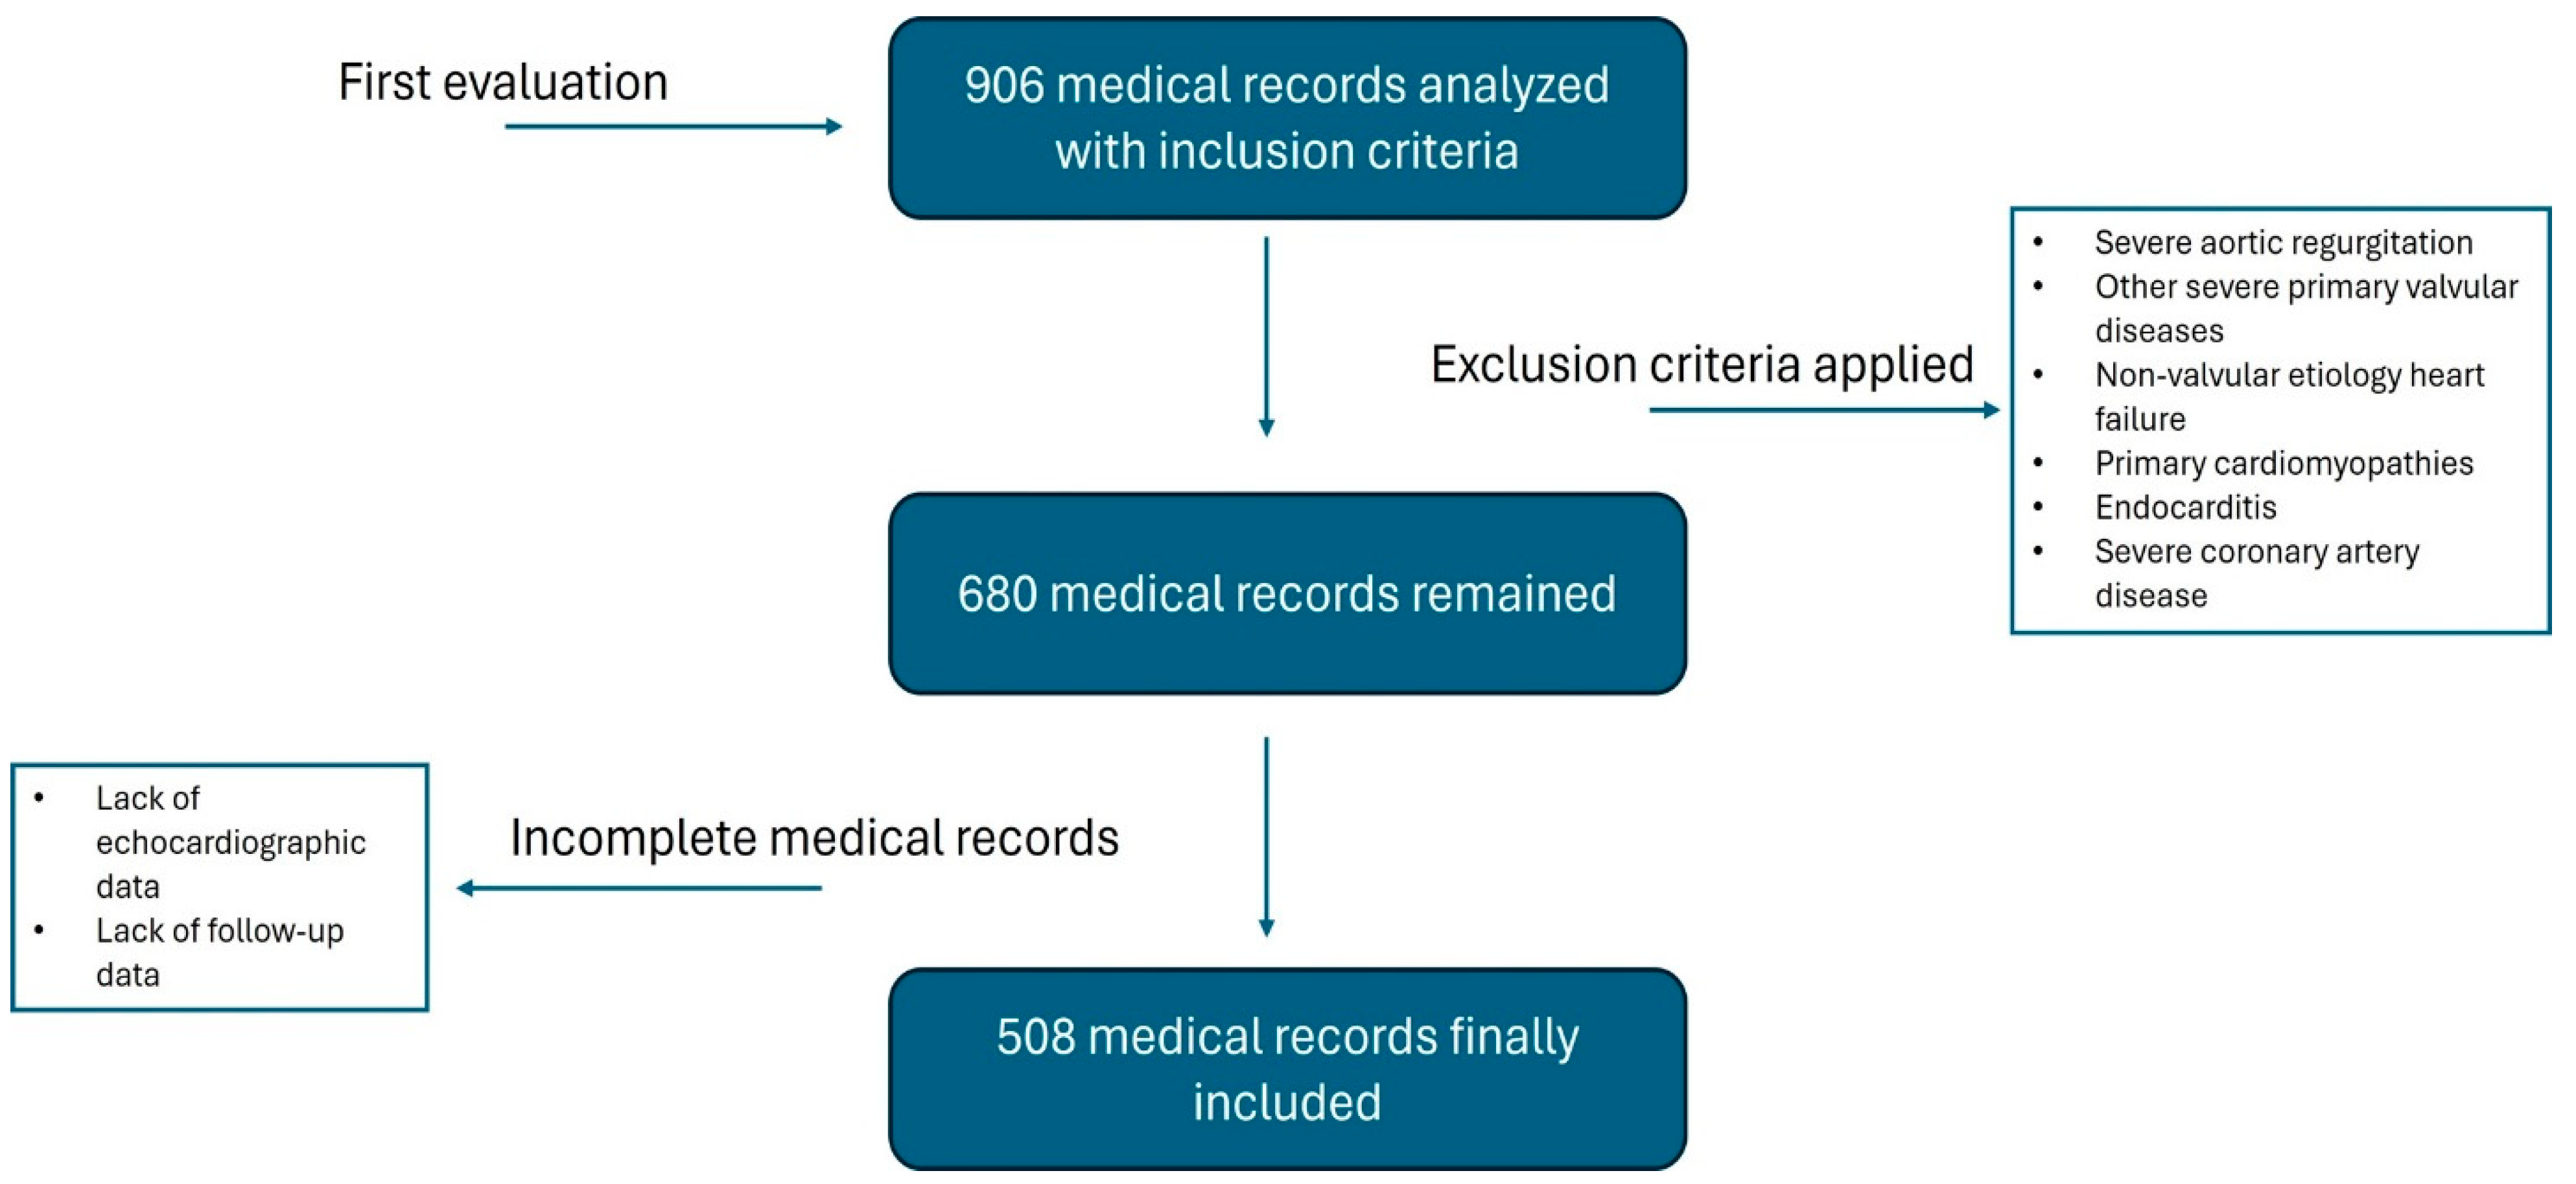
2. Materials and Methods

Population: A retrospective, single-center analysis involving 508 patients diagnosed with severe AS who underwent SAVR between January 2016 and December 2022 was performed (Figure 1). Considering an annual incidence of SAVR of 57,627, a sample of 382 individuals or more was necessary to acquire proper power and a confidence interval [10]. The definition of anatomically severe AS was established by the presence of an aortic valve area ≤ 1.0 cm2 and/or indexed ≤ 0.6 cm2/m2, along with a mean transaortic gradient ≥ 40 mmHg or maximum aortic jet velocity ≥4.0 m/s. In cases of AVA ≤ 1.0 cm2 and a mean LV/aorta gradient < 40 mmHg, a stress echocardiogram with dobutamine was performed. In those with ejection fraction (EF) <50% and in the absence of contractile reserve, a cardiac tomography with aortic valve calcium score was performed. In those with preserved EF, a calcium score was also performed. The exclusion criteria were patients with severe aortic regurgitation or other severe primary valvular diseases, primary cardiomyopathies, endocarditis, and severe coronary artery disease (defined as left main coronary artery lesion ≥ 50% or lesions in the three coronary vessels ≥ 70% with lesion in the proximal left anterior descending artery). The study protocol was reviewed and approved by the local institutional ethics committee. Informed consent was waived due to the retrospective nature of the study.
Data Collection: Clinical, laboratory, and echocardiographic data were collected and analyzed, along with variables related to the surgery, hospitalization, readmission, and mortality. The proposal was to reclassify the 5 original groups in a more simplified form, which is more applicable in daily practice. Each patient was classified into one of three groups based on the degree of progressive structural cardiac involvement, adapted from the classification by Généreux [9].
-
Group 1: no or minimal cardiac damage (characterized by left ventricular [LV] impact with LVH [LV mass index > 95 g/m2 for women and >115 g/m2 for men]), DD (E/e′ > 14), or systolic dysfunction (LV ejection fraction [LVEF] < 50%);
-
Group 2: secondary/functional mitral valve dysfunction or LA dilation (defined by increased indexed volume [>34 mL/m2]), presence of atrial fibrillation (AF), or moderate to severe mitral regurgitation;
-
Group 3: pulmonary hypertension (PH), defined as systolic pulmonary artery pressure (SPAP) ≥ 60 mmHg, moderate to severe tricuspid regurgitation, or involvement of the right ventricle (RV) with moderate to severe dysfunction (tricuspid annular plane systolic excursion [TAPSE] <11 mm, Fractional area change [FAC] <25%).
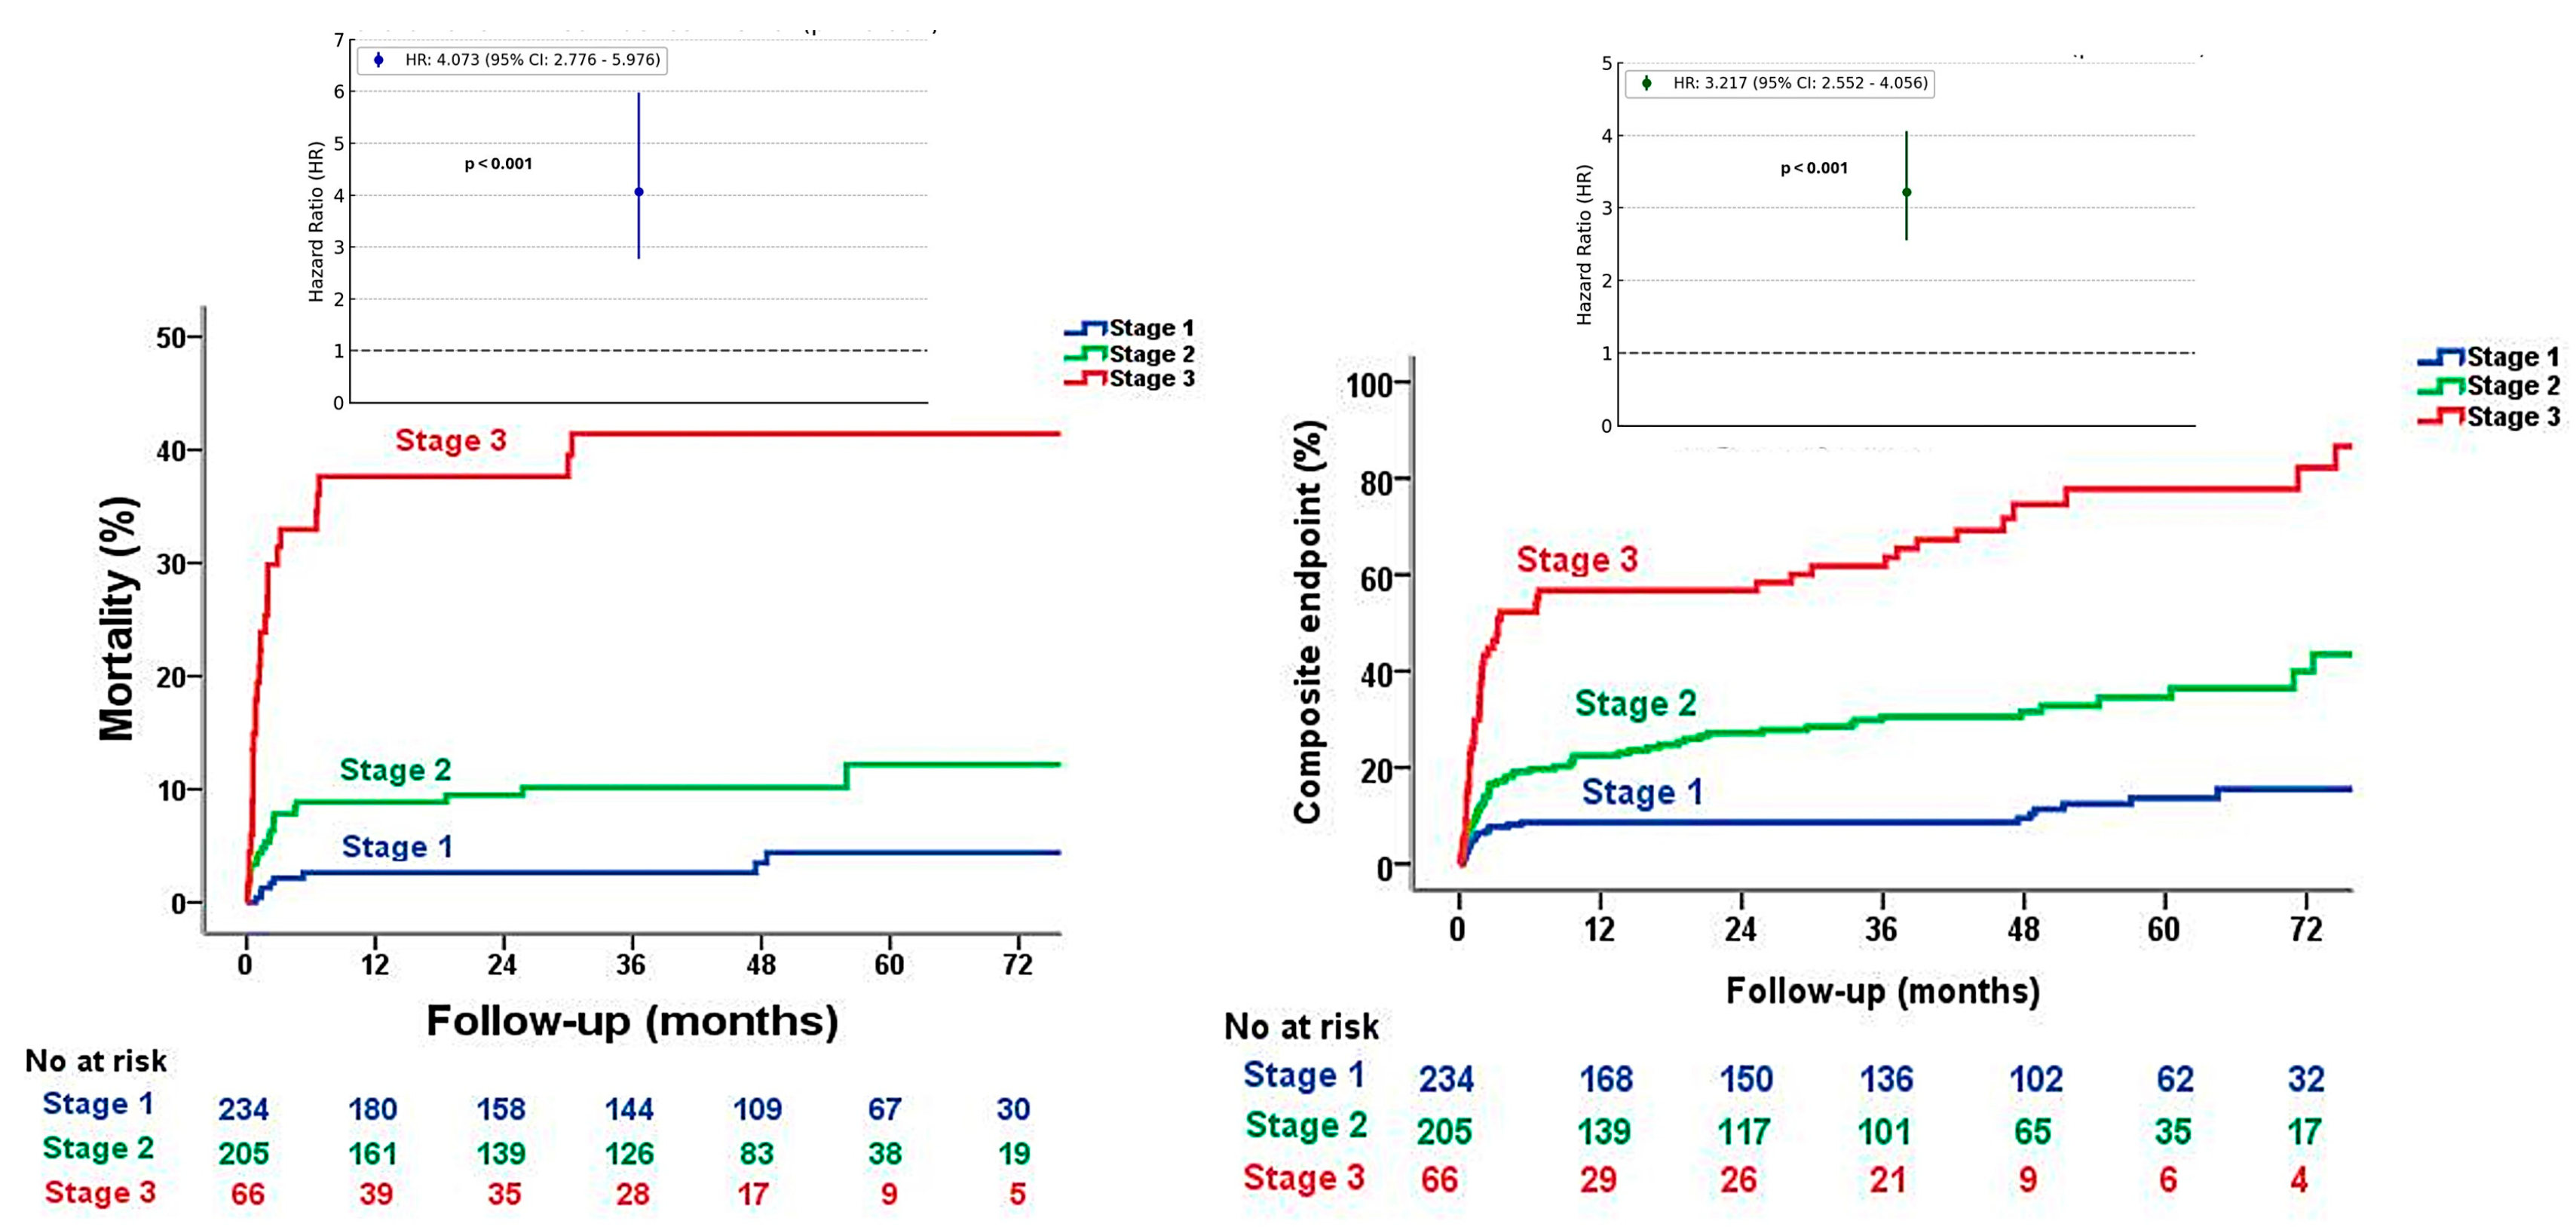
The original classification into 5 groups is shown in Figure 2.
Echocardiography data: Echocardiographic variables were assessed using methods recommended by current guidelines [11,12,13].
Outcomes: The primary endpoint was all-cause mortality, and the secondary endpoint included composite of cardiovascular mortality and cardiovascular readmissions. To calculate the outcomes, the median follow-up of the entire cohort was considered for the long term and at 30 days for the short term.
Statistical Analysis: Continuous variables were presented as a median (interquartile range) and categorical variables were presented as n (%). The Mann–Whitney test was used for continuous variables and Fisher’s exact test or Chi-square test was used for categorical variables. Post hoc analyses were performed using Tukey’s test. Kaplan–Meier curves and the log-rank test were used to assess all-cause mortality and the composite outcome of death and hospital readmission. Univariable and multivariable Cox regression analyses were employed to identify factors associated with the primary outcome. For the multivariable analysis, variables with a p < 0.10 in the univariable analysis were included. A significance level of p < 0.05 was considered statistically significant. The performance analysis of the modified classification was carried out and compared with the traditional scores and original classification using ROC curve analysis and area under the curve. An attempt was made to normalize the variables using a logarithmic transformation, but they continued to present an abnormal distribution, so nonparametric statistics were performed to establish the difference between groups. The criteria used to manage missing data were to apply the exclusion criteria described in the population section and to include only those patients who presented with at least 70% of the prespecified study variables to reduce possible confounding factors. All analyses were conducted using SPSS statistical software, version 21.

3. Results

Clinical and Laboratory Data: The clinical and laboratory characteristics are shown in Table 1. The median ages in stages 1, 2, and 3 were 62 (55–70), 67 (61–72), and 67 (60–73) years, respectively (<0.001). The EuroSCORE II for groups 1, 2, and 3 was 0.99 (0.88–1.30), vs. 1.43 (1.03–1.87) vs. 2.75 (1.63–3.81) %, respectively. In the post hoc analysis, a difference was found among the three groups (p < 0.001) in the same way as for the STS score which was 1.54 (1.44–1.64) vs. 2.00 (1.85–2.16) vs. 2.62 (2.25–2.99) % in the three stages, respectively, with a difference among the three groups (p < 0.001). Regarding brain natriuretic peptide (BNP), there were values of 79 (35–226) vs. 155 (81–331) vs. 920 (446–2740) pg/mL, respectively; and, in the post hoc analysis, the difference was among three stages (p < 0.001), as can be seen in Table 1.
Echocardiographic data: The echocardiographic characteristics are shown in Table 1. As expected, there is a significant difference among stages in relation to LV dysfunction (4.3% vs. 14.1% vs. 61.2%, p < 0.001), respectively. There was no significant difference among the groups in relation to the anatomical severity of AS, assessed through the aortic valve area [0.75 (0.60–0.85) vs. 0.7 (0.6–0.8) vs. 0.7 (0.6–0.85) cm2, respectively; p = 0.202]. However, the mean transaortic gradient [52 (43–63) vs. 53 (45–66) vs. 50 (40–60) mmHg, respectively; p = 0.023], there were differences between stages 2 and 3 in the post hoc analysis (p = 0.018).
Postoperative data: The postoperative characteristics are shown in Table 1. Regarding all-cause mortality, there were also differences among the three stages (3.4% vs. 10.2% vs. 40.3%, respectively; p = 0.001), and this was also after subgroup analysis (p < 0.001). Concomitant surgeries are worth mentioning because they can influence postoperative outcomes; therefore, only patients undergoing myocardial revascularization surgery without a primary indication for it were included. Consequently, only 69 (13.6%) patients underwent revascularization.
In the long-term analysis of the Kaplan–Meier curve, at a median follow-up of 81 (79–84) months, there were differences among the three groups regarding the primary outcome, as shown in Figure 2 [HR 4.073 (2.776–5.976), log-rank p ≤ 0.001]. In the other Kaplan–Meier curve at a median follow-up of 64 (61–68) months. Regarding composite outcomes by mortality and cardiovascular readmissions, there was a difference among the three groups, as shown in Figure 2 [HR 3.217 (2.552–4.056), log-rank p ≤ 0.001] (Table S1). In the univariable analysis model excluding the variables contained in the preoperative stages, the variables associated with all-cause mortality were BNP, age, NYHA class, creatinine clearance, mean transaortic gradient, and proposed stage classification (Table 2). However, after multivariable analysis in a model that excluded the variables contained in the preoperative stages, the proposed stage classification (HR 3.22, [95% CI 1.44–7.20], p = 0.004) and the mean transaortic gradient (HR 0.96, [95% CI 0.92–0.99], p = 0.021) were the only independent variables of mortality (Table 2). Furthermore, in the multivariable analysis, multiple models were utilized, and even after adjusting for all variables including EuroSCORE II and STS, the same variables were obtained (Table S2). The univariable and multivariable analyses were also performed based on the original Généreux classification, which was also a factor associated with mortality at the same follow-up time (Table S3).
It is also important to mention that in the univariable analysis, parameters such as the presence of preoperative AF and SPAP as a continuous variable were associated with mortality (HR 4.467 [95% CI 2.438–8.186], p ≤ 0.001; HR 1.056, [95% CI 1.033–1.079], p ≤ 0.001, respectively), but were not included in the analysis because they were already included in the new classification.
Most traditional scores, including EuroSCORE II and STS, focus on the analysis of the short-term postoperative period, and therefore we carried out univariable and multivariable analyses that included these traditional calculators and the original and proposed classifications in a 30-day follow-up. The original and modified scales were the only factors associated with mortality after the multivariable analysis [HR 2.632; 95% CI (1.211–5.717); p = 0.015; HR 5019; 95% CI (1.596–15.784); p = 0.006] (Table 3).
Area under curve (AUC) analysis was performed to compare the different scales with regard to mortality outcome. The AUC at 30 days as well as during the entire follow-up period is represented in Figure 3. For the 30-day follow-up, the AUC of the original Généreux scale showed the best model (AUC: 0.815, 95% CI: 0.738–0.892) in comparison with the modified scale (AUC: 0.812, 95% CI: 0.732–0.892), EuroSCORE II (AUC: 0.722, 95% CI: 0.614–0.830), and STS (AUC: 0.695, 95% CI: 0.583–0.807), although the differences were not statistically significant as the confidence intervals overlapped among all scales (Table S4). Regarding the entire follow-up period of 81 months (79–84), the original Généreux scale AUC was higher (AUC: 0.760, 95% CI: 0.692–0.829) compared to the modified Généreux scale (AUC: 0.758, 95% CI: 0.687–0.829), EuroSCORE II (AUC: 0.729, 95% CI: 0.663–0.794), and STS (AUC: 0.711, 95% CI: 0.649–0.773). However, no statistical differences were found between the different scales (Table S5).

4. Discussion

The main findings of the present study are as follows: I. The proposed stage classification, which categorizes patients based on the presence or absence of extravalvular cardiac damage, was identified as an associated factor with mortality in a short- and long-term follow-up. This means that the greater the cardiac structural repercussions observed, the worse the prognosis after valve replacement surgery. II. A low transaortic gradient, potentially reflecting low-flow and low-gradient status, was also associated with a worse prognosis. III. The proposed staging classification demonstrated superior performance for mortality analysis than the EuroSCORE II and STS score, similar to the original classification.
In our study of the population with AS undergoing exclusively surgical intervention, it is important to highlight those patients classified in stage 3, who had a higher prevalence of the primary outcome, had a median age of 67 years. This is significantly lower compared to other studies, even those with low risk such as PARTNER 3 trial (with a mean age of 73 years) [3,5]. Therefore, there is a discrepancy between American and European guidelines, which recommend TAVR as the first-line treatment only in patients over 80 and 75 years of age, respectively, taking into account the surgical risk [1,2]. In our study, regarding the latter, the median STS score/EuroSCORE II was 2.62% and 2.75%, respectively, in stage 3, which differs from what is currently recommended in the guidelines, which is a surgical risk > 8% [1,2,3]. This opens the possibility of a hypothesis that our study generates, suggesting the need to consider TAVR in younger patients classified as stage 3, regardless of the scores mentioned above.
Furthermore, our study also raises the discussion about certain variables that were more prevalent in group 3 with a higher primary outcome, such as AF and SPAP. These variables were not included in the multivariable analysis because they were already included in the new classification, but they remain important associated factors for the stratification of our patients. Although parameters such as creatinine clearance and NYHA functional class were associated factors in the univariable analysis, they were not significant in the multivariable analysis. However, it is important to highlight that these are aspects that we consider in our daily clinical practice and must be considered when making clinical decisions.
AS is the most common valve disease, and its prevalence increases with age, reaching 11.8% in the population over 80 years old, mainly due to degenerative etiology [14]. However, in low-income countries, bicuspid and rheumatic etiologies remain prevalent [1,15]. Despite significant technological advances in surgical procedures and valve prostheses, complications after aortic valve replacement, including mortality, persist with reported 1-year mortality rates of 4.9% based on a European meta-analysis [16]. There are other trials with long-term follow-up, with a 5-year mortality rate of 16% for low surgical risk measured by EuroSCORE II, similar to data found in Brazil of 16.1% at the same follow-up time [17,18].
There are limited scores with adequate accuracy available to predict intra- and postoperative outcomes in valve replacement, and their applicability remains challenging due to population heterogeneity [17]. EuroSCORE II and STS are the most widely used and validated scores globally, playing a crucial role in cardiac surgical practice by assessing postoperative mortality and morbidity. However, EuroSCORE II tends to overestimate mortality in low-risk patients and underestimate it in high-risk patients [19]. The STS score is more complex, comprising over 40 clinical parameters [19]. Both scores have limitations as they were not specifically designed for low- and middle-income countries, and mainly include variables specific to the individual rather than cardiac involvement secondary to aortic valve disease [15,20,21]. Another limitation of existing risk scores (such as STS, EuroSCORE II, and TAVR-RS) is that they overestimate mortality by 2–3 times in the case of minimally invasive SAVR [8]. Furthermore, they primarily predict short-term events, and there is a lack of comprehensive studies with long-term follow-up [22,23]. To address this gap, there is an urgent need for new evaluation tools focused on the cardiac repercussions of this severe valve disease. Several studies have already assessed structural impairment through echocardiography, correlating it with a worse postoperative prognosis [9,10].
Généreux et al. proposed a five-stage classification system based on the presence or absence of extravalvular cardiac damage [9]. Although this classification demonstrated a good performance ability, it is complex due to its reliance on five stages and was not validated in the Latin American population, which may have a different epidemiological profile.
In our study, we aimed to simplify this classification and evaluate it in an exclusively surgical population. Notably, patients who underwent TAVR, accounting for approximately 65% of the original study’s cohort, were not included. Furthermore, we consolidated stages 0 and 1 into a single group (current group 1) and stages 3 and 4 into another group (current group 3) due to their low prevalence in both the current study (5.4% for stage 4) and the original study (8.7% for stage 4). Our adapted classification emerged as an independent associated factor of poor prognosis for postoperative mortality after valve replacement. The higher the stage (group 1 to 3), the more extensive the cardiac involvement, leading to a greater number of adverse events. Additionally, we found that the EuroSCORE II and STS score failed to predict long-term mortality and significantly underestimated mortality, particularly in groups 2 and 3 as per the proposed stage classification (all-cause mortality in stage 2 (10.2%) vs. EuroSCORE (1.43%) vs. STS score (2.0%), and the stage 3 (40.3%) vs. EuroSCORE (2.75%) vs STS (2.62%).
The early randomized trials comparing SAVR and TAVR were conducted in patients with high surgical risk, defined by an STS score >10% or a 30-day mortality risk >15%, as estimated by the Heart Team prior to surgery [5,24]. For those with intermediate risk, an STS score of 4–8% or a Heart Team estimate between 3 and 15% was applied [24,25]. Lastly, recent low-risk trials used a 30-day mortality risk <3%, or an STS score <4%, as estimated by the local Heart Team [26,27]. When comparing these data with our cohort, we observe that, according to traditional scoring systems, our population presents an intermediate to low risk considering their age, functional class, and scores. However, despite this intermediate age and the low scores, the mortality rate in group 3 is high, highlighting the role of anatomical factors in this population with different epidemiological characteristics than the other trials. Other recent adaptations and classifications have been applied to patients with AS, particularly those undergoing TAVR. One such adaptation included asymptomatic patients, where 14% of the population was classed as at least stage 3 or 4, further underscoring the utility of anatomical stratification, as staging was significantly associated with excess mortality in a multivariable analysis adjusted for SAVR as a time-dependent variable [28]. In another study, which evaluated 262 patients with severe AS, a gradual increase in mortality rates was observed over a one-year follow-up, with 18.6% mortality in stage 3 and 21.6% in stage 4 [29]. However, the STS score was >6% in stages 3 and 4, which was quite different from the scores found in our population. Therefore, our study provides important evidence, showing that, just like in the aforementioned populations, anatomical stratification has significant value in our cohort regardless of symptoms, risk scores, or clinical variables such as age.
Another noteworthy prognostic factor was the mean transaortic gradient, which was consistent with findings from other studies [30,31]. This prompted us to consider the prognostic implications of low-flow and low-gradient AS, a subgroup with a worse prognosis compared to those with high-gradient AS [32,33]. Recent studies have already demonstrated the cardiac structural impact that this entity causes in the LV, including more interstitial fibrosis than patients with high-gradient AS [34,35].
An important point to mention is that both the original and proposed classifications include the presence of PH with a systolic cut-off value of >60 mmHg among their variables. When tested as a continuous variable in the present study, PH was an associated factor in the univariable analysis. However, it was not evaluated in the multivariable analysis because this variable is already embedded within the scales. This raises the issue that some patients with PH who do not reach the >60 mmHg threshold may still experience worse postoperative outcomes, as demonstrated in some studies and within this specific population [36,37].
One of the strengths of this study is its potential clinical applicability. An important question that remains unanswered is whether TAVR is preferable to SAVR in patients with PH and/or RV dysfunction. This question cannot be addressed by the two previous studies because they only included patients undergoing TAVR [38,39]. However, recent analyses from the PARTNER IIA (Placement of AoRTic TraNscathetER Valves IIA) randomized trial reported that worsening RV function was four times more frequent following SAVR than TAVR, and this was associated with a two-fold increase in the risk of mortality [40]. This highlights another strength of our study, as this classification has not yet been applied to an exclusively surgical population. Considering that a significant percentage of patients with severe AS (20% in asymptomatic severe AS and up to 50% in symptomatic severe AS) have advanced cardiac damage, classed as at least stage 3, and are at markedly higher risk of mortality after intervention, the emergence of such right-sided abnormalities should prompt early consideration of intervention. Additionally, the presence of this anatomical impairment strengthens the argument in favor of selecting TAVR over SAVR in these cases. Another important strength of our study, as previously mentioned, is that our population differs by being younger, with lower biomarker levels, predominantly NYHA class II, and lower preoperative traditional scores. Regardless of these factors, as well as in other populations where a similar system was applied, anatomical stratification remains an important variable and should be considered in preoperative evaluations. Simplified into three stages, this stratification is an important factor for both short- and long-term mortality analysis, making it an invaluable tool for guiding treatment decisions. For instance, in group 3, where mortality was higher regardless of traditional scores or age, a percutaneous approach would likely be the most appropriate intervention. Another of the possible clinical applications of the present study is that in this group 3 population with high mortality for SAVR, interventions such as TAVR or mini SAVR would be applicable to this population.
However, there are several limitations inherent to this retrospective analysis. For instance, comorbidities like diabetes, arterial hypertension, and CAD were not excluded, which may introduce confounding factors. However, all these variables were included in the univariable and multivariable analyses to reduce potential confounding factors. In addition, the prevalence of CAD was low and patients with severe CAD were not included. Another potential limitation is that the right-sided abnormalities may not be directly caused by AS per se but may rather be related to other comorbidities, including pulmonary and coronary artery disease. Furthermore, while the study adjusts for some variables, not all potentially important biomarkers like troponin were included. Although our population is not very old, it is important to consider that along with aging there is calcification of the mitral annulus, and the current classification evaluates diastolic function through the E/e’ ratio, and that due to this calcification, it can be an erroneous measurement. Our study did not include factors of frailty, but it is worth emphasizing that our population is younger. It is important to mention that this article provides another example that there are multiple characteristics that make up the preoperative risk of a patient undergoing cardiac surgery; however, for future studies these preoperative stratification models can improve with some adjustments, as commented by Griffin and colleagues, aiming at greater surveillance during the postoperative period [41].

5. Conclusions

The main conclusions drawn from this study were that the new proposed stage classification and the low transaortic gradient are factors associated with all-cause mortality and the composite outcome by mortality and cardiovascular readmissions during short- and long-term follow-up in patients undergoing SAVR. The proposed staging performed better for mortality analysis than EuroSCORE II and STS and was similar to the original classification.

Supplementary Materials

The following supporting information can be downloaded at: https://www.mdpi.com/article/10.3390/diagnostics14192250/s1, Table S1. Univariable analysis of composite outcome predictors of death and hospital readmission; Table S2. Multivariable analysis models of predictors for primary outcomes; Table S3. Multivariable analysis models of predictors for primary outcome with original and proposed classification; Table S4: ROC analysis of short-term follow-up time; Table S5: ROC analysis of complete follow-up time.

Author Contributions

Conceptualization C.E.R., R.O.S. and S.O.K.; methodology C.E.R., V.E.E.R. and B.N.; software, A.S.d.S.A.L., G.S.S. and J.R.C.F.; validation, A.S.d.S.A.L., G.S.S. and J.R.C.F.; formal analysis, A.S.d.S.A.L., G.S.S., F.T., R.O.S. and J.R.C.F.; investigation, C.E.R., R.O.S., B.N. and S.O.K.; resources, R.O.S., V.E.E.R. and F.T.; data curation, A.S.d.S.A.L., G.S.S., F.T. and R.O.S., writing and original draft preparation, C.E.R., B.N., A.S.d.S.A.L., G.S.S., F.T. and R.O.S.; writing—review and editing, C.E.R., B.N., A.S.d.S.A.L., G.S.S., F.T. and R.O.S.; visualization, C.E.R., B.N., A.S.d.S.A.L., G.S.S., F.T. and R.O.S.; supervision. R.O.S. and F.T.; project administration, F.T., C.E.R. and R.O.S. All authors have read and agreed to the published version of the manuscript.

Funding

This research received no external funding.

Institutional Review Board Statement

The study was conducted in accordance with the Declaration of Helsinki, and approved by the Ethics Committee of Clinicas Hospital, Medicine Faculty of the Sao Paulo University (protocol number: 70206123.6.0000.0068 and approval of date 16 June 2023).

Informed Consent Statement

Informed consent was waived due to the retrospective nature of the study.

Data Availability Statement

The original contributions presented in the study are included in the article, further inquiries can be directed to the corresponding authors.

Conflicts of Interest

The authors declare no conflicts of interest.

References

  1. Vahanian, A.; Beyersdorf, F.; Praz, F.; Milojevic, M.; Baldus, S.; Bauersachs, J.; Capodanno, D.; Conradi, L.; De Bonis, M.; De Paulis, R.; et al. ESC/EACTS Scientific Document Group, 2021 ESC/EACTS Guidelines for the management of valvular heart disease: Developed by the Task Force for the management of valvular heart disease of the European Society of Cardiology (ESC) and the European Association for Cardio-Thoracic Surgery (EACTS). Eur. Heart J. 2022, 43, 561–632. [Google Scholar] [CrossRef] [PubMed]
  2. Otto, C.M.; Nishimura, R.A.; Bonow, R.O.; Carabello, B.A.; Erwin, J.P., III; Gentile, F.; Jneid, H.; Krieger, E.V.; Mack, M.; McLeod, C.; et al. 2020 ACC/AHA Guideline for the Management of Patients With Valvular Heart Disease: Executive Summary: A Report of the American College of Cardiology/American Heart Association Joint Committee on Clinical Practice Guidelines. Circulation 2021, 143, e35–e71. [Google Scholar] [CrossRef] [PubMed]
  3. Mack, M.J.; Leon, M.B.; Thourani, V.H.; Pibarot, P.; Hahn, R.T.; Genereux, P.; Kodali, S.K.; Kapadia, S.R.; Cohen, D.J.; Pocock, S.J.; et al. PARTNER 3 Investigators. Transcatheter Aortic-Valve Replacement in Low-Risk Patients at Five Years. N. Engl. J. Med. 2023, 389, 1949–1960. [Google Scholar] [CrossRef] [PubMed]
  4. Claessen, B.E.; Tang, G.H.L.; Kini, A.S.; Sharma, S.K. Considerations for Optimal Device Selection in Transcatheter Aortic Valve Replacement: A Review. JAMA Cardiol. 2021, 6, 102–112. [Google Scholar] [CrossRef]
  5. Smith, C.R.; Leon, M.B.; Mack, M.J.; Miller, D.C.; Moses, J.W.; Svensson, L.G.; Tuzcu, E.M.; Webb, J.G.; Fontana, G.P.; Makkar, R.R.; et al. PARTNER Trial Investigators. Transcatheter versus surgical aortic-valve replacement in high-risk patients. N. Engl. J. Med. 2011, 364, 2187–2198. [Google Scholar] [CrossRef]
  6. Nashef, S.A.; Roques, F.; Sharples, L.D.; Nilsson, J.; Smith, C.; Goldstone, A.R.; Lockowandt, U. EuroSCORE II. Eur. J. Cardiothorac. Surg. 2012, 41, 734–744, discussion 744–745. [Google Scholar] [CrossRef]
  7. O’Brien, S.M.; Feng, L.; He, X.; Xian, Y.; Jacobs, J.P.; Badhwar, V.; Kurlansky, P.A.; Furnary, A.P.; Cleveland, J.C., Jr.; Lobdell, K.W.; et al. The Society of Thoracic Surgeons 2018 Adult Cardiac Surgery Risk Models: Part 2-Statistical Methods and Results. Ann. Thorac. Surg. 2018, 105, 1419–1428. [Google Scholar] [CrossRef]
  8. Alnajar, A.; Chatterjee, S.; Chou, B.P.; Khabsa, M.; Rippstein, M.; Lee, V.V.; La Pietra, A.; Lamelas, J. Current Surgical Risk Scores Overestimate Risk in Minimally Invasive Aortic Valve Replacement. Innovations 2021, 16, 43–51. [Google Scholar] [CrossRef]
  9. Généreux, P.; Pibarot, P.; Redfors, B.; Mack, M.J.; Makkar, R.R.; A Jaber, W.; Svensson, L.G.; Kapadia, S.; Tuzcu, E.M.; Thourani, V.H.; et al. Staging classification of aortic stenosis based on the extent of cardiac damage. Eur. Heart J. 2017, 38, 3351–3358. [Google Scholar] [CrossRef]
  10. Glenn, K. Report Finds TAVR is Dominant Form of Aortic Valve Replacement, Outcomes Steadily Improving in the United States. Data from the STS/ACC TVT Registry Provides Insights on ‘State of TAVR in the United States’. 16 November 2020. Available online: https://www.acc.org/about-acc/press-releases/2020/11/16/18/53/report-finds-tavr-is-dominant-form-of-aortic-valve-replacement-outcomes-steadily-improving-in-the-us (accessed on 16 November 2020).
  11. Fukui, M.; Gupta, A.; Abdelkarim, I.; Sharbaugh, M.S.; Althouse, A.D.; Elzomor, H.; Mulukutla, S.; Lee, J.S.; Schindler, J.T.; Gleason, T.G.; et al. Association of Structural and Functional Cardiac Changes with Transcatheter Aortic Valve Replacement Outcomes in Patients with Aortic Stenosis. JAMA Cardiol. 2019, 4, 215–222. [Google Scholar] [CrossRef]
  12. Lang, R.M.; Badano, L.P.; Mor-Avi, V.; Afilalo, J.; Armstrong, A.; Ernande, L.; Flachskampf, F.A.; Foster, E.; Goldstein, S.A.; Kuznetsova, T.; et al. Recommendations for cardiac chamber quantification by echocardiography in adults: An update from the American Society of Echocardiography and the European Association of Cardiovascular Imaging. J. Am. Soc. Echocardiogr. 2015, 28, 1.e14–39.e14. [Google Scholar] [CrossRef] [PubMed]
  13. Baumgartner, H.; Hung, J.; Bermejo, J.; Chambers, J.B.; Edvardsen, T.; Goldstein, S.; Lancellotti, P.; LeFevre, M.; Miller, F.; Otto, C.M. Recommendations on the echocardiographic assessment of aortic valve stenosis: A focused update from the European Association of Cardiovascular Imaging and the American Society of Echocardiography. J. Am. Soc. Echocardiogr. 2017, 30, 372–392. [Google Scholar] [CrossRef] [PubMed]
  14. Eveborn, G.W.; Schirmer, H.; Heggelund, G.; Lunde, P.; Rasmussen, K. The evolving epidemiology of valvular aortic stenosis. the Tromsø study. Heart 2013, 99, 396–400. [Google Scholar] [CrossRef] [PubMed]
  15. Shvartz, V.; Sokolskaya, M.; Petrosyan, A.; Ispiryan, A.; Donakanyan, S.; Bockeria, L.; Bockeria, O. Predictors of Mortality Following Aortic Valve Replacement in Aortic Stenosis Patients. Pathophysiol. Off. J. Int. Soc. Pathophysiol. 2022, 29, 106–117. [Google Scholar] [CrossRef] [PubMed]
  16. Phan, K.; Tsai, Y.C.; Niranjan, N.; Bouchard, D.; Carrel, T.P.; E Dapunt, O.; Eichstaedt, H.C.; Fischlein, T.; Gersak, B.; Glauber, M.; et al. Sutureless aortic valve replacement: A systematic review and meta-analysis. Ann. Cardiothorac. Surg. 2015, 4, 100–111. [Google Scholar] [CrossRef]
  17. Martinsson, A.; Nielsen, S.J.; Milojevic, M.; Redfors, B.; Omerovic, E.; Tønnessen, T.; Gudbjartsson, T.; Dellgren, G.; Jeppsson, A. Life Expectancy After Surgical Aortic Valve Replacement. J. Am. Coll. Cardiol. 2021, 78, 2147–2157. [Google Scholar] [CrossRef]
  18. De Almeida, A.S.; Picon, P.D.; Belmonte Wender, O.C. Resultados de pacientes submetidos à cirurgia de substituição valvar aórtica usando próteses mecânicas ou biológicas. Braz. J. Cardiovasc. Surg. 2011, 26, 326–337. [Google Scholar] [CrossRef]
  19. Gogbashian, A.; Sedrakyan, A.; Treasure, T. EuroSCORE: A systematic review of international performance. Eur. J. Cardiothorac. Surg. 2004, 25, 695–700. [Google Scholar] [CrossRef]
  20. Kunt, A.G.; Kurtcephe, M.; Hidiroglu, M.; Cetin, L.; Kucuker, A.; Bakuy, V.; Akar, A.R.; Sener, E. Comparison of original EuroSCORE, EuroSCORE II and STS risk models in a Turkish cardiac surgical cohort. Interact. CardioVascular Thorac. Surg. 2013, 16, 625–629. [Google Scholar] [CrossRef]
  21. Khan, A.A.; Murtaza, G.; Khalid, M.F.; Khattak, F. Risk Stratification for Transcatheter Aortic Valve Replacement. Cardiol. Res. 2019, 10, 323–330. [Google Scholar] [CrossRef]
  22. Marzec, K.; Jaworska-Wilczyńska, M.; Kowalik, I.; Nieznańska, M.; Witkowski, A.; Dąbrowski, M.; Kuśmierski, K.; Hryniewiecki, T. Comparison of the long-term outcomes and risk factors of aortic stenosis treatment in patients undergoing transcatheter aortic valve implantation and surgical aortic valve replacement. Kardiol. Pol. 2022, 80, 792–798. [Google Scholar] [CrossRef] [PubMed]
  23. Turina, J.; Stark, T.; Seifert, B.; Turina, M. Predictors of the Long-Term Outcome After Combined Aortic and Mitral Valve Surgery. Circulation 1999, 100, II-48–II-53. [Google Scholar] [CrossRef]
  24. Adams, D.H.; Popma, J.J.; Reardon, M.J.; Yakubov, S.J.; Coselli, J.S.; Deeb, G.M.; Gleason, T.G.; Buchbinder, M.; Hermiller, J., Jr.; Kleiman, N.S.; et al. Transcatheter aortic-valve replacement with aself-expanding prosthesis. N. Engl. J. Med. 2014, 370, 1790–1798. [Google Scholar] [CrossRef]
  25. Leon, M.B.; Smith, C.R.; Mack, M.J.; Makkar, R.R.; Svensson, L.G.; Kodali, S.K.; Thourani, V.H.; Tuzcu, E.M.; Miller, D.C.; Herrmann, H.C.; et al. Transcatheter or surgical aortic-valve replacement in intermediate-risk patients. N. Engl. J. Med. 2016, 374, 1609–1620.8. [Google Scholar] [CrossRef] [PubMed]
  26. Mack, M.J.; Leon, M.B.; Thourani, V.H.; Makkar, R.; Kodali, S.K.; Russo, M.; Kapadia, S.R.; Malaisrie, S.C.; Cohen, D.J.; Pibarot, P.; et al. Transcatheter aortic-valve replacement with a balloon-expandable valve in low-risk patients. N. Engl. J. Med. 2019, 380, 1695–1705. [Google Scholar] [CrossRef] [PubMed]
  27. Popma, J.J.; Deeb, G.M.; Yakubov, S.J.; Mumtaz, M.; Gada, H.; O’Hair, D.; Bajwa, T.; Heiser, J.C.; Merhi, W.; Kleiman, N.S.; et al. Transcatheter aortic-valve replacement with aself-expanding valve in low-risk patients. N. Engl. J. Med. 2019, 380, 1706–1715. [Google Scholar] [CrossRef]
  28. Tastet, L.; Tribouilloy, C.; Maréchaux, S.; Vollema, E.M.; Delgado, V.; Salaun, E.; Shen, M.; Capoulade, R.; Clavel, M.-A.; Arsenault, M.; et al. Staging Cardiac Damage in Patients With Asymptomatic Aortic Valve Stenosis. J. Am. Coll. Cardiol. 2019, 74, 550–563. [Google Scholar] [CrossRef] [PubMed]
  29. Avvedimento, M.; Franzone, A.; Leone, A.; Piccolo, R.; Castiello, D.S.; Ilardi, F.; Mariani, A.; Esposito, R.; Iapicca, C.; Angellotti, D.; et al. Extent of Cardiac Damage and Mortality in Patients Undergoing Transcatheter Aortic Valve Implantation. J. Clin. Med. 2021, 10, 4563. [Google Scholar] [CrossRef]
  30. Quere, J.P.; Monin, J.L.; Levy, F.; Petit, H.; Baleynaud, S.; Chauvel, C.; Pop, C.; Ohlmann, P.; Lelguen, C.; Dehant, P.; et al. Influence of preoperative left ventricular contractile reserve on postoperative ejection fraction in low-gradient aortic stenosis. Circulation 2006, 113, 1738–1744. [Google Scholar] [CrossRef]
  31. Clavel, M.A.; Fuchs, C.; Burwash, I.G.; Mundigler, G.; Dumesnil, J.G.; Baumgartner, H.; Bergler-Klein, J.; Beanlands, R.S.; Mathieu, P.; Magne, J.; et al. Predictors of outcomes in low-flow, low-gradient aortic stenosis: Results of the multicenter TOPAS Study. Circulation 2008, 118 (Suppl. S14), S234–S242. [Google Scholar] [CrossRef]
  32. Awtry, E.; Davidoff, R. Low-Flow/Low-Gradient Aortic Stenosis. Circulation 2011, 124, e739–e741. [Google Scholar] [CrossRef] [PubMed]
  33. Clavel, M.A.; Magne, J.; Pibarot, P. Low-gradient aortic stenosis. Eur. Heart J. 2016, 37, 2645–2657. [Google Scholar] [CrossRef] [PubMed]
  34. Fukui, M.; Annabi, M.S.; Rosa, V.E.E.; Ribeiro, H.B.; Stanberry, L.I.; Clavel, M.A.; Rodés-Cabau, J.; Tarasoutchi, F.; Schelbert, E.B.; Bergler-Klein, J.; et al. Comprehensive myocardial characterization using cardiac magnetic resonance associates with outcomes in low gradient severe aortic stenosis. Eur. Heart J. Cardiovasc. Imaging 2022, 24, 46–58. [Google Scholar] [CrossRef] [PubMed]
  35. Rosa, V.E.E.; Ribeiro, H.B.; Sampaio, R.O.; Morais, T.C.; Rosa, M.E.E.; Pires, L.J.T.; Vieira, M.L.; Mathias, W.; Rochitte, C.E.; de Santis, A.S.; et al. Myocardial Fibrosis in Classical Low-Flow, Low-Gradient Aortic Stenosis. Circ. Cardiovasc. Imaging 2019, 12, e008353. [Google Scholar] [CrossRef]
  36. Iliuta, L.; Rac-Albu, M.; Rac-Albu, M.E.; Andronesi, A. Impact of Pulmonary Hypertension on Mortality after Surgery for Aortic Stenosis. Medicina 2022, 58, 1231. [Google Scholar] [CrossRef]
  37. Denault, A.; Deschamps, A.; Tardif, J.C.; Lambert, J.; Perrault, L. Pulmonary hypertension in cardiac surgery. Curr. Cardiol. Rev. 2010, 6, 1–14. [Google Scholar] [CrossRef]
  38. Eleid, M.F.; Padang, R.; Pislaru, S.V.; Greason, K.L.; Crestanello, J.; Nkomo, V.T.; Pellikka, P.A.; Jentzer, J.C.; Gulati, R.; Sandhu, G.S.; et al. Effect of transcatheter aortic valve replacement on right ventricular-pulmonary artery coupling. J. Am. Coll. Cardiol. 2019, 12, 2145–2154. [Google Scholar] [CrossRef]
  39. Schewel, J.; Schmidt, T.; Kuck, K.-H.; Frerker, C.; Schewel, D. Impact of pulmonary hypertension hemodynamic on long-term outcome after trans-catheter aortic valve replacement. J. Am. Coll. Car.-Diol. 2019, 12, 2155–2168. [Google Scholar]
  40. Cremer, P.C.; Zhang, Y.; Alu, M.; Rodriguez, L.L.; Lindman, B.R.; Zajarias, A.; Hahn, R.T.; Lerakis, S.; Malaisrie, S.C.; Douglas, P.S.; et al. The incidence and prognostic implications of worsening right ventricular function after surgical or transcatheter aortic valve replacement: Insights from PARTNER IIA. Eur. Heart J. 2018, 39, 2659–2667. [Google Scholar] [CrossRef]
  41. Blackstone, E.H.; Pande, A.; Rajeswaran, J. Commentary: Enhancing risk assessment by incorporating more of what we know. J. Thorac. Cardiovasc. Surg. 2022, 163, 1388–1390.e3. [Google Scholar] [CrossRef]
Figure 1. Flowchart of patients included.
Diagnostics 14 02250 g001
Figure 2. Kaplan–Meier curve of time to all-cause mortality outcome in the proposed stage classification and hazard ratio with confidence interval on the left. Kaplan–Meier curve of time to composite outcome by mortality and readmission in the proposed stage classification and hazard ratio with confidence interval on the right.
Diagnostics 14 02250 g002
Figure 3. ROC curve analysis of the STS, EuroSCORE II and proposed and original scale classification for long-term (left) and short-term (right) follow-up time.
Diagnostics 14 02250 g003
Table 1. Baseline clinical, laboratory, and echocardiographic data and postoperative findings.
VariableStage 1
(N = 235)
Stage 2
(N = 206)
Stage 3
(N = 67)
p
Clinical data
 Age, years62 (55–70)67 (61–72)67 (60–73)<0.001 †‡
 Male sex139 (59.1)110 (53.4)41 (61.2)0.365
 Diabetes Mellitus66 (28.1)77 (37.4)24 (35.8)0.100
 Arterial hypertension155 (66.0)158 (76.7)49 (73.1)0.042 †
 Dyslipidemia151 (64.3)138 (67.0)40 (59.7)0.542
 Chronic kidney disease21 (8.9)20 (9.7)14 (20.9)0.017 ‡¥
 Atrial fibrillation1 (0.4)22 (10.7)17 (25.4)<0.001 †‡¥
 Coronary artery disease 0.346
 One vessel42 (17.9)30 (14.6)12 (17.9)
 Two vessels15 (6.4)24 (11.7)9 (13.4)
 Rheumatic etiology13 (5.5)17 (8.3)5 (7.5)0.158
 Bicuspid etiology37 (15.7)18 (8.7)6 (9.0)0.157
 Diuretic use144 (61.3)161 (78.2)58 (86.6)<0.001 †‡
 ACE-I use61 (26.0)53 (25.7)33 (49.3)<0.001 †‡
 ARB use77 (32.8)78 (37.9)13 (19.4)0.020 ¥
 B-blocker use35 (14.9)55 (26.7)29 (43.3)<0.001 †‡¥
 Statin use153 (65.1)137 (66.5)40 (59.7)0.597
EuroSCOREII, %0.99 (0.80–1.30)1.43 (1.03–1.87)2.75 (1.63–3.81)<0.001 †‡¥
STS score, % 1.54 (1.44–1.64)2.00 (1.85–2.16)2.62 (2.25–2.99)<0.001 †‡¥
Symptoms
 NYHA <0.001
 II129 (54.9)90 (43.7)6 (9.0)‡¥
 III79 (33.6)95 (46.1)48 (71.6)†‡¥
 IV7 (3.0)10 (4.9)13 (19.4)‡¥
Laboratory data
 Glomerular filtration rate, mL/min 2,*72 (62–87)65 (56–80)58 (48–70)<0.001 †‡¥
 Hemoglobin, g/dL 1,*13.3 (12.3–14.5)13.0 (11.7–14.2)13.0 (11.8–14.2)0.033 †
 BNP, pg/mL 96,*79 (35–226)155 (81–331)920 (446–2740)<0.001 †‡¥
Echocardiographic data
 Aortic regurgitation (mild or moderate) 2,*110 (47.0)136 (66.3)58 (86.6)<0.001 †‡
 Left Ventricular Hypertrophy 2,*165 (70.2)191 (92.7)60 (89.6)<0.001 †‡
 Diastolic dysfunction146 (62.1)182 (88.3)43 (64.2)<0.001 †¥
 Ejection fraction < 50%10 (4.3)29 (14.1)41 (61.2)<0.001 †‡¥
 Enlargement left atrium10 (4.3)200 (97.1)67 (100.0)<0.001 †‡
 Mitral regurgitation (moderate/severe)2 (0.9)45 (21.8)32 (47.8)<0.001 †‡¥
 Pulmonary hypertension 107,* 0 (0.0)0 (0.0)34 (50.7)<0.001 ‡¥
 Tricuspid regurgitation moderate/severe1 (0.4)0 (0.0)43 (64.2)<0.001 ‡¥
RV dysfunction (moderate/severe)0 (0.0)0 (0.0)12 (17.9)<0.001 ‡¥
 Mass 2,*, g/m2120 (100–140)130 (114–154)142 (124–179)<0.001 †‡¥
 Mean gradient aortic, mmhg52 (43–63)53 (45–66)50 (40–60)0.023 ¥
 Aortic valvular area 1,*, cm20.75 (0.60–0.85)0.7 (0.6–0.8)0.7 (0.60–0.85)0.202
 Pulmonary systolic pressure, mmhg 107,*30 (26–36)35 (30–42)60 (50–65)<0.001 †‡¥
 Ejection fraction, %63 (60–66)62 (57–66)45 (30–60)<0.001 ‡¥
Postoperative findings
 Postoperative AF44 (18.7)52 (25.2)28 (41.8)0.001 ‡¥
 Long-term all-cause mortality8 (3.4)21 (10.2)27 (40.3)<0.001 †‡¥
 Long-term all-cause mortality and cardiovascular readmissions26 (11.1)65 (31.6)51 (77.3)<0.001 †‡¥
 30-day mortality 1 (0.4)10 (4.9)15 (22.7)<0.001 †‡¥
Values as median (interquartile range) or n (%). NYHA: New York Heart Association. AF: Atrial fibrillation. † Significant difference (p < 0.05) between groups 1 and 2. ‡ Significant difference (p < 0.05) between groups 1 and 3. ¥ Significant difference (p < 0.05) between groups 2 and 3. * Number of missing data for each variable; if it does not have the symbol * then no values are missing.
Table 2. Univariable and multivariable analysis of all-cause mortality.
VariableUnivariable AnalysisMultivariable Analysis
HR (CI 95%)pHR (CI 95%)p
Proposed stage classification4.07 (2.77–5.97)<0.0013.22 (1.44–7.20)0.004
Mean transaortic gradient, mmHg0.97 (0.95–0.98)0.0030.96 (0.92–0.99)0.021
Glomerular filtration rate, mL/min0.96 (0.95–0.97)<0.0010.99 (0.96–1.01)0.431
BNP, pg/mL1.000 (1.000–1.001)0.0011.000 (1.000–1.001)0.172
Age, years1.04 (1.01–1.07)0.0031.03 (0.98–1.09)0.168
NYHA stages2.72 (1.83–4.05)<0.0010.86 (0.40–1.82)0.701
Table 3. Univariable and multivariable analysis of 30-day mortality analysis of original and proposed classification.
Univariable AnalysisMultivariable Analysis
Original Classification
VariablesHRCI, 95%pVariablesHRCI, 95%p
Proposed staged classification5.6553.03410.539<0.001BNP1.0001.0001.0000.629
EuroSCORE II1.0040.6771.4900.983
Original classification3.2472.1654.870<0.001STS score0.9530.6021.5090.839
Creatinine clearance0.9850.9491.0220.431
BNP1.0001.0001.0010.004Original classification2.6321.2115.7170.015
NYHA stages0.5510.1781.7050.301
EuroSCORE II1.2781.1271.450<0.001Proposed staged classification
BNP1.0001.0001.0010.533
STS score1.2741.0061.6130.045EuroSCORE II1.0190.6781.5310.929
STS score0.9010.5581.4560.671
Creatinine clearance0.9650.9450.9850.001Creatinine clearance0.9860.9501.0240.470
NYHA stages0.4740.1501.4930.202
NYHA stages2.6381.5014.6370.001Proposed classification5.0191.59615.7840.006
Disclaimer/Publisher’s Note: The statements, opinions and data contained in all publications are solely those of the individual author(s) and contributor(s) and not of MDPI and/or the editor(s). MDPI and/or the editor(s) disclaim responsibility for any injury to people or property resulting from any ideas, methods, instructions or products referred to in the content.

