

Artificial Intelligence Unveils the Unseen: Mapping Novel Lung Patterns in Bronchiectasis via Texture Analysis

 , , , , , , , ,
Abstract
1. Introduction
2. Materials and Methods
2.1. Patients Selection
2.2. CT Scoring
2.3. CT Scan Technique and Image Analysis
2.4. Definitions
2.5. Data Analysis
3. Results
4. Discussion
Author Contributions
Funding
Institutional Review Board Statement
Informed Consent Statement
Data Availability Statement
Acknowledgments
Conflicts of Interest
References
- Contarini, M.; Finch, S.; Chalmers, J.D. Bronchiectasis: A case-based approach to investigation and management. Eur. Respir. Rev. 2018, 27, 180016. [Google Scholar] [CrossRef] [PubMed]
- Ringshausen, F.C.; de Roux, A.; Diel, R.; Hohmann, D.; Welte, T.; Rademacher, J. Bronchiectasis in Germany:A population-based estimation of disease prevalence. Eur. Respir. J. 2015, 46, 1805–1807. [Google Scholar] [CrossRef] [PubMed]
- Monteagudo, M.; Rodríguez-Blanco, T.; Barrecheguren, M.; Simonet, P.; Miravitlles, M. Prevalence and incidence of bronchiectasis in Catalonia, Spain: A population-based study. Respir. Med. 2016, 121, 26–31. [Google Scholar] [CrossRef]
- Quint, J.K.; Millett, E.R.; Joshi, M.; Navaratnam, V.; Thomas, S.L.; Hurst, J.R.; Smeeth, L.; Brown, J.S. Changes in the incidence, prevalence and mortality of bronchiectasis in the UK from 2004 to 2013:A population-based cohort study. Eur. Respir. J. 2016, 47, 186–193. [Google Scholar] [CrossRef] [PubMed]
- Weycker, D.; Hansen, G.L.; Seifer, F.D. Prevalence and incidence of noncystic fibrosis bronchiectasis among US adults in 2013. Chron. Respir. Dis. 2017, 14, 377–384. [Google Scholar] [CrossRef]
- Lin, J.L.; Xu, J.F.; Qu, J.M. Bronchiectasis in China. Ann. Am. Thorac. Soc. 2016, 13, 609–616. [Google Scholar] [CrossRef] [PubMed]
- Hariprasad, K.; Krishnan, S.; Mehta, R.M. Bronchiectasis in India: Results from the EMBARC and Respiratory Research Network of India Registry. Natl. Med. J. India 2020, 33, 99–101. [Google Scholar] [CrossRef] [PubMed]
- Whitwell, F. A Study of the Pathology and Pathogenesis of Bronchiectasis. Thorax 1952, 7, 213–239. [Google Scholar] [CrossRef]
- Shteinberg, M.; Flume, P.A.; Chalmers, J.D. Is bronchiectasis really a disease? Eur. Respir. Rev. 2020, 29, 190051. [Google Scholar] [CrossRef]
- Tolouee, A.; Abrishami-Moghaddam, H.; Garnavi, R.; Forouzanfar, M.; Giti, M. Texture Analysis in lung HRCT images. In Proceedings of the Digital Image Computing: Techniques and Applications [DICTA2008], Canberra, Australia, 1–3 December 2008; pp. 305–311. [Google Scholar]
- Alzeer, A.H. HRCT score in bronchiectasis: Correlation with pulmonary function tests and pulmonary artery pressure. Ann. Thorac. Med. 2008, 3, 82–86. [Google Scholar] [CrossRef]
- Kang, E.Y.; Miller, R.R.; Müller, N.L. Bronchiectasis: Comparison of preoperative thin-section CT and pathologic findings in resected specimens. Radiology 1995, 195, 649–654. [Google Scholar] [CrossRef]
- Edwards, E.; Narang, I.; Li, A.; Hansell, D.; Rosenthal, M.; Bush, A. HRCT lung abnormalities are not a surrogate for exercise limitation in bronchiectasis. Eur. Respir. J. 2004, 24, 538–544. [Google Scholar] [CrossRef]
- Eshed, I.; Minski, I.; Katz, R.; Jones, P.W.; Priel, I.E. Bronchiectasis: Correlation of high-resolution CT findings with health-related quality of life. Clin. Radiol. 2007, 62, 152–159. [Google Scholar] [CrossRef] [PubMed]
- García, M.M.; Tordera, M.P.; Sánchez, P.R.; Cataluña, S. Internal consistency and validity of the Spanish version of the St George’s respiratory questionnaire for use in patients with clinically stable bronchiectasis. Arch. Bronconeumol. 2005, 41, 110–117. [Google Scholar] [CrossRef] [PubMed]
- Tiddens, H.A.; Meerburg, J.J.; Van Der Eerden, M.M.; Ciet, P. The radiological diagnosis of bronchiectasis: What’s in a name? Eur. Respir. Rev. 2020, 29, 190120. [Google Scholar] [CrossRef] [PubMed]
- Bedi, P.; Chalmers, J.D.; Goeminne, P.C.; Mai, C.; Saravanamuthu, P.; Velu, P.P.; Cartlidge, M.K.; Loebinger, M.R.; Jacob, J.; Kamal, F.; et al. The BRICS [Bronchiectasis Radiologically Indexed CT Score]. Chest J. 2018, 153, 1177–1186. [Google Scholar] [CrossRef]
- Bartholmai, B.J.; Raghunath, S.; Karwoski, R.A.; Moua, T.; Rajagopalan, S.; Maldonado, F.; Decker, P.A.; Robb, R.A. Quantitative computed tomography imaging of interstitial lung diseases. J. Thorac. Imaging 2013, 28, 298–307. [Google Scholar] [CrossRef] [PubMed] [PubMed Central]
- Maldonado, F.; Moua, T.; Rajagopalan, S.; Karwoski, R.A.; Raghunath, S.; Decker, P.A.; Hartman, T.E.; Bartholmai, B.J.; Robb, R.A.; Ryu, J.H. Automated quantification of radiological patterns predicts survival in idiopathic pulmonary fibrosis. Eur. Respir. J. 2014, 43, 204–212. [Google Scholar] [CrossRef] [PubMed]
- Occhipinti, M.; Bosello, S.; Sisti, L.G.; Cicchetti, G.; De Waure, C.; Pirronti, T.; Ferraccioli, G.; Gremese, E.; Larici, A.R. Quantitative and semi-quantitative computed tomography analysis of interstitial lung disease associated with systemic sclerosis: A longitudinal evaluation of pulmonary parenchyma and vessels. PLoS ONE 2019, 14, e0213444. [Google Scholar] [CrossRef] [PubMed]
- John, J.; Clark, A.R.; Kumar, H.; Vandal, A.C.; Burrowes, K.S.; Wilsher, M.L.; Milne, D.G.; Bartholmai, B.; Levin, D.L.; Karwoski, R.; et al. Pulmonary vessel volume in idiopathic pulmonary fibrosis compared with healthy controls aged > 50 years. Sci. Rep. 2023, 13, 4422. [Google Scholar] [CrossRef]
- Alkhanfar, D.; Shahin, Y.; Alandejani, F.; Dwivedi, K.; Alabed, S.; Johns, C.; Lawrie, A.; Thompson, A.R.; Rothman, A.M.; Tschirren, J.; et al. Severe pulmonary hypertension associated with lung disease is characterised by a loss of small pulmonary vessels on quantitative computed tomography. ERJ Open Res. 2022, 8, 00503–02021. [Google Scholar] [CrossRef]
- King, P.T. The pathophysiology of bronchiectasis. Int. J. Chron. Obs. Pulmon Dis. 2009, 4, 411–419. [Google Scholar] [CrossRef] [PubMed] [PubMed Central]
- Subramanian, D.R.; Gupta, S.; Burggraf, D.; Vom Silberberg, S.J.; Heimbeck, I.; Heiss-Neumann, M.S.; Haeussinger, K.; Newby, C.; Hargadon, B.; Raj, V.; et al. Emphysema- and airway-dominant COPD phenotypes defined by standardised quantitative computed tomography. Eur. Respir. J. 2016, 48, 92–103. [Google Scholar] [CrossRef] [PubMed]
- Amariei, D.E.; Dodia, N.; Deepak, J.; Hines, S.E.; Galvin, J.R.; Atamas, S.P.; Todd, N.W. Combined Pulmonary Fibrosis and Emphysema: Pulmonary Function Testing and a Pathophysiology Perspective. Medicina 2019, 55, 580. [Google Scholar] [CrossRef]
- Cottin, V.; Nunes, H.; Brillet, P.-Y.; Delaval, P.; Devouassoux, G.; Tillie-Leblond, I.; Israel-Biet, D.; Court-Fortune, I.; Valeyre, D.; Cordier, J.-F. Combined pulmonary fibrosis and emphysema: A distinct underrecognised entity. Eur. Respir. J. 2005, 26, 586–593. [Google Scholar] [CrossRef] [PubMed]
- Fernandes, L.; Fernandes, Y.; Mesquita, A. Quantitative computed tomography imaging in chronic obstructive pulmonary disease. Lung India 2016, 33, 646. [Google Scholar] [CrossRef]
- Zhang, H.; Li, X.; Zhang, X.; Yuan, Y.; Zhao, C.; Zhang, J. Quantitative CT analysis of idiopathic pulmonary fibrosis and correlation with lung function study. BMC Pulm. Med. 2024, 24, 437. [Google Scholar] [CrossRef]
- Cherian, S.V.; Girvin, F.; Naidich, D.P.; Machnicki, S.; Brown, K.K.; Ryu, J.H.; Gupta, N.; Mehta, V.; Estrada-Y-Martin, R.M.; Narasimhan, M.; et al. Lung Hyperlucency: A Clinical-Radiologic Algorithmic Approach to Diagnosis. Chest 2020, 157, 119–141. [Google Scholar] [CrossRef] [PubMed]
- Loubeyre, P.; Paret, M.; Revel, D.; Wiesendanger, T.; Brune, J. Thin-Section CT Detection of Emphysema Associated With Bronchiectasis and Correlation With Pulmonary Function Tests. Chest 1996, 109, 360–365. [Google Scholar] [CrossRef] [PubMed]
- Bhalla, M.; Turcios, N.; Aponte, V.; Jenkins, M.; Leitman, B.S.; McCauley, D.I.; Naidich, D.P. Cystic fibrosis: Scoring system with thin-section CT. Radiology 1991, 179, 783–788. [Google Scholar] [CrossRef] [PubMed]
- Klein, J.S.; Gamsu, G.; Webb, W.R.; Golden, J.A.; Müller, N.L. High-resolution CT diagnosis of emphysema in symptomatic patients with normal chest radiographs and isolated low diffusing capacity. Radiology 1992, 182, 817–821. [Google Scholar] [CrossRef] [PubMed]
- Reid, L.M. Reduction in bronchial subdivision in bronchiectasis. Thorax 1950, 5, 233–247. [Google Scholar] [CrossRef]
- Willems, L.N.; Kramps, J.A.; Stijnen, T.; Sterk, P.J.; Weening, J.J.; Dijkman, J.H. Relation between small airways disease and parenchymal destruction in surgical lung specimens. Thorax 1990, 45, 89–94. [Google Scholar] [CrossRef] [PubMed]
- Wiggs, B.R.; Bosken, C.; Paré, P.D.; James, A.; Hogg, J.C. A model of airway narrowing in asthma and in chronic obstructive pulmonary disease. Am. Rev. Respir. Dis. 1992, 145, 1251–1258. [Google Scholar] [CrossRef] [PubMed]
- Jeffery, P.K. Morphology of the airway wall in asthma and in chronic obstructive pulmonary disease. Am. Rev. Respir. Dis. 1991, 143, 1152–1158. [Google Scholar] [CrossRef] [PubMed]
- Engeler, C.E.; Tashjian, J.H.; Trenkner, S.W.; Walsh, J.W. Ground-Glass Opacity of the Lung Parenchyma: A Guide to Analysis with High-Resolution CT. AJR 1993, 160, 249–251. [Google Scholar] [CrossRef]
- Elicker, B.; De Castro Pereira, C.A.; Webb, R.; Leslie, K.O. High-resolution computed tomography patterns of diffuse interstitial lung disease with clinical and pathological correlation. J. Bras. Pneumol. 2008, 34, 715–744. [Google Scholar] [CrossRef] [PubMed]
- Johkoh, T.; Sakai, F.; Noma, S.; Akira, M.; Fujimoto, K.; Watadani, T.; Sugiyama, Y. Honeycombing on CT; its definition, pathologic correlation, and future direction of its diagnosis. Eur. J. Radiol. 2014, 83, 27–31. [Google Scholar] [CrossRef]
- Chotirmall, S.H.; Chalmers, J.D. The Precision Medicine Era of Bronchiectasis. Am. J. Respir. Crit. Care Med. 2024, 210, 24–34. [Google Scholar] [CrossRef]
- Díaz, A.A.; Nardelli, P.; Wang, W.; Estépar, R.S.J.; Yen, A.; Kligerman, S.; Maselli, D.J.; Dolliver, W.R.; Tsao, A.; Orejas, J.L.; et al. Artificial Intelligence–based CT Assessment of Bronchiectasis: The COPDGene Study. Radiology 2023, 307, e221109. [Google Scholar] [CrossRef] [PubMed]
- Amisha; Malik, P.; Pathania, M.; Rathaur, V.K. Overview of artificial intelligence in medicine. J. Fam. Med. Prim. Care 2019, 8, 2328. [Google Scholar] [CrossRef]
- Park, J.; Kim, S.; Lee, Y.J.; Park, J.S.; Cho, Y.; Yoon, H.I.; Lee, K.; Lee, C.; Lee, J.H. Factors associated with radiologic progression of non-cystic fibrosis bronchiectasis during long-term follow-up. Respirology 2016, 21, 1049–1054. [Google Scholar] [CrossRef] [PubMed]
- Gramegna, A.; Amati, F.; Terranova, L.; Sotgiu, G.; Tarsia, P.; Miglietta, D.; Calderazzo, M.A.; Aliberti, S.; Blasi, F. Neutrophil elastase in bronchiectasis. Respir. Res. 2017, 18, 211. [Google Scholar] [CrossRef] [PubMed]
- Willis, B.C.; Borok, Z. TGF-β-induced EMT: Mechanisms and implications for fibrotic lung disease. Am. J. Physiol. -Lung Cell. Mol. Physiol. 2007, 293, L525–L534. [Google Scholar] [CrossRef]

| Socio-Demographic Profile | Number [%] | |
|---|---|---|
| Age [in years] | ≤40 | 4 [8.9%] |
| 40–60 | 19 [42.2%] | |
| ≥60 | 22 [48.9%] | |
| Gender | Male | 23 [51.1%] |
| Female | 22 [48.9%] | |
| BMI [kg/m2] [As per WHO] | Underweight | 6 [13.3%] |
| Normal | 11 [24.4%] | |
| Overweight | 9 [20.0%] | |
| Obese | 19 [42.2%] | |
| Comorbidities | Hypertension [ICD I10] | 11 [24.4%] |
| Type 2 DM [ICD E11.9] | 14 [31.1%] | |
| Hypertension and Type 2 DM | 5 [11.1%] | |
| Congestive Cardiac Failure [ICD I50] | 1 [2.2%] | |
| Hypothyroid [ICD E03.9] | 2 [4.4%] | |
| Ischemic Heart Disease [ICD I25] | 3 [6.6%] | |
| No Comorbidities | 9 [20%] | |
| Severity of Bronchiectasis based on Bronchiectasis Radiologically Indexed CT Score [BRICS] | Mild | 4 [8.9%] |
| Moderate | 14 [31.1%] | |
| Severe | 11 [24.4%] | |
| Tractional | 16 [35.6%] | |
| Smoking Status | Smoker | 14 [31.1%] |
| Non-smoker | 31 [68.9%] | |
| Symptoms | Cough | 29 [64.4%] |
| Fever | 16 [35.5%] | |
| Shortness of Breath | 22 [48.8%] | |
| Hemoptysis | 2 [4.44%] | |
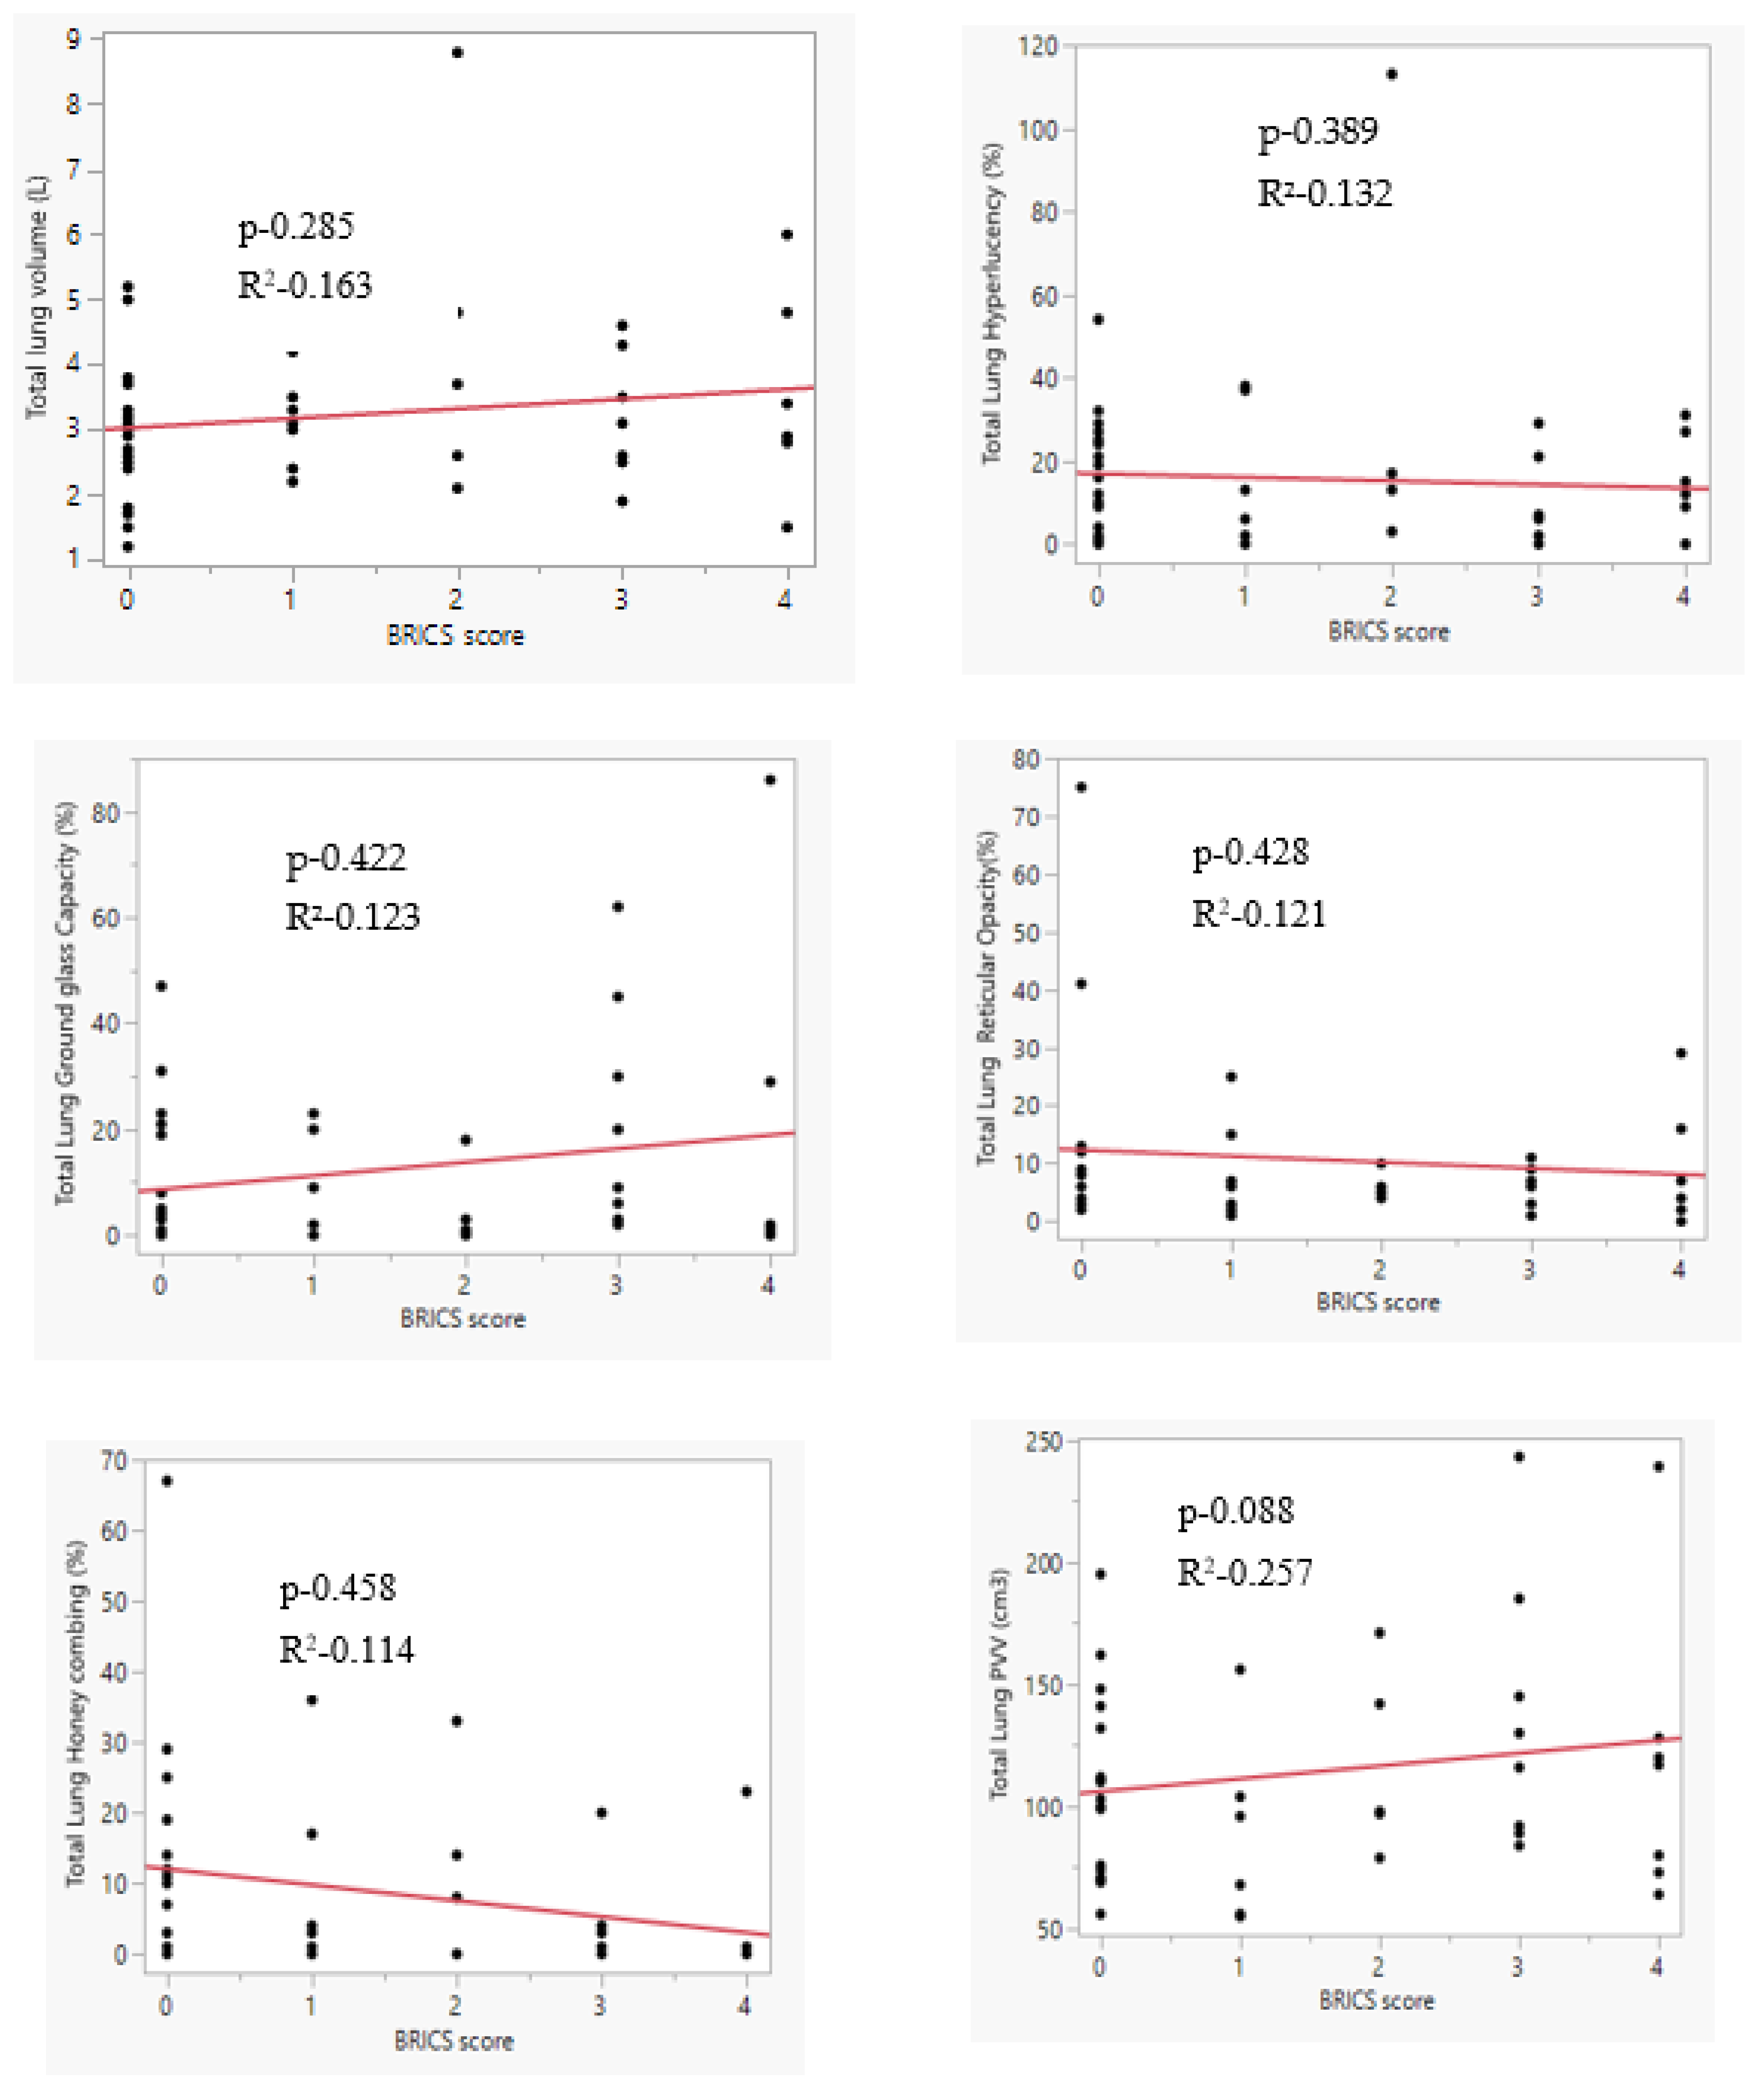
| Severity | Mean ± Std. Deviation | Std. Error | 95% Confidence Interval for Mean | p-Value | |
|---|---|---|---|---|---|
| Total Lung Volume [L] | Mild | 2.950 ± 1.0214 | 0.5107 | 1.325–4.575 | 0.038 |
| Moderate | 3.200 ± 0.8806 | 0.2353 | 2.692–3.708 | ||
| Severe | 3.845 ± 2.0863 | 0.6290 | 2.444–5.247 | ||
| Tractional | 2.969 ± 1.0562 | 0.2641 | 2.406–3.532 | ||
| Total Lung Hyperlucency [%] | Mild | 8.50 ± 15.695 | 7.848 | −16.47–33.47 | 0.025 |
| Moderate | 9.79 ± 11.696 | 3.126 | 3.03–16.54 | ||
| Severe | 24.64 ± 31.646 | 9.542 | 3.38–45.90 | ||
| Tractional | 16.19 ± 13.949 | 3.487 | 8.75–23.62 | ||
| Total Lung Ground-glass Opacity [%] | Mild | 22.50 ± 19.261 | 9.631 | −8.15–53.15 | 0.477 |
| Moderate | 14.93 ± 18.805 | 5.026 | 4.07–25.79 | ||
| Severe | 16.27 ± 14.158 | 7.887 | 10.692–24.85 | ||
| Tractional | 7.63 ± 9.966 | 2.491 | 2.31–12.94 | ||
| Total Lung Reticular Opacity [%] | Mild | 4.75 ± 2.754 | 1.377 | 0.37–9.13 | 0.05 |
| Moderate | 7.21 ± 6.302 | 1.684 | 3.58–10.85 | ||
| Severe | 17.45 ± 15.885 | 5.393 | 5.585–25.47 | ||
| Tractional | 17.38 ± 15.850 | 4.712 | 4.04–23.42 | ||
| Total Lung Honeycombing [%] | Mild | 2.75 ± 5.500 | 2.750 | −6.00–11.50 | 0.328 |
| Moderate | 9.86 ± 4.646 | 2.578 | 5.784–10.43 | ||
| Severe | 12.18 ± 9.040 | 3.630 | 8.23–17.27 | ||
| Tractional | 12.88 ± 17.366 | 4.342 | 3.62–22.13 | ||
| Total Lung PVV [cm3] | Mild | 95.00 ± 44.803 | 22.402 | 23.71–166.29 | 0.04 |
| Moderate | 117.50 ± 49.640 | 13.267 | 88.84–146.16 | ||
| Severe | 122.82 ± 53.961 | 16.270 | 86.57–159.07 | ||
| Tractional | 110.00 ± 37.932 | 9.483 | 89.79–130.21 | ||
| Type of Bronchiectasis | Mean ± Std. Deviation | Std. Error | 95% Confidence Interval for Mean | p-Value | ||
|---|---|---|---|---|---|---|
| Total Lung Volume [L] | Saccular | 8 | 2.963 ± 1.0501 | 0.3713 | 2.085–3.840 | 0.641 |
| Cystic | 11 | 3.555 ± 1.8976 | 0.5721 | 2.280–4.829 | ||
| Tubular | 4 | 3.875 ± 0.8098 | 0.4049 | 2.586–5.164 | ||
| Varicoid | 6 | 3.433 ± 1.5423 | 0.6296 | 1.815–5.052 | ||
| Tractional | 16 | 2.969 ± 1.0562 | 0.2641 | 2.406–3.532 | ||
| Total Lung Hyperlucency [%] | Saccular | 8 | 6.625 ± 9.6501 | 3.4118 | −1.443–14.693 | 0.446 |
| Cystic | 11 | 21.455 ± 32.2222 | 9.7154 | −0.193–43.102 | ||
| Tubular | 4 | 23.500 ± 17.2916 | 8.6458 | −4.015–51.015 | ||
| Varicoid | 6 | 9.833 ± 11.8561 | 4.8402 | −2.609–22.276 | ||
| Tractional | 16 | 16.188 ± 13.9486 | 3.4871 | 8.755–23.620 | ||
| Total Lung Ground-glass Opacity [%] | Saccular | 8 | 26.875 ± 31.1698 | 11.0202 | 0.816–52.934 | 0.106 |
| Cystic | 11 | 13.727 ± 15.4861 | 4.6692 | 3.324–24.131 | ||
| Tubular | 4 | 1.500 ± 3.0000 | 1.5000 | −3.274–6.274 | ||
| Varicoid | 6 | 12.167 ± 18.2254 | 7.4405 | −6.960–31.293 | ||
| Tractional | 16 | 7.625 ± 9.9658 | 2.4914 | 2.315–12.935 | ||
| Total Lung Reticular Opacity [%] | Saccular | 8 | 8.625 ± 8.8307 | 3.1221 | 1.242–16.008 | 0.671 |
| Cystic | 11 | 13.273 ± 17.2921 | 5.2138 | 1.656–24.890 | ||
| Tubular | 4 | 3.500 ± 2.6458 | 1.3229 | −0.710–7.710 | ||
| Varicoid | 6 | 6.500 ± 5.5767 | 2.2767 | 0.648–12.352 | ||
| Tractional | 16 | 13.375 ± 18.8498 | 4.7125 | 3.331–23.419 | ||
| Total Lung Honeycombing [%] | Saccular | 8 | 2.875 ± 8.1317 | 2.8750 | −3.923–9.673 | 0.398 |
| Cystic | 11 | 6.091 ± 6.4568 | 1.9468 | 1.753–10.429 | ||
| Tubular | 4 | 13.250 ± 15.1079 | 7.5540 | −10.790–37.290 | ||
| Varicoid | 6 | 6.167 ± 14.6208 | 5.9689 | −9.177–21.510 | ||
| Tractional | 16 | 12.875 ± 17.3662 | 4.3415 | 3.621–22.129 | ||
| Total Lung PVV [cm3] | Saccular | 8 | 104.250 ± 35.1110 | 12.4136 | 74.896–133.604 | 0.561 |
| Cystic | 11 | 134.545 ± 59.5472 | 17.9542 | 94.541–174.550 | ||
| Tubular | 4 | 101.500 ± 58.2666 | 29.1333 | 8.785–194.215 | ||
| Varicoid | 6 | 109.333 ± 42.9216 | 17.5227 | 64.290–154.377 | ||
| Tractional | 16 | 110.000 ± 37.9315 | 9.4829 | 89.788–130.212 | ||
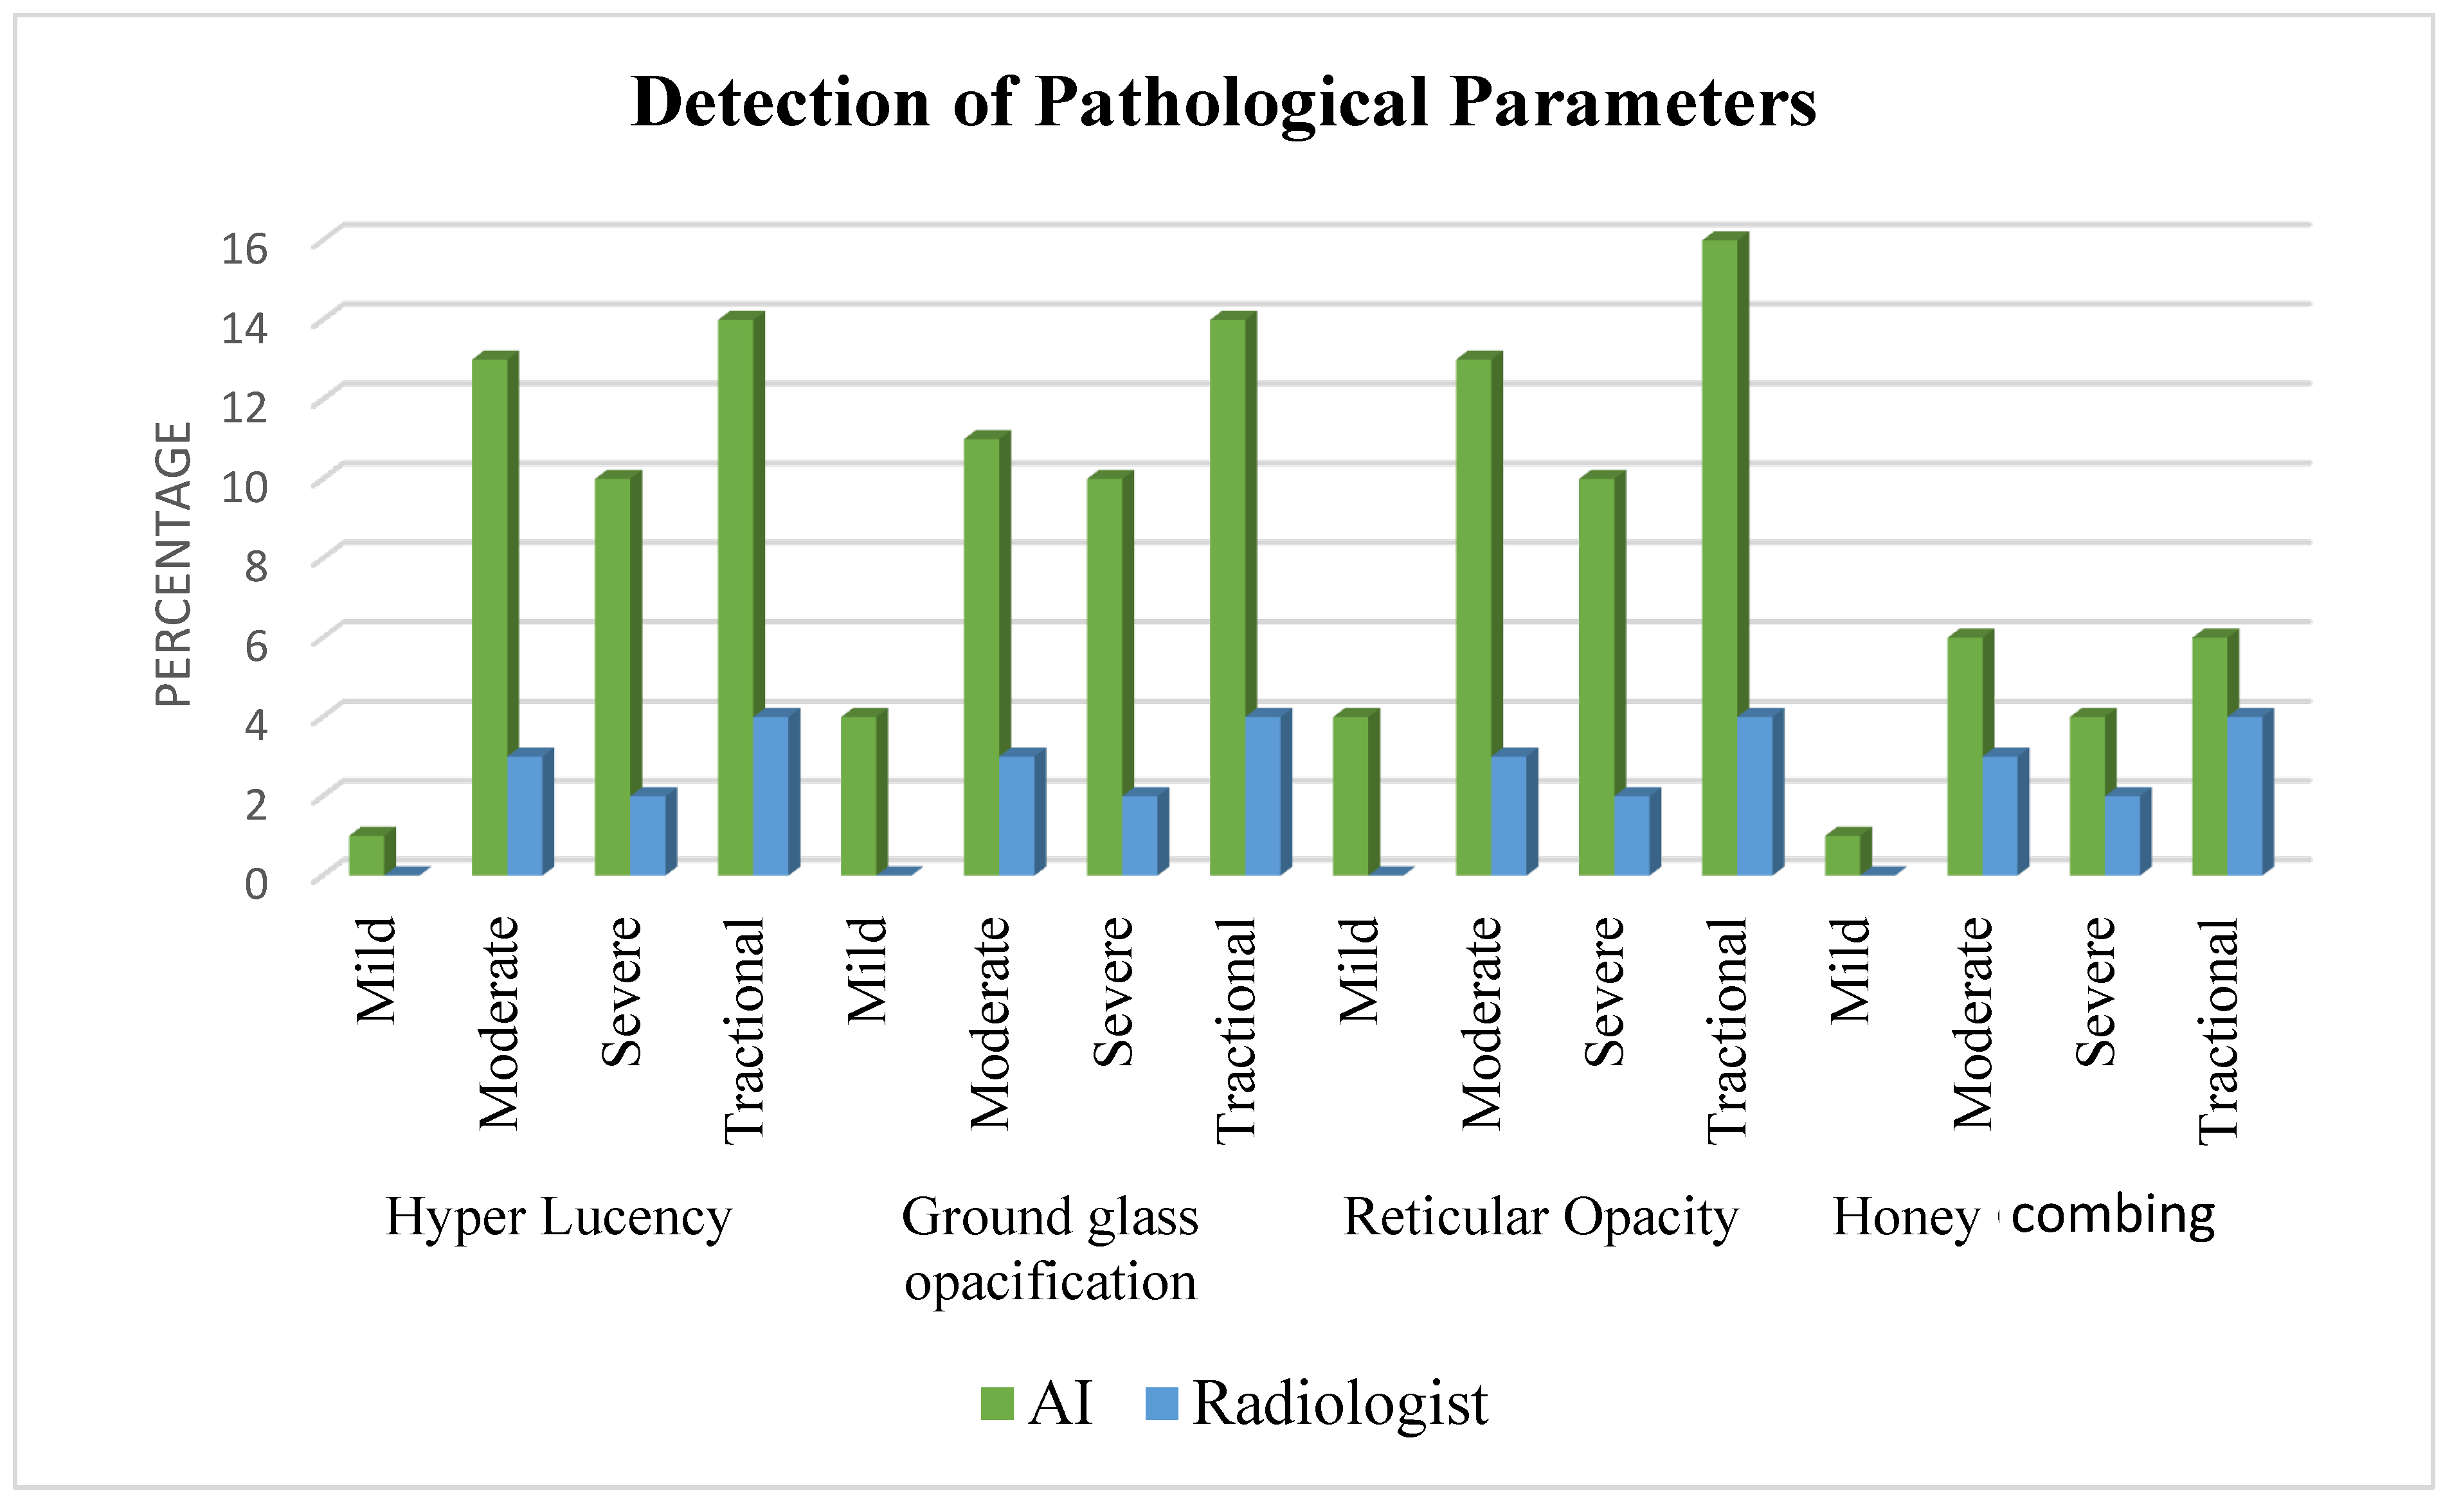
| Radiology | AI | |||
|---|---|---|---|---|
| Detected | Not Detected | Detected | Not Detected | |
| Total Lung Hyperlucency | 11 [24.4%] | 34 [75.6%] | 40 [88.9%] | 5 [11.1%] |
| Total Ground Glass | 12 [26.7%] | 33 [73.3%] | 37 [82.2%] | 8 [17.8%] |
| Total Reticular Opacity | 3 [6.7%] | 43 [93.3%] | 25 [55.6%] | 20 [44.4%] |
| Total Honeycombing | 6 [13.3%] | 39 [86.7%] | 27 [60%] | 18 [40%] |
Disclaimer/Publisher’s Note: The statements, opinions and data contained in all publications are solely those of the individual author(s) and contributor(s) and not of MDPI and/or the editor(s). MDPI and/or the editor(s) disclaim responsibility for any injury to people or property resulting from any ideas, methods, instructions or products referred to in the content. |
© 2024 by the authors. Licensee MDPI, Basel, Switzerland. This article is an open access article distributed under the terms and conditions of the Creative Commons Attribution (CC BY) license (https://creativecommons.org/licenses/by/4.0/).
Share and Cite
Nair, A.; Mohan, R.; Greeshma, M.V.; Benny, D.; Patil, V.; Madhunapantula, S.V.; Jayaraj, B.S.; Chaya, S.K.; Khan, S.A.; Lokesh, K.S.; et al. Artificial Intelligence Unveils the Unseen: Mapping Novel Lung Patterns in Bronchiectasis via Texture Analysis. Diagnostics 2024, 14, 2883. https://doi.org/10.3390/diagnostics14242883
Nair A, Mohan R, Greeshma MV, Benny D, Patil V, Madhunapantula SV, Jayaraj BS, Chaya SK, Khan SA, Lokesh KS, et al. Artificial Intelligence Unveils the Unseen: Mapping Novel Lung Patterns in Bronchiectasis via Texture Analysis. Diagnostics. 2024; 14(24):2883. https://doi.org/10.3390/diagnostics14242883
Chicago/Turabian StyleNair, Athira, Rakesh Mohan, Mandya Venkateshmurthy Greeshma, Deepak Benny, Vikram Patil, SubbaRao V. Madhunapantula, Biligere Siddaiah Jayaraj, Sindaghatta Krishnarao Chaya, Suhail Azam Khan, Komarla Sundararaja Lokesh, and et al. 2024. "Artificial Intelligence Unveils the Unseen: Mapping Novel Lung Patterns in Bronchiectasis via Texture Analysis" Diagnostics 14, no. 24: 2883. https://doi.org/10.3390/diagnostics14242883
APA StyleNair, A., Mohan, R., Greeshma, M. V., Benny, D., Patil, V., Madhunapantula, S. V., Jayaraj, B. S., Chaya, S. K., Khan, S. A., Lokesh, K. S., Laila, M. M. A., Vijayalakshmi, V., Karunakaran, S., Sathish, S., & Mahesh, P. A. (2024). Artificial Intelligence Unveils the Unseen: Mapping Novel Lung Patterns in Bronchiectasis via Texture Analysis. Diagnostics, 14(24), 2883. https://doi.org/10.3390/diagnostics14242883